DOI:
10.1039/D5RA05742F
(Paper)
RSC Adv., 2025,
15, 44992-45013
Enhancement of catalytic activity using CoFeLDH for the formation of biologically active diaryl sulfide and propargylamine derivatives: molecular docking, DFT, dynamics, and ADMET analyses of their biocidal and anti-diabetic activities
Received
6th August 2025
, Accepted 25th September 2025
First published on 18th November 2025
Abstract
Synthetic clays known as layered double hydroxides (LDHs) have gained attention owing to their diverse range of applications in various fields. LDHs consist of cationic layers that contain anions in the hydrated interlayer to balance the charge. Our synthetic approach has shown that CoFeLDH is a promising reusable catalyst for C–S cross-coupling and A3 coupling reactions. The synthesized compounds were investigated for antimicrobial activities against two Gram-positive bacteria (Staphylococcus aureus and Bacillus cereus) and two Gram-negative bacteria (Escherichia coli and Klebsiella pneumonia), and we obtained ethical results. To better understand the observed activities, molecular docking studies were performed to explore new anti-diabetic compounds with different molecular structures. Density functional theory (DFT) was also used to investigate the chemical reactivity and kinetic stability of the compounds 3a–h and 4a–e. The observed binding energies for all molecules were between −6.0 and −8.3 kcal mol−1, indicating strong interactions. We conducted DPPH assays for in vitro antioxidant measurements: sample 1 (compound 4a, 340.98 ± 16.31 µg mL−1) showed a more potent radical scavenging activity than sample 3 (compound 3g, 122.10 ± 7.15 µg mL−1) and ascorbic acid (90.01 ± 3.62 µg mL−1). The α-amylase inhibitory assays were also carried out for the compounds 3g and 4a. Both sample 1 (compound 4a, 54.89 ± 5.05 µg mL−1) and sample 3 (compound 3g, 58.95 ± 4.581 µg mL−1) showed significant (p < 0.05) α-amylase inhibitory activity as compared to acarbose (143.62 ± 16.31 µg mL−1), an antidiabetic drug. Further, we carried out an in vivo antidiabetic assay in rats for compound 4a. The α-amylase inhibition activity of compound 4a (SR) showed an IC50 value of 112.98 µg mL−1, while standard acarbose showed an IC50 value of 63.76 µg mL−1. Similarly, the α-glucosidase inhibition activity revealed that the SR showed an IC50 value of 111.42 µg mL−1, while the standard acarbose showed an IC50 value of 78.53 µg mL−1, which signifies a reduced diabetic risk in rats.
Introduction
Organosulfur compounds are well known as a set of prime compounds due to their prospective biotic activity, pharmaceutical significance, and synthetic utility. Among them, diaryl sulfide is considered the principal structure in many pharmaceutically active compounds, natural products, and synthetic organic semiconductors and a forerunner to other sulfur-containing compounds of higher oxidation state with important bioactivities. Diaryl sulfide derivatives serve as key scaffolds in medicinal chemistry, giving rise to some therapeutic agents: axitinib and thymitaq (anticancer),1–3 anti-malaria,4 antitubercular pro-drug,5 anti-brest cancer agent,6 and vortioxetane7 (used to treat depressive disorder) specific class of investigation have been fascinated by synthesizing these compounds, demonstrating the importance of this brand of compounds. As a powerful method, the synthesis of diaryl sulfide derivatives is noteworthy, and it has been subjected to extensive research. Because of the wide-ranging bioactivities of this diaryl sulfide skeleton, few synthetic plans of action have been reported.8–18 However, most of these strategies suffer from multiple disadvantages such as the use of expensive catalysts, ecologically unsafe reagents, long duration of reactions, high reaction temperatures, and low yield of products.9,11,15 To overcome these limitations, well-known one-pot reactions are desirable, which are energy-efficient processes that eliminate the multiple steps and improve the productivity with a high level of systemic assortment. We applied CoFeLDH as a catalyst19 for the one-pot synthesis of diaryl sulfide derivatives from thiophenol and aryl iodide compounds.
Over the last few decades, multi-component coupling reactions of aldehydes, secondary amines, and terminal alkynes (A3 coupling) for the synthesis of propargylamine derivatives had gained considerable popularity because of their well-timed proposition, offering a straightforward route to generate complexity and diversity in a single operation, which is a well-established route to propargylamines. Propargylamine derivatives are immeasurable intermediates for the preparation of nitrogen-containing bioactive molecules. The derivatives of propargylamine have a wide range of medicinal applications. For example, rasagiline20 has neuroprotective effects and tacrine-propargylamine derivatives act as anti-AD agents,21,22 enzyme inhibitors,23 antitumor antibiotics,24 herbicides,25 and pharmaceutical agents.26 Propargylamine derivatives are inestimable intermediates used for the preparation of bioactive nitrogen-containing molecules such as β-lactams, oxotremorine analogs, conformationally restricted peptides, isoesters, and therapeutic drug molecules. Thus, the enlargement of up-to-date synthetic techniques for propargylamines has encountered sizeable attention from synthetic and medicinal chemists. In recent years, various methods27–42 have been developed for the synthesis of these compounds. However, most of them suffer from several disadvantages including costly metal catalysts,27,29 low thermal stability, separation problems, significant leaching after several cycles of the reaction, and the use of toxic solvents in most cases. A close observation of the results indicated a direct need for a cleaner approach to enrich the scope and applicability of such a reaction (A3-coupling) in the present context of established reasonable protocols. Therefore, the development of suitable catalysts, solvents, reaction temperature, and reaction hours would certainly make the protocol much more applicable as a clean method for the synthesis of the versatile biological precursor propargylamine than the existing methods, rendering high stability and, most importantly, recyclability to heterogeneous catalysts. In this regard, protocols comprising CoFeLDH catalysts19 employing A3 coupling reactions, are certainly worth mentioning. With these views in mind, we synthesized a very specific CoFeLDH and applied it to establish an efficient multicomponent A3-coupling reaction for the synthesis of propargylamine. We investigated the anti-microbial activities against two Gram-positive (Staphylococcus aureus and Bacillus cereus) and two Gram-negative (Escherichia coli and Klebsiella pneumonia) bacteria. The synthesized compounds 3a–h and 4a–e were found to be more effective in inhibiting the growth of both Gram-positive and Gram-negative bacteria than others.
To elucidate the bioactivity profile of novel anti-diabetic candidates with diverse molecular architectures, we first performed molecular docking studies.43,48 Density functional theory49 (DFT) calculations were then employed to assess the chemical reactivity and kinetic stability of compounds 3a–h and 4a–e. The in vitro antioxidant potential of compounds 3g and 4a was evaluated via the DPPH assay. To further confirm their anti-diabetic activity, α-amylase inhibitory and α-glucosidase assays were conducted on 3g and 4a. Finally, compound 4a underwent an in vivo antidiabetic evaluation in a rat model.44–47
Result and discussion
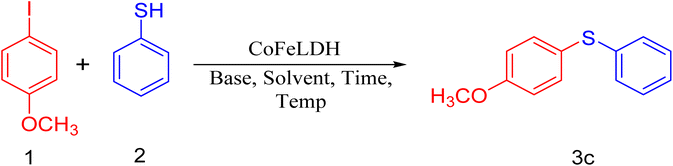
We started our experiment by using 4-iodoanisole (1 mmol), thiophenol (1 mmol equiv.), and K2CO3 (1.3 mmol equiv.) as starting materials. To initiate the reaction, we used 25 mg of CoFeLDH at 110 °C in DMF, which was selected as the optimal condition for the model reaction (Table 1, entry 2). When we attempted the same reaction without the CoFeLDH catalyst under the same conditions for 24 hours, we did not get the expected product (Table 1, entry 1). We then repeated the model reaction using CoFeLDH as a catalyst at different amounts (Table 1, entries 3, 4, and 5) and observed that 25 mg of CoFeLDH provided the best result (Table 1, entry 2). We also attempted the reaction in water, ethanol, and acetonitrile solvents, but none of them produced the desired yield compared to DMF (Table 1, entries 6, 7, and 8). Based on the optimization experiment, we concluded that 25 mg of CoFeLDH catalyst in the DMF solvent was the optimal medium for the reaction. We attempted to carry out the reaction at room temperature for 9 hours, but we did not obtain the corresponding product (Table 1, entry 9).
Table 1 Optimization of the reaction parameters for the synthesis of diaryl sulfide using the reported protocola
|
| Entry |
Catalyst (mg) |
Solvent (10 mL) |
Base |
Temperature (°C) |
Time (h) |
Yield (%)b, 3c |
| Reaction carried out with 25 mg of synthesized CoFeLDH, 4-iodoanisole, 1 (1 mmol equiv.), thiophenol, 2 (1 mmol equiv.), K2CO3 (1.2 mmol equiv.). Yield based on column chromatography. In the absence of a catalyst, NR stands for the reaction. |
| 1 |
—c |
DMF |
K2CO3 |
110 |
24 |
NR |
| 2 |
25 |
DMF |
K2CO3 |
110 |
9 |
94 |
| 3 |
10 |
DMF |
K2CO3 |
110 |
9 |
20 |
| 4 |
20 |
DMF |
K2CO3 |
110 |
9 |
70 |
| 5 |
30 |
DMF |
K2CO3 |
110 |
9 |
94 |
| 6 |
25 |
H2O |
K2CO3 |
Reflux |
9 |
NR |
| 7 |
25 |
EtOH |
K2CO3 |
Reflux |
9 |
50 |
| 8 |
25 |
CH3CN |
K2CO3 |
Reflux |
9 |
60 |
| 9 |
25 |
DMF |
K2CO3 |
RT |
9 |
NR |
| 10 |
25 |
DMF |
K2CO3 |
60 |
9 |
30 |
| 11 |
25 |
DMF |
K2CO3 |
80 |
9 |
50 |
| 12 |
25 |
DMF |
K2CO3 |
100 |
9 |
85 |
| 13 |
25 |
DMF |
K2CO3 |
120 |
9 |
94 |
| 14 |
25 |
DMF |
K2CO3 |
110 |
4 |
40 |
| 15 |
25 |
DMF |
K2CO3 |
110 |
7 |
70 |
| 16 |
25 |
DMF |
K2CO3 |
110 |
8 |
80 |
| 17 |
25 |
DMF |
Cs2CO3 |
110 |
9 |
95 |
| 18 |
25 |
DMF |
KOtBu |
110 |
9 |
50 |
| 19 |
25 |
DMF |
Et3N |
110 |
9 |
52 |
| 20 |
25 |
DMF |
KOH |
110 |
9 |
80 |
We observed the effect of temperature on the yield of the product further. When we carried out the model reaction at 60 °C and 80 °C, we obtained the expected product with a low yield (Table 1, entries 10 and 11). However, when we carried out the reaction at 100 °C and 110 °C, the yield of the desired product gradually increased, and we obtained the best result at 110 °C (Table 1, entries 12 and 2). On further increasing the temperature, the yield of the product did not significantly increase (Table 1, entry 13). Therefore, we chose 110 °C as the optimal temperature.
We also observed the time factor (Table 1 entries 14, 15, and 16) and obtained the maximum yield of our desired product at 9 hours (Table 1, entry 2). When we carried out the model reaction in the presence of different bases (Table 1, entries 17, 18, 19, and 20), we observed the best result in the presence of Cs2CO3 and K2CO3 (Table 1, entries 2 and 17). However, we chose K2CO3 due to its lower cost than Cs2CO3.
Our experimental results demonstrate that the model reaction is highly effective and versatile. We tested various aryl iodide and thiophenol combinations with different electron-donating/electron-withdrawing groups and found that aryl iodide with electron-withdrawing groups produced the desired product with a high yield due to the reduced electron density in the aryl iodide nucleus, facilitating nucleophilic attack (Table 2, entry 3f). Similarly, thiophenol with electron-donating groups yielded the corresponding product with good yields and no notable deviation, as shown in Table 2, entry 3e. These findings provide strong evidence for the efficacy and utility of our model reaction.
Table 2 Synthesis of diaryl sulfidesa,b
We conducted an A3-coupling reaction with phenylacetylene (1 mmol equiv.), benzaldehyde (1 mmol equiv.), and morpholine (1 mmol equiv.) as a model reaction on a DMF medium to explore the catalytic activity of CoFeLDH as a catalyst. The reaction was completed in 10 hours with a 92% yield of the desired product (Table 3, entry 2). When we attempted the same reaction under similar conditions in the absence of a catalyst, we did not obtain the desired product (Table 3, entry 1). Therefore, we can conclude that the reaction did not occur in the absence of a catalyst (Table 3, entry 1).
Table 3 Optimization of the reaction parameters for the synthesis of 4-(1, 3-diphenylprop-2-yn-1-yl)morpholinea

|
| Entry |
Catalyst (mg) |
Solvent (10 mL) |
Temperature (°C) |
Time (h) |
Yield (%)b, 4a |
| Reaction conditions: benzaldehyde, 1 (1 mmol equiv.), phenylacetylene, 2 (1 mmol equiv.), morpholine, 3 (1 mmol equiv.), CoFeLDH (25 mg) at different temperatures. Isolated yields. In the absence of a catalyst. Room-temperature reaction, NR = no yield of the desired product. |
| 1 |
-c |
DMF |
120 |
10 |
NR |
| 2 |
25 |
DMF |
120 |
10 |
92 |
| 3 |
25 |
H2O |
Reflux |
10 |
NR |
| 4 |
25 |
EtOH |
Reflux |
10 |
50 |
| 5 |
25 |
Acetonitrile |
Reflux |
10 |
70 |
| 6 |
15 |
DMF |
120 |
10 |
80 |
| 7 |
20 |
DMF |
120 |
10 |
90 |
| 8 |
30 |
DMF |
120 |
10 |
93 |
| 9 |
35 |
DMF |
120 |
10 |
94 |
| 10 |
25 |
DMF |
RTd |
10 |
NR |
| 11 |
25 |
DMF |
60 |
10 |
50 |
| 12 |
25 |
DMF |
80 |
10 |
70 |
| 13 |
25 |
DMF |
100 |
10 |
79 |
| 14 |
25 |
DMF |
110 |
10 |
85 |
| 15 |
25 |
DMF |
130 |
10 |
93 |
| 16 |
25 |
DMF |
120 |
2 |
10 |
| 17 |
25 |
DMF |
120 |
4 |
40 |
| 18 |
25 |
DMF |
120 |
6 |
60 |
| 19 |
25 |
DMF |
120 |
8 |
85 |
| 20 |
25 |
DMF |
120 |
9 |
88 |
| 21 |
25 |
DMF |
120 |
12 |
93 |
To optimize the protocol, we repeated the model reaction with different amounts of the synthesized CoFeLDH catalyst (Table 3, entries 6, 7, 8, and 9) and established that 25 mg of the catalyst per mmol of the reactants yielded the best result. We also tried various solvents including H2O, CH3CH2OH, and acetonitrile (Table 3, entries 3, 4, and 5), but DMF was established as the optimal medium for the reaction.
To optimize the temperature, we carried out the model reaction at room temperature, 60 °C, 80 °C, 100 °C, 110 °C, and 120 °C (Table 2, entries 10, 11, 12, 13, 14, and 2). The best yield was obtained at 120 °C (Table 3, entry 2). A further increment in temperature (Table 3, entry 15) increased the yield of the desired product, but was not as effective. Therefore, we chose 120 °C (Table 3, entry 2) as the optimized temperature. We also optimized the time factor (Table 3, entries 2, 16, 17, 18, 19, 20, and 21). At 10 hours, we obtained the best result. With this optimized condition, we performed the reaction with various substituents (Table 4) to investigate the generality and scope of the catalytic activity of the synthesized catalyst in the A3-coupling reaction. We carried out the reaction with a variety of aldehydes and terminal alkynes with morpholine. Aldehydes with electron-withdrawing groups afforded the desired product in high yields, which might be due to the decrease in electron density in the aldehyde nucleus, thereby facilitating a faster reaction (Table 4, entries 5 and 4e).
Table 4 Synthesis of 4-(1,3-diphenylprop-2-yn-1-yl)morpholinea,b
As shown in Table 4, it is obvious that the developed CoFeLDH catalyst may direct the A3-coupling reaction for a wide range of substrate applications for the synthesis of propargylamine derivatives.
In this study, we investigated the effectiveness of CoFeLDH as a catalyst in the C–S and A3 coupling reactions. Our experiment reveals that CoFeLDH is a catalyst that can be reused, as shown in Tables 5 and 6. We isolated the product of each individual cycle and calculated the percent of yield of the product. This is also visible from the SEM image of CoFeLDH (Fig. 1).
Table 5 Optimization of the recyclability test of CoFeLDH for the synthesis of diaryl sulfide using the reported protocol
| Entry |
CoFeLDH (mg) |
Solvent (10 mL) |
Base |
Temperature (°C) |
Time (h) |
Yield (%), 3c |
| Cycle-1 |
25 |
DMF |
K2CO3 |
110 |
9 |
94 |
| Cycle-2 |
25 |
DMF |
K2CO3 |
110 |
9 |
94 |
| Cycle-3 |
25 |
DMF |
K2CO3 |
110 |
9 |
93 |
| Cycle-4 |
25 |
DMF |
K2CO3 |
110 |
9 |
93 |
| Cycle-5 |
25 |
DMF |
K2CO3 |
110 |
9 |
92 |
Table 6 Optimization of the recyclability test of CoFeLDH for the synthesis of 4-(1, 3-diphenylprop-2-yn-1-yl)morpholine
| Entry |
CoFeLDH (mg) |
Solvent (10 mL) |
Temperature (°C) |
Time (h) |
Yield (%), 4a |
| Cycle-1 |
25 |
DMF |
120 |
10 |
92 |
| Cycle-2 |
25 |
DMF |
120 |
10 |
92 |
| Cycle-3 |
25 |
DMF |
120 |
10 |
91 |
| Cycle-4 |
25 |
DMF |
120 |
10 |
90 |
| Cycle-5 |
25 |
DMF |
120 |
10 |
90 |
 |
| | Fig. 1 SEM images of CoFeLDH and CoFeLDH after the 5th run. | |
The comparative SEM (Fig. 1) analysis also confirms that CoFeLDH possesses a heterogeneous morphology with elongated crystalline domains embedded in a granular matrix. This structure offers a high surface-to-volume ratio and abundant exposed active sites, both of which are critical for enhancing the catalytic activity in organic synthesis. In contrast, CoFeLDH after the 5th run exhibits dense agglomeration and reduced facet definition, which can limit the accessibility of active sites. Therefore, the morphological features observed for the efficient catalysis decrease.
Based on our literature survey, we gained an understanding of the chemical properties of CoFeLDH. CoFeLDH exhibits unique 2D layered structures. CoFeLDH thoroughly boosts its reactivity, as summarized, including intercalation and exfoliation, vacancy creation, hybridization, and ion substitution.50 It is believed that CoFeLDH is a promising candidate for effective ion adsorption and faster surface redox reactions. These reactions can lead to improved charge transfer and controlled ionic and electronic transport.51 Drawing from previous literature reports,52 we developed a plausible mechanism, as shown in Fig. 2(a), for the C–S coupling reaction. The pathway for these reactions is based on oxidative addition followed by reductive elimination. The resulting oxidative addition of CoFeLDH with aryl iodide may provide an intermediate compound, R(CoFeLDH)I.
 |
| | Fig. 2 (a) Plausible mechanism of the C–S coupling reaction by CoFeLDH. (b): Plausible mechanism of the A3 coupling reaction by CoFeLDH. | |
Based on the literature survey,53 we developed a plausible mechanism for the A3 coupling reaction by CoFeLDH, as shown in Fig. 2(b). The process involves the interaction of the aldehyde with CoFeLDH, followed by a condensation reaction with morpholine to form an iminium ion. This then reacts with the intermediate phenylacetylene (CoFeLDH) to form propargylamine.
Computational investigation of α-amylase and α-glucosidase inhibition: DFT, molecular docking, dynamics, and ADMET analyses
Density functional theory (DFT) analysis. The stability and reactivity of a molecule depend on the frontier molecular orbitals (FMOs) of HOMO and LUMO. The energy gaps between HOMO and LUMO were calculated, which are listed in Table 7. It gives information about the electron-donating and -accepting ability. It can determine the electron transportation property of a compound. The higher band gap energy suggests a compound's chemical hardness and stability, whereas a lower gap suggests the softness, instability, and reactive character of a molecule. This work established that the band gap energies of all the compounds ranging between 3.78 and 5.08 eV. Besides, a molecule with a high dipole moment has a strong tendency to take part in intermolecular interactions. It is found that compounds 3f–h have shown higher dipole moment values (>5 D), which have a high tendency to participate in strong intermolecular interactions.
Table 7 Calculated energy values of the compounds using the RB3LYP/6-311++G(d,p) basis set
| Compound |
EHOMO (eV) |
ELUMO (eV) |
Band gap (eV) |
Dipole moment (debye) |
| 3a |
−5.68 |
−0.96 |
4.71 |
0.98 |
| 3b |
−5.96 |
−0.99 |
4.97 |
1.93 |
| 3c |
−5.88 |
−0.85 |
5.02 |
2.85 |
| 3d |
−5.99 |
−1.03 |
4.97 |
3.91 |
| 3e |
−6.04 |
−0.96 |
5.08 |
1.17 |
| 3f |
−6.71 |
−2.93 |
3.78 |
5.07 |
| 3g |
−6.63 |
−2.71 |
3.92 |
6.85 |
| 3h |
−6.23 |
−1.77 |
4.46 |
5.81 |
| 4a |
−6.06 |
−1.29 |
4.77 |
1.67 |
| 4b |
−5.79 |
−1.25 |
4.53 |
1.79 |
| 4c |
−5.97 |
−1.22 |
4.75 |
2.12 |
| 4d |
−6.01 |
−1.23 |
4.79 |
1.56 |
| 4e |
−6.15 |
−1.24 |
4.91 |
1.58 |
Molecular docking studies. To understand the observed activities concerning the exploration of new anti-diabetic compounds having different molecular structures, molecular docking studies were carried out on α-amylase and α-glucosidase inhibitory activities. According to the molecular structures of the ligands, they can be divided into two categories with a common skeleton. The best-docked poses of the ligands with binding affinity with α-amylase and α-glucosidase are shown in Fig. 3. The docking results of the studied molecules with the receptor targets have given good information about the nature of the binding mode. The binding results revealed that the ligands are stabilized by several interactions, including hydrogen bonds and van der Waals interactions (Table 8). It was found that all the molecules exhibited a high binding energy between −6 and −8.3 kcal mol−1.
 |
| | Fig. 3 Best docked pose of all the ligands inside the active site of (a) α-amylase and (b) α-glucosidase receptors. | |
Table 8 Compounds having their binding energies and H-bond interactions with binding site residues
| Compound |
Amylase receptor |
Glucosidase receptor |
| Binding energy (kcal mol−1) |
H-bond interaction |
Total H-bond |
Binding energy (kcal mol−1) |
H-bond interaction |
Total H-bond |
| 3a |
−6.3 |
— |
— |
−6.3 |
— |
— |
| 3b |
−6.2 |
— |
— |
−6.7 |
— |
— |
| 3c |
−6 |
Gln63 |
1 |
−6.3 |
— |
— |
| 3d |
−6.1 |
His201 |
1 |
−6.6 |
— |
— |
| 3e |
−6.7 |
— |
— |
−7.1 |
— |
— |
| 3f |
−6.6 |
Gln63 |
1 |
−6.6 |
His203, Asn258 |
2 |
| 3g |
−6.9 |
His299, Arg195 |
— |
−7.3 |
— |
— |
| 3h |
−7.1 |
His201 |
— |
−7.3 |
— |
— |
| 4a |
−8 |
— |
— |
−8 |
— |
— |
| 4b |
−7.8 |
Gln63 |
— |
−8.3 |
Gln328 |
1 |
| 4c |
−7.7 |
— |
— |
−8.3 |
Asn258 |
1 |
| 4d |
−8.2 |
— |
— |
−8 |
— |
— |
| 4e |
−7.5 |
— |
— |
−7.7 |
— |
— |
| Acarbose |
−7.2 |
Gln63, Trp59, Asp19, His299 |
4 |
−7.7 |
Gln256, Ser145 Asp327 |
3 |
Against α-amylase receptor (PDB ID: 4W93). It was found from the docking results that almost all molecules have formed the same categories of interaction with the same residues (Fig. 4): Trp58, Trp59, Gln63, Leu165, Leu162, Asp197, His233, and His299. The two additional interactions, Pi-anion and Pi-cation types, have been observed against Asp197, Glu233, His201, and His299, respectively, due to the existence of a benzene ring. The halogen group (Bromine) is not concerned with any type of interaction in structure 3e. The contribution of the sulphur atom (Pi-sulphur) was found in the interaction modes of 3d, 3f, and 3h against His299 and Tyr62. Similarly, other interactions like Pi–Pi stacked have been found with 3a-h ligands against Leu165, Tyr62, and Trp59 residues and 3b, 3c, and 3e ligands against Trp58, Trp59, and Tyr62 residues.
 |
| | Fig. 4 Molecular docking interactions of the ligands with the α-amylase receptor (PDB: 4W93). | |
The methoxy group at different positions of the benzene ring of 3a–d has offered similar binding energies against the α-amylase target. However, the presence of the nitro group has increased the binding energy of 3f and 3g due to the participation of one and two hydrogen bonds with Gln63, His299, and Arg195 residues, respectively. Among the 3a–h ligands, the highest binding energy was found for 3h (−7.1 kcal mol−1) due to the participation of one hydrogen bond between the carbonyl oxygen and the His201 residue (Fig. 5(a)). This molecule showed almost a similar binding energy when compared with the reference acarbose inhibitor (−7.2 kcal mol−1). However, 4a–e showed higher binding energies than those of the reference one. Here, 4d showed the highest binding energy value of −8.2 kcal mol−1 (Fig. 5(b)), and Gln63 participated in forming one hydrogen bond with the ligand 4b.
 |
| | Fig. 5 Molecular docking interactions of (a) 3h and (b) 4d with the α-amylase receptor. | |
Against α-glucosidase receptor (PDB ID: 5ZCC). In Table 8, compounds 4a–d show higher binding energies and 3a–h show lower binding energies than that of the standard acarbose, −7.7 kcal mol−1 (Fig. 6). In all these cases, Asp60, Ile143, 144, Phe163, Asp199, Ala200, Gln256, Phe282, Asp327, and Arg411 are the active site residues. Among 3a–h, two compounds (3g and 3h) have formed a binding energy of −7.3 kcal mol−1 (Fig. 7). These molecules have not formed any hydrogen bonds with the receptor. However, compound 3f with a binding energy of −6.6 kcal mol−1 has formed two hydrogen bonds with His203 and Asn258. Similarly, for 4a–e, two compounds (4b and 4c) have exhibited the highest binding energy of −8.3 kcal mol−1, with one hydrogen bond (Fig. 8). In these cases, Pi–Pi stacked-type interactions are found due to the participation of Tyr63 and Phe163. Similarly, Asp327 and Arg411 have participated in Pi-cation and Pi-anion types of interactions.
 |
| | Fig. 6 Molecular docking interactions of the ligands with the α-glucosidase receptor (PDB: 5ZCC). | |
 |
| | Fig. 7 Molecular docking interactions of (a) 3g and (b) 3h with the α-glucosidase receptor. | |
 |
| | Fig. 8 Molecular docking interactions of (a) 4b and (b) 4c with the α-glucosidase receptor. | |
Molecular dynamics simulation analysis. Molecular docking cannot detect receptor and ligand conformational changes, treating them as rigid entities during binding. Yet, both components undergo significant alterations upon binding.54–57 Hence, MD simulation was introduced to explore complex structural dynamics, revealing insights into stability, strength, and flexibility over time. Here, the best-docked ligands were subjected to 10 ns MD simulation followed by different analyses such as root mean square deviation (RMSD), root mean square fluctuation (RMSF), radius of gyration (Rg), and solvent accessible surface area (SASA). The root mean square deviation (RMSD) considers a protein-ligand complex stability by measuring the position of atoms from a reference structure. In molecular dynamics, low RMSD implies stability, while high RMSD suggests significant structural changes and possible simulation inaccuracies. However, RMSF investigates local dynamics, assessing protein residue flexibility. RMSF tracks atom position fluctuations within residues during MD simulations, revealing residue flexibility, binding interactions, and conformational changes upon ligand binding. The radius of gyration (Rg) guides the understanding of the compact environment of the protein-ligand complex. It reveals how tightly or loosely these proteins and ligands bind together, offering better interactions. Further, an increase in the SASA parameter indicates a large surface area of the protein active site with the ligand, indicating a compact conformation of the complex.58
MD simulation of the α-amylase-associated complex. The low and stable RMSD values (0.21 nm for 3h and 0.17 nm for 4d) indicate that both complexes maintained structural stability throughout the simulation (Fig. 9(a)–(e)). The consistent Rg values of 2.36 nm for 3h and 2.34 nm for 4d demonstrate that the protein-ligand systems remained compact without unfolding, while the stable SASA values of 204.55 nm2 for 3h and 200.2 nm2 for 4d suggest that ligand binding did not significantly alter the solvent exposure of the protein. Furthermore, hydrogen bond analysis revealed that transient H-bonds were formed during the simulation, which supported the molecular docking results and contributed to the stability of the complexes. Overall, these parameters confirm that the 3h and 4d complexes form stable, compact, and biologically viable interactions with α-amylase.
 |
| | Fig. 9 Molecular dynamics simulation (a)–(e) of 3h and 4d in complexes with the α-amylase target. | |
MD simulation of α-glucosidase-associated complexes. The stable RMSD values (0.17–0.18 nm) indicate that all four complexes remained structurally stable during the simulation (Fig. 10(a)–(e)), with only a slight fluctuation for 3g between 4 and 7 ns. Consistent Rg values (∼2.42–2.43 nm) show that the protein-ligand systems stayed compact, while stable SASA values (229.4–233.03 nm2) suggest no major change in solvent exposure. Hydrogen bond analysis revealed that 3g and 3h lacked stable H-bonds, whereas 4b and 4c maintained one persistent H-bond, supporting their stronger stabilization. Overall, the results confirm stable and compact α-glucosidase-ligand interactions, with 4b and 4c showing slightly enhanced stability.
 |
| | Fig. 10 Molecular dynamics simulation (a)–(e) of 3g, 3h, 4b, and 4c in complexes with the α-glucosidase target. | |
In silico pharmacokinetic evaluation. The pharmacokinetic study is also an important property to ensure better orally administrated drug molecules. This study was performed using the SwissADME web tool, and the data are presented in Table 9. All the tested molecules (3a–4e) demonstrated favorable drug-likeness properties. Their molecular weights ranged from 216.3 to 356.26, falling within the optimal range (<500) suggested by Lipinski's rule of five. The number of rotatable bonds (2–3), hydrogen bond acceptors (1–3), and the absence of hydrogen bond donors further support good oral bioavailability. The consensus Log![[thin space (1/6-em)]](https://www.rsc.org/images/entities/char_2009.gif) P values (3.2–4.23) indicate balanced lipophilicity, which favors membrane permeability without excessive hydrophobicity. The TPSA values were generally low (<90 Å2), suggesting efficient passive absorption, with all compounds predicted to have high gastrointestinal (GI) absorption. Importantly, all molecules showed a favorable bioavailability score (0.55) and were predicted to be non-mutagenic, non-tumorigenic, and non-irritant (green status), highlighting their safety profile. Collectively, these parameters suggest that the designed molecules possess promising drug-likeness, good pharmacokinetic properties, and a high safety margin, making them suitable candidates for further development.
P values (3.2–4.23) indicate balanced lipophilicity, which favors membrane permeability without excessive hydrophobicity. The TPSA values were generally low (<90 Å2), suggesting efficient passive absorption, with all compounds predicted to have high gastrointestinal (GI) absorption. Importantly, all molecules showed a favorable bioavailability score (0.55) and were predicted to be non-mutagenic, non-tumorigenic, and non-irritant (green status), highlighting their safety profile. Collectively, these parameters suggest that the designed molecules possess promising drug-likeness, good pharmacokinetic properties, and a high safety margin, making them suitable candidates for further development.
Table 9 Compounds with their pharmacokinetic properties
| Molecule |
3a |
3b |
3c |
3d |
3e |
3f |
3g |
3h |
4a |
4b |
4c |
4d |
4e |
| MW |
216.3 |
216.3 |
216.3 |
250.74 |
230.33 |
265.72 |
245.3 |
242.34 |
277.36 |
291.39 |
307.39 |
291.39 |
356.26 |
| Rotatable bonds |
3 |
3 |
3 |
3 |
3 |
3 |
3 |
3 |
2 |
2 |
3 |
2 |
2 |
| H-bond acceptors |
1 |
1 |
1 |
1 |
1 |
2 |
2 |
1 |
2 |
2 |
3 |
2 |
2 |
| H-bond donors |
0 |
0 |
0 |
0 |
0 |
0 |
0 |
0 |
0 |
0 |
0 |
0 |
0 |
| Consensus LogP |
3.61 |
3.63 |
3.69 |
4.23 |
3.95 |
3.37 |
3.2 |
3.99 |
3.31 |
3.63 |
3.3 |
3.62 |
3.92 |
| TPSA |
34.53 |
34.53 |
34.53 |
34.53 |
34.53 |
71.12 |
71.12 |
42.37 |
12.47 |
12.47 |
21.7 |
12.47 |
12.47 |
| GI absorption |
High |
High |
High |
High |
High |
High |
High |
High |
High |
High |
High |
High |
High |
| Bioavailability score |
0.55 |
0.55 |
0.55 |
0.55 |
0.55 |
0.55 |
0.55 |
0.55 |
0.55 |
0.55 |
0.55 |
0.55 |
0.55 |
| Mutagenic |
Green |
Green |
Green |
Green |
Green |
Green |
Green |
Green |
Green |
Green |
Green |
Green |
Green |
| Tumorigenic |
Green |
Green |
Green |
Green |
Green |
Green |
Green |
Green |
Green |
Green |
Green |
Green |
Green |
| Irritant |
Green |
Green |
Green |
Green |
Green |
Green |
Green |
Green |
Green |
Green |
Green |
Green |
Green |
Biological and pharmacological assessment of the synthesized compounds: analysis of antioxidant, antidiabetic, and antimicrobial activities
DPPH assay analysis. The DPPH assay was carried out for all samples to assess their in vitro antioxidant activity. It is a very common and widespread spectroscopic method for in vitro antioxidant measurements. The mechanism behind the assay is the creation of a synthetic-colored radical to be scavenged by biological sample 1 (compound 4a). Potent radical scavenging activity was shown by sample 1 (compound 4a) (122.10 ± 7.15 µg mL−1) compared to sample 3 (340.98 ± 16.31 µg mL−1) and ascorbic acid (90.01 ± 3.62 µg mL−1) (Fig. 11(a)). Sample 1 (compound 4a) showed significant free radical scavenging activity compared to ascorbic acid (p < 0.05); Fig. 11(a).
 |
| | Fig. 11 DPPH (a) and α-amylase inhibition (b) assay of different samples and the standard. Data are expressed as mean ± SD. Different letters indicate a significant difference according to Tukey's test (p < 0.05). | |
α-Amylase assay analysis. The inhibition of α-amylase, a key carbohydrate-digesting enzyme, in the gastrointestinal glucose absorption, followed by the lowering of glucose level, is an important adopted method to cure diabetes mellitus. Both sample 1 (compound 4a, 54.89 ± 5.05 µg mL−1) and sample 3 (compound 3g 58.95 ± 4.581 µg mL−1) showed a significant (p < 0.05) potent α-amylase inhibitory activity as compared to acarbose (143.62 ± 16.31 µg mL−1), an antidiabetic drug (Fig. 11(b)).
α-Amylase inhibition activity. The pancreatic enzyme α-amylase plays a crucial role in the digestion of polysaccharides. Its inhibition can help prevent elevated blood glucose levels.59–65 These α-amylase inhibitors, also known as starch blockers, hinder or delay the body's ability to absorb starch by preventing the enzymatic breakdown of 1,4-glycosidic bonds in starch and oligosaccharides. This stops their conversion into simpler sugars like maltose and maltotriose.66 The α-amylase inhibition activity is depicted in Fig. 12(a), showing that the SR (compound 4a) methanolic extract showed an IC50 value of 112.98 µg mL−1 compared to the standard acarbose (IC50: 63.76 µg mL−1). SR demonstrates effective α-amylase inhibitory activity due to the presence of polar compounds, which reduces diabetic risk and aids in managing hyperglycemia.67
 |
| | Fig. 12 (a) α-Amylase and (b) α-glucosidase inhibition assay of SR and standard. Effects of SR on (c) oral glucose tolerance test in normal rats and (d) fasting blood sugar level in diabetic rats. The values are expressed as mean ± SD (n = 6 animals). | |
α-glucosidase inhibitory activity. Fig. 12(b) demonstrates the α-glucosidase inhibitory activity, which reveals that the SR (compound 4a) methanolic extract (IC50: 111.42 µg mL−1) has comparable activity to the standard acarbose (IC50: 78.53 µg mL−1). The enzyme mammalian α-glucosidase, which is found in the small intestine's mucosal brush border, is responsible for promoting the final stage of digestion for starches and disaccharides, which are frequently found in the human diet.68 It also slows the digestion of complex carbohydrates, reducing the rise in post-prandial blood glucose levels.69
Acute toxicity studies. The SR acute toxicity study found no deaths after 72 hours at a dose of 2000 mg kg−1. At the administered dosages, no toxicity, adverse effects, or behavioral changes were observed in the rats. Furthermore, no fatal side effects were recorded in any of the experimental rat groups.
Oral glucose tolerance test (OGTT). The OGTT was performed on normal rats at 0, 30, 60, 90, and 120 minutes to evaluate glucose levels (Fig. 12(c)). Before glucose administration, blood glucose levels among the rats were consistent, with no noticeable differences. The normal and diabetic groups exhibited their highest glucose levels 60 minutes after the oral glucose challenge (Fig. 12(c)). Pre-treatment with SR significantly lowered the elevation in blood glucose levels at 90 minutes (P < 0.001) and 120 minutes (P < 0.01) compared to the diabetes control group (Fig. 12(c)). At 60 minutes, the percentage change in blood glucose levels was 39.06% for metformin (70 mg kg−1), 48.33% for SR (200 mg kg−1), and 44.27% for SR (400 mg kg−1), relative to the normal control group (Fig. 12(c)). The oral glucose tolerance test showed SR's potential to lower the blood glucose levels. Its antihyperglycemic effect began to manifest after 60 minutes and reached its maximum at 120 minutes. This suggests that SR could enhance glucose utilization, resulting in a substantial reduction in blood glucose levels in glucose-loaded rats.70
Effect of SR on the fasting blood sugar (FBS) levels and body weight in rats with diabetes induced by STZ-nicotinamide
In this study, the administration of streptozotocin (STZ) resulted in a fourfold increase in blood glucose levels compared to the normal control group (Fig. 12(d)). To minimize significant damage to pancreatic β cells, rats were pre-treated with nicotinamide (NA). Rats with fasting blood glucose levels exceeding 200 mg dl−1 on the second day after STZ-NA administration were selected for further treatment. Fig. 12(d) illustrates the blood glucose levels on days 1, 7, 14, 21, and 28 of SR therapy in STZ-nicotinamide-induced diabetic rats. Elevated blood glucose levels were observed in all groups except the normal control group. Untreated diabetic rats displayed a sharp increase in blood glucose levels. However, at doses of 200 and 400 mg kg−1, SR therapy significantly reduced the fasting blood glucose levels in type 2 diabetic rats and was found as 50.68% (p < 0.01) and 58.58% (p < 0.01), respectively, on the 28th day. These findings have been compared with those of metformin (70 mg kg−1), a common oral hypoglycemic agent that had a decrease of 58.23% (p < 0.01) on the 28th day of the study, whereas the body weight data for SR in STZ-nicotinamide-induced diabetic rats are summarized in Table 10. At the start of the experiment, all groups had comparable baseline body weights. Over 28 days, STZ treatment led to a significant reduction in body weight compared to normal rats (p < 0.05). The diabetic control group experienced drastic weight loss on the 7th day of the study. However, SR treatment at doses of 200 and 400 mg kg−1 showed a significant improvement in body weight after three weeks. The breakdown of tissue proteins in diabetes causes muscle loss, polydipsia, and weight loss.71 SR bioactive components allow diabetic rats to maintain almost normal body weight and lower fasting blood glucose levels. Under regulated hyperglycaemic conditions, these substances improve the body weight, lower hyperglycemia, and mitigate oxidative damage by acting as antioxidants.72 Our results were confirmed by earlier research that demonstrated a significant decrease in blood glucose levels in diabetic rats treated with several plant-extracted therapies.73
Table 10 Changes in the body weight (g) of rats in the five groups during the experimental period of 28 days
| Control expt. |
1 Day |
7 Days |
14 Days |
21 Days |
28 Days |
| Normal control |
125.67 ± 4.04 |
129.67 ± 1.16 |
132.34 ± 2.08 |
135.67 ± 1.53 |
139.67 ± 3.61 |
| Diab. control |
125.32 ± 3.21 |
120 ± 0.58 |
126.67 ± 3.06 |
126.67 ± 3.79 |
133.67 ± 5.13 |
| Diab. met. 70 mg kg−1 b.w. |
126.34 ± 2.08 |
130.67 ± 3.56 |
134.33 ± 3.51 |
139.33 ± 2.08 |
144.33 ± 4.73 |
| SR 200 mg kg−1 |
126.33 ± 3.06 |
130.34 ± 2.51 |
133.33 ± 3.06 |
139.33 ± 2.08 |
147.67 ± 4.77 |
| SR 400 mg kg−1 |
124 ± 4.041 |
128.33 ± 4.51 |
131.67 ± 2.55 |
134.67 ± 3.79 |
139 ± 4.55 |
Effects of blood biochemical parameters on diabetic rats administered with SR
The biochemical properties of blood, as represented in Table 11, were studied in STZ-nicotinamide-induced diabetic rats. These rats were treated with either a standard intervention or SR at two different doses (200 and 400 mg kg−1). The findings revealed a significant reduction (p < 0.05) in bilirubin total, SGPT, SGOT, ALP, and serum amylase levels, bringing them closer to normal values. Notably, the higher dose of SR (400 mg kg−1) showed greater efficacy in restoring blood serum biochemical levels to those observed in healthy rats compared to the lower dose (200 mg kg−1). In contrast, the diabetic control group substantially increased serum parameters, as highlighted in Table 11. The increased SGOT, SGPT, alkaline phosphatase, bilirubin, and α-amylase levels in diabetes conditions are attributed to oxidative stress or the production of advanced glycation end products, which cause an increase in the release of enzymes from tissues, mainly the liver.74 SR treatment showed hepatoprotective effects by lowering the serum levels of SGOT, SGPT, and alkaline phosphatase. Similarly, the effects of SR were similar to those of metformin, a standard medication.
Table 11 Biochemical parameters
| Control expt. |
Bilirubin total (mg dl−1) |
SGOT (IU/L) |
SGPT (IU/L) |
Alkaline phosphatase (IU/L) |
Serum amylase (IU/L) |
| Normal control |
0.51 ± 0.02 |
49.23 ± 1.05 |
29.18 ± 1.67 |
156.84 ± 7.34 |
303.75 ± 10.36 |
| Diab. Control |
1.34 ± 0.04 |
112.04 ± 5.15 |
97.45 ± 4.88 |
427.57 ± 13.04 |
510.03 ± 12.93 |
| Diab. met. 70 mg kg−1 b.w. |
0.63 ± 0.01 |
59.28 ± 2.34 |
36.05 ± 2.36 |
181.03 ± 7.95 |
331.69 ± 7.33 |
| SR 200 mg kg−1 |
0.81 ± 0.08 |
76.87 ± 2.11 |
50.33 ± 1.44 |
230.63 ± 6.08 |
381.8 ± 6.80 |
| SR 400 mg kg−1 |
0.87 ± 0.05 |
75.93 ± 3.68 |
42.14 ± 1.45 |
193.93 ± 15.88 |
382.2 ± 7.82 |
Effects of blood urea levels in diabetic rats administered with SR
Table 12, illustrates the variations in blood urea levels, showing that SR treatment significantly reduced blood urea, blood urea nitrogen, uric acid, and creatinine, thereby restoring these biochemical parameters toward values comparable with the normal control experimental values. The lower SR dose (200 mg kg−1) proved to be more effective than the higher dose (400 mg kg−1). In contrast, the diabetic control group exhibited a sharp increase in the parameters associated with blood urea levels, as detailed in Table 12. In diabetes, increased uric acid levels are attributed to metabolic disturbances, including enhanced lipid peroxidation and elevated triglyceride and cholesterol levels.75 Furthermore, protein glycation in diabetes can lead to muscle degradation, resulting in a higher release of purines, the precursors of uric acid. The study shows that in diabetic rats, SR therapy significantly reduced serum urea and creatinine levels. The increase in these biomarkers may indicate renal impairment, which is frequently linked to diabetes hyperglycemia.76,77 The results imply that in diabetic conditions, SR might help reduce oxidative stress and restore kidney function.
Table 12 Effect of blood urea levels in experimental diabetic rats
| Control expt. |
Blood urea (mg dl−1) |
Blood urea nitrogen (mg dl−1) |
Uric acid (mg dl−1) |
Creatinine (mg dl−1) |
| Normal control |
21.53 ± 1.38 |
11.48 ± 0.97 |
0.84 ± 0.02 |
0.18 ± 0.01 |
| Diab. Control |
72.72 ± 4.26 |
51.34 ± 3.15 |
5.93 ± 0.18 |
0.94 ± 0.04 |
| Diab. met. 70 mg kg−1 b.w. |
32.65 ± 2.04 |
17.82 ± 1.04 |
1.13 ± 0.04 |
0.31 ± 0.01 |
| SR 200 mg kg−1 |
39.47 ± 2.17 |
21.83 ± 1.51 |
2.73 ± 0.14 |
0.55 ± 0.05 |
| SR 400 mg kg−1 |
50.13 ± 1.05 |
23.51 ± 1.93 |
3.53 ± 0.15 |
0.43 ± 0.03 |
Effects of lipid profiling in diabetic rats administered with SR
Table 13 represents the changes observed in total cholesterol, triglycerides, HDL cholesterol, LDL cholesterol, and VLDL cholesterol levels among the experimental groups. Remarkably, the SR treatment at a dosage of 400 mg kg−1 resulted in a more pronounced reduction in lipid profile parameters than the 200 mg kg−1 dosage, with both treatments showing significant improvement relative to the diabetic control group. It has been demonstrated that insulin insufficiency linked to diabetes disrupts several metabolic and regulatory functions, which leads to the accumulation of lipids like triglycerides and total cholesterol. Diabetic individuals commonly experience impaired cholesterol packaging mechanisms and elevated serum triglyceride levels.78,79 The findings revealed that STZ-induced diabetic rats showed marked disturbances in lipid metabolism, characterized by significant elevations in serum LDL, VLDL, triglycerides, and total cholesterol levels. The administration of the SR extract over a 28-day treatment period successfully reduced these lipid parameters, thereby affirming the lipid-lowering potential of SR in diabetic rats.
Table 13 Effect of lipid profiling in experimental diabetic rats
| Control expt. |
Cholesterol total (mg dl−1) |
Triglycerides (mg dl−1) |
HDL cholesterol (mg dl−1) |
LDL cholesterol (mg dl−1) |
VLDL cholesterol (mg dl−1) |
| Normal control |
57.46 ± 2.13 |
73.54 ± 3.98 |
19.07 ± 1.28 |
10.93 ± 0.85 |
13.67 ± 1.04 |
| Diab. Control |
114.76 ± 5.26 |
187.05 ± 6.49 |
88.48 ± 3.87 |
51.74 ± 2.16 |
66.04 ± 2.85 |
| Diab. met. 70 mg kg−1 b.w. |
70.93 ± 4.06 |
95.86 ± 3.76 |
28.03 ± 2.35 |
17.36 ± 1.67 |
18.07 ± 1.16 |
| SR 200 mg kg−1 |
93.91 ± 6.71 |
117.72 ± 5.31 |
45.57 ± 1.50 |
31.9 ± 2.88 |
21.8 ± 1.57 |
| SR 400 mg kg−1 |
101.87 ± 6.46 |
129.23 ± 6.93 |
38.25 ± 6.93 |
22.8 ± 1.13 |
22.83 ± 1.62 |
Effects of the MDA Level and CAT Activity in Diabetic Rats administered with SR
Oxidative stress in the liver can be evaluated by analyzing the levels of MDA and CAT activity. According to the data summarized in Table 14, oral administration of SR resulted in a significant (p < 0.05) decrease in MDA content. Specifically, the low-dose group showed levels of 77.04 ± 3.38 nmol g−1 tissue, while the high-dose group recorded 68.55 ± 3.94 nmol g−1 tissue. Both values are significantly lower than those in the diabetic control group, which had an MDA content of 101.29 ± 5.36 nmol g−1 tissue (Table 14). However, differences in MDA content among the SR-fed groups were relatively small when compared to the group treated with the standard reference drug metformin (70 mg kg−1 body weight) (Table 14). Additionally, SR significantly (p < 0.05) enhanced the CAT activity levels in diabetic rats (Table 14). Oxidative stress markers function as enzymatic antioxidants within cells, safeguarding them against oxidative damage. However, the elevated glucose levels characteristic of diabetes mellitus can inactivate these antioxidant enzymes by the glycation of proteins, thereby inducing oxidative stress. This oxidative stress also contributes to lipid peroxidation.80 The observed improvements in CAT and MDA activities underscored the effectiveness of SR in mitigating oxidative stress in the liver of diabetic rats. The extract appeared to provide a protective effect on the liver by restoring cellular antioxidant levels in diabetic rats to normal.
Table 14 Effect of SR on the MDA level and CAT activity in the liver of experimental diabetic rats
| Control expt. |
MDA level (nmol gm−1 tissue) |
CAT activity (U min−1 gm−1 tissue) |
| Normal control |
39.05 ± 2.19*** |
34.23 ± 2.36***## |
| Diabetic control |
101.29 ± 5.36### |
10.64 ± 1.09### |
| Diabetic metformin (70 mg kg−1 b.w.) |
63.45 ± 3.07*** |
24.54 ± 1.08*** |
| SR (200 mg kg−1 b.w.) |
77.04 ± 3.38*** |
18.83 ± 1.43***### |
| SR (400 mg kg−1 b.w.) |
68.55 ± 3.94*** |
20.28 ± 1.76***## |
Histopathology of the liver, pancreas, and kidney of diabetic rats
The liver's histopathological studies are shown in Fig. 13(A–E), where SR showed normal liver parenchyma cell architecture (Fig. 13(A)). Diabetic rats displayed mild to severe portal inflammation with lymphomononuclear and plasma cells (Fig. 13(B)).81,82 There was a little dilatation when comparing diabetes control to the sinusoids and central veins. Hepatocytes don't appear to be distinctive. The central veins of the metformin-treated group are slightly dilated (Fig. 13(C)). Rats treated with metformin displayed unremarkable portal regions, hepatocytes and sinusoids in comparison to the control group (Fig. 13(C)). SR treatment resulted in normal liver histology in rats (Fig. 13(D) and (E)).
 |
| | Fig. 13 Liver histogram of hematoxylin-eosin staining of hepatic tissues of (A) normal control, (B) diabetic control, (C) metformin-treated, (D) SR (200 mg kg−1)-treated, and (E) SR (400 mg kg−1)-treated rats. Histograms of hepatic tissue sections are shown at 200× magnification: sinusoids (S), central vein (CV), and hepatocytes (H). | |
In case of the pancreas, Fig. 14(A–E) displays the histopathology image of pancreatic tissues of different groups of rats. When comparing the normal groups to the diabetic untreated groups, Fig. 14(A) displays the normal pancreatic tissues, while Fig. 14(B) shows the damaged islets of Langerhans.83 Pancreatic tissues treated with the standard drug, metformin, are depicted in Fig. 14(C), and they resemble normal ones. Finally, the pancreatic tissue of the rat groups treated with SR is depicted in Fig. 14(D) and (E), where it demonstrates improved histopathological structure and similarity to that of the healthy rats.
 |
| | Fig. 14 (A) Pancreatic structure was normal for the healthy control group; (B) pancreatic structure was damaged with disorganized islets of Langerhans observed for the diabetic control group (H&E × 400), (C) less damage to the pancreatic structure for diabetic metformin group, (D) less damage to the pancreatic structure for diabetic SR group (200 mg kg−1), and (E) less damage to the pancreatic structure for diabetic SR (400 mg kg−1); IL: islets of Langerhans. | |
In diabetic rats, the glomeruli exhibited localized moderate expansion and sclerosis (Fig. 15(B)).84 In contrast, the SR-treated rats (Fig. 15(D) and (E)), the metformin-treated group (Fig. 15(C)), and the control group (Fig. 15(A)) displayed renal parenchyma with normal tubules and glomeruli.
 |
| | Fig. 15 (A) Normal glomerular structure of the healthy control group, (B) damaged glomerular structure with necrotic cells and increased blood flow observed for the diabetic control group (H&E × 400), (C) glomerular structure with less damage for the diabetic metformin group, (D) glomerular structure with less damage for the diabetic SR group (200 mg kg−1), and (E) glomerular structure with notably ameliorated damage. The arrows indicate the glomerular structure of diabetic rats (400 mg kg−1); GC: glomerular capillaries. | |
The histopathological findings highlight SR's remarkable restorative effects on key organs in diabetic models, showcasing its potential as an effective therapeutic agent against diabetes-induced organ damage.
Experimental study of the anti-microbial activity of the synthesized compound
Two Gram-positive (Staphylococcus aureus and Bacillus cereus) and two Gram-negative (Escherichia coli and Klebsiella pneumonia) bacteria were cultured overnight and used for the present study to assess the antimicrobial activities of the synthesized samples in Mueller–Hinton (MH) agar media (Himedia). Then, 38.0 grams of MH media were added to 1000 mL of double-distilled water and heated until complete dissolution. The media were sterilized by autoclaving at 20 lbs pressure at 121 °C for 20 minutes. The media was cooled down to room temperature and poured into sterile Petri plates in a sterile condition in the laminar airflow cabinet. Then, 100 µl of bacterial strains were added separately to each Petri plate containing media and agitated for mixing. The synthesized compounds (C5-1, 3a; C5-2, 3b; C5-3, 3c; C5-4, 3d; C5-5, 3e; C5-6, 3f; C5-7, 3g; C5-8, 3h; A3-1, 4a; A3-2, 4b; A3-3, 4c; A3-4, 4d and A3-5, 4e) were dissolved in dimethyl sulfoxide (DMSO) at a concentration of 5 mg mL−1. The paper disc diffusion method was applied. Circular paper discs (6 mm diameter) were cut from Whatman 42 filter papers and dipped in the sample solutions for one hour. The paper discs dipped in sample solutions were placed in the media containing bacterial culture and incubated overnight at 37 °C. The four bacteria were tested against some natural, semi-synthetic, and synthetic antibiotics such as ampicillin, ceftazidime, imipenem, methicillin, kanamycin, streptomycin, azithromycin, tetracycline, ciprofloxacin, ofloxacin and rifampicin.
Results and discussion
The activity of the synthesized compounds in inhibiting bacterial growth can be ascertained by susceptibility tests. The synthesized compounds showed high variability (Fig. 16) and Tables 15 and 16 in exhibiting antibacterial properties. Samples C5-1, 3a; C5-5, 3e; C5-8, 3h; A3-1, 4a; A3-2, 4b; A3-3, 4c; A3-4, 4d and A3-5, 4e showed activity in inhibiting bacterial growth. C5-1, 3a, and A3-1, 4a were found to be more effective in inhibiting the growth of both Gram-positive and Gram-negative bacteria than the other samples. C5-5 (3e) showed activity against Escherichia coli, while C5-8 (3h) showed activity against Bacillus subtilis. The four bacteria showed a variable degree of growth inhibition against the tested antibiotics (Table 17). Based on the standards of CLSI (Clinical and Laboratory Standards Institute), all the tested bacteria were resistant towards methicillin. Bacillus cereus, Staphylococcus aureus, and Klebsiella pneumonia showed resistance towards ampicillin and ceftazidim. Escherichia coli was resistant to rifampicin. BS showed intermediate inhibition between resistance and susceptibility for streptomycin and rifampicin. The rest of the test showed susceptible action. All the synthesized compounds showed better inhibition zones than methicillin for all the tested bacteria. The inhibition zones for the synthesized compounds were more than those of ampicillin and ceftazidim for K pneumonia, S aureus, and B. subtilis.
 |
| | Fig. 16 Image of susceptibility tests of the compounds 3a–h and 4a–e for inhibiting bacterial growth. | |
Table 15 Results of the anti-microbial activity of the synthesized compounds 3a–h
| Organism name |
Inhibition zone (mm) |
| C5-1, 3a |
C5-2, 3b |
C5-3, 3c |
C5-4, 3d |
C5-5, 3e |
C5-6, 3f |
C5-7, 3g |
C5-8, 3h |
| Escherichia coli (gram −ve) |
11 |
12 |
10 |
14 |
7 |
9 |
18 |
13 |
| Klebsiella pneumoniae(gram −ve) |
9 |
10 |
6 |
11 |
8 |
8 |
12 |
7 |
| Bacillus subtilis (gram +ve) |
10 |
11 |
— |
7 |
9 |
7 |
9 |
9 |
| Staphyllococcus aureus (gram +ve) |
7 |
8 |
— |
10 |
10 |
8 |
7 |
11 |
Table 16 Results of the anti-microbial activity of the synthesized compounds 4a–e
| Organism name |
Inhibition zone (mm) |
| A3-1, 4a |
A3-2, 4b |
A3-3, 4c |
A3-4, 4d |
A3-5, 4e |
| Escherichia coli (gram −ve) |
10 |
9 |
11 |
8 |
13 |
| Klebsiella pneumoniae(gram −ve) |
9 |
10 |
9 |
10 |
10 |
| Bacillus subtilis (gram +ve) |
7 |
8 |
10 |
— |
11 |
| Staphyllococcus aureus (gram +ve) |
11 |
7 |
7 |
— |
7 |
Table 17 Inhibition zones formed by the action of standard antibiotics against the bacteria
| |
B. subtilis |
S. aureus |
E. coli |
K. pneumoniae |
| Ampicillin |
7 mm |
6 mm |
20 mm |
7 mm |
| Ceftazidime |
4 mm |
3 mm |
20 mm |
6 mm |
| Imipenem |
30 mm |
35 mm |
30 mm |
35 mm |
| Methicillin |
4 mm |
4 mm |
6 mm |
4 mm |
| Kanamycin |
17 mm |
17 mm |
15 mm |
18 mm |
| Streptomycin |
10 mm |
20 mm |
15 mm |
20 mm |
| Azithromycin |
14 mm |
25 mm |
18 mm |
21 mm |
| Tetracycline |
20 mm |
23 mm |
18 mm |
25 mm |
| Ciprofloxacin |
18 mm |
25 mm |
25 mm |
30 mm |
| Ofloxacin |
17 mm |
25 mm |
30 mm |
25 mm |
| Rifampicin |
9 mm |
17 mm |
6 mm |
17 mm |
| CLSI standard (0–9 mm-resistant; 9–12 mm – Intermediate >12-susceptible) |
Conclusions
We have developed a simple and efficient method for synthesizing diaryl sulfide and propargylamine derivatives using CoFeLDH as a catalyst. The CoFeLDH catalyst was found to be particularly effective in producing high yields of the desired products. We tested the synthesized compounds 3a–h and 4a–e for their antimicrobial activity against two Gram-positive bacteria (Staphylococcus aureus and Bacillus cereus) and two Gram-negative bacteria (Escherichia coli and Klebsiella pneumonia). These compounds were found to be more effective than others in inhibiting the growth of both types of bacteria. We also investigated the potential of these compounds as anti-diabetic agents with contrasting molecular structures using molecular docking studies and density functional theory (DFT). The results showed that compounds 3a–h and 4a–e had good chemical reactivity and kinetic stability. Additionally, compounds 3g and 4a showed significant antioxidant and anti-diabetic properties. Further, for compound 4a, we conducted an in vivo antidiabetic assay in rats.
Ethical statement
All animal procedures were performed in accordance with the Guidelines for the Care and Use of Laboratory Animals of the University of North Bengal and approved by the Animal Ethics Committee of the University of North Bengal (IAEC/NBU/2022/35).
Author contributions
Aminul Islam: methodology, investigation, writing – original draft, and conceptualization. Rabindranath Singha: methodology and investigation. Susanta Kumar Saha: formal analysis. Kaushik Sarkar: DFT and docking study. Tania Baishya: study of biocidal activity. Ranabir Sahu: formal analysis. Rajesh Kumar Das: formal analysis. Malay Bhattacharya: formal analysis. Mayukh Deb: formal analysis. Pranab Ghosh: writing – review & editing, and supervision.
Conflicts of interest
The authors declare that they have no known competing financial interests or personal relationships that could have appeared to influence the work reported in this paper.
Data availability
We declare that the data used in the article are available from the authors upon request.
Supplementary information: comprehensive characterization data of the CoFeLDH catalyst and the synthesized compounds, accompanied by detailed biological analyses and computational evaluations including DFT. See DOI: https://doi.org/10.1039/d5ra05742f.
References
- E. G. Barbosa, L. A. S. Bega, A. Beatriz, T. Sarkar, E. Hamel, M. S. Amaral and D. P. Lima, Eur. J. Med. Chem., 2009, 44, 2685–2688 CrossRef CAS PubMed.
- P. C. Carvalho, E. A. Santos, B. U. C. Schneider, R. Matuo, J. R. Pesarini, A. L. Cunha-Laura, A. C. D. Monreal, D. P. Lima, A. C. M. B. Antoniolli and R. J. Oliveira, Environ. Toxicol. Pharmacol., 2015, 40, 715–721 CrossRef CAS PubMed.
- E. A. Santos, E. Hamel, R. Bai, J. C. Burnett, C. S. S. Tozatti, D. Bogo, R. T. Perdomo, A. M. M. Antunes, M. M. Marques, M. F. C. Matos and D. P. Lima, Bioorg. Med. Chem. Lett., 2013, 23, 4669–4673 CrossRef PubMed.
- F. Saccoliti, G. Angiulli, G. Pupo, L. Pescatori, V. N. Madia, A. Messore, G. Colotti, A. Fiorillo, L. Scipione, M. Gramiccia, T. D. Muccio, R. D. Santo, R. Costi and A. Ilari, J. Enzyme Inhib. Med. Chem., 2017, 32, 304–310 CrossRef CAS PubMed.
- A. S. Surur, L. Schulig and A. Link, Arch. Pharmazie, 2018, 352, 1800248 CrossRef.
- I. M. Yonova, C. A. Osborne, N. S. Morrissette and E. R. Jarvo, J. Org. Chem., 2014, 79, 1947–1953 CrossRef CAS.
- Y. Huang, S. Bae, Z. Zhu, N. Guo, B. L. Roth and M. Laruelle, J. Med. Chem., 2005, 48, 2559–2570 CrossRef CAS PubMed.
- D. Sengupta, K. Bhowmik, G. De and B. Basu, Beilstein J. Org. Chem., 2017, 13, 1796–1806 CrossRef CAS.
- R. Xu, J. P. Wan, H. Mao and Y. Pan, J. Am. Chem. Soc., 2010, 132, 15531–15533 CrossRef CAS PubMed.
- E. Sperotto, G. P. M. V. Klink, J. G. Vries and G. V. Koten, J. Org. Chem., 2008, 73, 5625–5628 CrossRef CAS PubMed.
- H. Y. Chen, W. T. Peng, Y. H. Lee, Y. L. Chang, Y. J. Chen, Y. C. Lai, N. Y. Jheng and H. Y. Chen, Organometallics, 2013, 32, 5514–5522 CrossRef CAS.
- Y. Zhang, K. C. Ngeow and J. Y. Ying, Org. Lett., 2007, 9, 3495–3498 CrossRef CAS PubMed.
- Y. Liu, L. Y. Lam, J. Ye, N. Blanchard and C. Ma, Adv. Synth. Catal., 2020, 362, 2326–2331 CrossRef CAS.
- Y. Wang, J. Deng, J. Chen, F. Cao, Y. Hou, Y. Yang, X. Deng, J. Yang, L. Wu, X. Shao, T. Shi and Z. Wang, ACS Catal., 2020, 10, 2707–2712 CrossRef CAS.
- M. Vaddamanu, K. Velappan and G. Prabusankar, New J. Chem., 2020, 44, 129–140 RSC.
- S. Dutta and A. Saha, Org. Biomol. Chem., 2019, 17, 9360–9366 RSC.
- B. Liu, C. H. Lim and G. M. Miyake, J. Am. Chem. Soc., 2017, 139, 13616–13619 CrossRef CAS PubMed.
- R. Singha, S. Chettri, D. Brahman, B. Sinha and P. Ghosh, Mol. Divers., 2022, 26, 505–511 CrossRef CAS PubMed.
- A. Sharmin, M. B. Asif and G. Zhang, et al., Environ. Sci. Pollut. Res., 2024 DOI:10.1007/s11356-024-34331-5.
- M. Y. Falach, T. Amit, O. B. Am and M. B. H. Youdim, FASEB J., 2003, 17, 2325–2327 CrossRef.
- F. T. Zindo, J. Joubert and S. F. Malan, Future Med. Chem., 2015, 7, 609–629 CrossRef.
- F. Mao, J. Li, H. Wei, L. Huang, X. Li and J. Enzyme Inhib, Med. Chem., 2015, 30, 995–1001 Search PubMed.
- P. H. Yu, B. A. Davis and A. A. Boulton, J. Med. Chem., 1992, 35, 3705–3713 CrossRef PubMed.
-
(a) A. A. Boulton, B. A. Davis, D. A. Durden, L. E. Dyck, A. V. Juorio, X. M. Li, I. A. Paterson and P. H. Yu, Drug Dev. Res., 1997, 42, 156 CrossRef;
(b) J. Golik, J. Clardy, G. Dubay, G. Groenewold, H. Kawaguchi, M. Koniashi, B. Krishnan, H. Ohkuma, K. Saitoh and T. W. Doyle, J. Am. Chem. Soc., 1990, 112, 3715 CrossRef.
- C. Swithenbank, P. J. McNulty and K. L. Viste, J. Agric. Food Chem., 1971, 19, 417 CrossRef.
-
(a) K. Mihara, T. Aoki, A. Moriguchi, H. Yamamoto, M. Maeda, N. Tojo, T. Yamanaka, M. Ohkubo, N. Matsuoka, J. Seki and S. Mutoh, Drug Dev. Res., 2004, 61, 233 CrossRef;
(b) K. Yamada and K. Tomioka, Chem. Rev., 2008, 108, 2874 CrossRef PubMed.
- N. Zohreh, S. H. Hosseini, M. Jahani, M. S. Xaba and R. Meijboom, J. Catal., 2017, 356, 255–268 CrossRef.
- H. Naeimi and M. Moradian, Tetrahedron: Asymmetry, 2014, 25, 429–434 CrossRef.
- L. Liu, X. Tai, N. Zhang, Q. Meng and C. Xin, React. Kinet., Mech. Catal., 2016, 119, 335–348 CrossRef.
- Y. Ju, C. J. Li and R. S. Varma, QSAR Comb. Sci., 2004, 23, 891–894 CrossRef.
- M. Gholinejad, R. Khezri, S. Nayeri, R. Vishnuraj and B. Pullithadathil, Mol. Catal., 2022, 530, 112601 Search PubMed.
- M. Karkeabadi, F. Nemati, A. Elhampour and H. T. Nahzomi, React. Kinet. Mech. Catal., 2019, 126, 265–282 CrossRef.
- A. Bukowska, K. Bester, M. Pytel and W. Bukowski, Catal. Lett., 2021, 151, 422–434 CrossRef CAS.
- Y. Zhao and Q. Song, Org. Chem. Front., 2016, 3, 294–297 RSC.
- M. Nikkhoo, M. Amini, S. M. F. Farnia, G. R. Mahdavinia, S. Gautam and K. H. Chae, J. Inorg. Organomet. Polym. Mater., 2018, 28, 2028–2035 CrossRef CAS.
- R. Singha, D. Brahman, B. Sinha, P. Ghosh and J. Asian, Green Chem., 2021, 5, 91–110 CAS.
- Z. Zarei and B. Akhlaghinia, RSC Adv., 2016, 6, 106473 RSC.
- B. Sreedhar, A. S. Kumar and P. S. Reddy, Tetrahedron Lett., 2010, 51, 1891–1895 CrossRef CAS.
- V. A. Peshkov, O. P. Pereshivko and E. V. V. Eycken, Chem. Soc. Rev., 2012, 41, 3790–3807 RSC.
- M. Nasrollahzadeh, M. Sajjadi, F. Ghorbannezhad and S. M. Sajadi, Chem. Rec., 2018, 18, 1–66 CrossRef.
- K. Layek, R. Chakravarti, M. L. Kantam, H. Maheswaran and A. Vinu, Green Chem., 2011, 13, 2878 RSC.
- I. Jesin and G. C. Nandi, Eur. J. Org Chem., 2019, 16, 2704–2720 CrossRef.
- M. Frisch, G. Trucks, H. B. Schlegel and et al., Gaussian 16, Gaussian, Inc., Wallingford, CT, 2016 Search PubMed.
- M. P. Andersson and P. Uvdal, J. Phys. Chem. A, 2005, 109, 2937–2941 CrossRef CAS.
- O. Trott and A. J. Olson, J. Comput. Chem., 2010, 31, 455–461 CrossRef CAS PubMed.
- N. M. O'Boyle, M. Banck, C. A. James, C. Morley, T. Vandermeersch and G. R. Hutchison, J. Cheminform., 2011, 3, 33 CrossRef.
- V. Arjunan, L. Devi and R. Subbalakshmi, et al., Spectrochim. Acta, Part A, 2014, 130, 164–177 CrossRef CAS PubMed.
- S. Fettach, F. Z. Thari and Z. Hafidi, et al., J. Biomol. Struct. Dyn., 2022, 40, 8340–8351 CrossRef CAS.
- O. A. El-Gammal, T. H. Rakha, H. M. Metwally and G. M. Abu El-Reash, Spectrochim. Acta, Part A, 2014, 127, 144–156 CrossRef CAS.
- S. Xue, P. Wu, L. Zhao, Y. Nan and W. Lei, Prog. Chem., 2022, 34, 2686–2699 CAS.
- D. S. Patil, S. A. Pawar, S. H. Lee and J. C. Shin, J. Electroanal. Chem., 2020, 862, 114012 CrossRef CAS.
- P. Gogoi, S. Hazarika and P. Barman, Sci. Rep., 2015, 5, 13873 CrossRef PubMed.
- T. K. Saha and R. Das, ChemistrySelect, 2018, 3, 12206–12228 Search PubMed.
- S. Lee, A. Tran and M. Allsopp, et al., J. Phys. Chem. B, 2014, 118(2), 547–556 CrossRef CAS.
- K. Vanommeslaeghe, E. Hatcher and C. Acharya, et al., J. Comput. Chem., 2010, 31(4), 671–690 CrossRef CAS.
- K. Vanommeslaeghe and A. D. MacKerell Jr., J. Chem. Inf. Model., 2012, 52(12), 3144–3154 CrossRef CAS PubMed.
- B. Sharma, D. Bhattacherjee and G. V. Zyryanov, et al., J. Biomol. Struct. Dyn., 2022, 1–13 Search PubMed.
- K. Sarkar, S. Nandi and R. K. Das, et al., J. Biomol. Struct. Dyn., 2023, 1–14 Search PubMed.
- P. Das, et al., Vegetos, 2023, 36, 1–13 CrossRef.
- P. Das, et al., Z. Naturforsch. C, 2025, 80 Search PubMed.
- M. S. Reza, et al., Biomed. Pharmacother., 2020, 132, 110942 CrossRef CAS.
- N. Oliyaei, et al., Food Sci. Nutr., 2021, 9, 3521–3529 CrossRef CAS PubMed.
- K. Ghatani, et al., Front. Microbiol., 2022, 13, 909987 CrossRef.
- U. Rashid, M. R. Khan and M. Sajid, J. Ethnopharmacol., 2019, 242, 112038 CrossRef CAS.
- P. Das, et al., Phytochem. Anal., 2022, 33, 1018–1027 CrossRef CAS PubMed.
- B. Dineshkumar, A. Mitra and M. Manjunatha, Int. J. Green Pharm., 2010, 4(2), 115–121 CrossRef.
- M. N. Wickramaratne, J. Punchihewa and D. Wickramaratne, BMC Complementary Altern. Med., 2016, 16, 1–5 Search PubMed.
- M. Kazeem, J. Adamson and I. Ogunwande, BioMed Res. Int., 2013, 2013(1), 527570 CAS.
- A. Bhatnagar and A. Mishra, Natural Products as Enzyme Inhibitors: an Industrial Perspective, Springer, 2022, 269–283 Search PubMed.
- S. A. Nabi, et al., BMC Complementary Altern. Med., 2013, 13, 1–9 CrossRef PubMed.
- R. Sahu, et al., Food Chem. Adv., 2023, 3, 100484 CrossRef.
- E. Papachristoforou, et al., J. Diabetes Res., 2020, 2020(1), 7489795 Search PubMed.
- S. Vikhe, R. Kunkulol and D. Raut, J-AIM., 2022, 13, 100618 Search PubMed.
- D. M. Mori, et al., Biotechnol. Appl. Biochem., 2003, 38, 183–191 CrossRef CAS.
- I. Mardianov, M. Balabolkin and D. Markov, Ter. Arkh., 2000, 72, 55–58 Search PubMed.
- A. Eidi, M. Eidi and R. Darzi, Phytother Res., 2009, 23, 347–350 CrossRef CAS PubMed.
- M. M. Anwar and A. R. M. Meki, Comp. Biochem. Physiol. A, 2003, 135, 539–547 CrossRef.
- R. B. Goldberg, Diabetes Care, 1981, 4, 561–572 CrossRef CAS.
- P. Bagri, et al., Food Chem. Toxicol., 2009, 47, 50–54 CrossRef CAS PubMed.
- C. Chen, et al., Food Funct., 2016, 7, 530–539 RSC.
- R. Chandran, et al., Biomed. Pharmacother., 2017, 95, 167–174 CrossRef CAS.
- R. Chandran, et al., Biomed. Pharmacother., 2016, 82, 547–554 CrossRef CAS.
- A. Naik, et al., J. Tradit. Complement. Med., 2022, 12, 269–280 CrossRef CAS.
- K. Arunachalam and T. Parimelazhagan, J. Ethnopharmacol., 2013, 147, 302–310 CrossRef PubMed.
|
| This journal is © The Royal Society of Chemistry 2025 |
Click here to see how this site uses Cookies. View our privacy policy here. 
 Open Access Article
 This Open Access Article is licensed under a Creative Commons Attribution-Non Commercial 3.0 Unported Licence
 *a
*a


