
 Open Access Article
 This Open Access Article is licensed under a Creative Commons Attribution-Non Commercial 3.0 Unported Licence
Experimental and theoretical investigations into green approach steel corrosion inhibition performance of an aqueous mixture of Olea europaea and Ficus carica leaves extract in acid medium†
Halima Rahmounia,
Soraya Nigri *b,
Rabah Oumeddourb,
Abdelkrim Guendouzic,
Alaeddine Berkanec,
Mouna Nacefb and
Abed M. Affouneb
*b,
Rabah Oumeddourb,
Abdelkrim Guendouzic,
Alaeddine Berkanec,
Mouna Nacefb and
Abed M. Affouneb
aLaboratory of Applied Chemistry (LCA), Université 8 Mai 1945 Guelma, B.P. 401, Guelma, Algeria
bLaboratoire d'Analyses Industrielles et Génie des Matériaux, Université 8 Mai 1945 Guelma, B.P. 401, Guelma, Algeria. E-mail: nigri.soraya@univ-guelma.dz; nigri_s@yahoo.fr
cLaboratory of Chemistry, Synthesis, Properties and Applications. (LCSPA). University of Saida, Algeria
First published on 16th June 2025
Abstract
The leaves of Ficus carica and Olea europaea L., by-products of tree pruning, are rich sources of bioactive compounds. Recycling this biomass is a significant step toward developing a circular economy model and promoting sustainability. In this study, steel corrosion inhibition was achieved using an aqueous 1![[thin space (1/6-em)]](https://www.rsc.org/images/entities/char_2009.gif) :1 mixture of olive and fig leaf extracts in 1 M hydrochloric acid at various temperatures. Electrochemical impedance spectroscopy (EIS), potentiodynamic polarization, and gravimetric measurements were employed to evaluate the inhibitory efficacy, adsorption mechanism, and action mode of this green inhibitor. Thermodynamic analysis and adsorption isotherms provided insights into the adsorption mechanism. The formation of an anti-corrosion layer on the steel surface was confirmed using UV-visible spectroscopy, FTIR, and FTIR second derivative spectra. Additionally, XRD and SEM techniques were utilized to examine the steel surface morphology. To further understand the adsorption capacity and behavior of active phytochemicals in the olive and fig leaf extract mixture on the mild steel surface, density functional theory (DFT) calculations and molecular dynamics (MD) simulations were performed. The findings indicate that the aqueous blend of fig and olive leaf extracts holds great promise as a sustainable alternative to synthetic corrosion inhibitors in industrial applications.
:1 mixture of olive and fig leaf extracts in 1 M hydrochloric acid at various temperatures. Electrochemical impedance spectroscopy (EIS), potentiodynamic polarization, and gravimetric measurements were employed to evaluate the inhibitory efficacy, adsorption mechanism, and action mode of this green inhibitor. Thermodynamic analysis and adsorption isotherms provided insights into the adsorption mechanism. The formation of an anti-corrosion layer on the steel surface was confirmed using UV-visible spectroscopy, FTIR, and FTIR second derivative spectra. Additionally, XRD and SEM techniques were utilized to examine the steel surface morphology. To further understand the adsorption capacity and behavior of active phytochemicals in the olive and fig leaf extract mixture on the mild steel surface, density functional theory (DFT) calculations and molecular dynamics (MD) simulations were performed. The findings indicate that the aqueous blend of fig and olive leaf extracts holds great promise as a sustainable alternative to synthetic corrosion inhibitors in industrial applications.
1. Introduction
Acid solutions are commonly used in various industrial processes, such as petrochemical operations, oil well stimulation, pickling, and acid cleaning. However, the use of acids can cause harmful effects on metal surfaces. To reduce metal degradation and dissolution during these treatments, the application of an inhibitor is essential.1,2 Using plant extracts as green inhibitors has drawn a lot of interest due to their numerous advantageous traits, which include their abundance in nature, renewable resources, low cost, and efficient corrosion inhibition.3,4 These plant extracts contain a staggering amount of valuable chemicals, including molecules with multiple polar atoms and electron-rich bonds such as natural antioxidants, minerals, vitamins, phenolic compounds, alkaloids, and flavonoids. This can successfully create protective shields against aggressive media.5–9 Olive (Olea europaea L.) and Ficus carica leaves are among the most abundant sources of polyphenols and antioxidant molecules. On these grounds, they are frequently used in the medical field. Their leaves have attracted the attention of several researchers, who have employed them in a variety of research areas as antioxidants,10,11 antimicrobials,12,13 anticancer agents,14,15 anti-inflammatory agents,16,17 antibacterial agents18,19 and antidiabetic agents.20,21 Synergistic biological effects with stronger improvements have been reported when different phenolic compounds or extracts are combined, compared with the single treatments.22,23 Ali A. Abeed et al.24 looked into the antibacterial activity of Olea europaea L. and Ficus carica leaves ethanolic extracts, separately and synergistically, against a standard Methicillin-resistant Staphylococcus aureus. While aqueous leaf extracts of olive and fig were investigated for their antibacterial activities against three bacterial strains: Staphylococcus aureus, Escherichia coli, and Pseudomonas aeruginosa, and the use of these extracts together induced synergism, and it was beneficial in developing novel antibiotics from natural, inexpensive sources to overcome bacterial resistance.25 In order to increase the shelf life of pasteurized milk, El Dessouky Abdel-Aziz et al.26 tested aqueous Ficus carica leaf extract, olive leaf extract, and their mixture. The combination of the two extracts provides an efficient and safe method to prolong the shelf life of pasteurized milk. Numerous investigations were conducted to look into the possibility of employing olive and fig leaf extracts as corrosion inhibitors. Aqueous olive leaf extracts were studied as green corrosion inhibitors for β-Brass alloy,27 zinc28 in acidic medium, copper29,30 in NaCl medium, and steel in a variety of media including 1 M and 2 M HCl,31,32 10% sulfamic acid,33 alkaline CaCl2 brine,34 in CO2-saturated chloride carbonate solution.35 Selaimia Radia et al. looked into the efficiency of using an extract of methanolic olive leaves to prevent steel from corroding in a solution of 1 M hydrochloric acid.36 Alkaloids, flavonoids, and tannins found in Ficus carica leaf extracts37,38 may be a useful source for inhibiting corrosion. In acidic medium, it was utilized as a corrosion eco-friendly inhibitor for zinc,28 aluminum,37 and brass.39 For inhibition corrosion of steel, alcoholic Ficus carica leaves extracts were utilized in various media, including petroleum-based medium,40 0.5 M sulfuric acid.41 However, aqueous Ficus carica leaf extract was employed as a mild steel inhibitor in 3.5% aqueous sodium chloride solution saturated with CO2,42 in 2 M HCl,43 and in 1 M HCl.44 The aqueous extracts are favored over organic extracts due to their greater affinity to metallic surfaces and higher polar phytochemical content when compared to nonpolar phytochemicals found in organic extracts.45 This study set out to assess the abilities of a mixture of olive and Ficus carica leaf extract to operate as green corrosion inhibitors for steel in 1 M HCl. The efficiency of corrosion inhibition was studied using electrochemical impedance spectroscopy, potentiodynamic polarization curves, and the gravimetric method. Kinetic and thermodynamic parameters were also established. Tests using FTIR, FTIR Derivative, UV-VIS, SEM, and XRD were performed for characterization. The design and development of inhibitors heavily depend on having a thorough understanding of how they interact with metal surfaces under various corrosive conditions. A detailed and careful study using DFT and MD simulations was carried out to explain the behavior of adsorption of the active phytochemicals in the extract of olive and fig leaves on the mild steel surface. To illustrate the simulation results, five compounds: Oleuropein, Luteolin-7-O-glucoside, Hydroxytyrosol, Psoralen, and Bergapten were selected as representatives of active phytochemicals in OFLE.2. Materials and methods
2.1. Materials preparation
The chemical compositions of the mild steel used in this experiment are as follows: 0.1% C, 0.29% Mn, 0.04% Si, 0.004% P, 0.005% S, 0.07% Al, 0.034% Cu, 0.007% Cr, 0.011% Ni, and the rest is Fe. Mild steel specimens and the corrosive medium were prepared according to the methodology reported in our previous work,44 with detailed procedures provided in the ESI.† Locally, olive and fig leaves were picked, detached from the stalk, carefully washed with tap water, and then allowed to dry for three weeks in a well-ventilated, shaded area. The dry leaves were ground into a fine powder using an electric grinder.A mixture consisting of 25 g of olive leaf powder and 25 g of fig leaves was combined with 500 mL of distilled water and stirred continuously at 40 °C for 3 hours. The resulting suspension was then subjected to ultrasonic treatment for 30 minutes, followed by filtration. The recovered filtrate was collected, stored in a sealed container, and refrigerated for subsequent use as a corrosion inhibitor.44 The concentrations of OFLE varied from 0.05 to 0.25 V/V.
2.2. Electrochemical measurements
Electrochemical measurements, including potentiodynamic polarization curves and electrochemical impedance spectroscopy (EIS), were performed using a VersaSTAT 3 potentiostat/galvanostat (Princeton Applied Research, AMETEK, USA). These measurements were conducted in a glass cell containing the electrolyte and three electrodes. The reference electrode was an Ag/AgCl electrode, while the auxiliary electrode was a platinum wire. The working electrode consisted of a mild steel sample, which was mechanically polished to achieve a glossy finish.After two rounds of washing with ethanol and distilled water, the steel samples were dried and stored until use. A 1 cm2 area of the sample was exposed to the corrosive solution. Before conducting the experiments, the electrodes were immersed in the corrosive solution to allow the system to reach a stable open-circuit potential (OCP). EIS tests were carried out at OCP within a frequency range of 10 kHz to 5 mHz, using an amplitude of 10 mV. The EIS data were analyzed using ZView software. Potentiodynamic polarization curves were obtained by scanning the potential from −250 mV to +250 mV relative to OCP, at a scanning rate of 5 mV s−1.
The inhibition efficiency (IEEIS%) was calculated using the following eqn (1).
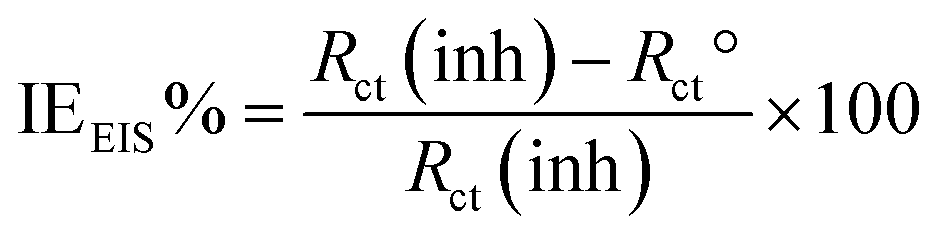 | (1) |
Rct° and Rct (inh) represent the charge transfer resistance without and with the OFLE.
The potentiodynamic polarization curves were employed to calculate inhibition efficacy (IEp%) and polarization resistance (Rp) using the following eqn (2) and (3), respectively:
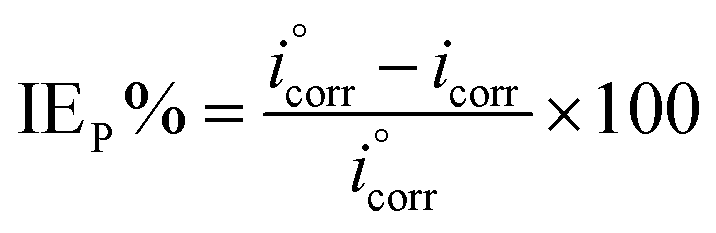 | (2) |
 | (3) |
2.3. Weight loss method
Gravimetric tests were conducted in 1 M HCl, both in the absence and presence of varying concentrations of OFLE, for a duration of four hours at different temperatures (298 K, 308 K, 318 K, 328 K, and 338 K). The corrosion rate (CR) in mg cm−2 h−1 and the inhibition efficiency percentage (IE%) were calculated using eqn (4) and (5), respectively.
 | (4) |
 | (5) |
All the experiments were performed in triplicate sets to get precise results, and standard deviations were estimated.
2.4. UV-visible and FTIR spectra acquisition
A Shimadzu UV-1800 spectrophotometer, equipped with UV Probe software version 2.4, was used to analyze the electronic transitions. The UV-visible spectra of OFLE in 1 M HCl were recorded before and after immersion of the mild steel samples in the test solution.FTIR spectra of the powdered leaves and the corroded layer formed on the steel surface were obtained using a PerkinElmer Spectrum One spectrophotometer. The spectra were recorded over a wavenumber range of 4000–450 cm−1, with a resolution of 4 cm−1.
2.5. Scanning electron microscope (SEM) and XRD analysis
A TESCAN VEGA3 scanning electron microscope (SEM) equipped with energy dispersive spectroscopy (EDS) was used to examine the surface morphology of mild steel, both in the absence and presence of inhibitors. The layer formed on the mild steel surface in uninhibited and inhibited acid solutions was analyzed using an X-ray diffractometer (Rigaku Ultima IV) with CuKα radiation (λ = 0.15405 nm). Diffraction patterns were recorded over a 2θ range of 10°–90° at a scan rate of 5° min−1.2.6. DFT and molecular dynamics
The active phytochemicals in the extract of a mixture of olive46 and fig leaves,47 selected for theoretical investigation, include Oleuropein, Luteolin-7-O-glucoside, Hydroxytyrosol, Psoralen, and Bergapten. The geometric structures of these five compounds were fully optimized without any constraints using the density functional theory (DFT) method. This was performed with the Hybrid B3LYP-D3 (Becke, three-parameter, Lee, Yang, and Parr)48,49 functional, which incorporates dispersion corrections to accurately model non-covalent interactions, along with the DZP basis set.50–56All properties were calculated using the ADF-2023 software package.57 The electronic chemical potential (μ), chemical hardness (η), global electrophilicity (ω), and Fukui index were determined using specific equations.58
For a deeper exploration of the interaction between all compound structures and the Fe surface, molecular dynamics simulations were conducted using GROMACS 2023-GPU software.59 Initially, diverse ligands' optimized structures were generated via ADF60 with the B3LYP/TZP basis set, then placed at a 3 Å distance on the Fe (110) surface. The creation of Fe (110) surfaces was facilitated using the CHARMM-GUI/Nanomaterial Modeler online web server.
The topology of all optimized structures of compounds has been created using the Swiss Param, an online server and CHARMM36-2019 force field that was applied at all steps of molecular dynamics using GROMACS.59 The topology of the optimized compound structures was generated using the CHARMM36-2019 force field, employing Swiss Param, an online server. This force filed was then consistently applied throughout all stages of molecular dynamics simulations conducted using GROMACS.59
The system was solvated using the original TIP3P water model in a rectangular box of dimensions (6 × 6 × 3) Å. Simulations were conducted at a constant pressure of 1 bar and a temperature of 298.15 K. The energy of the aqueous solution was minimized using the steepest descent algorithm, followed by a 2 ns simulation in an NVE ensemble. Subsequently, an additional 2 ns simulation was carried out in both the NVT and NPT ensembles to stabilize the system density.
The Verlet leap-frog method was employed as the integration algorithm, with a time step of 2 fs. Non-bonding interactions were considered in all three dimensions of the simulation box. The all-atom optimized potentials for the simulations (CHARMM36) force fields were used to describe the interaction between atoms.
All visualization tasks were conducted by Visual Molecular Dynamics (VMD).61
3. Results and discussion
3.1. Electrochemical techniques
 | ||
| Fig. 1 OCP plots of mild steel with and without various concentrations of OFLE. | ||
Fig. 2 presents the Nyquist plots of mild steel in 1 M HCl with and without various concentrations of OFLE. All Nyquist graphs exhibit a single capacitive semicircular loop, indicating that mild steel corrosion in this system is governed by a charge transfer mechanism.63 Notably, the Nyquist curves maintain their original shape while their diameters increase with higher OFLE concentrations, suggesting that OFLE does not alter the corrosion process itself. Instead, the increase in diameter can be attributed to the adsorption of OFLE molecules at the metal/electrolyte interface.63 The imperfect shape of the semicircular loops is likely due to surface dislocation, roughness, or the adsorption of OFLE molecules.64
 | ||
| Fig. 2 Electrochemical Nyquist plots for mild steel in the presence and absence of OFLE at various concentrations. | ||
Bode-modulus plots in Fig. 3 reveal higher values of log|Z| at lower frequencies as the OFLE concentration increases. A strong linear correlation (R2 > 0.99) was observed between log|Z| and log frequency, with slopes of −0.71 and −0.65. These findings are typically associated with frequency dispersion of interfacial impedance.65
 | ||
| Fig. 3 Bode and phase diagrams of OFLE. | ||
According to the Bode-phase graphs in Fig. 3, there is a single phase peak at mid-frequencies, indicating one time constant for the EIS measurements and the presence of a single constant phase element (CPE) at the metal/solution interface.66 In the presence of OFLE, the phase angles shift to more negative values, with a phase angle of approximately −60° for the blank solution and values ranging from −67° to −75° for the inhibited solution. This further confirms the occurrence of frequency dispersion.67 The larger peak heights observed at higher inhibitor concentrations indicate a strong capacitance response.68
To model the impedance spectrum data, a simple equivalent circuit (Fig. 4) was constructed. The circuit includes the solution resistance (Rs), the charge transfer resistance (Rct), and a constant phase element (CPE) to account for surface imperfections. The double-layer capacitance (Cdl) value, calculated using (eqn (6)), is influenced by these imperfections. The CPE, modeled using (eqn (7)), simulates this effect.69
|
Cdl = (Q × R1−nct)1/n
| (6) |
| ZCPE = Q−2(jω)−n | (7) |
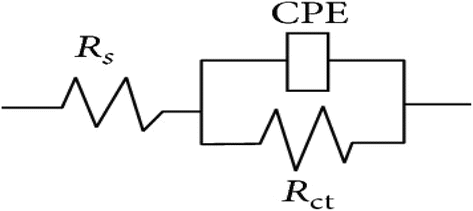 | ||
| Fig. 4 Equivalent electrochemical circuit for EIS study adjustment. | ||
| C (mL mL−1) | Rct (Ω.cm2) | Q × 10−4 (Ω−1 cm−2 sn) | n | Cdl (μF cm−2) | −s | R2 | −α | τ (s) | χ2 | IEEISa (%) |
|---|---|---|---|---|---|---|---|---|---|---|
| a Mean value and all standard deviations < 2. | ||||||||||
| 0.00 | 61.5 | 3.6217 | 0.78 | 125 | 0.67 | 0.9802 | 61 | 7.68 | 0.012 | — |
| 0.05 | 531 | 1.3045 | 0.78 | 62 | 0.67 | 0.9974 | 69 | 32.92 | 0.026 | 88 |
| 0.10 | 602.7 | 1.7206 | 0.76 | 87 | 0.69 | 0.9981 | 68 | 52.43 | 0.017 | 90 |
| 0.15 | 659.3 | 1.6322 | 0.76 | 84 | 0.66 | 0.9991 | 75 | 55.38 | 0.015 | 91 |
| 0.20 | 917 | 1.1146 | 0.79 | 65 | 0.65 | 0.9980 | 68 | 59.60 | 0.006 | 93 |
| 0.25 | 1189 | 1.0079 | 0.79 | 59 | 0.71 | 0.9989 | 70 | 70.15 | 0.0007 | 95 |
The fitted Nyquist plots closely matched the experimental data, and the quality of the fit was evaluated using the chi-square (χ2). A low χ2 value in the range of 0.0007 to 0.026 was obtained, confirming the high accuracy of the equivalent circuit model and the reliability of the fitted electrochemical parameters.
From Table 1, it can be seen that the simulated charge-transfer resistance (Rct) increases, and hence the inhibition efficiency increases, with increasing inhibitor concentration. This is confirming once more the formation of an inhibitory protective layer on the metal surface, resulting in improved stability of the metal in the 1 M HCl solution containing OFLE compared to the blank solution. Additionally, the n values (0.76–0.79) are near to 1 indicate that the interface is capacitive.70,71 The inhomogeneity of the surface is explained by this factor72 caused by the roughness of the steel surface, the distribution of the active sites, metal dissolution, and the adsorption of inhibitor molecules on the metal surface.73 The double layer between the charged metal surface and the solution is considered as an electrical capacitor. The Cdl decrease clearly with the increase of OFLE concentration. This decrease in Cdl indicated that the previously absorbed water molecules with large dielectric constants were replaced by the larger inhibitor molecules with lower dielectric constants.74 According to Helmholtz model, given by eqn (8),75 the decreasing trend of Cdl directly explains that the adsorption film on the metal surface thickens with the increase of the concentration of corrosion inhibitor.
 | (8) |
The observed increase in double-layer capacitance (Cdl) at the concentration of 0.10 mL mL−1, despite a concurrent rise in charge transfer resistance (Rct), deviates from the typical inverse correlation between these parameters. This behavior may be attributed to the formation of a partially adsorbed or porous inhibitor film, which does not fully block access of water or ions to the metal surface, thus maintaining or increasing the capacitance. Additionally, it is possible that the active compounds undergo molecular rearrangement or reorientation at this concentration (eg: changing from a flat to perpendicular orientation on the metal surface), altering the dielectric properties or thickness of the electrical double layer. Another plausible explanation could be the onset of molecular aggregation in the solution, reducing the number of inhibitor molecules available for adsorption. As a result, while the film still impedes charge transfer to some extent (increased Rct), it fails to significantly reduce the surface's capacitive behavior.77
Based on the Cdl values, the relaxation time (τ) can be calculated using the following eqn (9).78,79
| τ = Cdl × Rct | (9) |
The obtained values of the relaxation time constant τ increase with a decrease in the Cdl values as different amounts of OFLE are added. For instance, the relaxation time (τ) increases by 85% while the capacitance (Cdl) value decreases by 30% when the OFLE concentration is increased from 0% (blank solution, 1 M HCl) to 10% of OFLE in the corrosive medium. This indicates a reduction in the discharge and charge to the steel/solution interface, and the inhibition efficiency rises to 90%. Additionally, the increase in the relaxation time constant with extract concentration suggests that the adsorption process is taking longer and that the protective layer is becoming more stable.66 The inhibition efficiency increases with the extract concentration, varying from 88% to 95%.
 | ||
| Fig. 5 Potentiodynamic polarization curves of steel in the presence and absence of various concentrations of OFLE. | ||
| C (mL mL−1) | Ecorr (V vs. Ag/AgCl) | icorr (mA cm−2) | βc (V dec−1) | βa (V dec−1) | Rp | IEPa (%) | IERpa (%) |
|---|---|---|---|---|---|---|---|
| a Mean value and all standard deviations < 1.5. | |||||||
| 0.00 | −0.401 | 0.291 | 0.1121 | 0.0639 | 60.73 | — | — |
| 0.05 | −0.393 | 0.043 | 0.1720 | 0.0649 | 476.65 | 85 | 87 |
| 0.10 | −0.380 | 0.035 | 0.1752 | 0.0584 | 543.4 | 88 | 89 |
| 0.15 | −0.390 | 0.038 | 0.1684 | 0.0667 | 545.93 | 87 | 89 |
| 0.20 | −0.384 | 0.038 | 0.1737 | 0.0630 | 528.28 | 87 | 89 |
| 0.25 | −0.384 | 0.025 | 0.1549 | 0.0619 | 768.15 | 91 | 92 |
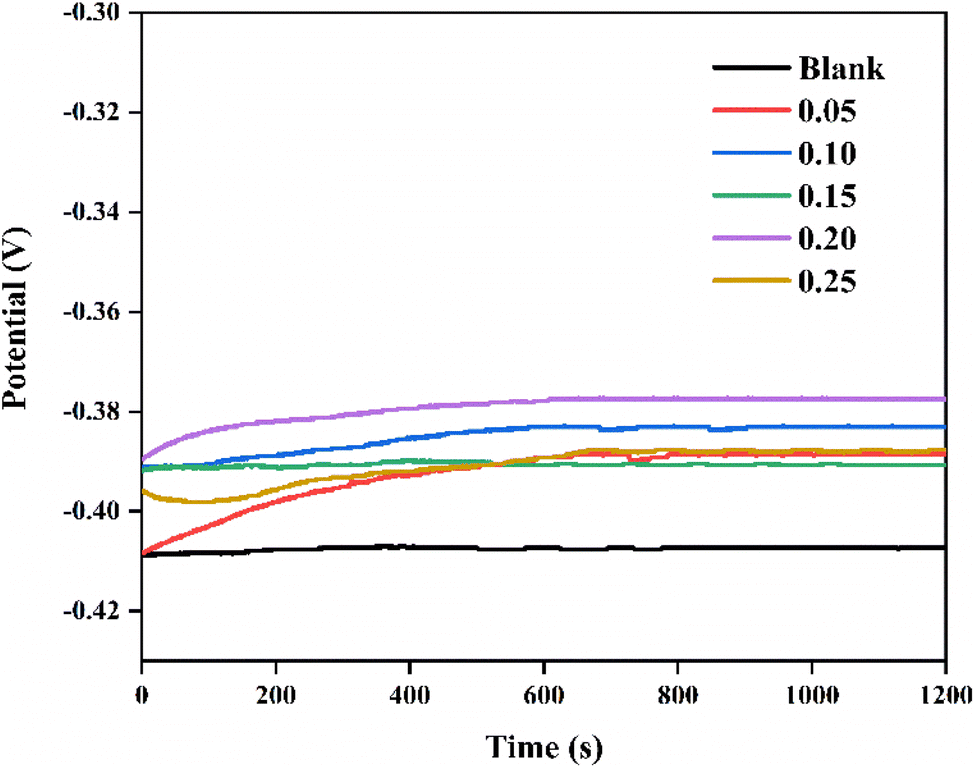
Fig. 5 demonstrates that the presence of OFLE reduces both cathodic and anodic current densities, with optimal inhibitory efficiency observed at 0.25 mL mL−1 of OFLE. This indicates a slowdown in the cathodic hydrogen evolution reaction and a decrease in the anodic dissolution of mild steel. Additionally, as Ecorr shifts to more positive values, the steel becomes nobler. The data further confirm that OFLE is a mixed-type inhibitor, as the change in Ecorr value is less than 85 mV.80–82 An uneven pattern in the values of βc and βa suggests that mechanisms beyond adsorption, such as the presence of species or anions in the solution, contribute to corrosion inhibition.83–85 Moreover, the presence of OFLE increased Rp values. These findings align with the results of the polarization measurements and EIS analysis.
3.2. Weight loss measurements
 | ||
| Fig. 6 Diagram depicting inhibitory efficiency as a function OFLE concentrations at various temperatures. | ||
The corrosion process activation parameters were calculated using Arrhenius eqn (10).
 | (10) |
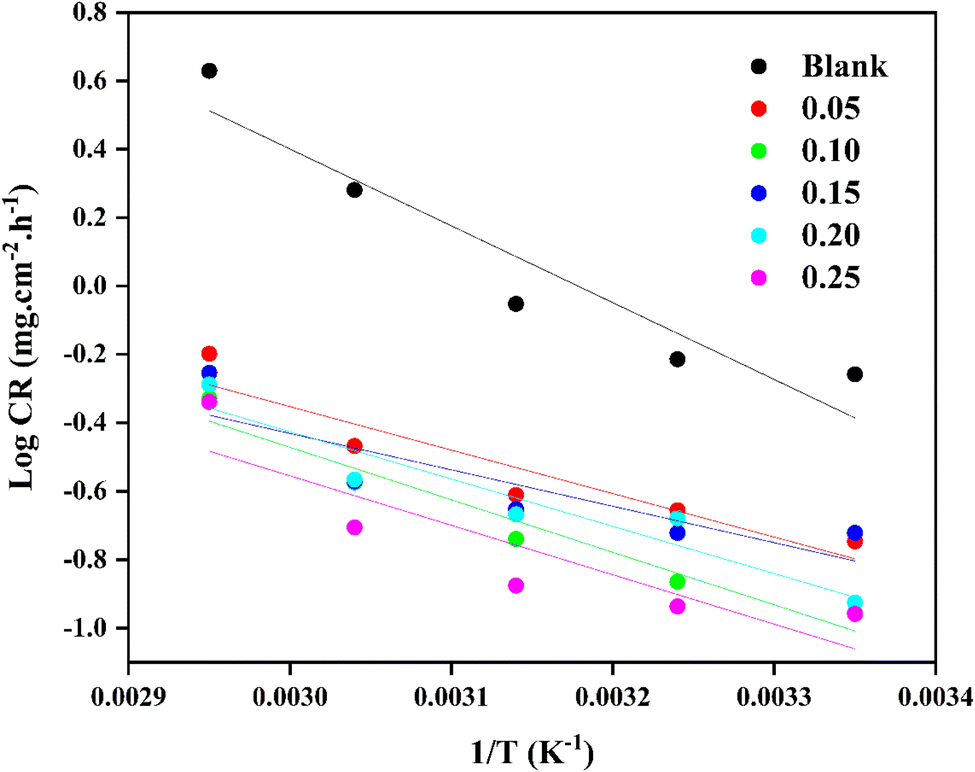 | ||
| Fig. 7 The Arrhenius plot with and without various OFLE concentrations. | ||
| C (mL mL−1) | Ea (kJ mol−1) | ΔHa (kJ mol−1) | Ea − ΔHa (kJ mol−1) | −ΔSa (J mol−1 K−1) |
|---|---|---|---|---|
| 0.00 | 43.02 | 40.40 | 2.62 | 116.95 |
| 0.05 | 17.94 | 15.32 | 2.62 | 193.86 |
| 0.10 | 19.80 | 17.18 | 2.62 | 196.38 |
| 0.15 | 8.03 | 5.41 | 2.62 | 161.16 |
| 0.20 | 13.99 | 11.37 | 2.62 | 179.09 |
| 0.25 | 15.65 | 13.03 | 2.62 | 181.73 |
At 0.25 mL mL−1, the inhibitor may achieve strong chemisorption onto the metal surface, forming a stable chemical bond that effectively prevents the interaction between corrosive species and the substrate. Once this chemisorbed layer is established, the metal surface becomes passivated, and the corrosion reaction proceeds at a much slower rate. Consequently, the apparent activation energy for the remaining corrosion process may be lower not because the inhibitor is less effective, but because the residual corrosion reactions require less energy due to the significantly reduced active area. Similar results were reported by Taleb H. Ibrahim in their investigation of the Ficus carcia leave extract as mild steel inhibitor in 3.5% aqueous sodium chloride solution saturated with CO2.42
The activation enthalpy (ΔHa) and activation entropy (ΔSa) of the system can be determined using the transition state eqn (11):
 | (11) |
| Ea−ΔHa = R × T | (12) |
 | ||
| Fig. 8 Transition state plots for mild steel in 1 M HCl in the absence and presence of different OFLE concentrations. | ||
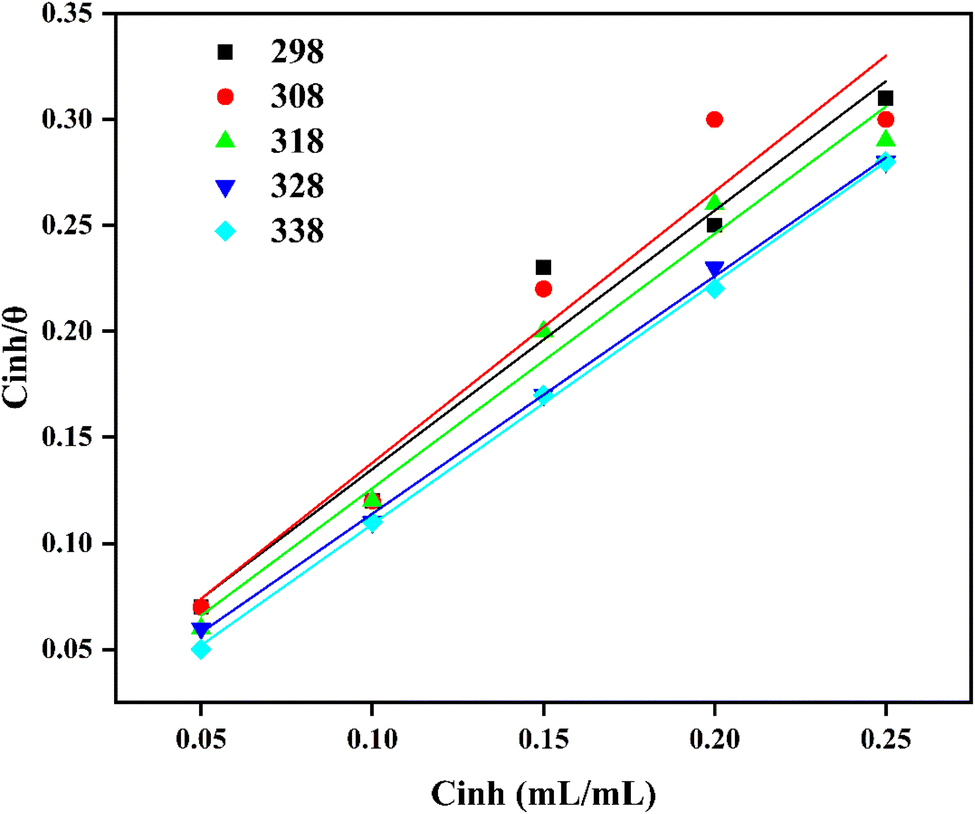 | ||
| Fig. 9 Calculated Langmuir isotherms using gravimetric measurements of OFLE at various temperatures. | ||
For various temperatures (298, 308, 318, 328, and 338 K), plotting (Ci/θ) vs. (Ci) yields linear lines with coefficients of determination that are close to unity. The line's intercept in Fig. 9 was used to calculate the equilibrium constant. It should be emphasized that OFLE molecules are strongly adsorbed on the steel surface, as evidenced by the increase in Kads values with increasing temperature33 (Fig. 10). In this context, the Langmuir adsorption coefficients obtained cannot be employed to calculate Gibbs free energy or enthalpy change in the adsorption processes for plant extracts with undefined composition and/or content.94 The inhibitory action is often attributed to the intermolecular synergy among the various components in natural extracts.95
 | ||
| Fig. 10 Kads versus temperature plot for OFLE. | ||
3.3. UV-VIS analysis results
UV-visible spectrophotometry is a valuable tool for visualizing characteristic absorption bands. Fig. 11 shows the absorption spectrum of OFLE solutions before and after immersing the metallic specimen in the corrosive medium (1 M HCl). From Fig. 11, a broad absorption peak appears between 200–233 nm before immersion, which corresponds to the π–π electron transition in the C![[double bond, length as m-dash]](https://www.rsc.org/images/entities/char_e001.gif) C bonds of the aromatic rings. Another peak at 324 nm is attributed to the n–π electron transition in the CO bonds present in various oxygen functional groups. After immersion, the absorption peak intensity noticeably decreases, indicating a reduction in the concentration of the active chemical compounds in OFLE due to their adsorption on the steel surface.94 The absorption peak associated with the π–π* electron transition is clearly defined at 212 nm. Additionally, changes in the shape of the spectrum in both direct and derivative modes, before and after immersion, suggest the formation of complexes between the OFLE compounds and iron cations.96,97
C bonds of the aromatic rings. Another peak at 324 nm is attributed to the n–π electron transition in the CO bonds present in various oxygen functional groups. After immersion, the absorption peak intensity noticeably decreases, indicating a reduction in the concentration of the active chemical compounds in OFLE due to their adsorption on the steel surface.94 The absorption peak associated with the π–π* electron transition is clearly defined at 212 nm. Additionally, changes in the shape of the spectrum in both direct and derivative modes, before and after immersion, suggest the formation of complexes between the OFLE compounds and iron cations.96,97
 | ||
| Fig. 11 UV-visible spectra of OFLE before (in black) and after immersion (in red) of steel in 1 M HCl. | ||
3.4. FTIR spectroscopy
In order to obtain qualitative data regarding the existence of organic molecules and their interactions with metallic surfaces, Fourier-transform infrared spectroscopy (FTIR) was used. Fig. 12 depicts all of the distinctive bands that correlate to the functional groups found in the powder of OFLP and the film formed on the metal surface (Fe-OFLE). In the inset the second derivative spectra in Fig. 12 are shown for comparison purposes. First of all, the Fe-OFLE spectrum exhibits all significant peaks found in OFLP, indicating that the majority of functional groups in OFLE are present in the adsorbed film. The FTIR characteristic wavenumbers range of (3700–3000 cm−1) corresponds to stretching vibrations of OH groups (from alcohols, phenols, carbohydrates) or the presence of NH functional groups from amides. Oleuropein and hydroxytyrosol, the two primary phenolic compounds present in olive leaves, show their hydroxyl groups in the same range at 3387–3225 cm−1 and 3339 cm−1, respectively.98 The symmetric and asymmetric CH stretching vibrations (υCH, alkyl) are responsible for two bands at 2936 in OFLP and at 2963 in Fe-OFLE and 2841 cm−1 (absent in Fe-OFLE). The absorption band located at 2338 cm−1 in OLFP and at 2304 cm−1 in Fe-OFLE is attributed to stretching vibrations of C![[triple bond, length as m-dash]](https://www.rsc.org/images/entities/char_e002.gif) N. The CC stretching vibrations of aromatic rings and the CO of esters, acids, and carboxylates correlate to the 1740–1580 cm−1 range. The band at 1320 cm−1 present in OLFP (absent in Fe-OFLE) corresponds to stretching vibrations C–O (amide) and C–C stretching from phenyl groups. The bands ranging from 1200 to 1100 cm−1 can be attributed to vibrations of OH deformation and stretching vibrations of C–O and C–N. The main cause of the strong bands at 1160 in OFLP and 1110 cm−1 in Fe-OFLE are the endocyclic and exocyclic C–O stretching vibrations of carbohydrates.97 Finally, aliphatic and aromatic C–H groups are represented by the absorption bands below 1000 cm−1. From spectra (Fig. 13), similarities between the powder's and the scraped film's FTIR spectra are visible, demonstrating that the extracts have adhered to the steel's surface. To identify and examine differences between the powdered leaf spectra and the film formed on the surface of the steel, second derivative spectra were employed. Spectra in second derivative mode demonstrated a shift in the bands attributed to the N–H, O–H, CO, C–O, CC, CN, and C–N groups; this confirms the adsorption of the protective layer generated by interactions between these functional groups and the metal surface's active sites.
N. The CC stretching vibrations of aromatic rings and the CO of esters, acids, and carboxylates correlate to the 1740–1580 cm−1 range. The band at 1320 cm−1 present in OLFP (absent in Fe-OFLE) corresponds to stretching vibrations C–O (amide) and C–C stretching from phenyl groups. The bands ranging from 1200 to 1100 cm−1 can be attributed to vibrations of OH deformation and stretching vibrations of C–O and C–N. The main cause of the strong bands at 1160 in OFLP and 1110 cm−1 in Fe-OFLE are the endocyclic and exocyclic C–O stretching vibrations of carbohydrates.97 Finally, aliphatic and aromatic C–H groups are represented by the absorption bands below 1000 cm−1. From spectra (Fig. 13), similarities between the powder's and the scraped film's FTIR spectra are visible, demonstrating that the extracts have adhered to the steel's surface. To identify and examine differences between the powdered leaf spectra and the film formed on the surface of the steel, second derivative spectra were employed. Spectra in second derivative mode demonstrated a shift in the bands attributed to the N–H, O–H, CO, C–O, CC, CN, and C–N groups; this confirms the adsorption of the protective layer generated by interactions between these functional groups and the metal surface's active sites.
 | ||
| Fig. 12 FTIR spectra of OFLP (in black), Fe-OFLE (in red) and corrosion products (in blue) adsorbed on mild steel. In the inset the second derivative spectra. | ||
 | ||
| Fig. 13 XRD pattern of the mild steel immersed in 1 M HCl solutions (a) without inhibitors, (b) with OFLE. | ||
The FTIR spectrum of the plate without inhibitor (in blue), after exposure to the corrosive medium, displays characteristic bands corresponding to corrosion products such as iron oxides and hydroxides. Notably, absorption bands around 3400 cm−1 (O–H stretching) and 1630 cm−1 (H–O–H bending) indicate the presence of surface-bound hydroxyl groups, while bands near 1100 cm−1 may be attributed to carbonate species formed during corrosion.
The differences observed in the FTIR spectra before and after the corrosion test can be attributed to the adsorption of organic compounds from the plant extract onto the steel surface during exposure to the acidic environment. In addition, acid hydrolysis of certain phytochemicals may occur under these conditions, resulting in the formation of new functional groups or degradation products. These transformation products may also become incorporated into the protective film.
UV-visible and electrochemical measurements were previously used to show that the OFLE compounds had adsorbed on the steel surface. FTIR and FTIR second derivative validate these conclusions.
3.5. XRD results
To determine the molecular crystal structure that developed on the metal surface dissolved in the corrosive medium (1 M HCl) in the presence and absence of OFLE, X-ray diffraction analysis was carried out and illustrated in Fig. 13. The Panalytical X'Pert HighScore program was used to identify all of the data related to the crystal structures (formula, hkl, crystal system, percentage, and reference) pertaining to each peak. A cubic iron peak (ref. code:01-087-0721) can be observed in the diagrams produced with and without OFLE (Fig. 13a and b) at 2θ = 44.7° (1 1 0), 64.9° (2 0 0), and 82.3° (2 1 1).99 Only the diagram of the uninhibited solution shows the distinctive peaks at 2θ = 19.7° (2 1 2), 22.7° (1 1 0), and 40.2° (2 0 0) that correspond to an orthorhombic iron oxide (Fe3O4, ref. code: 01-076-0958), a hexagonal iron chlorate hydrate (Fe(ClO4)2(H2O)6, ref. code: 01.083.1493), and a cubic iron oxide (FeO; ref. code: 01-079-1972), respectively. Two amorphous peaks appear at 2θ = 25.02° and 8.07° are observed only in the diagram in the presence of OFLE. These findings demonstrate that a protective film was formed on the surface of steel.3.6. Scanning electron microscope (SEM) results
The SEM images (Fig. 14) show the steel surface after being submerged for 4 hours in both uninhibited and inhibited 1 M HCl solutions. Fig. 14a exhibits a rough and severely damaged surface from fast corrosion attack in HCl. The extent of the damage is notably aggravated by the formation of microcracks and microcavities, which facilitate further corrosive attack.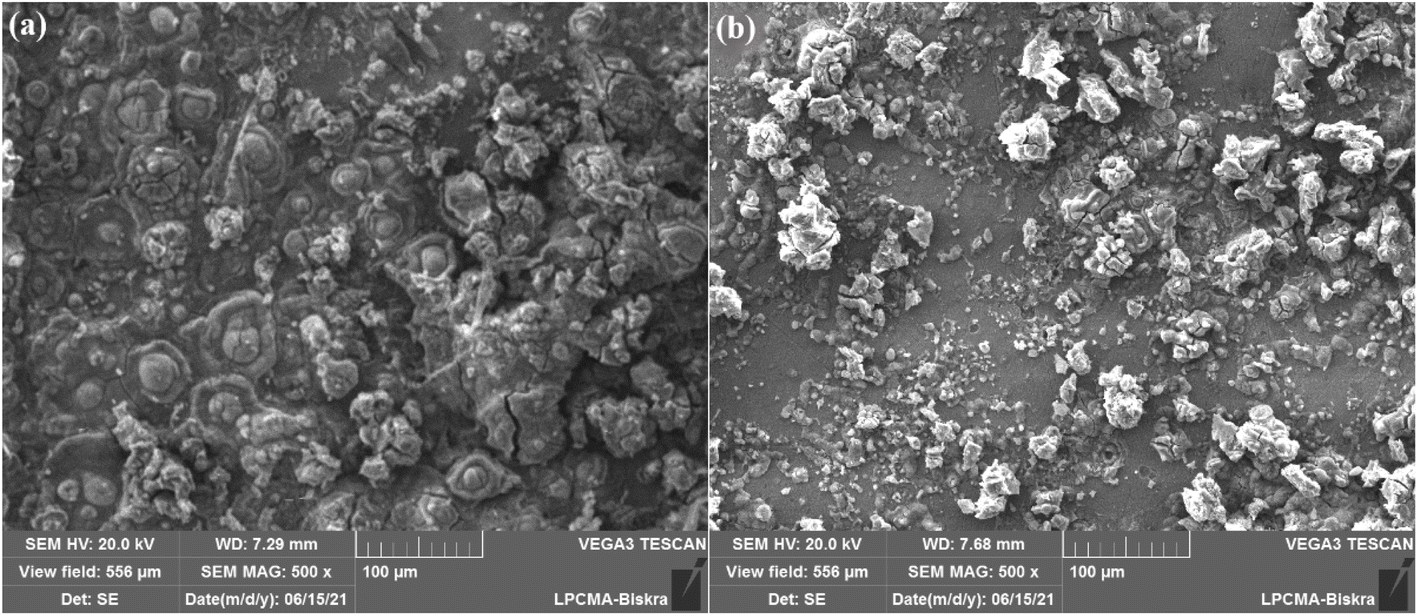 | ||
| Fig. 14 SEM morphologies of the mild steel immersed in 1 M HCl solutions (a) without (b) with OFLE. | ||
SEM observations indicate that the surface becomes smoother when OFLE is present (Fig. 14b), and the development of an inhibitory layer prevents the corrosive media from attacking. The adsorption of OFLE molecules may be the cause of the protective layer that formed on the metal surface.
3.7. DFT and molecular dynamics simulation
In computational chemistry, the HOMO (highest occupied molecular orbital) and LUMO (lowest unoccupied molecular orbital), collectively referred to as Frontier orbitals, are essential for understanding a molecule's electronic structure and reactivity.58 The frontier molecular orbitals (FMO) are two types: the highest occupied molecular orbital (HOMO) and lowest unoccupied molecular orbital (LUMO). The HOMO–LUMO energy gap (ΔE) serves as a crucial parameter for assessing chemical stability, reactivity, and electron conductivity. A smaller HOMO–LUMO energy gap signifies higher reactivity. A high gap indicates greater stability of the molecule and, therefore, low reactivity, and vice versa.The global chemical reactivity descriptors, including chemical potential (μ), electrophilicity index (ω), hardness (η), and softness (S), are derived from the HOMO–LUMO energy values are presented in Table 4 with the isosurface of the FMO in Fig. 15.
| Ligand | EHOMO | ELUMO | Gap | μ | η | S | Ω |
|---|---|---|---|---|---|---|---|
| Hydroxytyrosol | −6.229 | −0.557 | 5.67 | −3.39 | 2.84 | 0.35 | 2.03 |
| Oleuropein | −5.911 | −0.836 | 5.08 | −3.37 | 2.54 | 0.39 | 2.24 |
| Luteolin-7-O-glucoside | −6.016 | −1.656 | 4.36 | −3.84 | 2.18 | 0.46 | 3.37 |
| Bergapten | −6.181 | −1.926 | 4.26 | −4.05 | 2.13 | 0.47 | 3.86 |
| Psoralen | −6.477 | −2.133 | 4.34 | −4.31 | 2.17 | 0.46 | 4.27 |
 | ||
| Fig. 15 Frontier molecular orbitals representation of the five compounds. | ||
The most significant energy gap is exhibited by ligand hydroxytyrosol with a value of 5.67 making it the most stable and the least reactive. Compound Bergapten has the smallest energy gap, indicating higher reactivity compared to the other compounds. The order of energy gaps is as follows: Bergapten < Psoralen < Luteolin-7-O-glucoside < Oleuropein < Hydroxytyrosol.
Compound Psoralen exhibits a high value of the electrophilicity index (4.27 eV) and a chemical potential value of μ = −4.31 eV, favoring its electrophilic and electronegative behavior. Moreover, the hardness (η) is associated with the stability of the chemical system and ranges between 2.18 and 2.84 eV for the present compounds. Compound Hydroxytyrosol is harder than the other compounds.
Among the myriad reactivity indices crafted through Density Functional Theory (DFT) within quantum chemistry, Fukui functions stand out as a pivotal tool for understanding a molecule's site selectivity and chemical reactivity. These functions offer a profound glimpse into various descriptors, illuminating specific atoms' propensities to either donate or accept an electron. The Fukui indices serve as localized reactivity descriptors, unraveling intricate details about atoms exhibiting heightened tendencies for electron loss or acceptance. They are instrumental in pinpointing crucial reactive sites within molecules, thereby shedding light on their susceptibility to various chemical transformations. In addition to Fukui functions, other vital descriptors such as local softness, NBO (Natural Bond Orbital) charges, and the dual descriptor f(r) are determined at each atomic position for all compounds.100,101 This comprehensive analysis is meticulously tabulated in Supplementary Table S2,† offering a nuanced understanding of the atomic-scale reactivity across electrophilic, free radical, nucleophilic, and dual descriptor categories. The significance of dual descriptors lies in their ability to distinguish between nucleophilic and electrophilic attack preferences at specific molecular locations. These descriptors assign a positive value to sites favoring nucleophilic attacks, signifying their propensity to accept electrons. Conversely, a negative value denotes spots less inclined toward nucleophilic interactions, indicating a greater tendency for other forms of chemical interaction.
These results highlight specific atoms within each compound that are susceptible to nucleophilic or electrophilic attacks. Nucleophilic attack sites generally have a higher affinity for donating electrons, while electrophilic attack sites tend to attract or accept electrons. Understanding these sites is crucial for predicting and comprehending the reactivity and chemical transformations of these compounds in various reactions or interactions.
The Fe (110) surface is widely selected in DFT and molecular dynamics (MD) studies due to its thermodynamic stability, as it is the most energetically favorable and commonly exposed facet of the iron crystal. Moreover, pure iron is typically used instead of alloyed systems to reduce computational complexity and to focus on the fundamental interactions between the metal surface and adsorbates.102
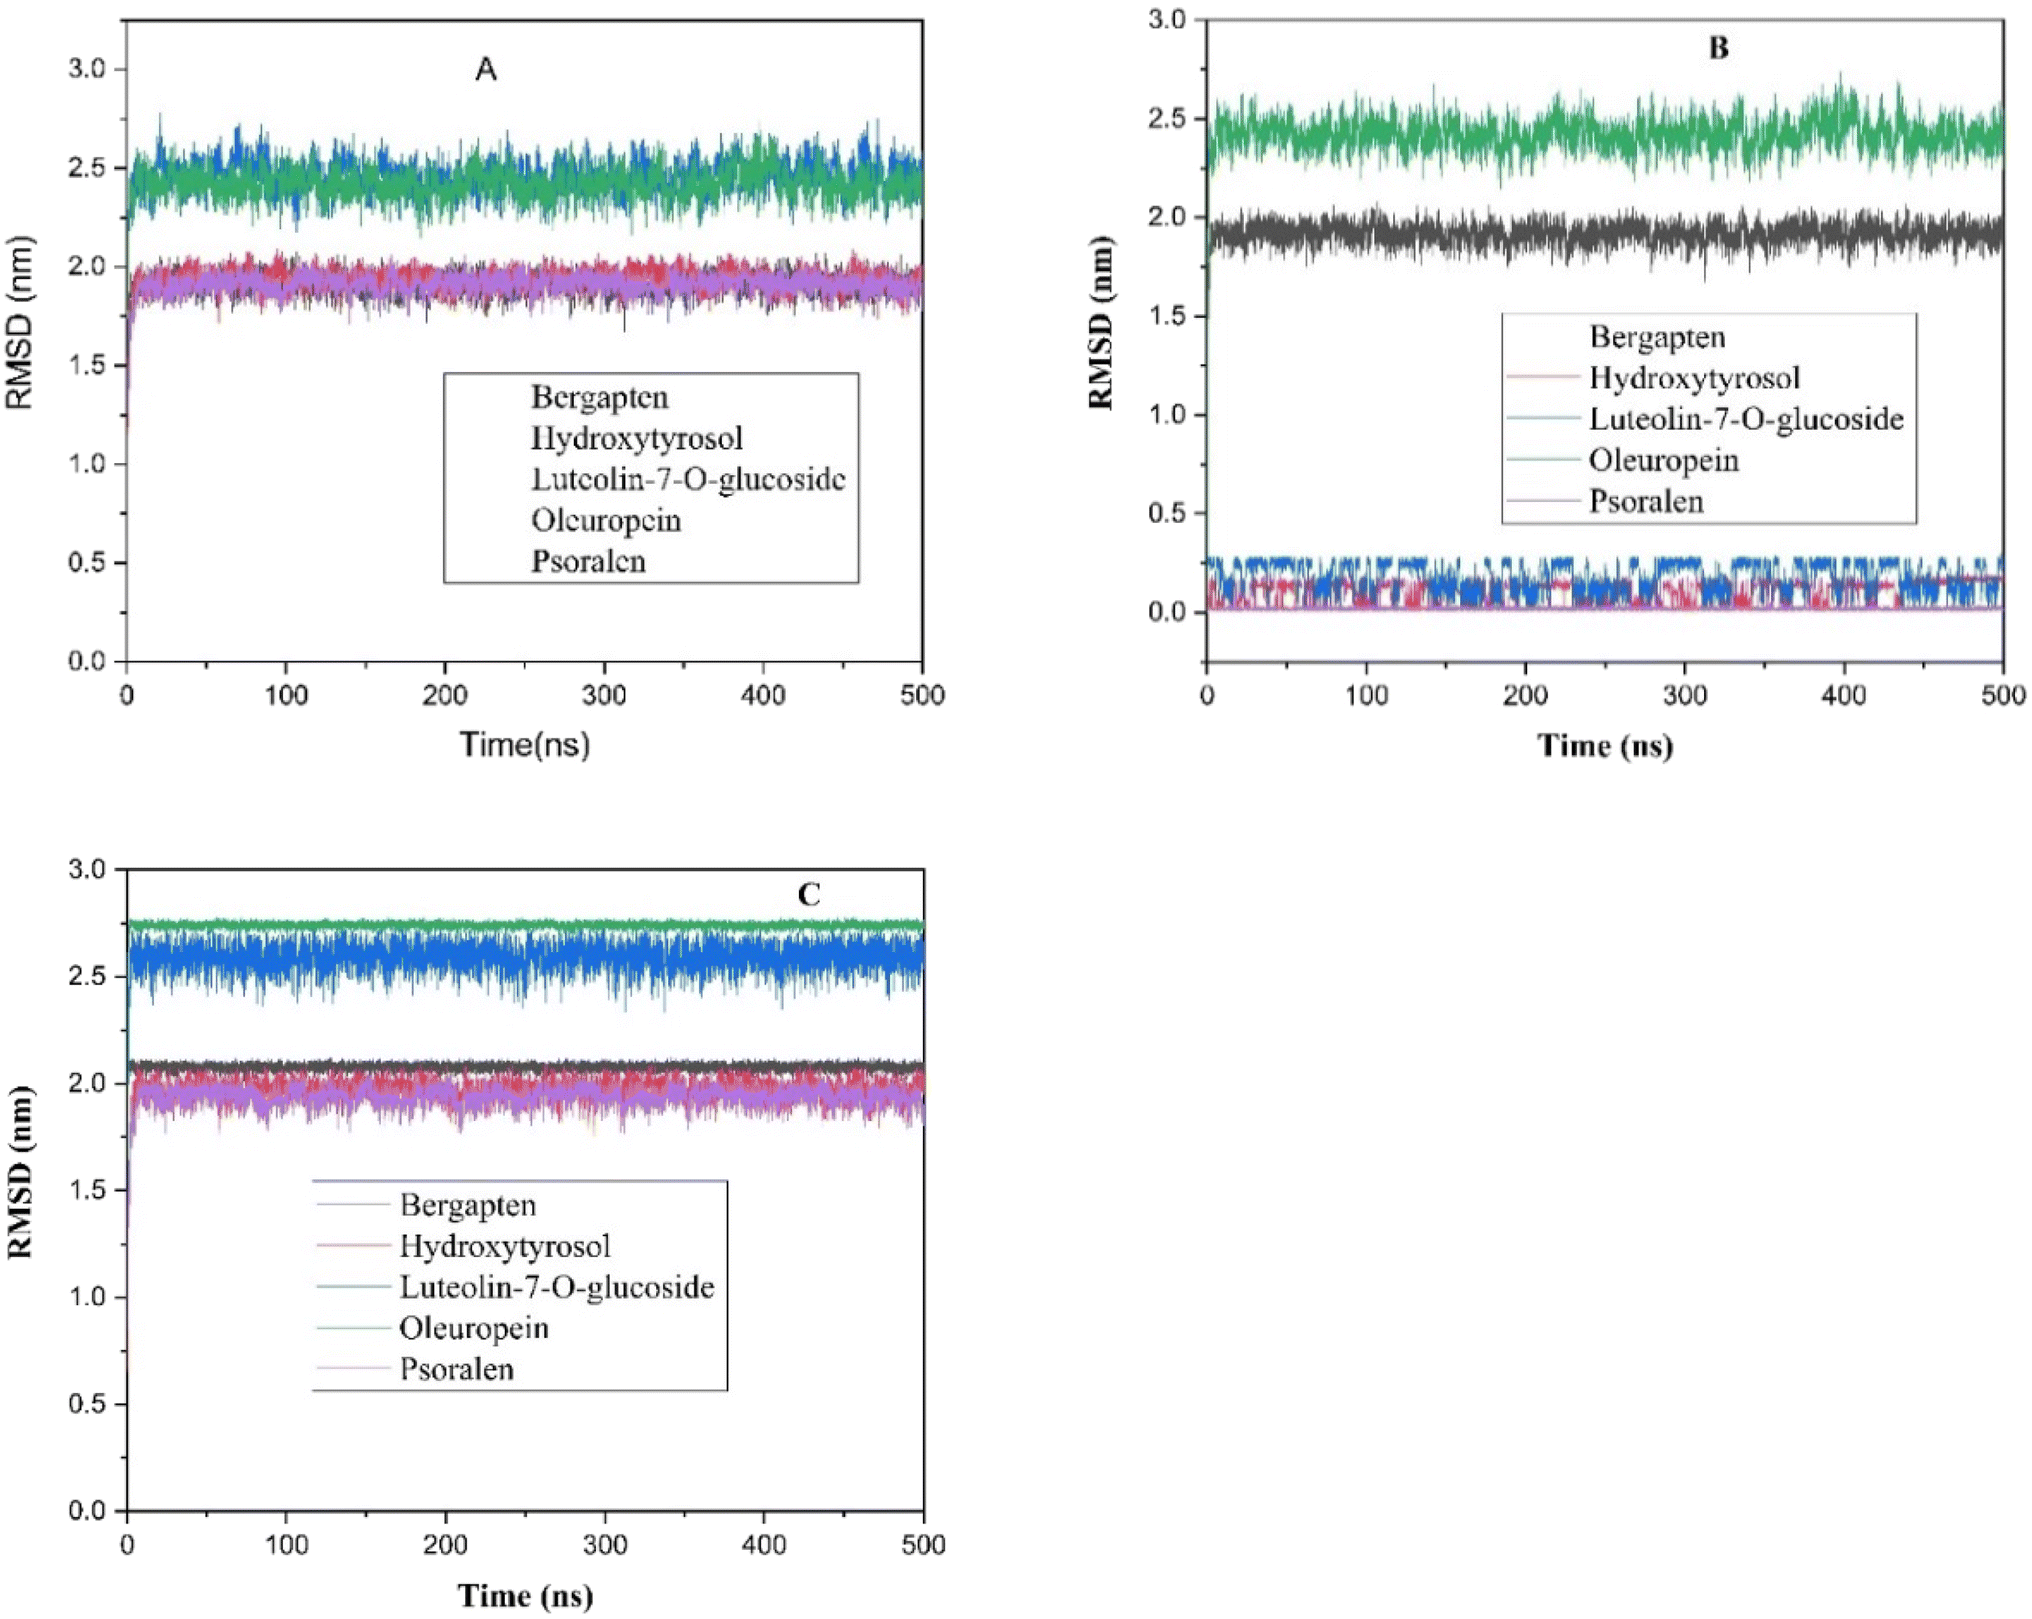
In this study, we conducted MD simulations for Fe (110) compound@surface complexes spanning 500 ns. Following equilibrium, the initial conformations of the dynamic simulations underwent NVT and NPT simulations for 2 ns. In the condition where none of the complexes disassociates within all the 500 ns.
The root mean square deviation (RMSD) analysis is a common technique used in molecular dynamics simulations to assess the stability of biomolecular systems over time. The stability of the complexes was examined during the MD simulations by calculating the (RMSD), to estimate these conformational changes and is calculated by comparing the deviation of subsequent conformations from initial reference conformation of compound@compound, surface@surface and complex@complex respectively (Fig. 16A–C).
 | ||
| Fig. 16 Root Mean Square Deviation (RMSD) Analysis for five molecules: (A) compound@compound, (B) surface@surface and (C) complexe@complexe. | ||
In this study, the RMSD analysis of clustering relative to the ligands and complexes indicates that these systems are best stabilized after 10 nanoseconds (ns) of simulation time. This suggests that after 10 ns, the compounds@surface complexes reach a level of stability where their structures are relatively consistent and do not fluctuate significantly.
Furthermore, complexes containing compounds such as Psoralen, Luteolin-7-O-glucoside and Hydroxytyrosol as ligands demonstrate better stability compared to others, that confirmed with radius of gyration calculations.
The current study examined the interaction between inhibitor molecules under investigation and the Fe surface using MD simulations. In this study, only one inhibitor molecule was allowed to interact with iron surface in the presence of 811 molecules H2O as solvent and 6 corrosive molecules HO3+and Cl−ions. The best equilibrium adsorption configuration for the system considered is depicted in Fig. 17.
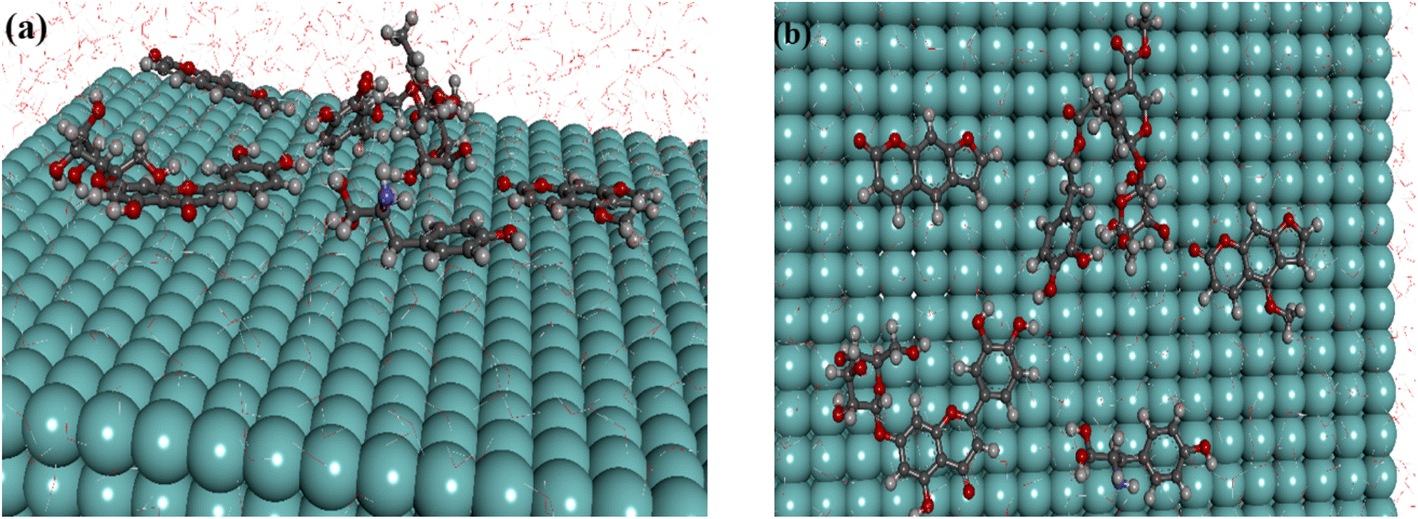 | ||
| Fig. 17 Side and top views of final equilibrium configurations for five molecules on Fe (1 1 0). | ||
The data obtained demonstrate that the inhibitors adsorb on the metal surface using a combination of vertical and parallel adsorptions mode.
The total energy (Esurface+solution) of Fe (110) plane and solution, total energy (Etotal) of full system, and the total energy (Einhibitor) of inhibitor molecule alone, were used to calculate the interaction energy (Einteraction) and binding energy (Ebinding).
The interaction and binding energies values of inhibitor molecule at 300 K are summarized in Table 5.
| Inhibitor | Einteraction (kJ mol−1) | Ebinding (kJ mol−1) |
|---|---|---|
| Hydroxytyrosol | −38.25 | 38.25 |
| Oleuropein | −89.95 | 89.95 |
| Luteolin-7-O-glucoside | −161.72 | 161.72 |
| Bergapten | −74.74 | 74.74 |
| Psoralen | −26.92 | 26.92 |
An examination of the information in Table 5 reveals that Luteolin-7-O-glucoside has the highest positive value binding energy, attributed to the development of an adsorbed layer on the surface of Fe (110). Furthermore, a strong and spontaneous interaction between the metallic surface and the Luteolin-7-O-glucoside is indicated by the greater negative value of interaction energy (−161.72 kJ mol−1), suggesting that it adsorbs more easily on the metal surface compared to the other four molecules.103 The Einteraction values at 300 K followed the order: Luteolin-7-O-glucoside > Oleuropein > Bergapten > Hydroyturosol > Psoralen. The positive Ebinding values show that the test molecules effectively adsorb to the substrate surface and blocking most of the active sites on the iron surface. This is due to their adsorption through multiple centers (O, double bond, and conjugate systems) and their higher molecular size, which may allow for better surface coverage. Among the compounds, luteolin-7-O-glucoside exhibited the highest binding energy (161.72 kJ mol−1), indicating strong and stable adsorption, which supports its role in reinforcing the protective layer via intermolecular hydrogen bonding and π–π stacking. Oleuropein and bergapten also demonstrated substantial binding energies of 89.95 and 74.74 kJ mol−1, respectively. Oleuropein acts as a primary anchoring agent, while bergapten, despite its comparatively lower adsorption strength, contributes to surface coverage by occupying gaps between larger molecules. Hydroxytyrosol, with a binding energy of 38.25 kJ mol−1, also participates in anchoring but to a lesser extent. Psoralen showed the lowest binding energy (26.92 kJ mol−1), suggesting a weaker direct interaction with the metal surface; however, it aids in stabilizing the adsorption layer through non-covalent interactions. These findings highlight a synergistic effect among the inhibitors, where strong adsorption by primary agents is complemented by secondary molecules that enhance the uniformity and compactness of the inhibitor film. These computational insights align with experimental observations, strongly supporting the conclusion that the improved corrosion inhibition efficiency of the plant extract arises from synergistic adsorption mechanisms among its phytochemical constituents.
3.8. The proposed inhibition mechanism
Due to the complex chemical structure of OFLE, it is not possible to determine the exact mechanism. Nonetheless, the following mechanism could provide a brief explanation of its involvement in mild steel corrosion protection. Firstly, through the chemisorption mechanism, neutral molecules of leaf extract (NMLE) may be adsorbed on the surface of steel by displacing of water molecules from the surface and sharing the electrons between the heteroatoms in the leaf extract (O, N, etc.) and iron.| NMLE(aq) + H2Oads ↔ NMLEads + H2O(aq) |
On the basis of donor–acceptor interactions between π-electrons of the aromatic rings and double bonds with unoccupied d-orbitals of surface iron atoms, OFLE molecules can also adsorb on the steel surface. The increase in inhibitory efficiency with rising temperature, as well as UV-Vis and FTIR observations, confirm chemisorption interaction as the mechanism by which steel corrosion is inhibited by OFLE. Secondly, the steel surface is positively charged in HCl (1 M)104 because it is entirely covered by Fe cations according to iron oxidation reaction in the presence of H+ protons. Therefore, it becomes difficult for the protonated molecules to adsorb on the steel surface due to the electrostatic repulsion.
| Fe →Fe2+ + 2e− |
In contrast, the presence of the negative chloride anions with lower degree of hydration generates an excess negative charge in the solution105,106 In this situation, OFLE molecules in their protonated state can bind to pre-developed chloride-based layer over the metal substrate via electrostatic interactions.106 The adsorption of OFLE compounds on the steel may occur through physical adsorption, chemical adsorption, or mixed mode (synergic action of the two).
3.9. A brief comparative study
Recently, scientific researchers have focused on developing inhibitors that are cost-effective, highly efficient, and ecologically friendly. Table 6 presents a comparison of the performance of olive leaf extract and fig leaf extract as corrosion inhibitors with other inhibitors. A very high inhibitory efficiency (exceeding 95%) was achieved with the mixture of olive and fig leaf extracts, surpassing the efficiencies reported in previous studies. Additionally, OFLE was extracted quickly with only distilled water and at a low temperature (313 K) as the extracting solvent making the use of the OFLE as a very low-cost and eco-friendly corrosion inhibitor.| Inhibitor/corrosion medium | Solvent/temperature | Inhibitor | Type of adsorption/isotherm | Method | IE% | Ref |
|---|---|---|---|---|---|---|
| Olive leaf/1 M HCl | Methanol/Water (70/30)/60 °C | Mixed | Physisorption/- | Weight loss, polarization and FTIR | 89.83 | 31 |
| Olive leaf/2 M HCl | Distilled water/100 °C | Mixed | Physisorption/Langmuir | Weight loss, polarization and cyclic voltammetry | 93 | 32 |
| Olive leaf/10% sulfamicacid | Bidistilled water/100 °C | Mixed | Physisorption/Langmuir | Weight loss, polarization, EIS and EFM | 89.6 | 33 |
| Olive leaf/alkaline CaCl2 brine | Distilled water/70 °C | Anodic | Physisorption_chemisorption/- | Polarization EIS and optical micrograph photo | 83 | 34 |
| Olive leaf/CO2-saturated chloride carbonate | -/- | Mixed | -/- | Polarization, EIS and FTIR | 95.78 | 35 |
| Olive leaf/1 M HCl | Methanol/water (80/20)/- | Mixed | Physisorption_ chemisorption/Langmuir | Weightloss and polarization | 87.42 | 36 |
| FicusCarica leaves/Petroleum medium | Ethanol/45 °C | Mixed | Physisorption/Langmuir | Polarization | 80 | 40 |
| FicusCarica leaves/0.5 M H2SO4 | Ethanol/- | Mixed | Chemisorption/Temkin | Weight loss, polarization, EIS, EFM, FTIR and AFM | 95.7 | 41 |
| FicusCarica leaves/3.5 wt% NaCl solution saturated with CO2 | Bidistilled water/80 °C | Mixed | Physisorption/Langmuir | Polarization, EIS, SEM, FTIR and molecular dynamics | 90 | 42 |
| FicusCarica leaves/2 M HCl | Bidistilled water/100 °C | Mixed | Physisorption/Langmuir | Weight loss, polarization and EIS | 87 | 43 |
| FicusCarica leaves/1 M HCl | Distilled water/40 °C | Mixed | Chemisorption/Langmuir | EIS polarization weight loss, FTIR, FTIR derivative, SEM, XRD. | 94 | 44 |
| Mixture of olive and FicusCarica leaves/1 M HCl | Distilled water/40 °C | Mixed | Chemisorption/Langmuir | EIS polarization weight loss, UV-VIS, UV-VIS derivative, FTIR, FTIR derivative, SEM, XRD, DFT and MD | 95 | This study |
Recently, scientific efforts have increasingly focused on the development of corrosion inhibitors that are not only highly efficient but also cost-effective and environmentally friendly. In this context, the current study evaluates the performance of olive leaf extract (OLE), fig leaf extract (FLE), and their combination (OFLE) as green corrosion inhibitors. The OFLE mixture was prepared using distilled water at a low temperature (313 K), making the extraction process simple, energy-efficient, and low-cost. As presented in Table 6, the combination of OLE and FLE achieved an inhibition efficiency exceeding 95%, outperforming both individual extracts and many previously reported natural inhibitors. This outstanding performance can be attributed to the complementary or overlapping phytochemical profiles of the two extracts, which likely act together to form a more uniform and protective barrier on the metal surface. These results highlight the OFLE mixture as a highly promising, eco-friendly alternative for corrosion protection.
4. Conclusion
The effectiveness of OFLE as a green corrosion inhibitor was demonstrated by this investigation. The main conclusion can be summarized as follows:1. High efficiency percentage approximately 95% was attained.
2. The double-layer capacitance (Cdl) decreases as OFLE is added, but the charge transfer resistance (Rct) increases.
3. The potentiodynamic polarization curves support the inhibitor's mixed nature.
4. The gravimetric method's results demonstrate that chemical adsorption is validated by increases in IE% with temperature. Accordingly, the Ea values obtained in the presence of OFLE were lower than those obtained in the blank acid solution, providing additional support for the chemical adsorption hypothesis. The Langmuir model governs OFLE adsorption.
5. FTIR, FTIR derivative, UV-visible, and UV-visible derivative analyses reveal the existence of functional groups that are responsible for the adsorption of the OFLE molecules on the metal surface.
6. SEM and XRD analyses proved that an inhibitory layer has been formed on the metal surface.
7. Theoretical simulations strengthened the experimental results and provided insightful information about the behavior of adsorption of active phytochemicals on the metal surface. Furthermore, MD simulations show that adsorption occurred parallel to the surface of Fe (1 1 0) and it also follows the binding energy order of Luteolin-7-O-glucoside > Oleuropein > Bergapten > Hydroyturosol > Psoralen.
Data availability
The data supporting this article have been included as part of the ESI.†Conflicts of interest
There are no conflicts to declare.References
- J. Cruz, R. Martìnez, J. Genesca and E. Garcìa-Ochoa, J. Electroanal. Chem., 2004, 566, 111–121 CrossRef CAS
.
- M. A. Migahed, Mater. Chem. Phys., 2005, 93, 48–53 CrossRef CAS
- N. Kavitha, P. Manjula and N. A. Kumar, Res. J. Chem. Sci., 2014, 4, 88–93 CAS
- C. N. Njoku and O. E. Onyelucheya, Int. J. Mater. Chem., 2015, 5, 4–13 Search PubMed
- M. T. Saeed, Anti-Corros. Methods Mater., 2004, 51, 389–398 CrossRef CAS
- S. U. Rahman, M. T. Saeed and S. A. Ali, Anti-Corros. Methods Mater., 2005, 52, 154–159 CrossRef CAS
- M. Lebrini, F. Robert, A. Lecante and C. Roos, Corros. Sci., 2011, 53, 687–695 CrossRef CAS
- M. Behpour, S. M. Ghoreishi, M. Khayatkashani and N. Soltani, Mater. Chem. Phys., 2012, 131, 621–633 CrossRef CAS
- A. A. Rahim, E. Rocca, J. Steinmetz, M. J. Kassim, R. Adnan and M. Sani Ibrahim, Corros. Sci., 2007, 49, 402–417 CrossRef CAS
- V. G. Kontogianni and I. P. Gerothanassis, Nat. Prod. Res., 2012, 26, 186–189 CrossRef CAS PubMed
- O. Çalişkan and A. A. Polat, Sci. Hortic., 2011, 128, 473–478 CrossRef
- A. P. Pereira, I. C. Ferreira, F. Marcelino, P. Valentão, P. B. Andrade, R. Seabra, L. Estevinho, A. Bento and J. A. Pereira, Molecules, 2007, 12, 1153–1162 CrossRef CAS PubMed
- M. Souhila, K. Mustapha, B. Abderahim, B. Karima and B. Imen, Asian Pac. J. Trop. Biomed., 2016, 6, 239–245 Search PubMed
- R. Benot-Dominguez, M. G. Tupone, V. Castelli, M. d'Angelo, E. Benedetti, M. Quintiliani, B. Cinque, I. M. Forte, M. G. Cifone, R. Ippoliti, B. Barboni, A. Giordano and A. Cimini, Biomed. Pharmacother., 2021, 134, 111–139 CrossRef PubMed
- R. Abdel-Rahman, E. Ghoneimy, A. Abdel-Wahab, N. Eldeeb, M. Salem, E. Salama and T. Ahmed, S. Afr. J. Bot., 2021, 141, 273–277 CrossRef CAS
- H. Nsir, M. A. Szychlinska, V. Cardile, A. C. Graziano, R. Avola, H. Esafi, A. Bendini, M. Zarouk, C. Loreto, V. Rapisarda, P. Castrogiovanni and G. Musumeci, Acta Histochem, 2017, 119, 407–416 CrossRef CAS PubMed
- B. Ali, M. Mujeeb, V. Aeri, S. R. Mir, M. Faiyazuddin and F. Shakeel, Nat. Prod. Res., 2012, 26, 460–465 CrossRef CAS PubMed
- S. Agatonovic-Kustrin, V. Gegechkori, D. W. Morton, J. Tucci, E. U. Mohammed and H. Ku, J. Pharm. Biomed. Anal., 2022, 219, 114–916 CrossRef PubMed
- M. R. Jeong, J. D. Cha and Y. E. Lee, Korean J Food Cook Sci., 2005, 21, 84–93 Search PubMed
- A. Kaeidi, S. Esmaeili-Mahani, V. Sheibani, M. Abbasnejad, B. Rasoulian, Z. Hajializadeh and S. Afrazi, J. Ethnopharmacol., 2011, 136, 188–196 CrossRef PubMed
- S. Stephen Irudayaraj, S. Christudas, S. Antony, V. Duraipandiyan, A. D. Naif Abdullah and S. Ignacimuthu, Pharm Biol., 2017, 55, 1074–1081 CrossRef PubMed
- L. Rubió, A. Macià, A. Castell-Auví, M. Pinent, M. Teresa Blay, A. Ardévol, M. P. Romero and M. J. Motilva, Food Chem., 2014, 149, 277–284 CrossRef PubMed
- F. Herrmann and M. Wink, Phytomedicine, 2011, 18, 1191–1196 CrossRef CAS PubMed
- A. A. Abeed, E. M. Bennour, A. M. M. Sawadi and A. K. Elbaz, Medical Journal., 2018, 4, 127–131 Search PubMed
- A. Niran Al-Ogaili, S. Osama, D. Jazme and S. Saad, Research J. Pharm. and Tech., 2020, 13, 1198–1203 CrossRef
- M. El Dessouky Abdel-Aziz, M. Samir Darwish, A. H. Mohamed, A. Y. El-Khateeb and S. E. Hamed, Foods., 2020, 9, 615 CrossRef CAS PubMed
- M. Balsam and T. A. Salman, Plant Arch., 2020, 20, 7089–7096 Search PubMed
- S. M. Abdel Motaal and N. M. Al-Qasmi, Azhar Bull. Sci., 2010, 21, 363–378 CrossRef
- C. Rahal, M. Masmoudi, R. Abdelhedi, R. Sabot, M. Jeannin, M. Bouaziz and P. Refait, J. Electroanal. Chem., 2016, 769, 53–61 CrossRef CAS
- P. Refait, C. Rahaln and M. Masmoudi, J. Electroanal. Chem., 2020, 859, 113–834 CrossRef
- D. Bouknana, B. Hammouti, H. Serghini caid, S. Jodeh, A. Bouyanzer, A. Aouniti and I. Warad, Int. J. Ind. Chem., 2015, 6, 233–245 CrossRef CAS
- A. Y. El-Etre, J. Colloid Interface Sci., 2007, 314, 578–583 CrossRef CAS PubMed
- H. M. Elabbasy and A. S. Fouda, Green Chem. Lett. Rev., 2019, 12, 332–342 CrossRef CAS
- A. M. Abdel-Gaber, B. A. Abd-El-Nabey, E. Khamis and D. E. Abd-El-Khalek, Desalination, 2011, 278, 337–342 CrossRef CAS
- G. Pustaj, F. Kapor and Ž. Veinović, Int. J. Electrochem. Sci., 2016, 11, 7811–7829 CrossRef CAS
- R. Selaimia, S. Nigri and R. Oumeddour, Asian J. Research Chem., 2022, 15, 52–58 Search PubMed
- A. I. Onen, J. T. Barminas and J. Jacob, Chem. Sci. Trans., 2013, 2, 1326–1333 Search PubMed
- R. Veberic, M. Colaric and F. Stampar, Food Chem., 2008, 106, 153–157 CrossRef CAS
- A. I. Onen and J. Jacob, Int. J. Adv. Res. Chem. Sci., 2016, 3, 34–40 Search PubMed
- R. A. Anaee, M. H. Alzuhairi and H. A. Abdullah, Asian J. Eng. Technol., 2014, 2, 235–243 Search PubMed
- M. A. EL-Zekred, A. M. Nofal, K. Shalabi and A. S. Fouda, J. Indian Chem. Soc., 2021, 98, 100–128 CrossRef
- T. H. Ibrahim, E. E. Gomes, I. B. Obot, M. Khamis and M. A. Sabri, J. Adhes. Sci. Technol., 2017, 31, 2697–2718 CrossRef CAS
- T. H. Ibrahim and M. AbouZour, Int. J. Electrochem. Sci., 2011, 6, 6442–6455 CrossRef CAS
- H. Rahmouni, S. Nigri, M. Nacef, R. Oumeddour and A. M. Affoune, Anal. Bioanal. Electrochem., 2024, 16, 142–162 CAS
- S. H. Alrefaee, K. Y. Rhee, C. Verma, M. A. Quraishi and E. E. Ebenso, J. Mol. Liq., 2021, 321, 114–666 CrossRef
- C. Rahal, M. Masmoudi, R. Abdelhedi, M. Bouaziz and P. Refait, J. Electroanal. Chem., 2016, 769, 53–61 CrossRef CAS
- A. P. Oliveira, P. Valentão, J. A. Pereira and B. M. Silva, Food Chem. Toxicol., 2009, 47, 2841–2846 CrossRef CAS PubMed
- A. D. Becke, J. Chem. Phys., 1993, 98, 5648–5652 CrossRef CAS
- C. Lee, W. Yang and R. G. Parr, J. Phys. Chem. B, 1988, 37, 785–789 CAS
- T. Clark, J. Chandrasekhar, G. W. Spitznagel and P. V. Ragué Schleyer, J. Comput. Chem., 1983, 4, 294–301 CrossRef CAS
- R. Ditchfield, W. J. Hehre and J. A. Pople, J. Chem. Phys., 2003, 54, 724–728 CrossRef
- M. M. Francl, W. J. Pietro, W. J. Hehre, J. S. Binkley, M. S. Gordon, D. J. DeFrees and A. John, J. Chem. Phys., 1982, 77, 3654–3665 CrossRef CAS
- M. S. Gordon, J. S. Binkley, J. A. Pople, W. J. Pietro and W. J. Hehre, J. Am. Chem. Soc., 1982, 104, 2797–2803 CrossRef CAS
- P. C. Hariharan and J. A. Pople, Theor. Chim. Acta, 1973, 28, 213–222 CrossRef CAS
- W. J. Hehre, R. Ditchfield and J. A. Pople, J. Chem. Phys., 2003, 56, 2257–2261 CrossRef
- G. W. Spitznagel, T. Clark, P. von Ragué Schleyer and W. Hehre, J. Comput. Chem., 1987, 8, 1109–1116 CrossRef CAS
- M. Frisch, G. W. Trucks, H. B. Schlegel, G. E. Scuseria, M. A. Robb, J. R. Cheeseman, G. Scalmani, V. Barone, B. Mennucci, G. A. Petersson, H. Nakatsuji, M. Caricato, X. Li, H. P. Hratchian, A. F. Izmaylov, J. Bloino, G. Zheng, J. L. Sonnenberg, M. Hada, M. Ehara, K. Toyota, R. Fukuda, J. Hasegawa, M. Ishida, T. Nakajima, Y. Honda, O. Kitao, H. Nakai, T. Vreven, J. A. Montgomery, Jr., J. E. Peralta, F. Ogliaro, M. Bearpark, J. J. Heyd, E. Brothers, K. N. Kudin, V. N. Staroverov, R. Kobayashi, J. Normand, K. Raghavachari, A. Rendell, J. C. Burant, S. S. Iyengar, J. Tomasi, M. Cossi, N. Rega, J. M. Millam, M. Klene, J. E. Knox, J. B. Cross, V. Bakken, C. Adamo, J. Jaramillo, R. Gomperts, R. E. Stratmann, O. Yazyev, A. J. Austin, R. Cammi, C. Pomelli, J. W. Ochterski, R. L. Martin, K. Morokuma, V. G. Zakrzewski, G. A. Voth, P. Salvador, J. J. Dannenberg, S. Dapprich, A. D. Daniels, Ö. Farkas, J. B. Foresman, J. V. Ortiz, J. Cioslowski, and D. J. Fox, 09, Revision D. 01, Gaussian. Inc., Wallingford, CT, 2009 Search PubMed
-
(a) D. G. Fedorov, T. Ishida and K. Kitaura, J. Phys. Chem. A, 2005, 109, 2638–2646 CrossRef CAS PubMed
- M. J. Abraham, T. Murtola, R. Schulz, S. Páll, J. C. Smith, B. Hess and E. Lindahl, SoftwareX, 2015, 1, 19–25 CrossRef
- E. J. Baerends, T. Ziegler, A. J. Atkins, J. Autschbach, O. Baseggio, D. Bashford, A. Bérces, F. M. Bickelhaupt, C. Bo, P. M. Boerrigter, C. Cappelli, L. Cavallo, C. Daul, D. P. Chong, D. V. Chulhai, L. Deng, R. M. Dickson, J. M. Dieterich, F. Egidi, D. E. Ellis, M. van Faassen, L. Fan, T. H. Fischer, A. Förster, C. Fonseca Guerra, M. Franchini, A. Ghysels, A. Giammona, S. J. A. van Gisbergen, A. Goez, A. W. Götz, J. A. Groeneveld, O. V. Gritsenko, M. Grüning, S. Gusarov, F. E. Harris, P. van den Hoek, Z. Hu, C. R. Jacob, H. Jacobsen, L. Jensen, L. Joubert, J. W. Kaminski, G. van Kessel, C. König, F. Kootstra, A. Kovalenko, M. V. Krykunov, P. Lafiosca, E. van Lenthe, D. A. McCormack, M. Medves, A. Michalak, M. Mitoraj, S. M. Morton, J. Neugebauer, V. P. Nicu, L. Noodleman, V. P. Osinga, S. Patchkovskii, M. Pavanello, C. A. Peeples, P. H. T. Philipsen, D. Post, C. C. Pye, H. Ramanantoanina, P. Ramos, W. Ravenek, M. Reimann, J. I. Rodríguez, P. Ros, R. Rüger, P. R. T. Schipper, D. Schlüns, H. van Schoot, G. Schreckenbach, J. S. Seldenthuis, M. Seth, J. G. Snijders, M. Solà, M. Stener, M. Swart, D. Swerhone, V. Tognetti, G. te Velde, P. Vernooijs, L. Versluis, L. Visscher, O. Visser, F. Wang, T. A. Wesolowski, E. M. van Wezenbeek, G. Wiesenekker, S. K. Wolff, T. K. Woo and A. L. Yakovlev, ADF 2023.1, SCM, Theoretical Chemistry, Vrije Universiteit, Amsterdam, The Netherlands, 2023, http://www.scm.com.Optionally Search PubMed
- W. Humphrey, A. Dalke and K. Schulten, J. Molec. Graphics., 1996, 14, 33–38 CrossRef CAS PubMed
- A. Zakeri, E. Bahmani and A. S. Aghdam, Corrosion Communications, 2022, 5, 25–38 CrossRef
- P. Vashishth, H. Bairagi, R. Narang, S. K. Shukla and B. Mangla, J. Mol. Liq., 2022, 365, 120042 CrossRef CAS
- H. EL Hassouni, A. Elyousfi, F. Benhiba, N. Setti, A. Romane, T. Benhadda, A. Zarrouk and A. Dafali, Inorg. Chem. Commun., 2022, 143, 109801 CrossRef CAS
- Y. Kharbach, F. Z. Qachchachi, A. Haoudi, M. Tourabi, A. Zarrouk, C. Jama, L. O. Olasunkanmi, E. E. Ebenso and F. Bentiss, J. Mol. Liq., 2017, 246, 302–316 CrossRef CAS
- M. Zhu, Z. He, L. Guo, R. Zhang, V. C. Anadebe, I. B. Obot and X. Zheng, J. Mol. Liq., 2021, 342, 117583 CrossRef CAS
- X. Li, S. Deng, G. Du and X. Xie, J Taiwan Inst Chem Eng, 2020, 114, 263–283 CrossRef CAS
- A. Pal and C. Das, Inorg. Chem. Commun., 2022, 145, 110024 CrossRef CAS
- Z. Tao, S. Zhang, W. Li and B. Hou, Ind. Eng. Chem. Res., 2011, 50, 6082–6088 CrossRef CAS
- K. Alaoui, Y. El Kacimi, M. Galai, R. Touir, K. Dahmani, A. Harfi and M. E. Touhami, J. Mater. Environ. Sci., 2016, 7, 2389–2403 CAS
- M. A. Ismail, M. M. Shaban, E. Abdel-Latif, F. H. Abdelhamed, M. A. Migahed, M. N. El-Haddad and A. S. Abousalem, J. Surf. Investig., 2022, 12, 3192 CAS
- D. K. Yadava, M. A. Quraishia and B. Maitib, Corros. Sci., 2012, 55, 254–266 CrossRef
- Z. Kerner and T. Pajkossy, Electrochim. Acta, 2000, 46, 207–211 CrossRef CAS
- Z. Hu, Y. Meng, X. Ma, H. Zhu, J. Li, C. Li and D. Cao, Corros. Sci., 2016, 112, 563–575 CrossRef CAS
- H. Helmholz, Studien iiber elektrische Crenzchichten, Ann. Phys. Chem., 1897, 243, 337–382 CrossRef
- M. Outirite, M. Lagrenée, M. Lebrini, M. Traisnel, C. Jama, H. Vezin and F. Bentiss, Electrochim. Acta, 2010, 55, 1670–1681 CrossRef CAS
- K. F. Khaled, Electrochim. Acta, 2008, 53, 3484–3492 CrossRef CAS
- A. Popova, M. Christov and A. Vasilev, Corros. Sci., 2007, 49, 3290–3302 CrossRef CAS
- M. El Faydy, B. Lakhrissi, C. Jama, A. Zarrouk, L. O. Olasunkanmi, E. E. Ebenso and F. Bentiss, J. Mater. Res. Technol., 2020, 9, 727–748 CrossRef CAS
- M. H. Hussin, M. J. Kassim, N. N. Razali, N. H. Dahon and D. Nasshorudin, Arabian J. Chem., 2016, 9, 616–624 CrossRef
- S. Rekkab, H. Zarrok, R. Salghi, A. Zarrouk, L. Bazzi, B. Hammouti, Z. Kabouche, R. Touzani and M. Zougagh, J. Mater. Environ. Sci., 2013, 3, 613–627 Search PubMed
- H. Elmsellem, T. Harit, A. Aouniti, F. Malek, A. Riahi, A. Chetouani and B. Hammouti, Prot. Met. Phys. Chem. Surf., 2015, 51, 873–884 CrossRef CAS
- T. K. Chaitra, K. N. S. Mohana and H. C. Tandon, J. Mol. Liq., 2015, 211, 1026–1038 CrossRef CAS
- H. Vashisht, S. Kumar, I. Bahadur and G. Singh, Int. J. Electrochem. Sci., 2013, 8, 684–699 Search PubMed
- I. B. Obot and N. O. Obi-Egbedi, Corros. Sci., 2010, 52, 198–204 CrossRef CAS
- E. E. Oguzie, Mater. Chem. Phys., 2004, 87, 212–217 CrossRef CAS
- M. T. Saeed, M. Saleem, S. Usmani, I. A. Malik, F. A. Al-Shammari and K. M. Deen, J. King Saud Univ., Sci., 2019, 31, 1344–1351 CrossRef
- A. R. Zadeh, I. Danaee and M. H. Maddahy, J. Mater. Sci. Technol., 2013, 29, 884–892 CrossRef CAS
- S. S. Pereira, M. M. Pegas, T. L. Fernandez, M. Magalhaes, T. G. Schöntag, D. C. Lago, L. F. de Senna and E. D'Elia, Corros. Sci., 2012, 65, 360–366 CrossRef CAS
- A. Popova, E. Sokolova, S. Raicheva and M. Christov, Corros. Sci., 2003, 45, 33–58 CrossRef
- P. Mourya, S. Banerjee and M. M. Singh, Corros. Sci., 2014, 85, 352–363 CrossRef CAS
- A. E. Fouda, A. M. Al-Bonayan, M. Eissa and D. M. Eid, RSC Adv., 2022, 12, 3253–3273 RSC
- C. Mahmou, E. M. Bouissoui, F. Bouhlal, N. Labjar, I. Merimi, S. Kaya, B. El Ibrahimi, M. Chellouli, A. Dahrouch and S. El Hajjaji, Int. J. Corros. Scale Inhib., 2021, 10, 1245–1281 CAS
- K. Zhuo, J. Mol. Liq., 2022, 367, 120–442 CrossRef
- S. Akbarzadeh, M. Ramezanzadeh, G. Bahlakeh and B. Ramezanzadeh, J. Mol. Liq., 2020, 297, 111862 CrossRef
- A. Carmona-Hernandez, C. Campechano-Lira, A. Espinoza-Vázquez, J. A Ramírez-Cano, R. Orozco-Cruz and R. Galván-Martínez, J. Taiwan Inst. Chem. Eng., 2023, 147, 104913 CrossRef CAS
- M. C. Di Meo, F. Izzo, M. Rocco, A. Zarrelli, M. Mercurio and E. Varricchio, Infrared Phys. Technol., 2022, 127, 104439 CrossRef
- F. Aouidi, N. Dupuy, J. Artaud, S. Roussos, M. Msallem, I. P. Gaime and M. Hamdi, Ind. Crops Prod., 2012, 37, 292–297 CrossRef CAS
- P. Muthukrishnan, P. Prakash, B. Jeyaprabha and K. Shankar, Arabian J. Chem., 2019, 12, 3345–3356 CrossRef CAS
- Z. Demircioğlu, Ç. A. Kaştaş and O. Büyükgüngör, J. Mol. Struct., 2015, 1091, 183–195 CrossRef
- R. G. Parr, L. v. Szentpály and S. Liu, J. Am. Chem. Soc., 1999, 121, 1922–1924 CrossRef CAS
- N. Mazlan, K. Jumbri, M. A. Kassim, R. Abdul Wahab and M. B. Abdul Rahman, J. Mol. Liq., 2022, 347, 118321 CrossRef CAS
- M. Beniken, R. Salim, E. Ech-chihbi, M. Sfaira, B. Hammouti, M. EbnTouhami, M. A. Mohsin and M. Taleb, J. Mol. Liq., 2022, 348, 118022 CrossRef CAS
- P. Muthukrishnan, P. Prakash, B. Jeyaprabha and K. Shankar, Arabian J. Chem., 2019, 12, 3345 CrossRef CAS
- A. K. Singh and M. A. Quraishi, Corros. Sci., 2010, 52, 1529 CrossRef CAS
- F. Bentiss, M. Traisnel and M. Lagrenee, Corros. Sci., 2000, 42, 127 CrossRef CAS
Footnote |
| † Electronic supplementary information (ESI) available. See DOI: https://doi.org/10.1039/d5ra02786a |
| This journal is © The Royal Society of Chemistry 2025 |