DOI:
10.1039/D5RA02663F
(Paper)
RSC Adv., 2025,
15, 21649-21658
Sustainable antioxidant and antibacterial activities of zinc ion and caffeic acid-coupled carboxymethyl chitosan
Received
16th April 2025
, Accepted 9th June 2025
First published on 25th June 2025
Abstract
Carboxymethyl chitosan (CMCS), a water-soluble derivative of chitosan, exhibits good biocompatibility. However, the limited bioactivities impede its potential applications. This work presents a novel CMCS derivative, termed CMCS–Zn–CA, which was prepared by complexing CMCS with Zn2+ and caffeic acid (CA) under microwave irradiation. Structural characterization was conducted using FT-IR, UV, XRD, TGA, and XPS analyses. Results showed that the scavenging rates of CMCS–Zn–CA on DPPH and hydroxyl radical were 95.45% and 92.45%, respectively, while those of CMCS were only 12.62% and 9.21%, respectively. The antibacterial assay on S. aureus and E. coli revealed that CMCS–Zn–CA demonstrated much lower minimal inhibitory concentrations (MICs) and minimal bactericidal concentrations (MBCs) than CMCS, indicating the excellent inhibition ability of CMCS–Zn–CA on both strains. The time-kill curves and plate count confirmed the antibacterial activity of CMCS–Zn–CA, and SEM results validated its efficacious ability in disrupting the cell barrier. Furthermore, CMCS–Zn–CA demonstrated sustainable antioxidant activity by retaining 93.9% of the CA content and 95.4% of the DPPH radical scavenging rate and prolonged the milk storage time by maintaining a higher pH, lower acidity and lower bacterial count. In conclusion, the CMCS complex displayed sustainable antioxidant and antibacterial activities, suggesting its great potential in practical applications.
1. Introduction
Free radicals, especially reactive oxygen species, are by-products of human metabolism, and an excess of reactive oxygen species can react with various macromolecules in organisms, leading to cell damage and various diseases, such as heart disease, respiratory diseases, and tumors.1,2 S. aureus and E. coli are typical foodborne pathogens that are spread through contaminated food and drinking water, and they can inflict serious harm to human health by causing symptoms of meningitis and septicemia.3 As a result, extensive studies have attempted to develop effective antioxidant and antibacterial reagents for theoretical research or practical application.4–7 However, very few studies have been reported on the successful and effective incorporation of both bioactivities in one reagent. Therefore, it is imperative to develop new reagents that simultaneously possess high antioxidant and antibacterial properties.
Chitosan (CS), a natural cationic polysaccharide derived from the deacetylation of chitin, has been widely used in food packaging, fruit preservation, and pharmaceutical development.8–10 Nevertheless, the limitation of CS's physical and biological properties, such as its poor water solubility and low antioxidant and antibacterial activities, has obstructed the practical and potential applications of CS, and numerous studies have tried to develop novel CS derivatives for broader application.11–13 Carboxymethyl chitosan (CMCS) is a category of popular water-soluble macromolecule derived from the carboxymethylation of chitosan14–16 and is extensively used in many fields for its optimized properties.17,18 However, it should be noted that the inferior bioactivities of CMCS have limited its practical application, and various methods have been developed to improve the antioxidant and antibacterial properties of CMCS; for instance, metal ion complexation and natural antioxidant grafting.19
Zinc, an essential trace element for the human body, plays an important role in human growth and development, and it is considered a promising material owing to its particular antibacterial activity; furthermore, zinc can enhance the antioxidant capacity of complexes by reducing their oxidation potential.20–22 Considering the advantages of chemical and biological properties of zinc, researchers have incorporated zinc into polysaccharides to form complexes and enhance their antioxidant and antibacterial abilities.23 Tang et al. found that CMCS can interact with zinc ions through chelation, and the chelation process was significantly influenced by the reaction conditions.24 R. L. Patale et al. obtained CMCS–Zn complexes that exhibited impressive antibacterial properties, with an inhibition zone of 20 mm against S. aureus.25 Nevertheless, it should be noted that CMCS–Zn cannot meet the practical requirement of the antioxidant and antibacterial activities. Furthermore, to the best of our knowledge, there is currently a lack of literature on simultaneously testing the two bioactivities of CMCS–Zn.
Polyphenols are a class of plant-derived compounds with noteworthy antioxidant properties, and exhibit enhanced antioxidant ability when combined with CMCS.26,27 So far, numerous polyphenols, such as caffeic acid, ferulic acid, and gallic acid, have been reported to bind to CMCS at amino and hydroxyl sites for improved bioactivities.28,29 Among the above-mentioned polyphenols, caffeic acid (CA) has attracted considerable attention owing to its natural antioxidant properties. Furthermore, CA can form complexes with enhanced water solubility and antioxidant activity when grafted onto chitosan or CMCS, exhibiting DPPH and hydroxyl radical scavenging rates that are several times greater than those of CMCS alone.30–32 Despite the impressive progress made thus far in antioxidant research, scientists continue to seek new approaches to improve the antioxidant activity of polyphenols.
In summary, CMCS, Zn, and CA individually exhibit excellent biological properties as reported in the literature. However, the preparation and bioactivity of the complexes formed from the three components remain unexplored. Herein, we developed a novel ternary complex of CMCS with zinc and CA using a free radical-mediated grafting method under microwave irradiation. The structures of the complexes were characterized, and the antioxidant activity was determined by measuring their ability to scavenge DPPH and hydroxyl radicals. The stability of the samples was evaluated by measuring the retained DPPH radical scavenging rate and CA content. Meanwhile, the antibacterial capacity of the complexes was evaluated by their inhibiting effect against E. coli and S. aureus, and their potential application was ultimately assessed in milk preservation.
2. Materials and methods
2.1 Materials
CMCS, potassium persulfate, ferrous sulfate and zinc acetate were all purchased from Shanghai Macklin Biochemical Co., Ltd. CA was purchased from Shanghai Meryer Biochemical Technology Co., Ltd. 2,2-Diphenyl-1-picrylhydrazyl (DPPH) was obtained from Tokyo Chemical Industry. The dialysis tubes (MWCO 8000–14![[thin space (1/6-em)]](https://www.rsc.org/images/entities/char_2009.gif) 000 Da) were supplied by Shanghai Yuanye Biochemical Technology Co., Ltd. All reagents were used without further purification. E. coli (ATCC 25922) and S. aureus (ATCC 43300) were provided by the Microbiology Laboratory of Ningbo University and cryopreserved at −20 °C.
000 Da) were supplied by Shanghai Yuanye Biochemical Technology Co., Ltd. All reagents were used without further purification. E. coli (ATCC 25922) and S. aureus (ATCC 43300) were provided by the Microbiology Laboratory of Ningbo University and cryopreserved at −20 °C.
2.2 Preparation of CMCS–Zn complex
The CMCS–Zn complexes was prepared at room temperature (approximately 25 °C) under nitrogen protection, as previously described in the literature with minor modifications.33 Briefly, CMCS (0.5 g) was dissolved in distilled water (50 mL, 1% w/v), followed by the dropwise addition of zinc acetate solution (10 mL, 0.1 mol L−1) under continuous stirring. The precipitate was gradually generated by adjusting the pH of the mixed solution with 0.1 mol L−1 of NaHCO3. The precipitate was centrifuged, and CMCS–Zn was obtained through freeze-drying.
2.3 Preparation of CMCS–Zn–CA complex
CMCS–Zn–CA was synthesized using a microwave-assisted method with a mass ratio of 5:2:2 (CMCS–Zn–CA) (Fig. 1). In detail, 10 mL of 0.1 mol per L zinc acetate was slowly added into a solution of CMCS (0.5 g/50 mL water) under stirring, and 10 mL of 0.02 mol per L potassium persulfate was added dropwise. Subsequently, 0.2 g of CA was added into the solution, followed by stirring for 60 min. The reaction was initiated in a 300 W microwave oven for 1 minute, put up for cooling, and the operation was repeatedly processed for three times. Subsequently, the mixture was poured into the dialysis bag (MWCO 8000–14000 Da), dialyzed against distilled water for 72 h, and CMCS–Zn–CA was obtained after freeze-drying, yielding 0.6128 g as a yellowish-brown powder.
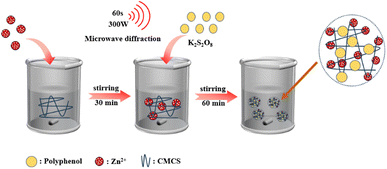 |
| | Fig. 1 Schematic of the preparation of CMCS–Zn–CA. | |
2.4 Determination of grafting rate
The grafting rate of CMCS–Zn–CA was determined using the Folin–Ciocalteu method with slight modifications.34 In brief, 1 mL of 1 mg per mL CMCS–Zn–CA solution was mixed with 2.5 mL of Folin–Ciocalteu reagent (after a ten-fold dilution) and left to react in the dark for 5 min. Then, 4 mL of Na2CO3 (5%, w/v) was added to the mixture. The absorbance of the solution was measured at 760 nm after being fully shaken and reacted at 30 °C for 2 h. The standard curve was constructed using the CA concentration and absorbance data, and the grafting rate of the samples was expressed as mg CA equivalents per gram of CMCS–Zn–CA (mg CAE per g).
2.5 Structural characterization
The structures were characterized by FTIR, UV-vis, XRD, TGA and XPS. The FTIR spectra were measured in the range of 4000–400 wavenumbers by a spectrometer (Thermo Nicolet 6700). The UV-vis spectra were measured from 200 nm to 400 nm with a spectrophotometer (LAMBDA 850+). The XRD spectra were determined in the 2θ range of 5–70° by an X-ray diffractometer (Bruker D8). The thermal stability of the complexes was evaluated on a thermal gravimetric analyzer (STA 2500) under nitrogen protection in the temperature range of 25–550 °C and heating rate of 10 °C min−1. XPS data were measured on an X-ray photoelectron spectrometer (Thermo Scientific) using Al Kα X-ray with 12 kV of working voltage.
2.6 Antioxidant activity assessment
2.6.1 DPPH radical scavenging activity. The DPPH radical scavenging activity was determined. Briefly, 2 mL of 0.1 mmol per L DPPH in alcohol and 2 mL of the sample solution with different concentration gradients were added to the test tubes, and the absorbance of the solutions was measured at 517 nm after equilibrating in the dark at ambient temperature for 30 min. The DPPH radical scavenging activity was calculated by the following formula:
where A1 is the absorbance of the sample, and A0 is the absorbance of the control (anhydrous ethanol instead of the sample).
2.6.2 Hydroxyl radical scavenging activity. The hydroxyl radical scavenging activity was measured as follows: 0.5 mL of 1.5 mmol per L 1,10-phenanthroline, 1 mL of 20 mmol per L PBS buffer solution, and 1.5 mL of sample solution in varying concentrations were mixed together. Subsequently, 0.5 mL of 0.5 mmol per L ferrous sulfate and 0.5 mL of 0.1% H2O2 were added to the solution. The absorbance of the solutions was measured at 536 nm after 50 min of incubation at 37 °C. The hydroxyl radical scavenging activity was calculated by the following formula:
where As is the absorbance of the sample, A0 is the absorbance of the blank (water instead of the sample), and Ac is the absorbance of the control (water instead of H2O2).
2.7 Sustainability of antioxidant activity
The sustainability of CMCS–Zn–CA was determined according to the literature.35 Specifically, 1 mg mL−1 of the sample solution was initially prepared, stored at room temperature, and the CA content and DPPH radical scavenging capacity were measured in the upcoming 6 days. The percentages of the remaining CA content and DPPH radical scavenging activity were calculated to evaluate the sustainability of CMCS–Zn–CA.
2.8 Determination of antibacterial activities
2.8.1 MIC and MBC analysis. The antibacterial activity of the complexes was evaluated by determining the minimal inhibitory concentration (MIC) and minimum bactericidal concentration (MBC) against E. coli (ATCC 25922) and S. aureus (ATCC 43300), in accordance with the literature.36,37 In general, the bacteria were cultured until the logarithmic phase and diluted to 105 CFU mL−1. Then, 10 μL of sample solutions with different concentration gradients and 90 μL of bacterial solutions were added to the 96-well plate, and incubated at 37 °C for 16 h. The lowest concentration that did not result in turbidity in the pore was recorded as the minimum inhibitory concentration (MIC). In terms of MBC, 10 μL of solution was removed and applied to the corresponding solid medium. The solid medium was then cultured at 37 °C for 18 h, and the lowest concentration without visible bacterial growth was recorded as MBC. The MIC and MBC data were measured three times in parallel.
2.8.2 Time-kill curves. To study the inhibition time of the samples against S. aureus and E. coli, the mid-log phase bacteria were diluted to 105 CFU mL−1, and then mixed with sample solutions of different concentrations (1×, 2×, 4× MIC), respectively. Finally, the mixture was taken for colony counting at various time points (0, 1, 2, 4, 6, 8, 10, 12, and 24 h). Sterile water was used as a blank control, and all data were repeated three times in parallel.
2.8.3 Plate count assay. A visual evaluation of the antibacterial activity of samples was performed by plate counting. The pretreatment of bacteria and the configuration of the sample solution were the same as that described in Section 2.8.2, and 100 μL of mixture was taken for colony counting at the time point of 10 h. Sterile water was used as a blank control.
2.8.4 Bacteria morphology illustration. Scanning electron microscopy (SEM) was employed to elucidate the inhibition mechanism of the samples on bacteria. Specifically, bacteria in the logarithmic phase were treated with different samples (4× MIC) for 2 h at 37 °C. Subsequently, the bacteria were centrifuged, washed with PBS, and ultimately fixed with 2.5% glutaraldehyde at 4 °C. The bacteria were gradually dehydrated with different concentrations of ethanol and dried overnight. The morphology of the bacteria after palladium sputtering was observed by SEM. Sterile water was used as a blank control.
2.9 Application assessment in milk storage
2.9.1 pH and acidity analysis. The practical application of the sample was evaluated by determining the freshness of the milk, as previously described.38 Fresh milk was divided into 20 mL for each bottle, and different samples of the same weight were added (600 μg mL−1) and stored at room temperature. Concurrently, the pH and acidity (°T) of the milk with different samples were measured at various time points (0, 12, 24, 48, and 72 h), with which °T was calculated by the consumed titrating volumes of 0.1 mol per L NaOH. The pH measurement method is outlined as follows: two buffer solutions with known precise pH values were used to calibrate the pH meter. Then, the electrode was immersed in the sample to obtain a stable reading, accurate to 0.01. The procedure for determining acidity is outlined as follows: 4 mL of milk sample was accurately transferred into a 250 mL conical flask. Then, 96 mL of distilled water was measured and the mixture was stirred for 20 minutes. The standard NaOH solution was added dropwise to the conical flask with a burette until the pH stabilized at 8.30 ± 0.01. The entire titration process was completed within 1 minute. The mL of the sodium hydroxide solution used in the titration was recorded, and the acidity of the sample was obtained through conversion.
2.9.2 Bacteria count. The bacterial counts of the milk in different samples were conducted as described previously.39 Briefly, the bacteria were cultured until the logarithmic phase was achieved, and diluted with milk until to 105 CFU mL−1. Then, the milk containing the above-mentioned bacteria was divided into 1 mL per tube, followed by the addition of solid samples in an amount of 2000 μg mL−1. The solutions were then stored at 4 °C for 5 d, after which the number of bacteria in the different treatment groups was recorded daily.
3. Results and discussion
3.1 Preparation of CMCS–Zn–CA
CMCS–Zn–CA was prepared by a free radical-mediated grafting method under microwave irradiation (Fig. 1). The process can be divided into three key steps: (i) the chelation of zinc ions with the hydroxyl of CMCS to produce CMCS–Zn complexes, facilitating the breaking of the O–H and N–H bonds; (ii) the formation of the oxygen radical and nitrogen radical from CMCS–Zn by the dissociation of O–H and N–H in the presence of sulfate radicals generated by the decomposition of persulfate; and (iii) the complexing of O–H and N–H in the CA molecules with the oxygen radical and nitrogen radical in CMCS–Zn to form the ternary complex CMCS–Zn–CA. The grafting rate of CMCS–Zn–CA was evaluated by measuring the total CA content in the complexes, and an optimized grafting rate of 84.21 mg CAE per g could be achieved. The subsequent bioactivity tests demonstrate that the bioactivity of CMCS–Zn–CA is linearly dependent on the grafting rate, i.e., a higher grafting rate results in greater bioactivity. Furthermore, the preparation of CMCS–Zn–CA under microwave condition should use potassium persulfate as the initiator, instead of the traditional initiator VC and H2O2.40 This is because H2O2 can be easily decomposed. The hydroxyl radical produced is less stable than the sulfate radical, resulting in disappointing reaction consequences.
3.2 Characterization of CMCS–Zn and CMCS–Zn–CA
3.2.1 FT-IR spectra. FT-IR spectroscopy confirmed the successful synthesis of CMCS–Zn–CA (Fig. 2). The CA spectrum showed the characteristic O–H stretching vibrations at 3430 cm−1 and 3220 cm−1, with the aromatic C![[double bond, length as m-dash]](https://www.rsc.org/images/entities/char_e001.gif) C stretching at 1450 cm−1. CMCS exhibited a broad peak at 3412 cm−1 (N–H and O–H stretching) and a characteristic C–N stretching band at 1351 cm−1. Upon zinc complexation, CMCS–Zn showed a slight shift in the N–H/O–H stretching band to 3409 cm−1, indicating successful metal chelation. The CMCS–Zn–CA spectrum retained the C–N stretching signature (∼1351 cm−1), while incorporating aromatic CC stretching features (1450–1650 cm−1). Changes in the hydroxyl peak position and intensity further confirmed the successful incorporation of both zinc ions and CA into the CMCS structure.
C stretching at 1450 cm−1. CMCS exhibited a broad peak at 3412 cm−1 (N–H and O–H stretching) and a characteristic C–N stretching band at 1351 cm−1. Upon zinc complexation, CMCS–Zn showed a slight shift in the N–H/O–H stretching band to 3409 cm−1, indicating successful metal chelation. The CMCS–Zn–CA spectrum retained the C–N stretching signature (∼1351 cm−1), while incorporating aromatic CC stretching features (1450–1650 cm−1). Changes in the hydroxyl peak position and intensity further confirmed the successful incorporation of both zinc ions and CA into the CMCS structure.
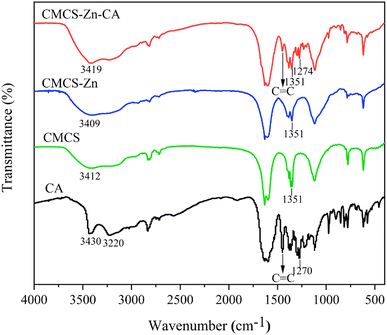 |
| | Fig. 2 FT-IR spectra of CA, CMCS, CMCS–Zn, and CMCS–Zn–CA. | |
3.2.2 UV-vis spectra. UV-vis spectra of the samples were recorded and depicted as shown in Fig. 3. It has been shown that, in the range of 200–400 nm, there is no obvious absorption peak for either CMCS or CMCS–Zn. However, the characteristic absorption peaks corresponding to the aromatic rings appeared in the curves of CA and CMCS–Zn–CA, indicating the successful grafting of CA. A further comparison of CA with CMCS–Zn–CA reveals that there exists an obvious difference in the wavelength (342 nm versus 318 nm) with a brilliant blue shift, which can be interpreted as the chelation of zinc ions with both of O–H groups in CMCS and phenolic hydroxyl groups in CA. The changes in the intensity and the width between the two curves can also be attributed to the chelation. According to the UV-vis spectra analysis, we can reasonably predict the possibly improved bioactivities of CMCS–Zn–CA in the subsequent experiments, which probably results from the chelation of zinc ions to activate the O–H bonds in CMCS and CA.
 |
| | Fig. 3 UV-vis spectra of CA, CMCS, CMCS–Zn, and CMCS–Zn–CA. | |
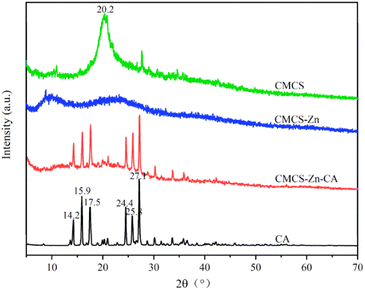
3.2.3 XRD analysis. The XRD spectra of the samples are displayed in Fig. 4. It can be seen that the XRD pattern of CA exhibited six sharp peaks ranging from 14.2° to 27.1° with a high degree of crystallinity, while CMCS exhibited a peak at 20.2°. With the participation of zinc ions, a broad peak appeared. This can be attributed to the introduction of the metal, leading to the breakage of intra- and inter-molecular hydrogen bonds in the CMCS molecule and a concomitant decrease in crystallinity.41 When zinc ions and CA were simultaneously introduced into CMCS, the crystallinity of CMCS–Zn–CA was significantly decreased, as shown by the broad peaks. This can be attributed to the introduction of CA and zinc ions impeding the formation of inter- and intra-molecular hydrogen bonds in CMCS.42
 |
| | Fig. 4 XRD spectra of CA, CMCS, CMCS–Zn, and CMCS–Zn–CA. | |
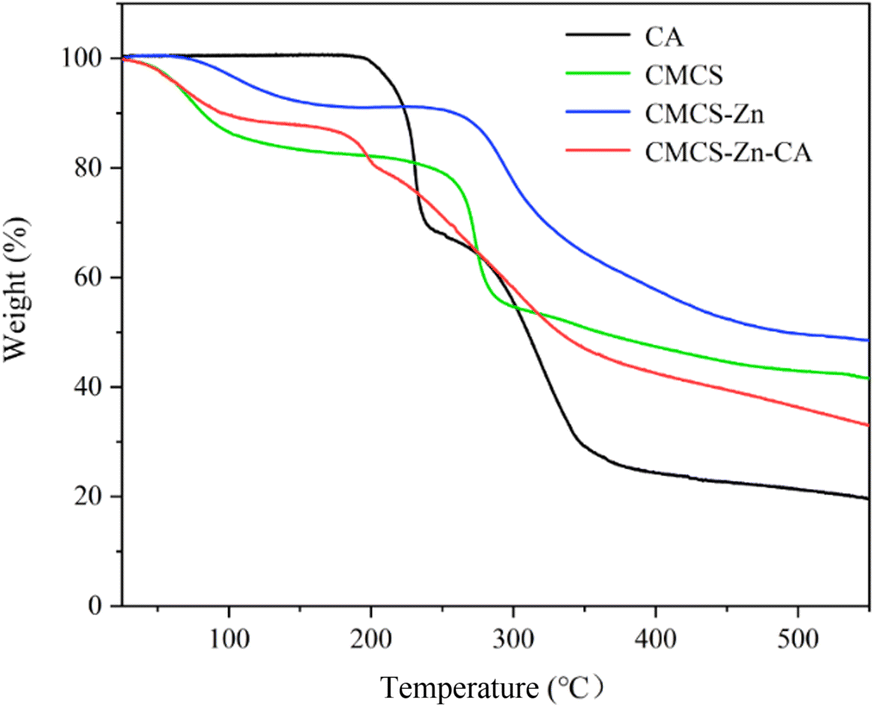
3.2.4 Thermogravimetric analysis. The thermogravimetric spectra are illustrated in Fig. 5. We can see that CMCS–Zn–CA exhibits mass loss behaviour in three distinct stages. Specifically, the initial stage below 132 °C can be attributed to the loss of residue and bound water, with a mass loss of 15.92%. The second stage, occurring within the temperature range of 132 °C to 288 °C, was associated with the decomposition of the complexes, resulting in a major mass loss of 27.86%. The third stage at temperatures above 288 °C involves the carbonization of glycogen and polyphenol units, with a mass loss of 14.64%. In summary, CMCS–Zn–CA exhibits good thermal stability, and the complexing of zinc ions can improve the thermal stability.
 |
| | Fig. 5 TG analysis of CA, CMCS, CMCS–Zn, and CMCS–Zn–CA. | |
3.2.5 XPS analysis. The results of the XPS analysis are shown in Fig. 6. It has been shown that the peak from zinc appeared in CMCS–Zn and CMCS–Zn–CA (Fig. 6a), while the peak from N emerged in CMCS, CMCS–Zn, and CMCS–Zn–CA (Fig. 6b), individually verifying the presence of zinc and CMCS in the complexes. Fig. 6b reveals that the N-peak of CMCS–Zn–CA was divided, which further verified the successful grafting of CA. The results of the elemental analysis (Table 1) demonstrated that 4.4% and 1.68% of Zn has been introduced in CMCS–Zn and CMCS–Zn–CA, respectively.
 |
| | Fig. 6 XPS spectra of Zn 2p (a) and N 1s (b) of CA, CMCS, CMCS–Zn, and CMCS–Zn–CA. | |
Table 1 Content of elements in the samples
| Sample |
C (%) |
N (%) |
O (%) |
Zn (%) |
| CA |
69.3 |
0 |
30.7 |
0 |
| CMCS |
58.88 |
5.4 |
35.72 |
0 |
| CMCS–Zn |
58.02 |
5.76 |
31.82 |
4.4 |
| CMCS–Zn–CA |
58.66 |
4.6 |
35.06 |
1.68 |
3.3 Antioxidative activity assessment
3.3.1 DPPH radical scavenging activity. The DPPH radical scavenging activities of the substances are presented in Fig. 7. It can be seen that for CMCS, zinc ions, CA and their physical mixture of the same concentration, the radical scavenging rates of the DPPH radical were significantly lower than those of the CMCS–Zn–CA complex. This indicates that the excellent radical scavenging effect is the result of the material itself, rather than a simple superposition effect. Furthermore, from the figure, a minimal DPPH radical scavenging rate can be found for the original CMCS, while CMCS–Zn and CMCS–Zn–CA displayed excellent DPPH radical scavenging activities that increased with the rising concentrations. More specifically, 25 μg mL−1 of CMCS–Zn and CMCS–Zn–CA achieved the maximal radical scavenging rates of 31.54% and 95.45%, respectively, while only approximately 10% of the scavenging rates can be obtained with the same concentration of CMCS. Therefore, we can conclude that with the participation of zinc and CA to CMCS, a large increase in the DPPH radical scavenging rate is achieved with CMCS–Zn–CA. This may be attributed to two points: One is that the coordination between the zinc ions and hydroxyl groups can improve the activity of hydroxyl groups in CMCS, and the other is that the presence of CA further increased the active hydroxyl groups and resulted in the complexes becoming more sensitive to DPPH radicals.
 |
| | Fig. 7 DPPH radical scavenging activity of the samples (p < 0.05). | |
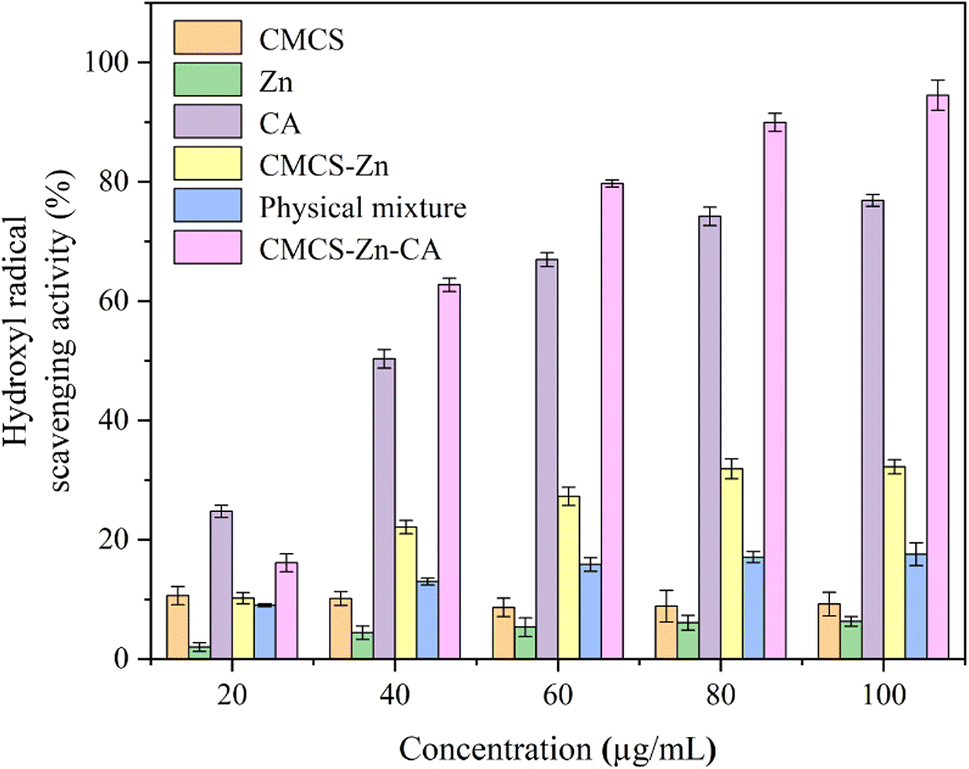
3.3.2 Hydroxyl radical scavenging activity. The hydroxyl radical scavenging activity analysis (Fig. 8) revealed patterns similar to those observed in the DPPH radical scavenging assays. The CMCS–Zn–CA complex itself has the best hydroxyl radical scavenging effect. At 100 μg mL−1, CMCS–Zn–CA demonstrated exceptional hydroxyl radical scavenging activity (92.45%), substantially higher than both CMCS–Zn (32.23%), physical mixture (17.57%) and unmodified CMCS (9.21%), CA (76.91), Zn (6.31%). Particularly, CMCS–Zn–CA has an excellent scavenging effect on both DPPH and hydroxyl radicals, exceeding 90% of the scavenging rate. These results indicate that the combination of CMCS, Zn and CA can yield significantly improved antioxidant properties.
 |
| | Fig. 8 Hydroxyl radical scavenging activity of the samples (p < 0.05). | |
3.4 Sustainability of antioxidant activity
Polyphenols have been well-known for their excellent antioxidant properties. However, their instability in aqueous solution and susceptibility to external environment result in a serious loss of their antioxidant capacity. The main purpose of this work was to explore potential antioxidants with sustained capacity, so we tried to make a comparison between the sustainability of CMCS–Zn–CA and CA in a natural storage condition, as shown in Fig. 9. A gradual decline can be seen in the CA content and DPPH radical scavenging rate of CA and CMCS–Zn–CA over time. However, after six days of storage, CMCS–Zn–CA maintained 93.9% of its initial CA content and 95.4% of its DPPH radical scavenging activity, significantly outperforming free CA (81.7% and 87.9%, respectively). These results demonstrate that incorporation into the CMCS–Zn complex substantially enhances the CA stability.
 |
| | Fig. 9 Persistence of CA and CMCS–Zn–CA. | |
3.5 Assessment of antibacterial activity
3.5.1 MIC and MBC analysis. The antibacterial activity of the samples was evaluated by determining MIC and MBC against E. coli (ATCC 25922) and S. aureus (ATCC 43300), and the results are listed in Table 2. It can be seen from Table 2 that the MIC and MBC values of the individual CMCS, CA and Zn2+ were all higher than those of the CMCS–Zn–CA complex, indicating that this complex itself has a better antibacterial effect. More specifically, 125 μg mL−1 and 500 μg mL−1 of MICs were found for CMCS–Zn–CA against S. aureus and E. coli, respectively. Meanwhile, the MBCs of CMCS–Zn–CA against the two strains were 500 μg mL−1 and 1000 μg mL−1. Moreover, it can be seen that the MICs and MBCs of CMCS–Zn were lower than CMCS, but higher than CMCS–Zn–CA. This illustrates that the presence of Zn2+ and CA can significantly improve the antibacterial efficacy of CMCS, which might be attributed to two reasons: one is that Zn2+ itself has a certain antibacterial effect and can enhance the biological activity of hydroxyl groups through the interaction; the other is that phenolic hydroxyl groups can exert certain antibacterial effects by complexing proteins. Polyphenols contain a large number of phenolic hydroxyl groups, which makes the grafted complexes have better antibacterial effects.
Table 2 MIC and MBC of the samples against the tested bacteriaa
| |
Strains |
Concentration (μg mL−1) |
| CMCS |
Zn |
CA |
CMCS–Zn |
CMCS–Zn–CA |
| MIC: minimal inhibitory concentration, MBC: minimal bactericide concentration. |
| MIC |
S. aureus |
2000 |
500 |
2000 |
250 |
125 |
| E. coli |
>2000 |
2000 |
>2000 |
1000 |
500 |
| MBC |
S. aureus |
>2000 |
2000 |
>2000 |
1000 |
500 |
| E. coli |
>2000 |
>2000 |
>2000 |
>2000 |
1000 |
3.5.2 Time-kill curves. The antibacterial activity of CMCS–Zn–CA against S. aureus and E. coli was subsequently assessed through time-kill curves, as shown in Fig. 10. It can be seen that the original CMCS demonstrated very low inhibitory activity against the two bacteria compared to the control group (Fig. 10a and b). Meanwhile, CMCS–Zn displayed an obvious enhancement in the inhibitory effect (Fig. 10c and d), which can be attributed to the introduction of Zn2+ in CMCS. It should be noted that, with the coupling of zinc ion and caffeic acid, CMCS–Zn–CA shows a significant enhancement in the inhibition of both strains (Fig. 10e and f). Specifically, CMCS–Zn–CA can tremendously inhibit the growth of the bacteria at a concentration of 4× MIC. Furthermore, the bacteria can be completely depressed in a period of 4 to 12 h, indicating that the antibacterial effect is inseparable from the effect of zinc ion and CA.
 |
| | Fig. 10 Time-kill curves of antibacterial activity. (a, c and e) CMCS, CMCS–Zn, and CMCS–Zn–CA against S. aureus, respectively. (b, d and f) CMCS, CMCS–Zn, and CMCS–Zn–CA against E. coli, respectively. | |
3.5.3 Plate count assay. The antibacterial activities of the chemicals were further visualized by plate count of the strains after the chemicals were introduced for 10 h, as illustrated in Table 3. It can be clearly seen that, in contrast to the control group, CMCS demonstrated relatively limited antibacterial capacity, and the number of bacteria was significantly reduced by the treatment of CMCS–Zn. Notably, CMCS–Zn–CA displayed a minimal number of E. coli and S. aureus colonies at concentrations of 2× and 4× MIC, and the number of bacteria was nearly zero, suggesting that CMCS–Zn–CA exhibited the best antibacterial activity. The results reveal that the incorporation of Zn and CA effectively enhance the antibacterial capacity of CMCS, which is consistent with the previous consequences of the time-kill curve analysis.
Table 3 Plate count for the further comparison of antibacterial activities after 10 h (digital unit log10 CFU mL−1)
| Bacteria |
Sample |
CK |
1× |
2× |
4× |
| S. aureus |
CMCS |
12.93 |
8.41 |
7.62 |
7.54 |
| CMCS–Zn |
13.57 |
6.00 |
4.24 |
2.99 |
| CMCS–Zn–CA |
12.42 |
3.38 |
0 |
0 |
| E. coli |
CMCS |
8.81 |
8.31 |
8.04 |
7.95 |
| CMCS–Zn |
8.66 |
7.23 |
6.34 |
4.85 |
| CMCS–Zn–CA |
8.55 |
1.15 |
0 |
0 |
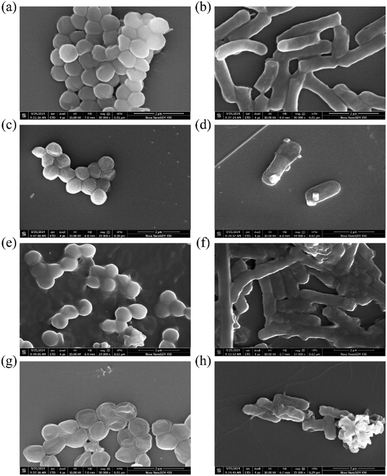
3.5.4 Bacteria morphology illustration. Fig. 11 illustrates the morphology and integrity of E. coli and S. aureus. It can be seen that the control group of E. coli and S. aureus exhibited intact bacterial morphology and smooth surfaces (Fig. 11a and b); however, after being treated with CMCS, S. aureus displayed slight wrinkling on the surface, while E. coli showed hardly any macroscopic alterations (Fig. 11c and d). It can be seen that pronounced filaments and shrinkage were observed on the surface of both bacteria when treated with CMCS–Zn (Fig. 11e and f) and CMCS–Zn–CA (Fig. 11g and h). A further comparison showed that the bacterial damage caused by CMCS–Zn–CA was significantly greater than that by CMCS and CMCS–Zn, which further validates that CMCS–Zn–CA has an excellent antibacterial effect. It can be concluded that the antibacterial action may be achieved by disrupting the cell barrier.
 |
| | Fig. 11 SEM analysis of S. aureus (a, c, e and g) and E. coli (b, d, f and h) treated with different samples (4× MIC) for 2 h. (a and b) Treatment with sterile water. (c and d) Treatment with CMCS. (e and f) Treatment with CMCS–Zn. (g and h) Treatment with CMCS–Zn–CA. | |
3.6 Application assessment in milk storage
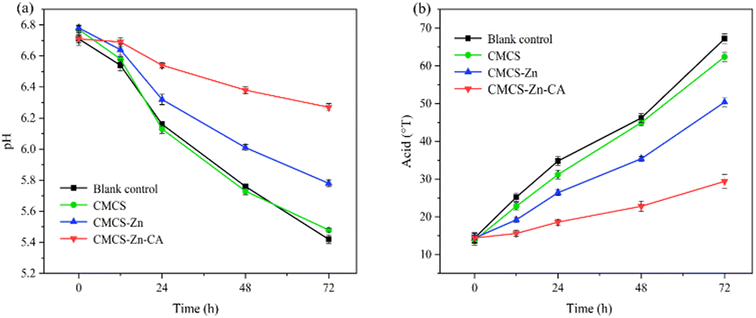
3.6.1 pH and acidity analysis. An increase in acidity and a decrease in pH can be caused by microbial activity in milk storage. Thus, a measurement of the changes in pH and acidity can provide a reliable method to assess milk freshness. As shown in Fig. 12a, there is a decrease in the pH value of milk, which can be attributed to two reasons: (i) the fat in milk oxidizes and goes rancid, generating small-molecule acids, which leads to a drop in pH; (ii) the naturally occurring microorganisms in milk will reproduce at room temperature, decomposing the lactose in milk to produce lactic acid, resulting in a decrease in pH. In addition, a further comparison shows that the pH values of both the control and CMCS groups decreased rapidly, while the pH in the CMCS–Zn–CA group maintained a relatively high level after 72 h. Specifically, the pH value of the milk solution in the control and CMCS groups were 5.42 and 5.48 after 72 h storage, respectively, and the pH value of the milk solution in the CMCS–Zn–CA group was 6.27 after the same storage time, demonstrating that the latter was better preserved. Similar results were obtained in the acidity measurements (Fig. 12b). It can be seen that, after 72 h of storage, the control and CMCS groups exhibited values of 67.2 °T and 62.4 °T, respectively, while the CMCS–Zn–CA group showed much lower acidity of 29.4 °T. In summary, the consequences of the pH and acidity measurement validate the superior preservation capabilities of CMCS–Zn–CA, proposing a promising approach in milk preservation.
 |
| | Fig. 12 Changes in milk pH (a) and acidity (b) after different sample treatments. | |
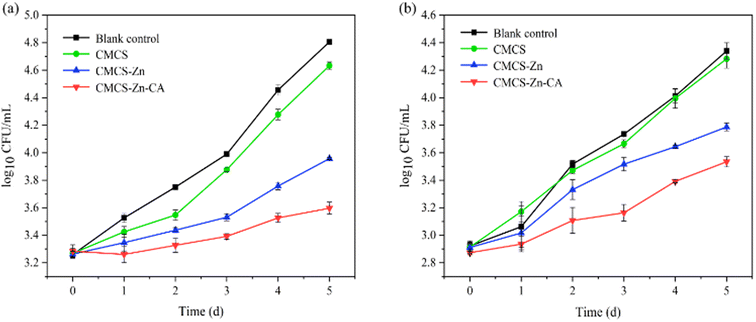
3.6.2 Bacterial count. To evaluate the impact of the different treatments on bacteria growth, the plate counting method was applied to assess the ability of bacterial inhibition, and the results are shown in Fig. 13. It can be seen that the bacterial counts in the untreated milk increased rapidly over 5 days, with S. aureus reaching 4.81log10 CFU mL−1 and E. coli reaching 4.34log10 CFU mL−1. Although no significant inhibition of bacterial growth was observed in the CMCS-treated milk, bacterial counts of S. aureus and E. coli after treatment with CMCS–Zn–CA decreased to 3.59log10 CFU mL−1 and 3.53log10 CFU mL−1, respectively, indicating that CMCS–Zn–CA can effectively inhibit the growth of both bacteria. Furthermore, it can be seen that the inhibition of S. aureus was more pronounced than that of E. coli, suggesting a stronger effect on Gram-positive bacteria.
 |
| | Fig. 13 Inhibition abilities of CMCS, CMCS–Zn and CMCS–Zn–CA against S. aureus ATCC 43300 and E. coli ATCC 25922 in milk. (a) Samples against S. aureus. (b) Samples against E. coli. | |
4. Conclusions
A ternary complex, CMCS–Zn–CA, was successfully prepared by employing the free radical mediated grafting method under microwave irradiation. The structure was characterized by FTIR, UV-vis, XRD, TGA and XPS, and the grafting rate of CMCS–Zn–CA was found to be 84.21 mg CAE per g. The antioxidant activity assays revealed that CMCS–Zn–CA possesses an exceptional capacity to scavenge both DPPH and hydroxyl radicals, with a scavenging rate exceeding 90%. The sustainability test showed that CMCS–Zn–CA demonstrated a CA content of 93.9% and a DPPH radical scavenging rate of 95.4% after six days, while only 81.7% and 87.9% for CA, respectively. Furthermore, MIC and MBC measurements showed that the MICs of CMCS–Zn–CA against S. aureus and E. coli were 125 μg mL−1 and 500 μg mL−1, respectively. Meanwhile, the MBCs of CMCS–Zn–CA against the two strains were 500 μg mL−1 and 1000 μg mL−1, respectively, which were significantly lower than that of CMCS. The time-kill curves and plate counts demonstrated that CMCS–Zn–CA has an excellent inhibitory effect on both bacteria. The mechanism exploration indicated that the bacterial damage caused by CMCS–Zn–CA was significantly greater than that by CMCS and CMCS–Zn. It could be inferred that the antibacterial action might be achieved by destroying the cell barrier of bacteria. The results of the application assessment showed that CMCS–Zn–CA can result in a higher pH value, lower acidity and lower bacteria count, indicating superior antioxidative and antibacterial ability to prolong the milk storage time. In summary, the present study proposes novel Zn2+ and caffeic acid coupled complexes with excellent simultaneous antioxidant and antibacterial activities, and the sustainability of its high bioactivities forecasts the brilliant prospect in the application of health care and food preservation.
Data availability
Data will be made available upon request.
Author contributions
Yuhui Zhang: conceptualization, data curation, formal analysis, investigation, writing – original draft. Wenna Zhai: formal analysis, investigation. Mengdi Xia: formal analysis, validation. Yangzi Rao: data curation, investigation, validation. Yuxin Yang: formal analysis, methodology. Xiao Wang: visualization, project administration, supervision. Jianfeng Zhang: writing – review & editing, visualization, project administration, funding acquisition, supervision.
Conflicts of interest
The authors declare no conflict of interest.
Acknowledgements
This work was supported by the Open Research Fund from Zhejiang Collaborative Innovation Center for High Value Utilization of byproducts from Ethylene Project (Ningbo Polytechnic College) in 2021–2022 (No. NZXT202103) and the Natural Science Foundation of Ningbo (No. 2024J407).
References
- Z. Tao, J. Wang and H. Wu, et al., ACS Appl. Mater. Interfaces, 2023, 15, 11474–11484 CrossRef CAS PubMed.
- J. Xie, N. Wang and X. Dong, et al., ACS Appl. Mater. Interfaces, 2018, 11, 2579–2590 CrossRef PubMed.
- H. Zhang, M. Liu and Y. Liu, et al., Spectrochim. Acta, Part A, 2025, 325, 125119 CrossRef CAS PubMed.
- G. Huang, X. Mei and J. Hu, Curr. Drug Targets, 2017, 18, 1296–1300 CAS.
- X. Guo, J. Food Process. Eng., 2024, 47, 14690 CrossRef.
- P. Li, L. Sun and S. Xue, et al., SmartMat, 2022, 3, 226–248 CrossRef CAS.
- H. Z. Zhang, L. L. Gan and H. Wang, et al., Mini-Rev. Med. Chem., 2017, 17, 122–166 CrossRef CAS PubMed.
- P. K. Dutta, J. Dutta and V. S. Tripathi, J. Sci. Ind. Res., 2004, 63, 20–31 CAS.
- S. Manna, A. Seth and P. Gupta, et al., ACS Biomater. Sci. Eng., 2023, 9, 2181–2202 CrossRef CAS PubMed.
- J. Jin, B. Luo and S. Xuan, et al., Int. J. Biol. Macromol., 2024, 266, 131253 CrossRef CAS PubMed.
- T. Yan, C. Li and Q. Ouyang, et al., React. Funct. Polym., 2019, 137, 38–45 CrossRef CAS.
- Y. Yu, Z. Su and Y. Peng, et al., Int. J. Biol. Macromol., 2025, 289, 138772 CrossRef CAS PubMed.
- Q. Hu and Y. Luo, Carbohydr. Polym., 2016, 151, 624–639 CrossRef CAS PubMed.
- L. Wang, Z. Luo and J. Yan, et al., Ultrason. Sonochem., 2020, 68, 105184 CrossRef CAS PubMed.
- M. I. H. Mondal and F. Ahmed, J. Text. Inst., 2020, 111, 49–59 CrossRef CAS.
- E. Cohen and E. Poverenov, Chem.–Eur. J., 2022, 28, 67 Search PubMed.
- L. Upadhyaya, J. Singh and V. Agarwal, et al., Carbohydr. Polym., 2013, 91, 452–466 CrossRef CAS PubMed.
- M. Kurniasih, Purwati and T. Cahyati, et al., Int. J. Biol. Macromol., 2018, 119, 166–171 CrossRef CAS PubMed.
- J. Liu, J. F. Lu and J. Kan, et al., Int. J. Biol. Macromol., 2013, 62, 85–93 CrossRef CAS PubMed.
- M. E. Bodini, M. A. del Valle and R. Tapia, et al., Polyhedron, 2001, 20, 1005–1009 CrossRef CAS.
- A. Vijayakumar, R. Mohan and P. Jayaprakash, J. Indian Chem. Soc., 2024, 101, 101375 CrossRef CAS.
- X. Lin, K. Jin and L. He, et al., ChemistrySelect, 2023, 8, 1–10 Search PubMed.
- J. Zhao, D. Qian and L. Zhang, et al., RSC Adv., 2024, 14, 10410–10415 RSC.
- D. N. S. Hon and L. G. Tang, J. Appl. Polym. Sci., 2000, 77, 2246–2253 CrossRef CAS.
- R. L. Patale and V. B. Patravale, Carbohydr. Polym., 2011, 85, 105–110 CrossRef CAS.
- V.-L. Truong and W.-S. Jeong, Int. J. Mol. Sci., 2021, 22, 9109 CrossRef CAS PubMed.
- M. Ma, M. Gu and S. Zhang, et al., Int. J. Biol. Macromol., 2024, 259, 129267 CrossRef CAS PubMed.
- R. Bai, H. Yong and X. Zhang, et al., Int. J. Biol. Macromol., 2020, 143, 49–59 CrossRef CAS PubMed.
- L. Bian, H. Sun and Y. Zhou, et al., Molecules, 2022, 27, 8496 CrossRef CAS PubMed.
- R. J. Robbins, J. Agric. Food Chem., 2003, 51, 2866–2887 CrossRef CAS PubMed.
- J. Liu, X.-y. Wen and J.-f. Lu, et al., Int. J. Biol. Macromol., 2014, 65, 97–106 CrossRef CAS PubMed.
- S.-H. Yu, H.-Y. Hsieh and J.-C. Pang, et al., Food Hydrocoll., 2013, 32, 9–19 CrossRef CAS.
- X. Wang, Y. Du and H. Liu, Carbohydr. Polym., 2004, 56, 21–26 CrossRef CAS.
- M. Curcio, F. Puoci and F. Iemma, et al., J. Agric. Food Chem., 2009, 57, 5933–5938 CrossRef CAS PubMed.
- J. Wang, H. Li and Z. Chen, et al., Ind. Crops Prod., 2016, 89, 152–156 CrossRef CAS.
- M. J. Moreno-Vásquez, M. Plascencia-Jatomea and S. Sánchez-Valdes, et al., Polymers, 2021, 13, 1375 CrossRef PubMed.
- M. Matejczyk, R. Świsłocka and A. Golonko, et al., Adv. Med. Sci., 2018, 63, 14–21 CrossRef PubMed.
- S. Mao, Y. Zeng and Y. Ren, et al., Food Hydrocoll., 2025, 160, 110722 CrossRef CAS.
- Y. Shi, Y. Li and K. Yang, et al., Food Control, 2023, 144, 109374 CrossRef CAS.
- C. H. Zhang, X. Q. Yu and Y. J. Diao, et al., Iran. Polym. J., 2021, 30, 81–91 CrossRef CAS.
- E. O. Olanipekun, O. Ayodele and O. C. Olatunde, et al., Int. J. Biol. Macromol., 2021, 183, 1971–1977 CrossRef CAS PubMed.
- F. Li, Y. Yan and C. Gu, et al., Foods, 2022, 11, 3548 CrossRef CAS PubMed.
|
| This journal is © The Royal Society of Chemistry 2025 |
Click here to see how this site uses Cookies. View our privacy policy here. 
 Open Access Article
 This Open Access Article is licensed under a Creative Commons Attribution-Non Commercial 3.0 Unported Licence
 *ac
*ac