
 Open Access Article
 This Open Access Article is licensed under a Creative Commons Attribution-Non Commercial 3.0 Unported Licence
From lab to field: revolutionizing antibiotic detection with aptamer-based biosensors†
Dipanjan Das
,
Joydeep Chakraborty
,
Pankaj Mandal
,
Rittick Mondal
 * and
Amit Kumar Mandal
*
* and
Amit Kumar Mandal
*
Chemical Biology Laboratory, Department of Sericulture, Raiganj University, North Dinajpur, West Bengal 733134, India. E-mail: rittickm98@gmail.com; amitmandal08@gmail.com
First published on 5th June 2025
Abstract
Antibiotics were initially discovered for their medicinal applications, however, since their introduction, the usage of antibiotics has expanded beyond clinical settings into various sectors, including agriculture, aquaculture, and animal husbandry. In these fields, antibiotics have often been employed non-judicially, primarily as growth promoters or preventative measures against infections, rather than strictly for therapeutic purposes. This widespread and often indiscriminate use has resulted in significant repercussions for both the environment and public health. The accumulation of antibiotics in soil and water ecosystems has led to alterations in microbial communities, fostering the emergence and proliferation of antibiotic-resistant bacteria (ARB). As these resistant strains circulate through various environmental pathways, they pose a growing threat not only to animal health but also to human health. Thus, the need for rapid, highly sensitive, and affordable detection platforms for ARB diagnostics has become urgent. Up to now, many analytical methods have been reported for the determination of antibiotics, such as HPLC, LC-MS, GC-MS, capillary electrophoresis-MS, etc. But these techniques are expensive, time-consuming, and demand trained operators. The aptamer based biosensors circumvent these problems and could ensure fast on-site analysis of antibiotics. In this review, we discuss how nucleic acid aptamer functionalized nanoparticles emerged as a sanguine answer to overcome the limitations of traditional detection modalities. Moreover, the latest advancement in the development of lateral flow assay, colorimetric, chemiluminescent, surface plasmon resonance, fluorescence and electrochemical biosensors for antibiotics detection have also been explored.
 Dipanjan Das | Dipanjan Das was born in Raiganj, a town in the Uttar Dinajpur district of West Bengal, India. Growing up in a region known for its cultural richness and natural diversity, he developed a strong passion for life sciences and academic inquiry from an early age. He completed his secondary education at Sudarshanpur Dwarika Prasad Uchha Vidyachakra in Raiganj and pursued his undergraduate degree in Botany at Raiganj Surendranath Mahavidyalaya, affiliated with the University of Gour Banga. He went on to earn his M.Sc. in Botany from Raiganj University, where he refined his research abilities and deepened his expertise in plant biology and related disciplines. Following his post-graduation, Dipanjan qualified several of India's most competitive national examinations. In 2022, he achieved an impressive All India Rank (AIR) of 209 in the CSIR-NET Life Sciences exam, securing the prestigious Junior Research Fellowship (JRF). That same year, he also qualified the GATE examination in Life Sciences. Currently, Dipanjan is pursuing his PhD in the Department of Sericulture at Raiganj University. His future research will focus on the detection of residual antibiotics in sericulture-based products, aiming to enhance product safety, quality control, and consumer health standards within the silk industry and allied sectors. |
 Joydeep Chakraborty | Dr Joydeep Chakraborty is a dedicated microbiologist specializing in antimicrobial resistance, novel therapeutics, and computational drug discovery. He earned his PhD in Microbiology from Raiganj University in 2024, following a Gold Medal-awarded M.Sc. in Microbiology from the University of North Bengal. With a strong interdisciplinary foundation, Dr Chakraborty's research integrates computational and experimental approaches. His expertise includes in silico drug target identification, computer-aided drug design (CADD), and the investigation of bacterial ion channels. His work contributes significantly to the fields of drug repurposing, pathogen diagnostics, and translational microbiology. Dr Chakraborty has published extensively in top-tier peer-reviewed journals and co-authored several book chapters on emerging topics such as CRISPR-based detection systems and bioactive microbial compounds. His research continues to address critical global health challenges, with a strong focus on infectious disease management and antimicrobial stewardship. |
 Pankaj Mandal | Mr Pankaj Mandal is a dedicated researcher in sericulture, originally from Gajol, Malda district, West Bengal. He began his academic journey at Gazole Sewchand Parameswari Vidyamandir (H.S.) and went on to earn his B.Sc. and M.Sc. degrees in Sericulture from Raiganj University, where he developed a strong foundation in sericultural biotechnology and sustainable practices. Currently pursuing his PhD in the Department of Sericulture at Raiganj University, Mr Mandal is engaged in research that bridges traditional sericulture with modern biotechnological approaches. His academic path reflects a consistent focus on innovation and sustainability in silk production. His future research aims to explore antimicrobial compounds from actinomycetes, targeting pathogens that affect silkworm health. This work holds potential for advancing eco-friendly disease management in sericulture and discovering novel bioactive agents with broader agricultural and pharmaceutical applications. Through this interdisciplinary approach, Mr Mandal seeks to contribute to sustainable rural development and microbial biotechnology. |
 Rittick Mondal | Mr Rittick Mondal was born in Bauria, Howrah, West Bengal. He completed his schooling at Burikhali (K.M.) Institution in his hometown. Rittick earned his Bachelor of Science (B.Sc.) and Master of Science (M.Sc.) degrees in Microbiology from Vidyasagar University, West Bengal, in 2016 and 2018, respectively. He achieved the highest distinction in his M.Sc. program and was awarded a gold medal by Vidyasagar University in 2019. After completing his M.Sc., Rittick passed the ICAR-NET exam in Agricultural Microbiology in 2018 and enrolled in the PhD program in the Chemical Biology Laboratory, Department of Sericulture, at Raiganj University. In 2021, he was selected as a DST-INSPIRE Junior Research Fellow (JRF), which enabled him to pursue his doctoral research. Rittick currently holds the position of DST-INSPIRE Senior Research Fellow (SRF) in the same laboratory, working under the mentorship of Dr Amit Kumar Mandal, Assistant Professor in the Department of Sericulture at Raiganj University. To date, Rittick has authored over 30 publications in reputable journals, including those from Nature Portfolio, Elsevier, RSC, and ACS. His future research will focus on the development of lateral flow assays and point-of-care diagnostic devices, aiming to improve accessibility to rapid, accurate, and cost-effective diagnostic tools in healthcare and sericulture-related industries. |
 Amit Kumar Mandal | Dr Amit Kumar Mandal, born in Kharagpur, West Bengal, India, is a distinguished academic and leading researcher in chemical biology and nano-omics. He currently heads the Centre for Nanotechnology Science (CeNS) at Raiganj University. Dr Mandal completed both his M.Sc. and PhD at the University of North Bengal and previously served as a faculty member at Vidyasagar University under the UGC-Innovative Programme. With over a decade of experience in research, teaching, and academic leadership, he has authored more than 80 peer-reviewed SCI publications, holds three research patents, and has a cumulative impact score exceeding 400, as recorded by the Web of Science. He actively contributes to the global scientific community through editorial and peer-review roles with leading publishers including Nature Portfolio, RSC, ACS, Wiley, Elsevier, and BioMed Central. A recipient of the prestigious MRSC title, Dr Mandal has earned multiple accolades, including the highly cited review published by RSC & IOP Publishing Top Cited Papers India Award (2022). He is ranked among the top 0.5% of global scholars (ScholarGPS) and among the top 3% of biological scientists in India (AD Scientific Index, 2024). His future research focuses on nano-enabled drug delivery systems, biosensors, and molecular diagnostics aimed at combating infectious diseases, and antimicrobial resistance. These projects are supported by DST-SERB and other national funding agencies. |
1 Introduction
Antibiotic-resistant microorganisms are a global concern, contributing to a wide range of infectious diseases like cholera, tuberculosis, malaria, and leprosy. These conditions pose significant public health challenges, leading to high rates of morbidity and mortality in both adults and children. The situation is particularly alarming in the case of developing countries, where these challenges are even more pronounced.1,2 After, the discovery of antibiotics in the early 20th century the treatment of these diseases became much easier, and many modern medical procedures became possible.3 Antibiotics, useful in inhibiting or killing microorganisms, are essential not only for human and animal health but also in non-medical applications.4 Global antibiotic production has risen significantly within the last few years, with estimates suggesting 100![[thin space (1/6-em)]](https://www.rsc.org/images/entities/char_2009.gif) 000 to 200000 tons annually.5,6 In India, antibiotic consumption rate rose sharply from 2000 to 2018.7 The excessive and improper use of antibiotics in both humans and animals has led to the rise of antibiotic-resistant bacteria (ARB), posing a global health threat. This overuse has resulted in increased antibiotic excretion into the environment, which in turn promotes the ARB proliferation.8 Water soluble antibiotics, in particular, have the capacity to disperse rapidly across aquatic and terrestrial ecosystems, thereby impacting ecological balance and posing considerable risks to both environmental and human health.9 Moreover, resistant bacteria and resistance genes can enter the food chain, leading to infections that are increasingly refractory to conventional treatment.10 Despite ongoing global research efforts, antibiotic resistance continues to spread. To tackle this crisis, a comprehensive strategy is needed, addressing the overuse of antibiotics and their environmental dissemination. If left unchecked, AMR is projected to cause up to 10 million deaths annually by the year 2050.11 Organizations like the FDA, WHO, and FAO have established maximum residue limits (MRL) to monitor antibiotic levels in food, aiming to limit excessive use and reduce potential health risks (Table 1).10 To effectively monitor antibiotic contamination in the environment, the development and implementation of highly sensitive and selective detection methods are essential. Such analytical approaches are critical for accurately assessing the presence and concentration of antibiotic residues, thereby enabling timely intervention and informed strategies to mitigate their ecological and public health impacts. Although traditional analytical techniques, such as HPLC,12–15 GC-MS,16 LC-MS/MS,17–20 and capillary electrophoresis21,22 they present notable limitations. These methods are often cost-prohibitive, require sophisticated instrumentation and trained personnel, and may struggle to distinguish structurally similar antibiotic compounds. Additionally, the presence of certain additives can interfere with analyses and potentially damage sensitive equipment.10 In parallel, microbiological techniques and enzyme-linked immunoassays (ELISA), though more accessible and simpler to perform, are prone to false positives and typically involve longer detection times. Taken together, these challenges underscore the urgent need for innovative, rapid, sensitive, and cost-effective detection technologies to facilitate effective environmental monitoring of antibiotic contamination and help mitigate the spread of antibiotic resistance. Aptamer-based biosensors have emerged as a powerful and innovative alternative to conventional antibiotic detection methods, offering significant potential to transform environmental and food safety monitoring while contributing to efforts against antimicrobial resistance (AMR).10,23–26 Aptamer are short DNA or RNA molecules (20–80 nt) that specifically bind to target molecules, such as antibiotics, proteins, whole cell bacteria, heavy metals, etc.27 These molecular recognition elements underpin the exceptional performance of aptamer-based biosensors, which are characterized by their high sensitivity, selectivity, and stability. Unlike traditional detection approaches, aptasensors enable rapid, on-site analysis with minimal sample preparation and reduced susceptibility to matrix interference, thus overcoming common challenges such as false positives and complex instrumentation requirements.28–30 Recent advancements underscore the versatility and effectiveness of aptamer-based biosensing platforms. For example, Liu et al. developed a colorimetric aptasensor that achieved an ultra-low detection limit of 4.13 × 10⁻¹² μM for kanamycin in milk, utilizing nicking enzyme-assisted signal amplification.31 Likewise, Zhou et al. employed a catalytic hairpin assembly with G-quadruplex displacement to detect tetracycline with high sensitivity (LOD – 1.035 × 10⁻² μM), applicable to various food matrices.32 More recently, Li et al. introduced a label-free fluorescent aptasensor for enrofloxacin with an LOD of 1.58 × 10⁻⁴ μM, integrating a G-quadruplex structure and SYBR Green I dye.33 while Mohammadi et al. reported an electrochemical sensor for tetracycline with a detection limit as low as 1.2 × 10⁻⁴ μM using AuNPs-modified carbon nanofibers.34 Additionally, Ou et al. developed a lateral flow assay based aptasensor capable of detecting kanamycin residues in milk and honey with a visual threshold of 50 nM and a quantifiable LOD of 4.96 × 10⁻³ μM.35 Collectively, these recent studies highlight not only the rapid improvement in sensitivity and selectivity of aptamer platforms but also their adaptability for field-use diagnostics. This review consolidates such recent innovations, compares their methodological attributes, and identifies emerging opportunities for future development in real-world diagnostic applications.
000 to 200000 tons annually.5,6 In India, antibiotic consumption rate rose sharply from 2000 to 2018.7 The excessive and improper use of antibiotics in both humans and animals has led to the rise of antibiotic-resistant bacteria (ARB), posing a global health threat. This overuse has resulted in increased antibiotic excretion into the environment, which in turn promotes the ARB proliferation.8 Water soluble antibiotics, in particular, have the capacity to disperse rapidly across aquatic and terrestrial ecosystems, thereby impacting ecological balance and posing considerable risks to both environmental and human health.9 Moreover, resistant bacteria and resistance genes can enter the food chain, leading to infections that are increasingly refractory to conventional treatment.10 Despite ongoing global research efforts, antibiotic resistance continues to spread. To tackle this crisis, a comprehensive strategy is needed, addressing the overuse of antibiotics and their environmental dissemination. If left unchecked, AMR is projected to cause up to 10 million deaths annually by the year 2050.11 Organizations like the FDA, WHO, and FAO have established maximum residue limits (MRL) to monitor antibiotic levels in food, aiming to limit excessive use and reduce potential health risks (Table 1).10 To effectively monitor antibiotic contamination in the environment, the development and implementation of highly sensitive and selective detection methods are essential. Such analytical approaches are critical for accurately assessing the presence and concentration of antibiotic residues, thereby enabling timely intervention and informed strategies to mitigate their ecological and public health impacts. Although traditional analytical techniques, such as HPLC,12–15 GC-MS,16 LC-MS/MS,17–20 and capillary electrophoresis21,22 they present notable limitations. These methods are often cost-prohibitive, require sophisticated instrumentation and trained personnel, and may struggle to distinguish structurally similar antibiotic compounds. Additionally, the presence of certain additives can interfere with analyses and potentially damage sensitive equipment.10 In parallel, microbiological techniques and enzyme-linked immunoassays (ELISA), though more accessible and simpler to perform, are prone to false positives and typically involve longer detection times. Taken together, these challenges underscore the urgent need for innovative, rapid, sensitive, and cost-effective detection technologies to facilitate effective environmental monitoring of antibiotic contamination and help mitigate the spread of antibiotic resistance. Aptamer-based biosensors have emerged as a powerful and innovative alternative to conventional antibiotic detection methods, offering significant potential to transform environmental and food safety monitoring while contributing to efforts against antimicrobial resistance (AMR).10,23–26 Aptamer are short DNA or RNA molecules (20–80 nt) that specifically bind to target molecules, such as antibiotics, proteins, whole cell bacteria, heavy metals, etc.27 These molecular recognition elements underpin the exceptional performance of aptamer-based biosensors, which are characterized by their high sensitivity, selectivity, and stability. Unlike traditional detection approaches, aptasensors enable rapid, on-site analysis with minimal sample preparation and reduced susceptibility to matrix interference, thus overcoming common challenges such as false positives and complex instrumentation requirements.28–30 Recent advancements underscore the versatility and effectiveness of aptamer-based biosensing platforms. For example, Liu et al. developed a colorimetric aptasensor that achieved an ultra-low detection limit of 4.13 × 10⁻¹² μM for kanamycin in milk, utilizing nicking enzyme-assisted signal amplification.31 Likewise, Zhou et al. employed a catalytic hairpin assembly with G-quadruplex displacement to detect tetracycline with high sensitivity (LOD – 1.035 × 10⁻² μM), applicable to various food matrices.32 More recently, Li et al. introduced a label-free fluorescent aptasensor for enrofloxacin with an LOD of 1.58 × 10⁻⁴ μM, integrating a G-quadruplex structure and SYBR Green I dye.33 while Mohammadi et al. reported an electrochemical sensor for tetracycline with a detection limit as low as 1.2 × 10⁻⁴ μM using AuNPs-modified carbon nanofibers.34 Additionally, Ou et al. developed a lateral flow assay based aptasensor capable of detecting kanamycin residues in milk and honey with a visual threshold of 50 nM and a quantifiable LOD of 4.96 × 10⁻³ μM.35 Collectively, these recent studies highlight not only the rapid improvement in sensitivity and selectivity of aptamer platforms but also their adaptability for field-use diagnostics. This review consolidates such recent innovations, compares their methodological attributes, and identifies emerging opportunities for future development in real-world diagnostic applications.
| Antibiotics | Product | Detection object | MRL (μg kg−1) | |||
|---|---|---|---|---|---|---|
| The EU | Japan | USA | China | |||
| Gentamicin | Pig | Muscle | 50 | 100 | 100 | 100 |
| Fat | 50 | 100 | 400 | 100 | ||
| Liver | 200 | 2000 | 300 | 2000 | ||
| Kidney | 750 | 5000 | 400 | 5000 | ||
| Chicken | Tissue | — | — | 100 | 100 | |
| Muscle, fat | 100 | 40 | 100 | 100 | ||
| Liver | 600 | 40 | — | — | ||
| Kanamycin | Pig | Fat | 100 | 40 | — | 100 |
| Muscle | 100 | 40 | — | 100 | ||
| Liver | 600 | 900 | — | 600 | ||
| Kidney | 2500 | 4000 | 2500 | |||
| Chicken | Egg | — | 500 | — | — | |
| Muscle | 500 | 500 | 1200 | 500 | ||
| Neomycin | Cattle | Milk | 1500 | 2000 | 150 | 1500 |
| Egg | 500 | 500 | — | 500 | ||
| Kidney | 5000 | 10000 |
7200 | 9000 | ||
| Streptomycin/dihydrostreptomycin | Cattle, pig, chicken | Milk | 200 | 200 | — | 200 |
| Liver, muscle, fat | 500 | 600 | 500 | 600 | ||
| Kidney | 1000 | 1000 | 2000 | 1000 | ||
| Sheep | Muscle | 500 | 600 | 600 | 600 | |
| Liver | 500 | 600 | 600 | 600 | ||
| Kidney | 10000 |
1000 | 1000 | 1000 | ||
| Milk | — | — | 200 | |||
| Tetracycline/oxytetracycline/chlortetracycline | Cattle | Muscle, fat | 100 | — | 200 | — |
| Liver | 600 | — | 600 | — | ||
| Kidney | 1200 | — | 1200 | — | ||
| Poultry | Muscle | 200 | — | 200 | — | |
| Liver | 600 | — | 600 | — | ||
| Kidney | 1200 | — | 1200 | — | ||
| Sheep | Milk | 100 | — | 100 | — | |
| Muscle | 200 | — | 200 | — | ||
| Liver | 600 | — | 600 | — | ||
| Kidney | 1200 | — | 1200 | — | ||
| Swine | Muscle | 200 | — | — | — | |
| Liver | 600 | — | — | — | ||
| Kidney | 1200 | — | — | — | ||
| Turkey | Muscle | 200 | — | — | — | |
| Liver | 600 | — | — | — | ||
| Kidney | 1200 | — | — | — | ||
| Doxycycline | Fish | Muscle | 200 | — | — | — |
| Liver | 600 | — | — | — | ||
| Kidney | 1200 | — | — | — | ||
| Lobster | Muscle | 200 | — | — | — | |
| Giant pawn | Egg | 400 | — | — | — | |
| Muscle | 200 | — | — | — | ||
| Honey | 300 | — | — | — | ||
| Cattle, swine, poultry | Skin and fat | 300 | — | — | — | |
| Muscle | 100 | — | — | — | ||
| Liver | 300 | — | — | — | ||
| Kidney | 600 | — | — | — | ||
| Amoxicillin | Finfish | Fillet | — | — | 50 | — |
| Muscle | 50 | — | 50 | — | ||
| Ampicillin | Finfish | Muscle | — | — | 50 | — |
| Benzylpenicillin | Cattle | Muscle | — | — | 50 | — |
| Liver | — | — | 50 | — | ||
| Kidney | — | — | 50 | — | ||
| Milk | — | — | 4 | — | ||
| Chicken | Muscle | — | — | 50 | — | |
| Liver | — | — | 50 | — | ||
| Kidney | — | — | 50 | — | ||
2 The environmental fate of antibiotics and their effects
To safeguard the health of both humans and animals, antibiotics are extensively utilized across multiple sectors, including agriculture, aquaculture, and healthcare.36 Despite their widespread application, a substantial fraction of administered antibiotics is not fully metabolized and is subsequently released into the environment, contributing to ecological contamination. Research on this topic has progressively increased from 2011 to 2020, reflecting the growing global recognition of environmental antibiotic contamination as a critical concern. Antibiotics can enter the environment through various routes, including their use as feed additives in livestock and aquaculture, agricultural runoff, waste water effluents, the administration of human and veterinary medications, and unregulated environmental discharges from production processes (Fig. 1).9 | ||
| Fig. 1 Discharge of antibiotic residues into the environment and the risks of ARB exposure to humans. | ||
Antibiotics were originally developed to treat diseases but later became widely used as feed additives in animal production. This growing reliance on antibiotics is primarily driven by the increasing demand for high-quality dairy and poultry products. Commonly used antibiotics in animal feeds are tetracyclines, penicillin, chloramphenicol etc.37,38 In aquaculture, extensive antibiotic use has led to a substantial accumulation of antibiotics in aquatic environments.39 Frequently, used antibiotics in aquaculture are oxytetracycline, chloramphenicol, sulphonamide, amoxicillin etc.40 In agriculture, the demand for high-quality vegetables has led farmers to spray crops with antibiotics to prevent diseases and enhance crop yields.41 Commonly used antibiotics in agriculture include streptomycin, oxytetracycline, gentamicin, and oxolinic acid.42–44 These practices result in the accumulation of antibiotic residues in soil, water, and crops, often at concerning concentrations. For instance, hospital effluents can contain up to 10000 μg L−1 of antibiotics like ciprofloxacin, amoxicillin while municipal wastewater and WWTP effluents range between 0.01–100 μg L−1 and 0.001–5 μg L−1, respectively. Manure and poultry waste have been found to contain up to 1000 μg kg−1 and 16.24 mg kg−1 of antibiotics, respectively, and even vegetables show residues between 6-27 μg kg−1.45–50 These residual antibiotics persist in the environment and exert selective pressure that fosters the development and spread of antibiotic-resistant bacteria (ARB) and antibiotic resistance genes (ARGs).51 Bacteria can acquire antibiotic resistance through two primary mechanisms: the generation of ARGs via spontaneous mutations, and the acquisition of ARGs from other microorganisms through horizontal gene transfer (HGT). HGT plays a critical role in the spread of antibiotic resistance among bacterial populations, complementing the spontaneous mutations that generate antibiotic resistance genes (ARGs). While vertical gene transfer (VGT) transmits genetic traits from parent to offspring, HGT enables bacteria to acquire resistance traits directly from other organisms, often across species or genera. This process significantly enhances the genetic plasticity of microbial communities and accelerates the dissemination of ARGs in diverse environments. HGT occurs through three main processes: transformation, where bacteria uptake exogenous DNA, transduction, where bacteriophages mediate genetic transfer and conjugation, which involves the direct exchange of DNA between cells via pili. These mechanisms are particularly concerning in the context of environmental antibiotic contamination, as they facilitate the rapid evolution and spread of antibiotic-resistant bacteria (ARB) in soil, water, and agricultural systems-amplifying the public health risks associated with antimicrobial resistance. For example, up to 3% of the Pseudomonas aeruginosa genome contributes to its natural resistance. In Helicobacter pylori, the mutation rate for resistance to ciprofloxacin and rifampin is between 1 × 10⁻⁸ and 2 × 10⁻⁸ per cell division.52 Most antimicrobials consumed by humans and animals are broken down into their active components. However, a small percentage of these compounds remain constant i.e., still active, in the faeces, which poses a threat to urban wastewater, manure, and biosolids.53,54 The use of sewage sludge, manure, biosolids, sediment, and reclaimed water contaminated with antimicrobials for fertilization and irrigation has led to the introduction of antibiotics and bioactive metabolites into water and agro-ecosystems, where they have accumulated in various forms.55–57 Environments in the vicinity of livestock farms, aquaculture area, pharmaceutical plants and treated hospital wastewater zones are persistently impacted to antibiotic pollutant. As a consequence of this exposure, antimicrobial levels endure in the environment at differential intensities.58 Both aquatic and terrestrial non-target creatures can be negatively impacted by these antibiotic residues.59,60 Higher levels of antibiotics can impede plant growth, germination, photosynthesis, and other physiological processes.61,62 These residues can impact human health by causing allergic reactions, and abnormalities in the composition of the natural gut bacteria when people consume polluted water and agricultural products.63
Previous studies showed that antibiotics use can change the make-up of the gut microbiota, leading to the rise of opportunistic infections and antibiotic-resistant bacteria.64 Such disruptions have been associated with a range of health issues, including Intestinal diseases, pseudomembranous colitis, and an increased risk of colorectal cancer.65 Additionally, imbalances in gut microbial communities can impair the development and regulation of the immune system.66,67 Environmental contamination with antibiotics, even at sub-inhibitory concentrations, poses a serious threat to both human and ecological health by fostering the selection and persistence of resistant microorganisms.
3 Progress in aptamer-based antibiotic detection
Aptamer's were first discovered in 1990 by Tuerk and Gold, who found RNA sequences that could bind to T4 polymerase using the Systematic Evolution of Ligands by Exponential Enrichment (SELEX) method.68,69 In the same year, Ellington and Szostak coined the term “aptamer”, combining the Latin word “aptus” (meaning “to fit”) and the Greek word “meros” (meaning “part”). In 1992, Ellington and his colleagues expanded their work by selecting the first DNA aptamers that could bind specifically to organic dyes.70–72 The systematic SELEX process, which is a patented in vitro selection technique, is the cornerstone for identifying aptamers.68 During SELEX, a vast library of nucleic acid sequences, each with random sequences arrangement, is screened to find those that specifically bind to a particular target can range from proteins to small molecules, or even entire organisms like viruses and bacteria.73 Once identified, these aptamers can be further modified for a variety of applications, particularly in biosensing both in vitro and in vivo. SELEX has evolved over the years with numerous modifications, such as negative SELEX and counter SELEX, to enhance the specificity and efficiency of aptamer selection. Special techniques like capture-SELEX and nanomaterial-based SELEX have proven especially useful for selecting aptamers targeting small molecules, including antibiotics.74,75 To improve their stability and make them more suitable for biosensing applications, aptamers are often chemically modified at both ends.76 These modifications enhance their resistance to nucleases (enzymes that degrade nucleic acids), allowing the aptamer to remain stable over time. Aptamers like other nucleic acid sequences can adopt a variety of secondary and tertiary structure including hairpins, stem-loops, bulges, pseudoknots, i-motifs, and G-quadruplexes which underpin their ability to bind target analytes with high specificity and affinity.73,77 These structures enable aptamers to bind to their targets selectively through electrostatic interactions, hydrogen bonds or van der Waals forces. The binding affinity between aptamer and its target is typically quantified by the dissociation constant (Kd), which measures how tightly the aptamer binds. A lower Kd indicates a stronger interaction, with values typically ranging from picomolar (pM) to micromolar (μM) concentrations, depending on the specific target.76 While RNA aptamers were the first to be discovered and offer complex 3D structures, DNA aptamers are now preferred in many applications due to their enhanced stability, resistance to degradation, and simpler SELEX process, which doesn't require reverse transcription.78,79 Antibodies have long been employed in biosensing due to their high specificity and strong binding affinity to biological targets; however, their practical use is often constrained by high production costs, limited stability, and shorter shelf life. In contrast, aptamers present several distinct advantages over antibodies, including cost-effective synthesis, superior thermal and chemical stability at room temperature, extended shelf life, and reusability. Additionally, aptamers can be engineered to recognize non-immunogenic targets—such as antibiotics and metal ions which are typically challenging for antibodies to detect with high efficiency.30Numerous antibiotic aptamers with strong binding affinities to their targets have been developed, as summarized in Table 2. However, not all aptamers are as reliable as initially thought. For example, early studies revealed that some antibiotic aptamers, like those for ampicillin, did not exhibit effective binding in assays like isothermal titration calorimetry (ITC).80 Similarly, chloramphenicol (CAP) aptamers showed poor binding in ITC assays, suggesting that they, like the ampicillin aptamers, may not have been true aptamers for their intended antibiotic targets.81 These findings underscore the critical need for rigorous characterization of aptamer–target interactions to confirm their authenticity and functional reliability. To overcome limitations observed with earlier aptamers, Zhao et al. employed modified SELEX techniques, such as capture-SELEX, to successfully develop new high-affinity DNA aptamers, including those specifically targeting chloramphenicol (CAP).82 The success of these innovations has been supported by global research efforts that continue to advance aptamer screening techniques and expand their applications in biosensing.83 For example, to screen the enrofloxacin (ENR) aptamer using Fe3+-IDA beads, Choe et al. used capillary electrophoresis and typical SELEX techniques.84 Using lomefloxacin as the target molecule and polydopamine magnetic nanobeads as separation carriers, Liu et al. developed a new aptamer screening method enabled by magnetic separation, exhibiting excellent specificity to lomefloxacin with little affinity for the structurally related molecules of ofloxacin, ENR, and norfloxacin.85 Additionally, You et al. developed a functionalized graphene-based approach was used to assess the ofloxacin DNA aptamer using the standard SELEX methodology, representing good affinity and specificity to ofloxacin. They are commonly used in the construction of diverse sensing devices. Biosensing devices' sensitivity is enhanced using nanomaterials with distinct physical and chemical properties, such as stability, large surface area, and excellent electrical/optical performance. These include metal oxide nanoparticles, carbon nanotubes, graphene, oxidized graphene, quantum dots, and gold nanoparticles (AuNPs), all of which improve detection efficiency.86,87
| Antibiotics | Aptamer | Length | Kd (nM) | Structure | Reference |
|---|---|---|---|---|---|
| Benzylpenicillin | GGGTCTGAGGAGTGCGCGGTGCCAGTGAGT | 30 | 384.3 |  |
89 |
| Tetracycline | GACGACGCAATGTCCTTCGCAGGATCCGTTTACGGTGTCGTC | 40 | 62 ± 20 |  |
90 |
| Tobramycin | CGTCGACGGATCCATGGCACGTTACAGGTCGACG | 34 | 56.8 | 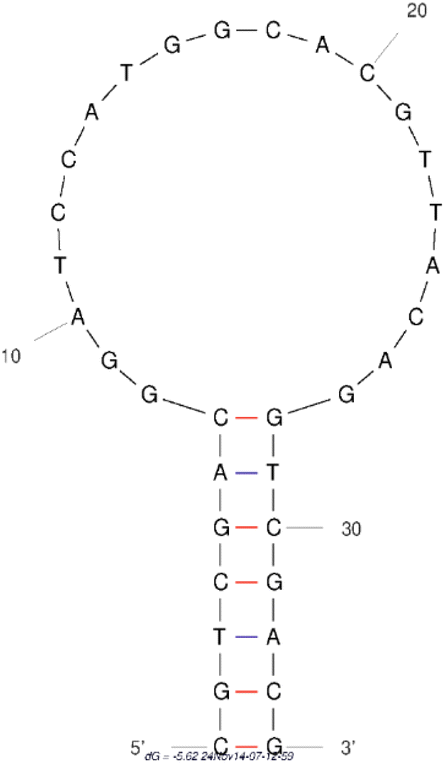 |
91 |
| Sarafloxacin | CTCCGTGCGATCGCCGGGGACCGAAGAATCGTTCACATCG | 40 | 48.08 |  |
92 |
| Chlortetracycline | GGGAUCAUCACAGUGAAAAAAGAUCACACUGAAAAAAGAUCCC | 43 | 2100 |  |
93 |
| Kanamycin A | TGGGGGTTGAGGCTAAGCCGA | 21 | 78.8 |  |
94 |
| Doxycycline | GACGACAAAGCGTTCTACGTGCATACTTTTGTTGGTCGTC | 40 | 490 ± 110 | 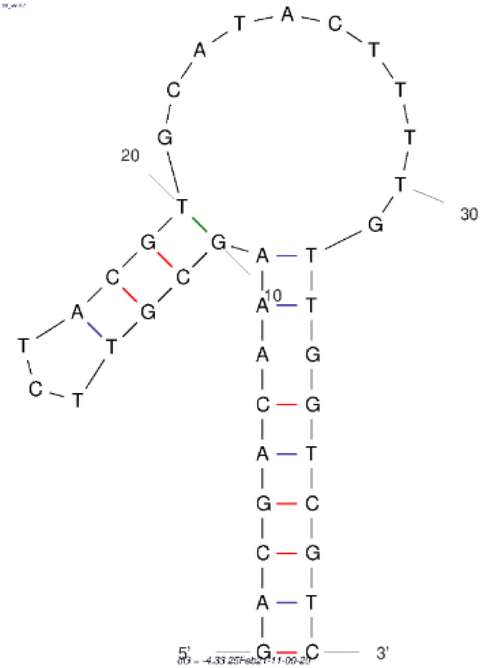 |
90 |
| Chloramphenicol | CGACATAGAGGATCCATCTTGGGGTGTGTAGTGTGTCG | 38 | 9.8 ± 0.5 |  |
81 |
| Neomycin | GGACUGGGCGAGAAGUUUAGUCC | 23 | 115 nM |  |
95 |
| Ofloxacin | TGGCGCTTAGGTGTAATAACCTGAGGACGGCTTGG | 35 | 130.1 |  |
96 |
| Danofloxacin | UCAGGCUCCUGUGAAGCAACCGAAUGGACUGA | 32 | 1.81 |  |
97 |
| Oxytetracycline | CGTACGGAATTCGCTAGCCGACGCGCGTTGGTGGTGGATGGTGTGTTACACGTGTTGTGGATCCGAGCTCCACGTG | 76 | 9.61 ± 0.3 |  |
98 |
| Azlocillin | CAGGAAGACAACTCCGACTAGAATTGATAATCAAATTCGTCTGGGGGGAATGTGCG | 58 | 55 |  |
99 |
4 Implementation of aptasensors for antibiotics detection
4.1. The colorimetric aptasensor
Colorimetric methods provide a visually interpretable signal output, enabling the detection of target analytes through distinct color changes that can be assessed either by the naked eye or using simple, cost-effective portable devices. These methods are particularly advantageous for rapid screening and point-of-care (POC) diagnostics.100–102 Metallic nanomaterials such as gold nanoparticles (AuNPs), silver nanoparticles (AgNPs), and magnetic particles are extensively utilized in colorimetric sensing due to their unique optical properties, which are modulated by particle size, shape, and interparticle distance.103 These tunable optical characteristics enhance both the sensitivity and versatility of the sensing platform across diverse analytical applications, without necessitating sophisticated instrumentation.101 Aptamers are frequently employed as biorecognition elements in colorimetric aptasensors due to their high affinity, specificity, and structural adaptability. They can non-covalently adsorb onto the surfaces of metallic nanoparticles via electrostatic interactions, allowing the monitoring of binding-induced changes through visual cues or ultraviolet-visible spectroscopy.104–106 Among various nanomaterials, AuNPs-based aptasensors have gained particular attention for antibiotic detection owing to their high extinction coefficients, excellent biocompatibility, and pronounced localized surface plasmon resonance (LSPR) effects.107,108 The typical AuNPs based colorimetric sensing mechanism relies on aggregation-induced LSPR shifts. In the absence of the target, AuNPs are stabilized by aptamers or double-stranded DNA (dsDNA), preventing salt-induced aggregation and maintaining a stable red colloidal dispersion. Upon target introduction, aptamer binding causes structural changes or detachment from the nanoparticle surface, leading to aggregation under salt conditions and producing a visible red-to-blue color transition. This aggregation-induced optical change forms the basis for both qualitative visual detection and quantitative measurement via UV-vis absorbance analysis (Fig. 2).109 | ||
| Fig. 2 Colorimetric aptasensor for antibiotic detection using AuNPs. | ||
Additionally, AuNPs can act as peroxidase-mimicking nanozymes, catalyzing hydrogen peroxide-mediated chromogenic reactions that further improve detection sensitivity.110 Several studies have successfully applied these principles for antibiotic residue detection. For example, Song et al. developed a AuNP-based aptasensor for kanamycin (KAN) detection, using single-stranded DNA (ssDNA) aptamers to regulate nanoparticle aggregation. In the presence of KAN, aptamer binding caused aggregation of AuNPs, resulting in a visible color shift and a detection limit (LOD) of 0.025 μM.111 Xu et al. constructed a similar aptasensor using AgNPs, wherein the aptamer KAN interaction induced nanoparticle aggregation and a measurable color change, achieving a LOD of 5.37 × 10⁻³ μM within 20 minutes.112 Ha et al. reported a user-friendly paper-based colorimetric assay using wax-printed chips and AuNPs for ultra-sensitive KAN detection. This platform enabled visual detection of KAN concentrations as low as 3.35 × 10⁻³ μM, providing a low-cost, field-deployable solution.113 Another study of colorimetric aptasensors based on magnetic particles represent a robust and versatile strategy for the sensitive and selective detection of analytes in complex sample matrices. In these systems, aptamer-functionalized magnetic particles specifically bind the target, and magnetic separation removes unbound components, minimizing background interference. Visual signal generation is achieved through the use of colorimetric probes such as AuNPs and horseradish peroxidase (HRP). AuNPs function as optical indicators, exhibiting a red color when stabilized in their dispersed state by aptamers, and transitioning to blue upon aggregation induced by analyte binding through salt or hybridization effects. In parallel, enzyme-linked probes such as HRP catalyze the oxidation of chromogenic substrates like 3,3′,5,5′-tetramethylbenzidine (TMB), producing a distinct and quantifiable colorimetric response. Building on this concept, Zhao et al. developed a competitive colorimetric aptasensor for KAN detection incorporating terminal deoxynucleotidyl transferase (TdT) mediated signal amplification. In the absence of KAN, aptamers bind to KAN functionalized magnetic beads (MBs-KAN), enabling TdT to catalyze biotin dUTP incorporation into extended ssDNA. This biotinylated DNA binds streptavidin–horseradish peroxidase (SA–HRP), which triggers a chromogenic reaction. However, in the presence of KAN, aptamers preferentially bind the free antibiotic, preventing MBs binding, TdT extension, and color development. The sensor achieved a low LOD of 9 × 10⁻⁶ μM and exhibited high analytical accuracy (Fig. 3).114
 | ||
| Fig. 3 Magnetic particle-based colorimetric aptasensor utilizing terminal deoxynucleotidyl transferase for kanamycin detection. | ||
A more advanced multiplexed colorimetric aptasensor was developed by Du et al., employing a sandwich design with split aptamers immobilized on AuNPs and MBs. Upon target binding, aptamer reconstitution enabled magnetic separation and analyte enrichment. TdT then generated polyadenine sequences at the 3′-ends, which served as primers for rolling circle amplification (RCA). The RCA product hybridized with an HRP-labeled DNA probe, catalyzing tetra methyl benzidine (TMB) oxidation in the presence of H2O2 to yield a blue signal. This system enabled simultaneous detection of enrofloxacin (ENR), For ENR, the LOD was 6.96 × 10⁻¹² μM in fish.115 Liu et al. further enhanced sensitivity by integrating nicking enzyme-assisted signal amplification with aptamer recognition. In this design, a hairpin aptamer unfolded upon binding KAN, facilitating signal amplification via platinum-labeled probes and MBs, achieving an ultra-low LOD of 4.13 × 10⁻¹² μM in milk.31 For tetracycline (TC), Zhang et al. utilized gold nanoclusters with intrinsic peroxidase-like activity in a colorimetric platform, detecting TC at concentrations as low as 0.5 μM with a LOD of 4.60 × 10⁻² μM, showing high selectivity in real samples such as milk.116 In another approach, Wang et al. developed a label-free colorimetric aptasensor using a 40-mer T-rich aptamer, achieving a LOD of 2.79 × 10⁻² μM and enabling visual detection of TC in honey.117 Other notable examples include a microplate-based sensor for tilmicosin with a LOD of 1.0 μM.118 Furthermore smartphone integrated POC assay for streptomycin (STR) utilizing SYBR Green I and aptamers, yielding a LOD of 9.40 × 10⁻² μM.119 These advancements illustrate the broad potential and adaptability of aptamer-based colorimetric assays for antibiotic residue monitoring in food safety and environmental applications.119 Further antibiotic detection using colorimetric aptasensors summarized in Table 3. Their high specificity, ease of fabrication, and user-friendliness make them ideal for high-throughput screening, food and environmental analysis, and label-free detection.96,120 Colorimetric techniques usually rely on homogeneous solution systems, which can be influenced by environmental factors during real sample analysis, potentially affecting accuracy. Additionally, the drawback of colorimetric aptasensors often require a large amount of aptamer, limiting sensitivity, necessitating enhanced signal amplification for improved performance.10,120
| Aptasensor | Analytes | Strategy | LOD (μM) | LR (μM) | Signal amplification | Matrix | Reference |
|---|---|---|---|---|---|---|---|
| a LOD = limit of detection, LR = linear range, PEI = polyethyleneimine, MoS2 = molybdenum disulfide, AuPt@h-CeO2 = gold and platinum-coated hollow cerium oxide, MOF = metal–organic framework, CNF = carbon nanofiber, MWCNTs = multi-walled carbon nanotubes, NCA = N-doped carbon aerogel, rGONR = reduced graphene oxide nanoribbon, MCA = melamine and cyanuric acid monomers, and COF = covalent organic framework, GCE = glassy carbon electrode, CoCH-6 h/GCE = cobalt-based hybrid-modified GCE, MGCE = magnetic glassy carbon electrode, MMCM = magnetic mesoporous carbon materials, Pd@Ti3C2–PEI–NCNTs = palladium nanoparticles/titanium carbide/polyethyleneimine-functionalized nitrogen-doped carbon nanotubes, AuPt@h-CeO2 = gold and platinum-coated hollow cerium oxide, MOF = metal–organic framework, CNF = carbon nanofiber, MWCNTs = multi-walled carbon nanotubes, NCA = N-doped carbon aerogel, rGONR = reduced graphene oxide nanoribbon, MCA = melamine and cyanuric acid monomers, and COF = covalent organic framework, GCE = glassy carbon electrode, CoCH-6 h/GCE = cobalt-based hybrid-modified GCE, and MGCE = magnetic glassy carbon electrode, Gr/Ni@Pd = graphene/nickel@palladium, MMCM = magnetic mesoporous carbon materials, CCD = central composite design, Pd@Ti3C2–PEI–NCNTs = palladium nanoparticles/titanium carbide/polyethyleneimine-functionalized nitrogen-doped carbon nanotubes, MNPs = magnetic nanoparticles, MBs = magnetic beads, HCR = hybridization chain reaction, EDSDR = entropy-driven strand displacement reaction, dSB-TMSDR = double stir bar-assisted toehold-mediated strand displacement reaction, Exo I = exonuclease I, SPA = split aptamer, FRET = fluorescence resonance energy transfer, IFE = inner filter effect, SG-I = SYBR Green I, SSB = ssDNA binding protein, CDs = carbon dots, DNA–AgNCs = DNA-templated silver nanoclusters, AuNPs = gold nanoparticles, GO = graphene oxide, GOQDs = graphene oxide quantum dots, CuNCs = copper nanoclusters, SiO2 = silica nanoparticles qRT-PCR = quantitative real-time PCR, NEASA = nicking enzyme-assisted signal amplification, THMS = triple-helix molecular switch, NaCl = sodium chloride, MP = microplate plate, HRP = horseradish peroxidase, KAN = kanamycin, STR = streptomycin, OTC = oxytetracycline, ENR = enrofloxacin, PEN = penicillin, TIL = tilmicosin, TOB = tobramycin, OFX = ofloxacin, CIP = ciprofloxacin, SUL = sulfonamides, NEO = neomycin, AMP = ampicillin, DNM = daunomycin, GEN = gentamicin, CAP = chloramphenicol, TC = tetracycline. | |||||||
| Colorimetric aptasensor | KAN | Hairpin aptamer DNA/enzyme cutting signal amplification | 4.13 × 10⁻¹² | — | Nicking enzyme-assisted amplification | Milk | 31 |
| KAN | High salt induces AuNPs aggregation from red to blue the catalytic chromogenic reaction of AuNPs mimics | 0.025 | — | Colour change based on aggregation of AuNPs | Pharmaceutical preparations, food products | 111 | |
| KAN | Disrupts AgNPs protective mechanism against salt induced aggregation | 5.37 × 10⁻³ | 1.03 × 10⁻⁴ to 1.24 × 10⁻³ | Protection of AgNPs against salt-induced aggregation | Milk | 112 | |
| KAN | Paper chip-based, label-free, colorimetric assay using AuNPs and RGB color analysis | 3.35 × 10⁻³ | — | — | Milk | 113 | |
| KAN | Competitive recognition between KAN, MBs-KAN, and aptamer with TdT-mediated signal amplification | 9 × 10⁻⁶ | — | TdT-mediated signal amplification (HRP) | Milk, honey | 114 | |
| ENR | MB/SPA | 6.96 × 10⁻¹² | 2.78 × 10⁻¹² to 2.78 × 10⁻⁶ | Aggregation-induced signal change | Fish | 115 | |
| TC | Gold nanocluster–ligand–TMB | 4.60 × 10⁻² | 1–16 | Enhancement via aptamer recognition | Drugs, milk | 116 | |
| TC | Aptamer–AuNPs/NaCl | 2.79 × 10⁻² | — | — | Honey | 117 | |
| TIL | MP/HRP–SPA | 1.0 | — | Peroxidase-like activity of hybrids | — | 118 | |
| STR | SYBR Green, I bind with aptamer DNA fluorescence | 9.40 × 10⁻² | 0.1–100 | Peroxidase-like activity enhanced by aptamer binding | Chicken, milk | 119 | |
| STR | Aptamer–AuNPs/NaCl | 8.60 × 10⁻² | 0.1–0.5 | — | Milk | 135 | |
| OFX | Aptamer/AuNPs/NaCl | 3.40 × 10⁻⁵ | 2.00 × 10⁻² to 4.00 × 10⁻¹ | — | Aqueous solutions | 136 | |
| TC | Aptamer–AuNPs/NaCl/cysteine-stabilized AuNPs | 8.79 × 10⁻⁵ | 4.50 × 10⁻⁴ to 4.50 × 10⁻³ | — | Raw milk | 137 | |
| TOB | Unmodified AuNPs and ssDNA | 2.33 × 10⁻² | 4.00 × 10⁻² to 2.00 × 10⁻¹ | — | Milk, chicken eggs | 138 | |
| OTC | Truncated 8-mer ssDNA aptamer | 1.00 × 10⁻⁴ | — | — | — | 139 | |
| SUL | Peroxidase like activity of Gr/Ni@Pd nanoparticles | 2.77 × 10⁻³ | 3.95 × 10⁻³ to 1.57 | — | Lake water | 140 | |
| TC | GO/aptamer's | 2.25 × 10⁻⁷ | 4.50 × 10⁻⁷ to 4.50 × 10⁻⁴ | GO aggregation, aptamer protection | Honey | 141 | |
| KAN | AuNPs enable colorimetric biosensing via, antibiotic adsorption-induced aggregation | 9.00 × 10⁻² | — | — | — | 142 | |
| CIP | AuNPs modified with FQ-binding aptamer and complementary DNA (“flower” structure) | 2.6 × 10⁻³ | — | Catalytic activity of AuNPs reduces 4-nitrophenol | Serum | 143 | |
| Fluorescence aptasensors | TC | Catalytic hairpin assembly and G-quadruplex displacement | 1.035 × 10⁻² | 0–2.25 | Catalytic hairpin assembly and G-quadruplex displacement | Milk | 32 |
| ENR | G-quadruplex DNA aptamer SG-I | 1.58 × 10⁻⁴ | 1.95 × 10⁻³ to 4.0 × 10⁻¹ | Aptamer and SYBR Green I (SG-I) fluorescence quenching | Chicken, fish, pork samples | 33 | |
| PEN | Aptamer selected by rGO-SELEX | 9.2 × 10⁻³ | 0.104–4.17 | Fluorescence recovery signal from rGO surface | Milk | 89 | |
| TC | Fluorescence quenching with aptamers in a THMS | 2.09 × 10⁻³ | — | THMS | Tap water, rat serum | 124 | |
| TC | DNA–AgNCs | 2.58 × 10⁻² | 0.0002–0.002 & 0.002–0.8 | Aptamer-templated AgNCs | Milk | 125 | |
| OTC | Aptamer-conjugated MB and PicoGreen dye | 1.5 × 10⁻⁴ | 0.005–0.25 | Aptamer conjugated to magnetic beads and PicoGreen (PG) fluorescent dye | Milk | 126 | |
| STR | Fluorescent aptasensor using Exo III and SYBR Gold | 5.45 × 10⁻² | — | Exonuclease III-assisted target recycling | Milk, blood serum | 127 | |
| ENR | SPA assisted MNPs and magnetic separation | 2.23 × 10⁻⁵ | 0–0.6 | DNA tweezers fluorescence aptasensor with split aptamer and magnetic separation | Spiked milk samples | 128 | |
| ENR | Aptamer, GO and native fluorescence | 3.70 × 10⁻³ | 1 × 10⁻⁷ to 1.0 × 10⁻¹ | — | Raw milk | 129 | |
| ENR | G-quadruplex DNA aptamer SG-I | 5.9 × 10⁻⁴ | 0.04–0.24 | Food, serum samples | 130 | ||
| KAN | AuNPs to quench CDs fluorescence via the IFE | 1.80 × 10⁻² | 1 × 10⁻⁷ to 1.0 × 10⁻¹ | AuNPs as fluorescence quenchers for CDs | Milk | 131 | |
| KAN | Enzyme-free fluorescent aptamer sensor based on EDSDR | 5.3 × 10⁻⁵ | 5 × 10⁻³ to 5 × 10⁻² & 7.5 × 10⁻² to 1 | EDSDR | Milk | 132 | |
| KAN | SPA, DNA–AgNCs, and Exo I for signal amplification | 1.07 × 10⁻³ | — | Exo 1 assisted target recovery amplification | — | 133 | |
| KAN | FAM-labeled aptamer and AuNPs for dynamic fluorescence quenching | 1.0 × 10⁻⁷ | 1 × 10⁻⁴ to 5 × 10⁻² | AuNPs and FAM-fluorescent aptamer quenching via dynamic IFE | Milk | 144 | |
| KAN | Amino-functionalized SiO2, CuNCs, and DNA–AgNCs | 7.3 × 10⁻³ | 5 × 10⁻³ to 6 × 10⁻¹ | FRET between CuNCs and DNA–AgNCs | — | 145 | |
| KAN | IFE between AuNPs and GOQDs | 3.6 × 10⁻³ | 0.0001–0.1 | IFE between AuNPs and GOQDS | Milk, honey, serum | 146 | |
| AMP | AuNPs modified MB composites and NEASA | 2.0 × 10⁻⁴ | 2.86 × 10⁻⁴ to 2.86 × 10⁻¹ | NEASA | River water | 147 | |
| OTC | GO hydrogel, co-crosslinked with adenosine and aptamer | 5.43 × 101 | 5 × 10⁻⁶ to 1 × 10⁻¹ | 3D hydrogel crosslinked by aptamers and adenosine | — | 148 | |
| CAP | FRET assisted by SSB | 9.29 × 10⁻⁶ | 1 × 10⁻⁴ to 2 × 10⁻² | FRET | — | 149 | |
| CAP | Aptamer based detection system combined with qRT-PCR | 3.1 × 10⁻⁴ | 0.1 to 10 | — | Milk | 150 | |
| NEO | Aptamer-based sensor combined with AuNPs | 1.0 × 10⁻² | — | Fluorescence quenching by AuNPs | Milk | 151 | |
| AMP | Indirect (fluorescent signal via aptamer–analyte binding) | 2.06 × 10 −2 | 1.0 × 10 −1 to 1.0 × 10² | — | Human urine | 152 | |
| Electrochemical aptasensor | ENR | Pb2+-dependent DNAzyme-driven DNA walker with triple amplification, combining AuPt@h-CeO2, PEI–MoS2, and Au@ZnNi-MOF | 3.08 × 10⁻¹⁰ | 1.51 × 10⁻⁸ to 3.03 × 10⁻³ | DNAzyme cleavage, gold nanoparticle-based amplification | Water, milk | 153 |
| ENR | NiCo2O4@NiO | 4.65 × 10⁻¹¹ | 1.39 × 10⁻¹⁰ to 1.39 × 10⁻¹ | Composite electrode for enhanced electron transfer | — | 154 | |
| ENR | CoCH-6 h/GCE | 1.0 × 10⁻¹ | — | Electrode modification for enhanced sensitivity | Pork, meat | 155 | |
| TC | GCE modified by CNF and carboxylated MWCNTs/aptamer/molecular docking and CCD | 2.28 × 10⁻¹² | 1.0 × 10⁻¹¹ to 1.0 × 10⁻⁵ | Molecular docking & multi-walled carbon nanotube modification | Milk | 156 | |
| KAN | DNA signal amplification strategy that combines RecJf exonuclease-assisted target recycling and HCR | 1.8 × 10⁻³ | 1.0 × 10⁻² to 1.0 × 101 | Recif exonuclease and HCR amplification | Milk | 157 | |
| KAN | ESDR strategy for the enzyme-free ratiometric electrochemical aptasensor | 0.0001526 | — | Enzyme-free ratiometric signal amplification | — | 158 | |
| STR | MMCM as the loading material immobilized on a MGCE/aptamer | 1.5 × 10⁻⁵ | 1.72 × 10⁻⁴ to 1.72 × 101 & 1.72 × 101 to 1.72 × 10² | Magnetic nanoparticle adsorption and current change | Milk | 159 | |
| STR | Pd@Ti3C2–PEI–NCNTs composite | 3.0 × 10⁻⁶ | 1.0 × 10⁻⁵ to 7.0 × 10⁻¹ | Pd nanocompos ite signal amplification | — | 160 | |
| KAN | Aptamer-based target-triggered DNA adsorption on MoS2 nanosheets combined with enzymatic amplification | 2.9 × 10⁻⁵ | — | MoS2 nanosheet-based DNA adsorption with enzymatic amplification | — | 161 | |
| KAN | HCR strategy combined with magnetic nanoparticle-based aptamer capture | 1.0 × 10⁻⁶ | 1.0 × 10⁻⁶ to 1.0 × 10⁻¹ | Magnetic nanoparticle aptamer-based signal detection | Milk | 162 | |
| KAN | dSB-TMSDR, enabling dual-signal amplification/HCR is triggered to amplify the signal/MB is used as a redox probe for signal generation | 1.6 × 10⁻⁵ | — | Dual-signal amplification (TMSDR + HCR) | — | 163 | |
| KAN | UiO-66–NH2/MWCNT@rGONR/MCA-based COF | 1.3 × 10⁻² | 2.5 × 10⁻² to 9.0 × 10⁻¹ | Nanocomposite for enhanced electrochemical response | Fish, meat, milk | 164 | |
| STR | Ti3C2 and MOFs nanocomposite | 3.3 × 10⁻⁶ | 1.0 × 10⁻⁵ to 2.0 × 10⁻¹ | MOF/TNG nanocomposite for STR detection | Milk | 165 | |
| ENR | MNPs as carriers | 1.5 × 10⁻⁵ | 3.0 × 10⁻⁵ to 3.0 × 10⁻¹ | Magnetic nanoparticles aptamer-based signal detection | Chicken | 166 | |
| TC | Co assembly strategy combining stone-like-AuNPs and N-doped carbon aerogel (NCA) | 3.2 × 10⁻¹⁰ | 1.00 × 10⁻⁹ to 1.00 × 10⁻⁵ | N-doped carbon aerogel AuNPs | Milk | 167 | |
| OTC | Signal-on aptasensor via Fc-DNA hairpin switch and target–aptamer competition | Serum: 2.61 ± 0.26 | 2.17 × 10⁻² to 1.30 × 100 | — | Mouse blood serum and urine | 168 | |
| Urine: 1.09 ± 0.15 | |||||||
| AMP | Signal-on aptamer probe with conformational change | 1 (ACV)/30 (SWV) | — | — | Serum, saliva, milk | 169 | |
| DNM | Label-free electrochemical aptasensor with PS & aptamer on AuNP–polyTTBA | 5.23 (±0.21) × 10−5 | 1.0 × 10⁻⁴ to 6.0 × 10⁻² | Conducting polymer (polyTTBA) | Spiked human urine | 170 | |
| GEN | RNA aptamer-based electrochemical sensor; tested methylation, DNA analog, and ultrafiltration | 1.5 | — | — | Human serum | 171 | |
| TOB | Faradaic-EIS displacement assay using fully O-methylated RNA aptamer (FATA) | 0.7 | 3–7.21 | — | Human serum | 172 | |
| Cemiluminescent aptasensor | KAN | Oligonucleotide-based “switch-on” luminescent assay using a Pt(II) complex as signal transducer via aptamer conformational change | 143 | 0.2–150 | Luminescence enhancement via intercalation of Pt(II) complex into aptamer hairpin structure | Buffer and fish | 173 |
| KAN | FALIA using CNPs | 1.032 × 10⁻¹³ | 2.06 × 10⁻¹³ to 2.06 × 10⁻¹⁶ | Enhanced fluorescence due to photoluminescence properties of CNPs linked with aptamer recognition of kanamycin | Milk | 174 | |
| KAN | “On–off–on” switch strategy | 4.5 × 10⁻⁵ | 0.00015–170000 |
On–off–on ECL aptasensor with DNAzyme-enhanced nanofilm amplification | Aqueous solutions | 175 | |
| OTC | ABEI-functionalized gold nanostructures | 4.345 × 10⁻⁸ | 1.085 × 10⁻⁷ to 1.085 × 10⁻⁵ | ABEI–H2O2–PIP CL system | Milk | 176 | |
| TC | 4.5 × 10⁻⁸ | 1.126 × 10⁻⁷ to 1.126 × 10⁻⁵ | |||||
| KAN | 4.13 × 10⁻⁹ | 1.03 × 10⁻⁸ to 1.03 × 10⁻⁵ | |||||
| SPR aptasensor | KAN | Continuous-flow graphene-based SPR aptasensor utilizing irreversible affinity interaction | 2.85 × 10⁻¹ | 1–100 | π–π interaction between graphene and aptamer enhances immobilization | Milk | 177 |
| TOB | T-LSPR aptasensor with gold nanoislands on fluorine-doped tin oxide (FTO)-coated glass integrated with CMOS sensor | 3.4 | 10–80 | Plasmon shift measured by peak wavelength and hue change | Blood serum | 178 | |
| NEO | SPR and FIS aptasensor using 2′-O-methyl RNA aptamer for enhanced nuclease resistance | 5.0 × 10⁻³ | 0.01–100 | — | Buffer | 179 | |
| LFA aptasensor | KAN | Lateral flow strip biosensor using magnetic microspheres (MMS) and DNA-functionalized AuNPs | 4.96 × 10⁻³ | 0.005–0.5 | Target-mediated displacement of cDNA; AuNP–DNA hybridization signal | — | 35 |
| OTC | Lateral flow aptasensor with aptamer–AuNP conjugate and OTC–protein conjugate on strip | 1.08 × 10⁻⁴ | — | Competitive binding between aptamer–AuNP and OTC–protein | Spiked milk | 180 | |
| AMP | Competitive lateral flow assay using aptamer-based recognition | 1.72 × 10⁻⁸ | — | Two aptamers with cross-recognition | Milk | 181 | |
4.2. Fluorescence aptasensor
Fluorescence is an exceptionally sensitive optical phenomenon extensively applied in aptamer-based biosensing platform due to its high signal-to-noise ratio and adaptability to real-time detection platforms.121 As DNA and RNA aptamers inherently lacks intrinsic fluorescence, they must be conjugated with external fluorophores or fluorescent nanomaterials to enable fluorescence-based sensing.122 Fluorescent aptasensors are generally categorized into two main formats: labeled and label-free systems, each utilizing distinct signal generation and amplification mechanisms.123Aptamer fluorescence sensing systems often utilize strategies, such as (a) molecular beacon designs where aptamers are tagged with fluorophore–quencher pairs; (b) fluorescence quenching platforms using aptamer-bound fluorophores in conjunction with carbon nanomaterials; (c) G-rich DNA sequences serving as effective quenchers in fluorophore-tagged aptamer systems; and (d) conformational structures like G-quadruplexes that, upon target interaction, emit or modulate fluorescence signals.96 These platforms have been increasingly leveraged for the sensitive and selective detection of antibiotics in food matrices.
Earlier reported study by Jalalian et al. introduced a Triple-Helix Molecular Switch (THMS) aptasensor for tetracycline (TC) detection. This system utilized fluorescence quenching upon target binding and achieved a detection limit of 2.09 nM,124 laying the groundwork for further innovation in fluorescence sensing. Building upon this, Zhou et al. developed an enzyme-free detection method integrating catalytic hairpin assembly (CHA) and G-quadruplex DNA displacement, which demonstrated high sensitivity with a detection limit of 4.6 μg L−1, making it suitable for a wide range of sample types.32 Another notable advancement was the development of an aptamer-templated silver nanocluster (DNA–AgNC) biosensor for TC, which achieved a detection limit of 11.46 ng mL−1 and a broad linear range from 20 ng mL−1 to 10 μg mL−1.125 Similarly, Bahreyni et al. constructed a highly sensitive aptasensor for oxytetracycline (OTC) detection by immobilizing OTC-specific aptamers onto magnetic beads and utilizing PicoGreen dye. This system achieved an impressive detection limit of 0.15 nM, with linear ranges spanning 0.2–2 nM and 2–800 nM, demonstrating its suitability for food sample analysis.126 The field has further expanded with the emergence of label-free fluorescent biosensors. For example, Taqhdisi et al. developed a label-free fluorescence aptasensor for streptomycin detection using exonuclease III, SYBR Gold dye, and a complementary DNA strand. In the absence of streptomycin, the aptamer remained hybridized to the complementary strand, resulting in minimal fluorescence. Upon target addition, the aptamer selectively bound to streptomycin, releasing the complementary strand and preserving the double-stranded DNA from exonuclease III degradation (Fig. 4). This intact DNA was then able to bind SYBR Gold, generating a strong fluorescence signal with a detection limit of 5.45 × 10⁻² μM in milk and blood samples.127
 | ||
| Fig. 4 Schematic illustration of the fluorescence aptasensor for antibiotics detection. | ||
Innovative approaches have also employed DNA tweezers, G-quadruplex DNA, and graphene oxide-based quenchers to further enhance fluorescence output, particularly for the detection of antibiotics such as enrofloxacin (ENR),33,128–130 achieving ultra-low detection limits and broad dynamic ranges. In the case of kanamycin (KAN), label free gold nanoparticle (AuNP)-based sensors exploiting the inner filter effect (IFE), entropy-driven strand displacement reactions (EDSDR), exonuclease I digestion strategies, and silver nanocluster templates have all been reported.131–133 Dual-mode sensors combining fluorescence and colorimetric outputs now offer real-time analysis with smartphone integration, significantly improving field-deployable diagnostics. These technological advancements underscore the remarkable evolution of fluorescence-based aptasensors-from basic fluorescence quenching systems to highly integrated platforms utilizing nanomaterials such as silver nanoclusters, gold nanoparticles, and carbon quantum dots.125,134 Recent progress in dual-mode sensors has enhanced detection versatility and speed, holding promise for real-time monitoring of antibiotic residues in both food and environmental samples. These sensors are employed in various strategies to detect antibiotics, as summarized in Table 3. However, fluorescence aptasensors still face challenges including photobleaching, background fluorescence, and interference from complex matrices, which may compromise sensitivity and specificity under certain conditions.120
While current fluorescent aptasensors are predominantly designed for single-target detection, the development of multi-analyte platforms employing multicolor quantum dots offers a promising avenue for simultaneous detection of multiple antibiotic residues. Such multiplexed systems could significantly increase detection throughput and efficiency.96,120 Given the global concerns over antimicrobial resistance and the demand for stringent monitoring, fluorescence-based aptasensors are poised to play a pivotal role in enhancing food safety and environmental surveillance.
4.3. Electrochemical aptasensor
Electrochemical biosensors have become vital tools for detecting and measuring various analytes across different fields. These sensors typically consist of an electrode combined with a molecular recognition element and an electrochemically active component. When the target analyte interacts with the recognition element, it induces changes on the surface of the electrode. These changes are then converted into electrochemical signals like current, impedance, potential, or conductance that can be measured and analyzed.182 The integration of aptamers into electrochemical biosensors has significantly advanced aptasensors, enhancing their sensitivity, specificity, and versatility for detecting a wide range of analytes. Electrochemical aptasensors employ various techniques, including potentiometric, amperometric, conductometric, impedance, and voltammetric methods. In past, researchers commonly used techniques like electrochemical impedance spectroscopy (EIS) and voltammetry methods such as differential pulse voltammetry (DPV), cyclic voltammetry (CV), and square wave voltammetry (SWV), with cyclic voltammetry (CV) being particularly favored for analyzing redox processes and understanding electrochemical behavior. Recent advances have focused on improving sensor design for efficient antibiotic detection, utilizing signal-enhancing materials like quantum dots, metal ions, methylene blue, ferrocene, and ruthenium complexes.183 Additionally, the integration of nanomaterials such as AuNPs, carbon-based materials (e.g., graphene oxide, carbon nanotubes, carbon nanofibers), metal oxides (e.g., ZnO, TiO2, NiO), and metal–organic frameworks (MOFs) significantly enhances sensor performance by improving sensitivity, conductivity, and aptamer immobilization, thus enabling rapid and low-level detection of antibiotics in complex samples.184–187 The sensor developed by Zhang et al. utilizes a Pb2+-dependent DNAzyme in conjunction with advanced nanomaterials like AuPt@h-CeO2 and polyethyleneimine (PEI)-functionalized molybdenum disulfide (MoS2), leading to enhanced sensitivity in detecting ENR with detection achieving a LOD 3.08 × 10⁻¹⁰ μM.153 Similarly, Niu et al. took a different approach, developed an electrochemical aptasensor using a bimetallic NiCo2O4@NiO nanostructure, fabricated through solvothermal and pyrolysis methods. Electrochemical testing showed an LOD of 4.65 × 10⁻¹¹ μM.154 A label-free sensor, developed by Yu et al. using a 3D porous chitosan-reduced graphene oxide composite, was designed to enhance sensitivity, achieving a LOD of 1.0 × 10⁻¹ μM. The sensor exhibited exceptional precision, stability, selectivity, and reproducibility, establishing it as a reliable and robust choice for accurate ENR detection.155 Additionally, Guo et al. developed a highly sensitive electrochemical aptasensor for detecting ENR in chicken samples, utilizing magnetic capture probes (MCPs) composed of magnetic nanoparticles functionalized with ENR-specific aptamers. In the presence of ENR, the aptamers bind the target, preventing hybridization with biotinylated complementary DNA (biotin–cDNA) and thereby blocking the attachment of streptavidin–horseradish peroxidase (SA–HRP), resulting in a reduced electrochemical signal. In the absence of ENR, unbound aptamers hybridize with biotin–cDNA, allowing SA–HRP to bind via high-affinity biotin–streptavidin interactions. After washing, MCPs are magnetically immobilized onto a magnetic glassy carbon electrode (MGCE), and detection is performed using an H2O2–hydroquinone–HRP catalytic system (Fig. 5), achieving a linear range of 0.01–100 ng mL−1 and a detection limit of 1.5 × 10⁻⁵ μM.166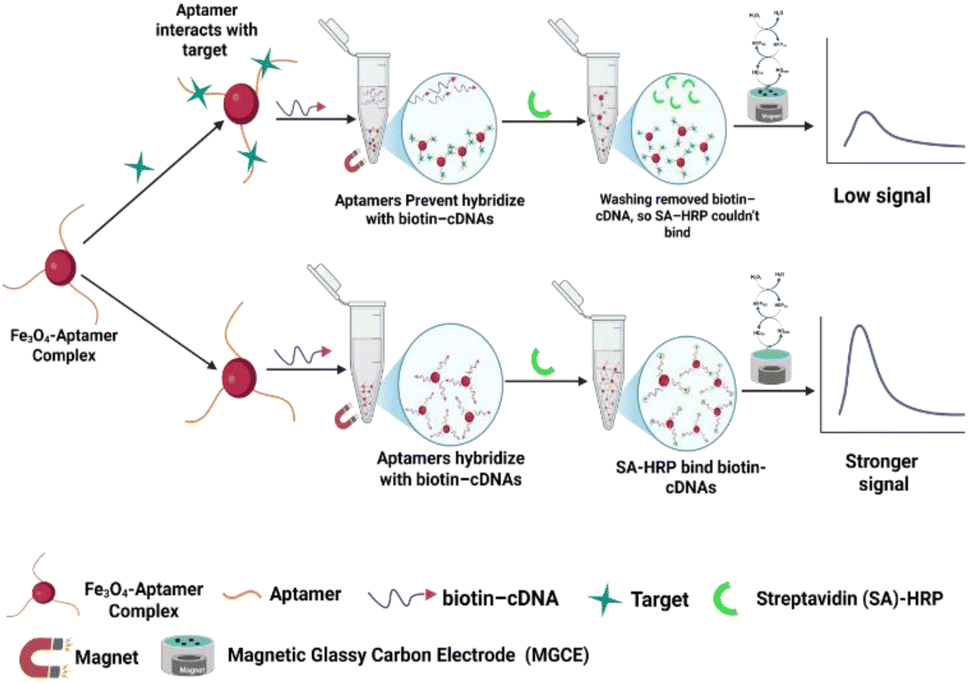 | ||
| Fig. 5 Electrochemical aptasensor conceptual illustration utilizing magnetic nanoparticles for sensitive antibiotic detection. | ||
For TC detection, Mohammadi et al. developed a sensor using electrospun carbon nanofibers and AuNPs, achieving a LOD of 1.2 × 10⁻⁴ μM and demonstrating excellent stability.34 Similarly, Naseri et al. created an ultrasensitive sensor with a glassy carboxylated nanotubes, carbon nanofibers and carbon electrode, and achieving an impressive LOD of 2.28 × 10⁻¹² μM.156 The field has advanced with the development of highly sensitive biosensors for detecting antibiotic residues, utilizing techniques such as RecJf exonuclease-assisted target recycling with HCR and entropy-driven strand displacement reaction (ESDR) for KAN detection.157,158 Additionally, magnetic mesoporous carbon materials (MMCM) on magnetic glassy carbon electrodes (MGCE) and Pd@Ti3C2–PEI–NCNTs composites are applied for STP detection. Both approaches provide excellent selectivity, stability, and reproducibility, making them ideal for various applications, with impressive LOD, high stability, and specificity.159,160 These electrochemical aptamer sensors are employed in various strategies to detect antibiotics, as summarized in Table 3. These sensors also have advantages such as wide linear ranges, low detection limits, and low costs, making them especially attractive for antibiotic detection. Compared to other methods like colorimetry and fluorescence, electrochemical aptamer films reduce non-target interference through stepwise washing. The disadvantages of electrochemical methods face challenges, including the complex procedures required for electrode surface activation, material modification, and aptamer assembly. These complexities can make large-scale sample testing difficult. Additionally, the sensitivity of aptasensors still needs improvement for practical applications, primarily due to interface effects on the electrode surface.120
4.4. Chemiluminescence aptasensor
A chemiluminescent aptasensor is a biosensor that uses highly target specific aptamers, as recognition elements, coupled with chemiluminescence (CL) as the signal readout. This aptamer–target binding event triggers or modulates a chemiluminescent reaction, typically involving reagents like luminol and hydrogen peroxide, or enzyme-catalyzed reactions.176,188 The intensity of the emitted light correlates with the concentration of the target, enabling rapid, accurate, and low-level detection of a wide range of analytes (such as antibiotics, protein, toxin, or small molecule) in various sample types.189 Their advantages make them promising tools for diagnostics, environmental analysis, and food safety monitoring.190In an earlier study, Hao et al. (2016) developed a chemiluminescent aptasensor capable of simultaneous detection of three antibiotics – OTC, TC, and KAN in milk samples. The sensor design integrated aptamers specific to each antibiotic, immobilized on a microtiter plate, with chemiluminescent signal probes constructed from ABEI (N-(4-aminobutyl)-N-ethylisoluminol)-labeled thiolated complementary DNA strands attached to flower-like gold nanostructures. Upon target binding, the aptamers underwent conformational changes, leading to displacement of the signal probes and modulation of chemiluminescence intensity (Fig. 6).
 | ||
| Fig. 6 Schematic representation of antibiotic detection using a chemiluminescent aptasensor based on aptamer-functionalized ABEI–AuNFs. | ||
The assay demonstrated excellent sensitivity, with detection limits of 4.345 × 10⁻⁸ μM and 4.5 × 10⁻⁸ for OTC and TC, and 4.13 × 10⁻⁹ μM for KAN. These results underscore the sensor's potential for multiplex, low-level, and reliable detection of antibiotic residues in food safety applications.176 Similarly, Leung et al. (2013) developed an aptamer-based switch-on luminescent probe for the sensitive and selective detection of the antibiotic kanamycin in aqueous solutions. The assay combines a luminescent platinum(II) complex and the KAN aptamer. In the absence of KAN, the luminescence of the platinum(II) complex bound to the oligonucleotide remains weak. However, upon KAN binding, the aptamer undergoes a structural transition from a random coil to a defined conformation featuring a hairpin loop, which promotes intercalation of the platinum(II) complex into the folded aptamer, thereby enhancing the luminescence signal (“switch-on” response). This conformational switch allows highly selective and sensitive detection, with a detection limit of 143 μM. The method is simple, cost-effective, and shows strong potential for applications in food safety.173 Additionally, Lin et al. (2019) reported a fluorescence-based aptasensor for the rapid and sensitive detection of KAN residues using luminescent carbon nanodots functionalized with a KAN-specific aptamer. The sensing mechanism is based on fluorescence-based aptamer-linked immunosorbent assay (FALIA) that allows highly selective and sensitive detection, with a detection limit of 1.032 × 10⁻¹³ μM.174 Antibiotic detection using chemiluminescence aptasensors summarized in Table 3.
4.5. Surface plasmon resonance (SPR) aptasensor
SPR, a label-free optical detection method, emerged as real-time monitoring of various biological and chemical targets. In label-free detection, specialized tags or dyes are not required, thus allowing the sensitive measurement of target analytes. SPR detects changes in the refractive index near a metal surface when biomolecules bind to it (Fig. 7).191 | ||
| Fig. 7 Surface plasmon resonance-based aptasensor for antibiotics detection. | ||
In recent years, aptamer-based SPR sensors have gained prominence due to their specificity, simplicity, and cost-effectiveness.192 The fundamental steps involved in an aptamer based SPR sensor include the immobilization of aptamer, interaction with the target, and signal detection. When a solution containing the target molecule flows over the sensor, the aptamers immobilized on the sensor surface specifically bind to the target molecules. This binding changes the refractive index, resulting in a shift in the SPR angle, which directly correlates with the concentration of the target molecule.193 Application of SPR-aptamer based biosensors are valued to quantification of low molecular weight compounds in different broad sectors such as food, clinical, agriculture, and environment. Écija-Arenas et al. developed a SPR aptamer-based biosensor designed to detect KAN residues in cow milk samples, achieving a LOD of 2.85 × 10⁻¹ μM.177 In their study, the aptamer was immobilized on the sensor surface using two types of graphene, i.e., reduced graphene oxide (rGO) and chemical vapor deposition (CVD) graphene. The most significant result was observed in the case of CVD graphene.179 In another study, Cappi and team designed a label-free, portable, palm-sized transmission-localized SPR-DNA aptamer sensing setup to precisely detect the tobramycin residues from the blood serum with a LOD of 3.4 μM.178 SPR aptamer sensors provide an advanced solution for antibiotic detection, combining high sensitivity, rapid response times, label-free and real-time detection, and a simple experimental setup, making them essential tools for environmental monitoring. However, it does have some limitations, such as the potential high cost of the transducer and its focus on single-target detection Further antibiotic detection using SPR aptasensors summarized in Table 3.
4.6. Lateral flow strip aptasensor
Lateral flow assays (LFAs) are rapid, low-cost, paper-based, point-of-care (POC) diagnostic tools used to detect specific analytes in liquid samples.194 They offer high sensitivity and selectivity, making them ideal for healthcare, food safety, and environmental testing. LFAs also promote consumer self-testing adoption.195 LFAs combine a chromatographic system that separates mixtures on a membrane with a biochemical reaction between antibodies and antigens or nucleic acids and target molecules.196 LFAs use aptamers and nucleic acids as biorecognition components in a strip form. They consist of three main parts: recognition, reaction, and signal transduction, integrated onto a paper strip with five components: sample pad, conjugate pad, membrane, absorbent pad, and backing plate.185 A standard LFA strip has a backing plate for structural support, with overlapping components (2–3 mm) that ensure efficient liquid movement over the strip.197 The sample pad, made of cellulose acetate, deposits fluid and may contain buffer salts to aid movement. The conjugate pad, made of materials like glass fiber, holds the bio-recognition element and releases it upon contact with the sample. The nitrocellulose membrane has a test line (TL) and control line (CL) for affinity assays, while the absorbent pad collects excess fluid.198 In aptamer-based LFAs, the sample moves via capillary action to the conjugate pad, where the analyte binds to the labeled antibody. The complex then reaches the nitrocellulose membrane, where the TL captured it, and the CL ensures proper flow. The TL shows a colorimetric or fluorescent signal for detection, while the CL verifies sample flow. The absorbent pad collects excess liquid.195 In sandwich aptamer-based LFAs, large molecules like pathogens are detected using two aptamers: the primary aptamer, conjugated to AuNPs, on the conjugate pad, and the biotinylated secondary aptamer on the TL. The analyte forms a complex with the primary aptamer, migrating to the TL where it's captured by the secondary aptamer. A positive result shows two red bands (TL and CL), while a negative result shows only one at the CL (Fig. 8).195,199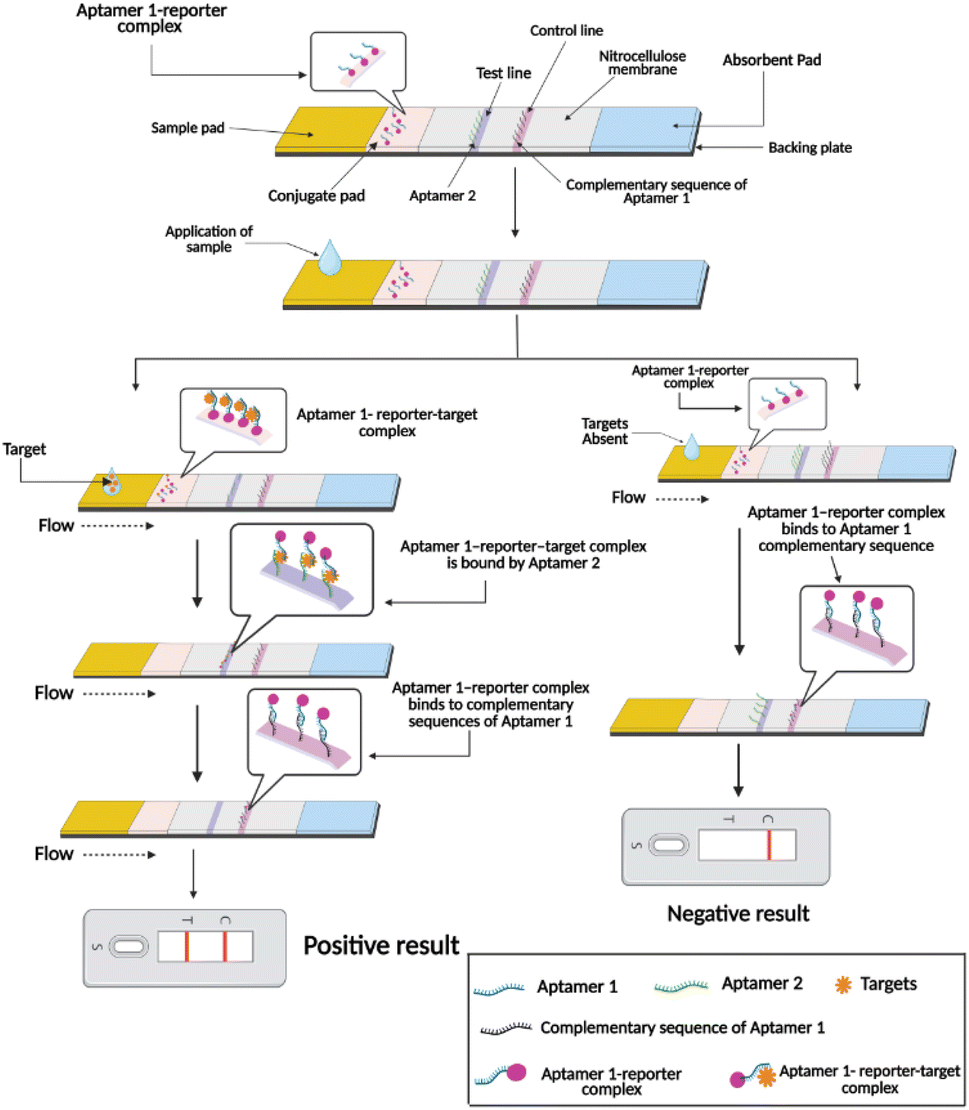 | ||
| Fig. 8 Aptamer-LFAs sandwich assay: dual aptamer for targeted analyte detection. | ||
In competitive aptamer-based LFAs, small molecules are detected by competing for aptamer binding between the sample's target molecules and those immobilized on the TL. Targets in the sample and TL compete for the aptamer, with the signal negatively correlated with the amount of target in the sample. A weak or absent signal at the TL indicates the presence of target molecules, while a stronger signal suggests their absence. The CL verifies the flow system35,200 (Fig. 9).
 | ||
| Fig. 9 Competitive aptamer-LFA: binding competition alters TL signal and validation process. | ||
The second strategy involves target molecules competing with an immobilized complementary sequence on the TL for aptamer binding.180 When an aptamer sequence undergoes structural changes, it can disrupt Watson–Crick base pairing and cause target-induced dissociation. In this strategy, an oligonucleotide partially complementary to the aptamer is attached to the TL. The target competes with this sequence, resulting in a weak or no signal on the TL. Without the target, a strong band appears as the aptamer/reporter complex is captured by the complementary sequence in Fig. 10.199
 | ||
| Fig. 10 Competitive aptamer-LFA: target binding controls signal by affecting partial complementary aptamer sequence on TL. | ||
Applications of aptamer-based LFAs detection antibiotics such as Ou et al. developed a magnetic microsphere-based aptamer–cDNA duplex LFAs to detect KAN in milk and honey. The assay worked in two steps: (1) KAN in the sample displaced cDNA from the aptamer–cDNA duplex conjugated to MMS, and (2) the released cDNA was applied to the LFAs strip, where it formed a sandwich structure with immobilized capture DNA1 and DNA2 on the TL and CL. The thresholds for visual detection in the experiment were 50 nM, whereas the quantified LOD was 4.96 × 10⁻³ μM.35 Birader et al. developed an aptamer-based LFAs to detect OTC in milk, with the quantified LOD in OTC at 1.08 × 10⁻⁴ μM within 10 minutes.180 These sensors are employed in various strategies to detect antibiotics, as summarized in Table 3, which details the analytes, detection methods, and LOD. Aptamer-based LFAs offer high specificity, stability, cost-effectiveness, and flexibility, making them ideal for detecting small molecules. Their user friendliness, affordability, and portability also make them particularly well-suited for POC diagnostics. However, they have some limitations, such as limited quantitative accuracy, sample matrix interference, and the need for liquid samples. Their performance can also be affected by environmental factors like temperature and pH. Careful handling is required for reliable results, and they are typically qualitative, indicating only the presence or absence of a target analyte.
Additionally, we included a comparative analysis in Table 4 to benchmark aptasensor's performance against standard detection methods, highlighting its relative sensitivity and practical applicability.
| Analytes | Technique | LOD (μM) | Matrix | Reference |
|---|---|---|---|---|
| KAN | Cemiluminescent aptasensor | 1.032 × 10⁻¹³ | Milk | 174 |
| Fluorescence aptasensor | 5.3 × 10⁻⁵ | Milk | 132 | |
| HPLC-ELSD | 1.03 × 10³ | Foods of animal origin | 201 | |
| TC | Electrochemical aptasensor | 2.28 × 10⁻¹² | Milk | 156 |
| Colorimetric aptasensor | 4.13 × 10⁻¹² | Milk | 31 | |
| HPLC-PDA | 5.63 × 10⁻⁴ | Bovine milk | 202 | |
| 2.25 × 10⁻¹ | Milk | |||
| HPLC-DAD | 1.23 × 101 | Milk | 203 | |
| OTC | Cemiluminescent aptasensor | 4.345 × 10⁻⁸ | Milk | 176 |
| HPLC-PDA | 1.09 × 10⁻⁴ | Bovine milk | 202 | |
| HPLC-DAD | 1.954 × 10⁻³ | Milk | 204 | |
| LC-MS/MS | 6.52 | Chicken eggs | 201 | |
| Capillary electrophoresis | 1.52 × 10² | Milk | 205 | |
| AMP | LFAs aptasensor | 1.72 × 10⁻⁸ | Milk | 180 |
| TC | Colorimetric aptasensor | 2.25 × 10⁻⁷ | Honey | 141 |
| ENR | Electrochemical aptasensor | 4.65 × 10⁻¹¹ | — | 154 |
| Electrochemical aptasensor | 3.08 × 10⁻¹⁰ | Water, milk | 153 | |
| Colorimetric aptasensor | 6.96 × 10⁻¹² | Fish | 115 | |
| Fluorescence aptasensor | 2.23 × 10⁻⁵ | Spiked milk | 128 | |
| LC-MS/MS | 3.90 × 10⁻¹ | Chicken eggs | 201 |
5 Conclusion and future prospective
Antibiotic contamination poses a serious threat to both public health and the environment, largely driven by the excessive use and improper disposal of antibiotics in the medical, agricultural, and aquaculture sectors. While conventional detection techniques such as HPLC, GC-MS, and LC-MS/MS offer high accuracy and reliability, they are often hindered by high operational costs, time-consuming procedures, and the requirement for skilled personnel and complex instrumentation. To address these limitations, aptamer-based biosensors have emerged as a powerful alternative, offering high specificity and sensitivity, rapid on-site detection, cost-effectiveness, and ease of miniaturization. This review has highlighted substantial advancements in aptasensor technologies, encompassing platforms such as colorimetric, fluorescent, electrochemical, chemiluminescent, SPR, and lateral flow assays. These methods have shown great promise in detecting antibiotic residues across a range of samples including food, water, and biological fluids, supporting applications in food safety, environmental monitoring, and clinical diagnostics. Nevertheless, the translation of aptamer biosensors into fully operational, field-deployable tools remains an evolving challenge. The integration of these sensors with microfluidic devices and wireless communication technologies could further enhance real-time detection capabilities and data accessibility. To fully unlock their potential, ongoing research must prioritize improving aptamer stability, enhancing device robustness and multiplexing capabilities, and ensuring compliance with regulatory standards to support widespread adoption in point-of-care and environmental surveillance applications. Future development should focus on creating portable, user-friendly diagnostic systems-such as handheld readers, paper-based lateral flow devices, and smartphone-integrated platforms-to facilitate routine monitoring, especially in resource-limited or decentralized settings.Data availability
No primary research results, software or code have been included and no new data were generated or analysed as part of this review.Author contributions
DD, JC, PM, RM and AKM: writing – original draft. AKM: conceptualization. JC, RM and AKM – review & editing.Conflicts of interest
There are no conflicts to declare.Acknowledgements
D. D. would like to acknowledge the Council of Scientific and Industrial Research, Government of India, for the CSIR-JRF fellowship (CSIR-JRF; File No. 09/1224(18914)/2024-EMR-I). P. M. would like to acknowledge Swami Vivekananda Merit-cum-Means scholarship (Application ID: WBP241720165040). R. M. would to acknowledge the DST, Govt. of India, for the DST-INSPIRE Fellowship (DST-INSPIRE-SRF; INSPIRE CODE-IF190457) and A. K. M. would like to acknowledge DST-SERB India (EEQ/2021/000058) for financial support.Notes and references
- M. L. Barreto, M. G. Teixeira and E. H. Carmo, J. Epidemiol. Community Health, 2006, 60, 192–195 CrossRef PubMed.
- E. Tognotti, Emerg. Infect. Dis., 2013, 19, 254–259 CrossRef PubMed.
- H. H. Farooqui, S. Selvaraj, A. Mehta and D. L. Heymann, PLoS One, 2018, 13, e0204805 CrossRef PubMed.
- J. I. R. Castanon, Poult. Sci., 2007, 86, 2466–2471 CrossRef CAS PubMed.
- M. Wang and J. C. Tang, J. Agro-Environ. Sci., 2010, 29, 261–266 Search PubMed.
- N. Czekalski, E. Gascón Díez and H. Bürgmann, ISME J., 2014, 8, 1381–1390 CrossRef CAS PubMed.
- A. J. Browne, M. G. Chipeta, G. Haines-Woodhouse, E. P. A. Kumaran, B. H. K. Hamadani, S. Zaraa, N. J. Henry, A. Deshpande, R. C. Reiner, N. P. J. Day, A. D. Lopez, S. Dunachie, C. E. Moore, A. Stergachis, S. I. Hay and C. Dolecek, Lancet Planet. Health, 2021, 5, e893–e904 CrossRef PubMed.
- European Centre for Disease Prevention and Control, Antimicrobial Resistance Surveillance in Europe: Annual Report of the European Antimicrobial Resistance Surveillance Network (EARS Net) 2015, Publications Office, LU, 2017 Search PubMed.
- L. Serwecińska, Water, 2020, 12, 3313 CrossRef.
- Y. Luan, N. Wang, C. Li, X. Guo and A. Lu, Antibiotics, 2020, 9, 787 CrossRef CAS PubMed.
- J. O'Neill, Tackling Drug-Resistant Infections Globally: Final Report and Recommendations, 2016, vol. 84 Search PubMed.
- X. Zhang, J. Wang, Q. Wu, L. Li, Y. Wang and H. Yang, Molecules, 2019, 24, 1902 CrossRef CAS PubMed.
- Y. Yu, Y. Liu, W. Wang, Y. Jia, G. Zhao, X. Zhang, H. Chen and Y. Zhou, Anal. Methods, 2019, 11, 5064–5069 RSC.
- Y.-J. Yu, H.-L. Wu, H.-Y. Fu, J. Zhao, Y.-N. Li, S.-F. Li, C. Kang and R.-Q. Yu, J. Chromatogr. A, 2013, 1302, 72–80 CrossRef CAS PubMed.
- T. Van Den Meersche, E. V. Pamel, C. V. Poucke, L. Herman, M. Heyndrickx, G. Rasschaert and E. Daeseleire, J. Chromatogr. A, 2016, 1429, 248–257 CrossRef CAS PubMed.
- S. Yang, X. Zhu, J. Wang, X. Jin, Y. Liu, F. Qian, S. Zhang and J. Chen, Bioresour. Technol., 2015, 193, 156–163 CrossRef CAS PubMed.
- J. B. Arsand, L. Jank, M. T. Martins, R. B. Hoff, F. Barreto, T. M. Pizzolato and C. Sirtori, Talanta, 2016, 154, 38–45 CrossRef CAS PubMed.
- J. Qiu, Q. Liu, M. Zhang, X. Li, J. Zhang, R. Xiong and L. He, Anal. Lett., 2020, 53, 2235–2251 CrossRef CAS.
- U. Acaroz, S. Ince, D. Arslan-Acaroz, I. Kucukkurt and A. Eryavuz, Kafkas Univ. Vet. Fak. Derg., 2020, 26, 97–102 Search PubMed.
- M. Gbylik-Sikorska, A. Posyniak, T. Sniegocki and J. Zmudzki, Chemosphere, 2015, 119, 8–15 CrossRef CAS PubMed.
- D. Moreno-González, F. J. Lara, N. Jurgovská, L. Gámiz-Gracia and A. M. García-Campaña, Anal. Chim. Acta, 2015, 891, 321–328 CrossRef PubMed.
- G. Zhu, C. Bao, W. Liu, X. Yan, L. Liu, J. Xiao and C. Chen, Curr. Pharm. Anal., 2018, 15, 9–16 CrossRef.
- L. Fu, S. Mao, F. Chen, S. Zhao, W. Su, G. Lai, A. Yu and C.-T. Lin, Chemosphere, 2022, 297, 134127 CrossRef CAS PubMed.
- Q. U. A. Zahra, Z. Luo, R. Ali, M. I. Khan, F. Li and B. Qiu, Nanomaterials, 2021, 11, 840 CrossRef CAS.
- L. V. De Faria, T. P. Lisboa, N. D. S. Campos, G. F. Alves, M. A. C. Matos, R. C. Matos and R. A. A. Munoz, Anal. Chim. Acta, 2021, 1173, 338569 CrossRef CAS PubMed.
- Y. Zhou, C. Mahapatra, H. Chen, X. Peng, S. Ramakrishna and H. S. Nanda, Curr. Opin. Biomed. Eng., 2020, 13, 16–24 CrossRef.
- S. Afrasiabi, M. Pourhajibagher, R. Raoofian, M. Tabarzad and A. Bahador, J. Biomed. Sci., 2020, 27, 6 CrossRef CAS.
- G. Liang, Y. Man, A. Li, X. Jin, X. Liu and L. Pan, Microchem. J., 2017, 131, 145–153 CrossRef CAS.
- G. Liang, Y. Man, A. Li, X. Jin, L. Pan and X. Liu, Microchim. Acta, 2017, 185, 54 CrossRef PubMed.
- G. Liang, Y. Man, X. Jin, L. Pan and X. Liu, Anal. Chim. Acta, 2016, 936, 222–228 CrossRef CAS PubMed.
- M. Liu, Z. Yang, B. Li and J. Du, Food Chem., 2021, 339, 128059 CrossRef CAS PubMed.
- C. Zhou, H. Zou, C. Sun, D. Ren, W. Xiong and Y. Li, Anal. Bioanal. Chem., 2018, 410, 2981–2989 CrossRef CAS.
- C.-C. Li, W.-C. Kong, J.-L. Cui, X.-L. Li, Y.-L. Meng, X.-J. Jia, X.-L. Zhang and Y.-F. Kang, Research Square, 2024, preprint, DOI:10.21203/rs.3.rs-4911437/v1.
- S. Mohammadi, K. P. Bagheri, R. M. Nadushan and M. Adabi, Appl. Phys. A, 2023, 129, 176 CrossRef CAS.
- Y. Ou, X. Jin, J. Liu, Y. Tian and N. Zhou, Anal. Biochem., 2019, 587, 113432 CrossRef CAS.
- P. Kovalakova, L. Cizmas, T. J. McDonald, B. Marsalek, M. Feng and V. K. Sharma, Chemosphere, 2020, 251, 126351 CrossRef CAS PubMed.
- M. K. Chattopadhyay, Front. Microbiol., 2014, 5, 334 Search PubMed.
- R. Mithuna, R. Tharanyalakshmi, I. Jain, S. Singhal, D. Sikarwar, S. Das, J. Ranjitha, D. Ghosh, M. M. Rahman and B. Das, Emerg. Contam, 2024, 10, 100389 CrossRef CAS.
- F. C. Cabello, Environ. Microbiol., 2006, 8, 1137–1144 CrossRef CAS PubMed.
- M. Pepi and S. Focardi, Int. J. Environ. Res. Publ. Health, 2021, 18, 5723 CrossRef CAS PubMed.
- J. Williams-Nguyen, J. B. Sallach, S. Bartelt-Hunt, A. B. Boxall, L. M. Durso, J. E. McLain, R. S. Singer, D. D. Snow and J. L. Zilles, J. Environ. Qual., 2016, 45, 394–406 CrossRef CAS.
- L. M. Durso and K. L. Cook, Curr. Opin. Microbiol., 2014, 19, 37–44 CrossRef PubMed.
- D. B. Worthen, J. Hist. Med. Allied Sci., 2007, 63, 273–274 CrossRef.
- D. C. Rocha, C. Da Silva Rocha, D. S. Tavares, S. L. De Morais Calado and M. P. Gomes, Sci. Total Environ., 2021, 767, 144902 CrossRef CAS PubMed.
- D. Schuster, K. Axtmann, N. Holstein, C. Felder, A. Voigt, H. Färber, P. Ciorba, C. Szekat, A. Schallenberg, M. Böckmann, C. Zarfl, C. Neidhöfer, K. Smalla, M. Exner and G. Bierbaum, Environ. Microbiol., 2022, 24, 5721–5733 CrossRef CAS PubMed.
- A. N. Ngigi, M. M. Magu and B. M. Muendo, Environ. Monit. Assess., 2020, 192, 18 CrossRef CAS PubMed.
- N. Hanna, P. Sun, Q. Sun, X. Li, X. Yang, X. Ji, H. Zou, J. Ottoson, L. E. Nilsson, B. Berglund, O. J. Dyar, A. J. Tamhankar and C. S. Lundborg, Environ. Int., 2018, 114, 131–142 CrossRef CAS PubMed.
- R. Gothwal and T. Shashidhar, Clean: Soil, Air, Water, 2014, 43, 479–489 Search PubMed.
- E. L. Thiang, C. W. Lee, H. Takada, K. Seki, A. Takei, S. Suzuki, A. Wang and C. W. Bong, Ecosys. Health Sustain., 2021, 7, 1926337 CrossRef.
- M. W. Joseph, W. N. Moturi and G. M. Ogendi, Curr. World Environ., 2024, 19, 778–789 Search PubMed.
- D. G. J. Larsson and C.-F. Flach, Nat. Rev. Microbiol., 2022, 20, 257–269 CrossRef CAS PubMed.
- M. Amarasiri, D. Sano and S. Suzuki, Crit. Rev. Environ. Sci. Technol., 2020, 50, 2016–2059 CrossRef CAS.
- National Research Council (US) Committee to Study the Human Health Effects of Subtherapeutic Antibiotic Use in Animal Feeds, The Effects on Human Health of Subtherapeutic Use of Antimicrobials in Animal Feeds, National Academies Press, Washington (DC), 1980 Search PubMed.
- L. Zhao, Y. H. Dong and H. Wang, Sci. Total Environ., 2010, 408, 1069–1075 CrossRef CAS PubMed.
- A. Göbel, C. S. McArdell, M. J.-F. Suter and W. Giger, Anal. Chem., 2004, 76, 4756–4764 CrossRef PubMed.
- N. Kemper, Ecol. Indic., 2008, 8, 1–13 CrossRef CAS.
- J.-F. Yang, G.-G. Ying, J.-L. Zhao, R. Tao, H.-C. Su and F. Chen, Sci. Total Environ., 2010, 408, 3424–3432 CrossRef CAS PubMed.
- K. Kümmerer, Chemosphere, 2009, 75, 417–434 CrossRef.
- D. G. J. Larsson, C. De Pedro and N. Paxeus, J. Hazard. Mater., 2007, 148, 751–755 CrossRef CAS PubMed.
- S. Jechalke, H. Heuer, J. Siemens, W. Amelung and K. Smalla, Trends Microbiol., 2014, 22, 536–545 CrossRef CAS PubMed.
- X. Wang, D. Ryu, R. H. Houtkooper and J. Auwerx, BioEssays, 2015, 37, 1045–1053 CrossRef.
- V. Minden, A. Deloy, A. M. Volkert, S. D. Leonhardt and G. Pufal, AoB Plants, 2017, 9, plx010 CrossRef.
- W. S. Darwish, Y. Ikenaka and M. Ishizuka, Jpn. J. Vet. Res., 2013, 61, S48–S53 Search PubMed.
- D. V. Patangia, C. Anthony Ryan, E. Dempsey, R. Paul Ross and C. Stanton, Microbiologyopen, 2022, 11, e1260 CrossRef CAS PubMed.
- C. J. Damman, S. I. Miller, C. M. Surawicz and T. L. Zisman, Am. J. Gastroenterol., 2012, 107, 1452–1459 CrossRef PubMed.
- L. M. Cox, S. Yamanishi, J. Sohn, A. V. Alekseyenko, J. M. Leung, I. Cho, S. G. Kim, H. Li, Z. Gao, D. Mahana, J. G. Zárate Rodriguez, A. B. Rogers, N. Robine, P. Loke and M. J. Blaser, Cell, 2014, 158, 705–721 CrossRef CAS PubMed.
- I. Cho, S. Yamanishi, L. Cox, B. A. Methé, J. Zavadil, K. Li, Z. Gao, D. Mahana, K. Raju, I. Teitler, H. Li, A. V. Alekseyenko and M. J. Blaser, Nature, 2012, 488, 621–626 CrossRef CAS PubMed.
- D. L. Robertson and G. F. Joyce, Nature, 1990, 344, 467–468 CrossRef CAS PubMed.
- C. Tuerk and L. Gold, Science, 1990, 249, 505–510 CrossRef CAS PubMed.
- A. D. Ellington and J. W. Szostak, Nature, 1990, 346, 818–822 CrossRef CAS PubMed.
- A. D. Ellington and J. W. Szostak, Nature, 1992, 355, 850–852 CrossRef CAS PubMed.
- A. S. Shraim, B. A. Abdel Majeed, M. A. Al-Binni and A. Hunaiti, ACS Pharmacol. Transl. Sci., 2022, 5, 1211–1227 CrossRef CAS PubMed.
- J. Zhou and J. Rossi, Nat. Rev. Drug Discov., 2017, 16, 181–202 CrossRef CAS PubMed.
- C. Lyu, I. M. Khan and Z. Wang, Talanta, 2021, 229, 122274 CrossRef PubMed.
- D.-M. Kim, M.-J. Go, J. Lee, D. Na and S.-M. Yoo, Molecules, 2021, 26, 5187 CrossRef CAS.
- T. Hianik, Biosensors, 2021, 11, 177 CrossRef CAS.
- G. Mayer, Angew. Chem., Int. Ed., 2009, 48, 2672–2689 CrossRef CAS.
- C. Kratschmer and M. Levy, Nucleic Acid Ther., 2017, 27, 335–344 CrossRef CAS.
- D. V. Morrissey, K. Blanchard, L. Shaw, K. Jensen, J. A. Lockridge, B. Dickinson, J. A. McSwiggen, C. Vargeese, K. Bowman, C. S. Shaffer, B. A. Polisky and S. Zinnen, Hepatology, 2005, 41, 1349–1356 CrossRef CAS.
- F. Bottari, E. Daems, A.-M. De Vries, P. Van Wielendaele, S. Trashin, R. Blust, F. Sobott, A. Madder, J. C. Martins and K. De Wael, J. Am. Chem. Soc., 2020, 142, 19622–19630 CrossRef CAS PubMed.
- X. Tao, F. He, X. Liu, F. Zhang, X. Wang, Y. Peng and J. Liu, Microchim. Acta, 2020, 187, 668 CrossRef CAS.
- Y. Zhao, A. Z. Li and J. Liu, Environ. Health, 2023, 1, 102–109 CAS.
- Y. Yang, S. Yin, Y. Li, D. Lu, J. Zhang and C. Sun, TrAC, Trends Anal. Chem., 2017, 95, 1–22 CrossRef CAS.
- S. Li and W. S. Choe, J. Biotechnol., 2008, 136, S86 CrossRef.
- H. X. Liu, C. Z. Wang, B. X. Zhang and K. D. Xu, Chin. J. Anal. Chem., 2017, 1971–1979 CAS.
- F. Li, Z. Yu, X. Han and R. Y. Lai, Anal. Chim. Acta, 2019, 1051, 1–23 CrossRef CAS PubMed.
- E. B. Bahadır and M. K. Sezgintürk, TrAC, Trends Anal. Chem., 2016, 76, 1–14 CrossRef.
- M. Zuker, Nucleic Acids Res., 2003, 31, 3406–3415 CrossRef CAS PubMed.
- A.-Y. Lee, N.-R. Ha, I.-P. Jung, S.-H. Kim, A.-R. Kim and M.-Y. Yoon, Anal. Biochem., 2017, 531, 1–7 CrossRef CAS PubMed.
- Y. Zhao, B. Gao, Y. Chen and J. Liu, Analyst, 2023, 148, 1507–1513 RSC.
- X. Han, Y. Zhang, J. Nie, S. Zhao, Y. Tian and N. Zhou, Microchim. Acta, 2017, 185, 4 CrossRef.
- Y. Ding, Z. Gao and H. Li, Sens. Actuators, B, 2021, 343, 130113 CrossRef CAS.
- D. H. Burke, D. C. Hoffman, A. Brown, M. Hansen, A. Pardi and L. Gold, Chem. Biol., 1997, 4, 833–843 CrossRef CAS PubMed.
- Y. Zhu, P. Chandra, K.-M. Song, C. Ban and Y.-B. Shim, Biosens. Bioelectron., 2012, 36, 29–34 CrossRef CAS PubMed.
- M. G. Wallis, U. von Ahsen, R. Schroeder and M. Famulok, Chem. Biol., 1995, 2, 543–552 CrossRef CAS PubMed.
- G. Liang, L. Song, Y. Gao, K. Wu, R. Guo, R. Chen, J. Zhen and L. Pan, Toxics, 2023, 11, 513 CrossRef CAS PubMed.
- S. R. Han, J. Yu and S.-W. Lee, Biochem. Biophys. Res. Commun., 2014, 448, 397–402 CrossRef CAS PubMed.
- J. H. Niazi, S. J. Lee, Y. S. Kim and M. B. Gu, Bioorg. Med. Chem., 2008, 16, 1254–1261 CrossRef CAS PubMed.
- R. Chinnappan, S. Eissa, A. Alotaibi, A. Siddiqua, O. A. Alsager and M. Zourob, Anal. Chim. Acta, 2020, 1101, 149–156 CrossRef CAS PubMed.
- M. Majdinasab, K. Mitsubayashi and J. L. Marty, Trends Biotechnol., 2019, 37, 898–915 CrossRef CAS.
- T. Yang, Z. Luo, Y. Tian, C. Qian and Y. Duan, TrAC, Trends Anal. Chem., 2020, 124, 115795 CrossRef CAS.
- D. Zhu, B. Liu and G. Wei, Biosensors, 2021, 11, 259 CrossRef CAS PubMed.
- G. Ghodake, S. Shinde, R. G. Saratale, A. Kadam, G. D. Saratale, A. Syed, N. Marraiki, A. M. Elgorban and D. Kim, J. Sci. Food Agric., 2020, 100, 874–884 CrossRef CAS PubMed.
- M. Majdinasab, R. K. Mishra, X. Tang and J. L. Marty, TrAC, Trends Anal. Chem., 2020, 127, 115883 CrossRef CAS.
- H. Katano, Y. Kuroda, S. Taira, C. Maruyama and Y. Hamano, Anal. Sci., 2017, 33, 499–503 CrossRef CAS PubMed.
- N. Sethu, S. Krishnakumar, V. Mitra, C. Tagad and R. Vyas, Sens. Acutators Rep., 2023, 5, 100151 Search PubMed.
- L. Zhang, Y. Mazouzi, M. Salmain, B. Liedberg and S. Boujday, Biosens. Bioelectron., 2020, 165, 112370 CrossRef CAS.
- J. Simon, S. Udayan, E. S. Bindiya, S. G. Bhat, V. P. N. Nampoori and M. Kailasnath, Anal. Biochem., 2021, 612, 113975 CrossRef CAS PubMed.
- W. Bai, C. Zhu, J. Liu, M. Yan, S. Yang and A. Chen, Environ. Toxicol. Chem., 2015, 34, 2244–2249 CrossRef CAS PubMed.
- N. Fahimi-Kashani and M. R. Hormozi-Nezhad, Anal. Chem., 2016, 88, 8099–8106 CrossRef CAS PubMed.
- K.-M. Song, M. Cho, H. Jo, K. Min, S. H. Jeon, T. Kim, M. S. Han, J. K. Ku and C. Ban, Anal. Biochem., 2011, 415, 175–181 CrossRef CAS PubMed.
- Y. Xu, T. Han, X. Li, L. Sun, Y. Zhang and Y. Zhang, Anal. Chim. Acta, 2015, 891, 298–303 CrossRef CAS PubMed.
- N.-R. Ha, I.-P. Jung, S.-H. Kim, A.-R. Kim and M.-Y. Yoon, Process Biochem., 2017, 62, 161–168 CrossRef CAS.
- T. Zhao, Q. Chen, Y. Wen, X. Bian, Q. Tao, G. Liu and J. Yan, Food Chem., 2022, 377, 132072 CrossRef CAS PubMed.
- Y. Du, Y. Zhou, Y. Wen, X. Bian, Y. Xie, W. Zhang, G. Liu and J. Yan, Microchim. Acta, 2019, 186, 840 CrossRef CAS PubMed.
- Z. Zhang, Y. Tian, P. Huang and F.-Y. Wu, Talanta, 2020, 208, 120342 CrossRef CAS PubMed.
- S. Wang, S. Gao, S. Sun, Y. Yang, Y. Zhang, J. Liu, Y. Dong, H. Su and T. Tan, RSC Adv., 2016, 6, 45645–45651 RSC.
- R. Wang, Q. Zhang, Y. Zhang, H. Shi, K. T. Nguyen and X. Zhou, Anal. Chem., 2019, 91, 15811–15817 CrossRef CAS.
- B. Lin, Y. Yu, Y. Cao, M. Guo, D. Zhu, J. Dai and M. Zheng, Biosens. Bioelectron., 2018, 100, 482–489 CrossRef CAS.
- B. Sequeira-Antunes and H. A. Ferreira, Biomedicines, 2023, 11, 3201 CrossRef CAS PubMed.
- G. Zheng, L. Zhao, D. Yuan, J. Li, G. Yang, D. Song, H. Miao, L. Shu, X. Mo, X. Xu, L. Li, X. Song and Y. Zhao, Biosens. Bioelectron., 2022, 198, 113827 CrossRef CAS PubMed.
- S. Ng, H. S. Lim, Q. Ma and Z. Gao, Theranostics, 2016, 6, 1683–1702 Search PubMed.
- B. J. Alyamani, O. A. Alsager and M. Zourob, Sensors, 2019, 19, 4181 CrossRef CAS PubMed.
- S. H. Jalalian, S. M. Taghdisi, N. M. Danesh, H. Bakhtiari, P. Lavaee, M. Ramezani and K. Abnous, Anal. Methods, 2015, 7, 2523–2528 Search PubMed.
- S. Yang, C. Li, H. Zhan, R. Liu, W. Chen, X. Wang and K. Xu, J. Nanobiotechnol., 2023, 21, 22 CrossRef CAS.
- A. Bahreyni, H. Luo, M. Ramezani, M. Alibolandi, V. Soheili, N. M. Danesh, M. S. Ashjaei, K. Abnous and S. M. Taghdisi, Spectrochim. Acta, Part A, 2021, 246, 119009 Search PubMed.
- S. M. Taghdisi, N. M. Danesh, M. A. Nameghi, M. Ramezani and K. Abnous, Food Chem., 2016, 203, 145–149 CrossRef CAS.
- Z. Shang, P. Ma, I. M. Khan, Y. Zhang and Z. Wang, Food Control, 2023, 145, 109437 Search PubMed.
- S. Dolati, M. Ramezani, M. S. Nabavinia, V. Soheili, K. Abnous and S. M. Taghdisi, Anal. Biochem., 2018, 549, 124–129 Search PubMed.
- W.-C. Kong, C.-C. Li, X.-L. Zhang, J.-L. Cui, X.-L. Li, X.-J. Jia, Y.-L. Meng and Y.-F. Kang, Anal. Lett., 2024, 1–13 CrossRef CAS.
- J. Wang, T. Lu, Y. Hu, X. Wang and Y. Wu, Spectrochim. Acta, Part A, 2020, 226, 117651 CrossRef CAS PubMed.
- L. Xie, C. Fan, Y. Liu, Q. Chen and X. Chen, Anal. Chim. Acta, 2024, 1308, 342659 CrossRef CAS PubMed.
- D. Xu, L. Shan, B. Guo, J. Wang, Q. Huang, S. Wang, F. Li, S. Wu, W. Wang and J. Chen, Food Chem., 2025, 478, 143291 CrossRef CAS PubMed.
- Z. Liu, W. Yang, H. Lin, M. Zhang and C. Sun, Biosensors, 2025, 15, 252 CrossRef PubMed.
- J. Zhao, Y. Wu, H. Tao, H. Chen, W. Yang and S. Qiu, RSC Adv., 2017, 7, 38471–38478 RSC.
- X. Zhou, L. Wang, G. Shen, D. Zhang, J. Xie, A. Mamut, W. Huang and S. Zhou, Microchim. Acta, 2018, 185, 355 Search PubMed.
- Y. Luo, J. Xu, Y. Li, H. Gao, J. Guo, F. Shen and C. Sun, Food Control, 2015, 54, 7–15 CrossRef CAS.
- Q. Ma, Y. Wang, J. Jia and Y. Xiang, Food Chem., 2018, 249, 98–103 CrossRef CAS PubMed.
- Y. S. Kwon, N. H. A. Raston and M. B. Gu, Chem. Commun., 2014, 50, 40–42 RSC.
- A. Wang, H. Zhao, X. Chen, B. Tan, Y. Zhang and X. Quan, Anal. Biochem., 2017, 525, 92–99 CrossRef CAS PubMed.
- Y. Tang, J. Zhang, J.-H. Liu, I. Gapparov, S. Wang, Y. Dong, H. Su and T. Tan, Anal. Methods, 2017, 9, 1133–1140 RSC.
- J. Zhou, Y. Li, W. Wang, Z. Lu, H. Han and J. Liu, Langmuir, 2020, 36, 11490–11498 CrossRef CAS PubMed.
- P. Lavaee, N. M. Danesh, M. Ramezani, K. Abnous and S. M. Taghdisi, Microchim. Acta, 2017, 184, 2039–2045 CrossRef CAS.
- Y. Sun, T. Qi, Y. Jin, L. Liang and J. Zhao, RSC Adv., 2021, 11, 10054–10060 RSC.
- Y. Tian, Y. Mou, W. Zhang, Z. Sun, Y. Yin, L. Han, D. Chen, Y. Guo, X. Sun, F. Li and Y. Wu, Biosens. Bioelectron., 2025, 268, 116911 CrossRef CAS PubMed.
- M. Li, R. Huang, X. Liao, Z. Zhou, L. Zou and B. Liu, Anal. Methods, 2023, 15, 843–848 RSC.
- Z. Luo, Y. Wang, X. Lu, J. Chen, F. Wei, Z. Huang, C. Zhou and Y. Duan, Anal. Chim. Acta, 2017, 984, 177–184 Search PubMed.
- B. Tan, H. Zhao, L. Du, X. Gan and X. Quan, Biosens. Bioelectron., 2016, 83, 267–273 CrossRef CAS.
- Y. Wang, N. Gan, Y. Zhou, T. Li, Y. Cao and Y. Chen, Biosens. Bioelectron., 2017, 87, 508–513 CrossRef CAS PubMed.
- Y. Duan, L. Wang, Z. Gao, H. Wang, H. Zhang and H. Li, Talanta, 2017, 165, 671–676 CrossRef CAS PubMed.
- K. Ling, H. Jiang, L. Zhang, Y. Li, L. Yang, C. Qiu and F.-R. Li, Anal. Bioanal. Chem., 2016, 408, 3593–3600 Search PubMed.
- M. D. Simmons, L. M. Miller, M. O. Sundström and S. Johnson, Antibiotics, 2020, 9, 655 Search PubMed.
- B. Zhang, L. Lv, X. Ma, L. Xie, M. Lin, H. Chen and B. He, Biosens. Bioelectron., 2022, 210, 114296 CrossRef CAS PubMed.
- Z. Niu, S. Wang, R. Luo, P. Wei, K. Li, W. Wang and Q. Yang, Anal. Methods, 2023, 15, 1441–1451 RSC.
- Q. Yu, H. Yang and Y. Yang, J. Food Meas. Char., 2023, 18, 87–94 Search PubMed.
- M. Naseri, A. Niazi, K. Bagherzadeh, E. Konoz and H. R. Samadikhah, Food Chem., 2023, 421, 136195 CrossRef CAS PubMed.
- Q. Xiao, D. Zhang, M. Yang, S. Liu, Y. Fang and S. Huang, J. Anal. Test., 2024, 9, 96–108 CrossRef.
- Y. Jin, Y. Zhang, H. Xu, X. Lu, Y. Yuan and W. Zhang, Food Control, 2024, 161, 110390 CrossRef CAS.
- L. Wang, H. Wang, S. Huang, F. Wu and X. Niu, Food Chem., 2023, 403, 134399 CrossRef CAS PubMed.
- Y. Hui, D. Yang, L. Wei, M. Pu, Y. Mao, X. Chen and B. Wang, Food Chem., 2024, 432, 137271 CrossRef CAS PubMed.
- Y. Zhou, F. Li, H. Wu, Y. Chen, H. Yin, S. Ai and J. Wang, Sens. Actuators, B, 2019, 296, 126664 Search PubMed.
- Q. Zhang, F. Li, X. Li, Y. Liu and J. Han, Int. J. Electrochem. Sci., 2021, 16, 211143 Search PubMed.
- F. Hong, X. Chen, Y. Cao, Y. Dong, D. Wu, F. Hu and N. Gan, Biosens. Bioelectron., 2018, 112, 202–208 CrossRef CAS PubMed.
- X. Yao, J. Shen, Q. Liu, H. Fa, M. Yang and C. Hou, Anal. Methods, 2020, 12, 4967–4976 RSC.
- H. Peng, Y. Hui, L. Zhang, F. Zhang, Y. Liu, J. Zheng, R. Jia, Y. Song and B. Wang, Sens. Actuators, B, 2022, 368, 132119 CrossRef CAS.
- X. Guo, F. Li, X. Zhu, P. Zhang, Y. Liu and Z. Li, Int. J. Electrochem. Sci., 2024, 19, 100537 CrossRef CAS.
- B. Xie, H. Peng, R. Zhang, C. Wang and Y. He, J. Phys. Chem. C, 2021, 125, 5678–5683 CrossRef CAS.
- D. Zheng, X. Zhu, X. Zhu, B. Bo, Y. Yin and G. Li, Analyst, 2013, 138, 1886 RSC.
- Z. Yu and R. Y. Lai, Talanta, 2018, 176, 619–624 CrossRef CAS PubMed.
- P. Chandra, H.-B. Noh, M.-S. Won and Y.-B. Shim, Biosens. Bioelectron., 2011, 26, 4442–4449 CrossRef CAS PubMed.
- A. A. Rowe, E. A. Miller and K. W. Plaxco, Anal. Chem., 2010, 82, 7090–7095 Search PubMed.
- E. González-Fernández, N. de-los-Santos-Álvarez, M. J. Lobo-Castañón, A. J. Miranda-Ordieres and P. Tuñón-Blanco, Biosens. Bioelectron., 2011, 26, 2354–2360 CrossRef PubMed.
- K.-H. Leung, H.-Z. He, D. S.-H. Chan, W.-C. Fu, C.-H. Leung and D.-L. Ma, Sens. Actuators, B, 2013, 177, 487–492 CrossRef CAS.
- X. Lin, J. Su, H. Lin, X. Sun, B. Liu, R. K. Kankala and S.-F. Zhou, Talanta, 2019, 202, 452–459 CrossRef CAS PubMed.
- M. Zhao, Y. Zhuo, Y.-Q. Chai and R. Yuan, Biomaterials, 2015, 52, 476–483 CrossRef CAS PubMed.
- L. Hao, H. Gu, N. Duan, S. Wu and Z. Wang, Anal. Methods, 2016, 8, 7929–7936 RSC.
- Á. Écija-Arenas, E.-M. Kirchner, T. Hirsch and J. M. Fernández-Romero, Anal. Chim. Acta, 2021, 1169, 338631 CrossRef PubMed.
- G. Cappi, F. M. Spiga, Y. Moncada, A. Ferretti, M. Beyeler, M. Bianchessi, L. Decosterd, T. Buclin and C. Guiducci, Anal. Chem., 2015, 87, 5278–5285 CrossRef CAS PubMed.
- N. de-los-Santos-Álvarez, M. J. Lobo-Castañón, A. J. Miranda-Ordieres and P. Tuñón-Blanco, Biosens. Bioelectron., 2009, 24, 2547–2553 CrossRef PubMed.
- K. Birader, P. Kumar, Y. Tammineni, J. A. Barla, S. Reddy and P. Suman, Food Chem., 2021, 356, 129659 CrossRef CAS PubMed.
- L. Kaiser, J. Weisser, M. Kohl and H.-P. Deigner, Sci. Rep., 2018, 8, 5628 CrossRef PubMed.
- Z. Li, M. A. Mohamed, A. M. Vinu Mohan, Z. Zhu, V. Sharma, G. K. Mishra and R. K. Mishra, Sensors, 2019, 19, 5435 CrossRef CAS PubMed.
- N. Lu, J. Chen, Z. Rao, B. Guo and Y. Xu, Biosensors, 2023, 13, 850 CrossRef CAS PubMed.
- M. Amiri, K. Nekoueian and R. S. Saberi, Anal. Bioanal. Chem., 2021, 413, 673–699 CrossRef CAS PubMed.
- F. Li, J. Zhu, Y. Liu, Z. Lil, H. Kang and R. Li, Int. J. Electrochem. Sci., 2020, 15, 7520–7530 CrossRef.
- D. N. Da Silva and A. C. Pereira, Electrochem, 2023, 4, 553–567 CrossRef CAS.
- Z. Chen, M. Xie, F. Zhao and S. Han, Foods, 2022, 11, 1404 CrossRef CAS PubMed.
- S. Cheng, H. Liu, H. Zhang, G. Chu, Y. Guo and X. Sun, Sens. Actuators, B, 2020, 304, 127367 CrossRef CAS.
- L. Yang, H. Ni, C. Li, X. Zhang, K. Wen, Y. Ke, H. Yang, W. Shi, S. Zhang, J. Shen and Z. Wang, Sens. Actuators, B, 2019, 281, 801–811 CrossRef CAS.
- L. Hao, N. Duan, S. Wu, B. Xu and Z. Wang, Anal. Bioanal. Chem., 2015, 407, 7907–7915 CrossRef CAS PubMed.
- H. H. Nguyen, J. Park, S. Kang and M. Kim, Sensors, 2015, 15, 10481–10510 Search PubMed.
- S. H. Lee, Y. E. Park, J. E. Lee and H. J. Lee, Biosens. Bioelectron., 2020, 154, 112065 CrossRef CAS PubMed.
- C.-C. Chang, Biosensors, 2021, 11, 233 CrossRef CAS.
- K. M. Koczula and A. Gallotta, Essays Biochem., 2016, 60, 111–120 Search PubMed.
- M. Majdinasab, M. Badea and J. L. Marty, Pharmaceuticals, 2022, 15, 90 CrossRef CAS PubMed.
- E. B. Bahadır and M. K. Sezgintürk, TrAC, Trends Anal. Chem., 2016, 82, 286–306 Search PubMed.
- H. Ye, Y. Liu, L. Zhan, Y. Liu and Z. Qin, Theranostics, 2020, 10, 4359–4373 Search PubMed.
- M. Sajid, A.-N. Kawde and M. Daud, J. Saudi Chem. Soc., 2015, 19, 689–705 CrossRef.
- T. Wang, L. Chen, A. Chikkanna, S. Chen, I. Brusius, N. Sbuh and R. N. Veedu, Theranostics, 2021, 11, 5174–5196 CrossRef PubMed.
- T. Kurth, S. Witt, S. Bolten, J.-J. Waniek, C. Kortmann, A. Lavrentieva, T. Scheper and J.-G. Walter, Biosensors, 2019, 9, 124 CrossRef CAS PubMed.
- Q. Liu, J. Li, X. Song, M. Zhang, E. Li, F. Gao and L. He, RSC Adv., 2017, 7, 1251–1259 Search PubMed.
- M. N. Uddin, A. Hasnaine, Md. S. Haque, S. Das, M. Uddin, D. Chakraborty and M. Mostafa, J. Food Prot., 2024, 87, 100279 CrossRef CAS PubMed.
- M. Kurjogi, Y. H. I. Mohammad, S. Alghamdi, M. Abdelrahman, P. Satapute and S. Jogaiah, PLoS One, 2019, 14, e0223475 CrossRef CAS PubMed.
- A. Kumar, A. K. Panda and N. Sharma, J. Food Sci. Technol., 2022, 59, 95–104 CrossRef CAS PubMed.
- S. Dawadi, R. Thapa, B. Modi, S. Bhandari, A. P. Timilsina, R. P. Yadav, B. Aryal, S. Gautam, P. Sharma, B. B. Thapa, N. Aryal, S. Aryal, B. P. Regmi and N. Parajuli, Processes, 2021, 9, 1500 CrossRef CAS.
Footnote |
| † Dedicated to Prof. Amiya Kumar Panda, Department of Chemistry and Chemical Technology, Vidyasagar University, on his 57th birthday in recognition of his significant contributions to Biophysical Chemistry. |
| This journal is © The Royal Society of Chemistry 2025 |