
 Open Access Article
 This Open Access Article is licensed under a Creative Commons Attribution-Non Commercial 3.0 Unported Licence
Development of N,P-doped carbon quantum dots as a green fluorescent probe for fexofenadine determination: mechanistic studies, Box–Behnken optimization, and pharmacokinetic application†
Ali Alqahtania,
Taha Alqahtania,
Adel Al Fateaseb,
Adil Alshehric and
Ahmed A. Almrasy *d
*d
aDepartment of Pharmacology, College of Pharmacy, King Khalid University, Abha, 62529, Saudi Arabia
bDepartment of Pharmaceutics, College of Pharmacy, King Khalid University, Abha, 62529, Saudi Arabia
cDepartment of Medicine, College of Medicine, King Khalid University, Abha, 62529, Saudi Arabia
dPharmaceutical Analytical Chemistry Department, Faculty of Pharmacy, Al-Azhar University, Cairo 11751, Egypt. E-mail: ahmedalialmrasy8@gmail.com
First published on 6th May 2025
Abstract
A sensitive and selective fluorescence quenching method based on nitrogen and phosphorus co-doped carbon quantum dots (N,P CQDs) was developed for the quantitative determination of the antihistamine drug fexofenadine. The optical and morphological properties of the N,P CQDs were extensively characterized using dynamic light scattering, transmission electron microscopy, UV-vis absorption, and fluorescence spectroscopy. A blue emitting N,P CQDs with excitation and emission maxima at 324 and 425 nm, respectively, exhibited strong fluorescence quenching upon interaction with fexofenadine. The sensing mechanism was investigated through Stern–Volmer analysis and thermodynamic studies, revealing a static quenching process. Additionally, the experimental parameters affecting the quenching efficiency, such as pH, N,P CQDs volume, and incubation time, were optimized using a Box–Behnken design to achieve maximum sensitivity. A significant quadratic model was developed to maximize the fluorescence quenching efficiency of these N,P CQDs upon interaction with fexofenadine which was further employed in the optimization process. The proposed method showed excellent linearity (r2 = 0.9998) over the dynamic range of 0.02–1.5 μg mL−1, with a limit of detection of 0.006 μg mL−1. The analytical performance of the method was validated according to ICH M10 guidelines, demonstrating high accuracy, precision, and selectivity. The applicability of the method was demonstrated by determining fexofenadine in pharmaceutical formulations with no significant difference from the reported HPLC-UV method. Furthermore, the method was successfully applied for pharmacokinetic profiling in rabbits following oral administration (10 mg kg−1), revealing characteristic parameters including Cmax of 344 ± 84 ng mL−1 at 3.6 h, elimination half-life of 12.5 h, and AUC0→∞ of 6495 ng·h mL−1, which aligned well with previously reported pharmacokinetic behavior. The greenness and practicality of the proposed method were evaluated using the AGREE, MOGAPI and BAGI tools, indicating its superior environmental sustainability and acceptable practical applicability compared to conventional HPLC-UV and UPLC-MS/MS techniques and presenting its suitability for routine pharmaceutical and bioanalytical applications.
1. Introduction
Fexofenadine is a widely prescribed second-generation antihistamine used to treat allergic rhinitis and chronic urticaria due to its non-sedative properties and minimal anticholinergic effects.1,2 Unlike other antihistamines, fexofenadine undergoes minimal hepatic metabolism, relying primarily on renal excretion (11%) and biliary secretion (80%).3 Its pharmacokinetics (PK) are complex and influenced by drug transporters such as P-glycoprotein (P-gp), which limits its intestinal absorption, and organic anion transporting polypeptides (OATPs), which facilitate its uptake into enterocytes and hepatocytes.4 These transporters contribute to significant interindividual variability in bioavailability, making fexofenadine a challenging drug to monitor. Additionally, factors such as food interactions (e.g., grapefruit juice), renal impairment, and drug–drug interactions (DDIs) further complicate its PK profile, leading to variability in systemic exposure and potential toxicity risks.5 For instance, patients with renal impairment exhibit reduced clearance, increasing the risk of adverse effects.5 Hence, the development of a sensitive and reliable analytical method is crucial for the accurate quantification of fexofenadine in various matrices, such as pharmaceutical formulations and biological samples, to support therapeutic drug monitoring and pharmacokinetic studies.Current analytical approaches for fexofenadine determination encompass various techniques, including high-performance liquid chromatography (HPLC) coupled with UV detection,6,7 fluorescence detection,8 or mass spectrometry.9–11 However, these methods often require complex sample preparation, lengthy run times, and sophisticated instrumentation, which may not be readily available in many laboratories. Potentiometric sensors based on ion-selective electrodes such as carbon paste and polymeric membrane electrodes have also been developed for fexofenadine determination.12,13 Nevertheless, these electrochemical methods often suffer from interferences and poor selectivity. Spectrofluorimetric methods have also gained attention due to their inherent sensitivity, selectivity, and simplicity. For example, a synchronous fluorescence method has been reported for the determination of fexofenadine in pharmaceutical and spiked human plasma samples.14 However, the quantification was performed at 284 nm in the UV region, which may be susceptible to interferences from matrix constituents. Moreover, the reported fluorescent method suffers from limited sensitivity, which may not be suitable for pharmacokinetic studies. Silver nanoparticles have also been employed as fluorescence probes for fexofenadine quantification, but their synthesis and optimization can be complex and time-consuming.15 Besides, using expensive and toxic silver compounds raises environmental concerns.
Fluorescent carbon-based nanomaterials, such as carbon quantum dots (CQDs), have emerged as a promising class of fluorescent probes due to their unique optical properties, excellent photostability, and biocompatibility.16 These CQDs can be synthesized from a wide range of precursors, including citric acid, glucose, and amino acids, and can be tailored to exhibit specific fluorescence characteristics through heteroatom doping.17 By introducing heteroatoms such as nitrogen, sulfur and phosphorus atoms into the carbon lattice, the optical and surface properties of carbon quantum dots can be tuned to enhance their fluorescence quantum yield via electron delocalization and surface functionalization, enabling sensitive, selective detection of various analytes, including heavy metals, metabolites, and other pharmaceutical compounds.18,19 For example, N,S-CQDs have been used for the sensitive and selective detection of glimepiride,20 doxycycline,21 and imatinib,22 demonstrating their potential as versatile fluorescent sensors. Upon interaction with the analyte, the fluorescence of the N,S-CQDs can be quenched, providing a basis for the quantitative determination of the target compound. Nitrogen and phosphorus co-doped carbon quantum dots (N,P CQDs) have been less reported, but they have shown great promise due to their enhanced photoluminescence and reduced toxicity. For instance, N,P CQDs have been utilized for the sensitive detection of detection of Cr(VI) and ascorbic acid in pure aqueous solutions and in living cells.23 A combination of inner filter effect and static quenching mechanism contributed to the high detection sensitivity of N,P-CQDs towards these analytes. However, to the best of our knowledge, the application of N,P-CQDs for the sensitive determination of fexofenadine has not been explored.
This study aims to develop a novel fluorescent probe based on N,P CQDs for the sensitive determination of fexofenadine in pharmaceutical formulations and rabbit plasma samples. The morphology and optical properties of the N,P CQDs were extensively characterized using various techniques. The mechanism of fluorescence quenching of N,P CQDs by fexofenadine was investigated through Stern–Volmer analysis and thermodynamic studies. Moreover, the experimental parameters affecting the quenching process, such as pH, N,P CQDs volume, and incubation time, were optimized using Box–Behnken design to achieve maximum sensitivity. The analytical performance of the proposed method was validated according to ICH M10 guidelines for bioanalytical method validation. Besides, the greenness and blueness of the proposed method were evaluated using the AGREE (Analytical GREEnness calculator),24 MOGAPI (Modified Green Analytical Procedure Index),25 and BAGI (Blue Applicability Grade Index) AGREE26 tools to assess its environmental impact and analytical practicality compared to the reported literature. The applicability of the developed method was demonstrated by analyzing fexofenadine in pharmaceutical formulations and pharmacokinetics in rabbit plasma to support therapeutic drug monitoring and clinical studies.
2. Experimental
2.1. Materials
Fexofenadine hydrochloride (99.82%) was acquired from the Egyptian Drug Authority (EDA), Cairo, Egypt. Aspartic acid, boric acid, phosphoric acid, acetic acid, and sodium hydroxide were purchased from Piochem Co., Cairo, Egypt. Diethylenetriamine, acetone and HPLC-grade acetonitrile were obtained from Sigma-Aldrich (St. Louis, MO, USA). All other chemicals used were of analytical grade and were used without further purification. Distilled water was used throughout the experiments. Pharmaceutical fexofenadine tablets (Fexon®), each tablet claimed to contain 120 mg fexofenadine hydrochloride, were purchased from a local pharmacy, Cairo, Egypt.2.2. Instrumentation
A Shimadzu UV-1800 UV-visible spectrophotometer and a Jasco FP-6200 spectrofluorometer were used for recording the UV-vis absorption and fluorescence spectra, respectively. The instrumental parameters for the fluorescence measurements were: excitation slit width = 10 nm, emission slit width = 10 nm, scan speed = 4000 nm min−1, and emission range = 400–650 nm. Dynamic light scattering (DLS) measurements were performed using a Malvern Zetasizer Nano ZS instrument to determine the hydrodynamic size and zeta potential of the N,P CQDs. Transmission electron microscopy (TEM) images were obtained using a JEOL JEM-2100 instrument at an accelerating voltage of 200 kV to investigate the morphology and size of the N,P CQDs. pH measurements were carried out using a Jenway 3505 pH meter equipped with a combined glass electrode.2.3. Synthesis and characterization of the N,P CQDs
The N,P CQDs were synthesized via a one-step hydrothermal method using aspartic acid, diethylenetriamine, and phosphoric acid as precursors.23 Briefly, aspartic acid (0.5 g), diethylenetriamine (1 mL), and phosphoric acid (1 mL) were dissolved in 15 mL of distilled water. Following vigorous stirring, the mixture was transferred to a Teflon-lined stainless-steel autoclave and heated at 280 °C for 4 hours. The resulting brown suspension was cooled to room temperature, and the as-synthesized N,P CQDs were filtered using a 0.45 μm syringe filter and centrifuged at 10![[thin space (1/6-em)]](https://www.rsc.org/images/entities/char_2009.gif) 000 rpm for 10 minutes to remove any large particles. The N,P CQDs were further purified by dialysis against distilled water for 24 hours using a dialysis membrane with a molecular weight cutoff of 3500 Da. The purified N,P CQDs were precipitated by adding acetone and collected by centrifugation at 10000 rpm for 10 minutes. A stock solution of the N,P CQDs was prepared in water at a concentration of 1 mg mL−1 and stored at 4 °C for further use. The morphology and size distribution of the N,P CQDs were characterized by TEM and DLS. The optical properties of the N,P CQDs, including UV-vis absorption and fluorescence emission spectra, were also examined.
000 rpm for 10 minutes to remove any large particles. The N,P CQDs were further purified by dialysis against distilled water for 24 hours using a dialysis membrane with a molecular weight cutoff of 3500 Da. The purified N,P CQDs were precipitated by adding acetone and collected by centrifugation at 10000 rpm for 10 minutes. A stock solution of the N,P CQDs was prepared in water at a concentration of 1 mg mL−1 and stored at 4 °C for further use. The morphology and size distribution of the N,P CQDs were characterized by TEM and DLS. The optical properties of the N,P CQDs, including UV-vis absorption and fluorescence emission spectra, were also examined.
2.4. Optimization of the sensing conditions
The sensing conditions for the determination of fexofenadine using the N,P CQDs were systematically optimized using the Box–Behnken design. The independent variables investigated were pH (X1), volume of N,P CQDs (X2), and incubation time (X3). The response variable was the quenching efficiency of the N,P CQDs by fexofenadine (QE%) calculated as:| Quenching efficiency (%) = (F0 − F)/F0 × 100 |
2.5. Method validation
The developed method for fexofenadine determination using N,P CQDs was validated following ICH M10 guidelines for bioanalytical method validation.27 Sample preparation involved a straightforward protein precipitation protocol, where acetonitrile (3 mL) was added to rabbit plasma (3 mL), followed by vertexing for 1 min and centrifugation at 10000 rpm for 10 min. The supernatant was collected, evaporated under a gentle nitrogen stream, and reconstituted in 1 mL of water prior to analysis under optimized sensing conditions. Method linearity was established over a concentration range of 0.02–1.5 μg mL−1 for both aqueous solutions and spiked rabbit plasma samples. Calibration curves were constructed by plotting F0/F values against fexofenadine concentrations after mixing appropriate aliquots of standard solutions with the optimized volume of N,P CQDs. The limit of detection (LOD) and limit of quantification (LOQ) were calculated based on the standard deviation of blank measurements (σ) and the calibration curve slope (S), using the equations: LOD = 3.3 σ/S and LOQ = 10 σ/S.
Method accuracy and precision were evaluated using fexofenadine-spiked plasma samples at four concentration levels: LLOQ (0.02 μg mL−1), LQC (0.06 μg mL−1), MQC (0.75 μg mL−1), and HQC (1.25 μg mL−1). Intra-day assessments involved analyzing five replicates at each concentration level on the same day, while inter-day evaluations were conducted over three consecutive days. Method robustness was investigated through deliberate variations in critical parameters, including pH (±0.1 units), N,P CQDs volume (±20 μL), and incubation time (±0.2 min). Matrix effects were thoroughly investigated by analyzing fexofenadine-spiked plasma samples at low, medium, and high concentrations in three different lots of rabbit plasma. The acceptance criteria were set at ±15% for all QC levels and ±20% for LLOQ, following regulatory guidelines.
The method's selectivity was established by evaluating potential interference from pharmaceutical excipients and endogenous plasma components (amino acids, glucose, albumin) at concentrations 10-fold higher than the target analyte. Additionally, the quenching efficiency (QE%) was also assessed in the presence of common metals and anions typically found in biological matrices.
2.6. Application in pharmaceutical analysis and pharmacokinetics
The validated N,P CQDs-based method was applied for the determination of fexofenadine in commercial pharmaceutical formulations. Ten fexofenadine tablets were accurately weighed, finely powdered, and an amount equivalent to 10 mg of fexofenadine was dissolved in 50 mL of distilled water. The solution was sonicated for 10 minutes, filtered through a 0.45 μm syringe filter, and the volume was adjusted to 100 mL with water. Appropriate dilutions were made with water, and the fexofenadine content was determined using the developed method.To evaluate the pharmacokinetic profile of fexofenadine, a study was conducted in albino rabbits (2.5–3.0 kg). The experimental protocols were designed and conducted in compliance with the established guidelines for the humane treatment and care of laboratory animals, and the study was reviewed and approved by the Institutional Ethics Committee at the Faculty of Medicine, Al-Azhar University, Damietta campus, Egypt (Approval No: DFM-IRB00012367-25-02-055). Five rabbits administered a single oral dose of fexofenadine hydrochloride equivalent to 10 mg kg−1 via oral gavage. Blood samples (5 mL) were collected from the marginal ear vein at various time points (0, 1, 3, 6, 12, 24 and 48 hours) after drug administration. Samples were immediately processed, and the resulting plasma was stored at −80 °C until analysis. Fexofenadine levels in the rabbit plasma samples were quantified using the validated N,P CQDs-based fluorescence quenching method. Pharmacokinetic parameters including the maximum plasma concentration (Cmax), time to reach Cmax (Tmax), area under the plasma concentration–time curve (AUC0−t and AUC0−∞), elimination rate constant (k), elimination half-life (t1/2), and mean residence time (MRT) were calculated based on non-compartmental analysis using PK Solver software.28
3. Results and discussion
3.1. Characterization and optical properties of N,P CQDs
The synthesized N,P CQDs were comprehensively characterized using complementary analytical techniques to evaluate their physicochemical and optical properties (Fig. 1). Dynamic light scattering analysis revealed a narrow size distribution with an average hydrodynamic diameter of 2.55 ± 0.54 nm, demonstrating excellent monodispersity of the nanoparticles (Fig. 1A). The sharp, symmetrical peak in the DLS profile suggests uniform particle formation during the hydrothermal synthesis. Transmission electron microscopy imaging confirmed the successful synthesis of well-dispersed, spherical N,P CQDs with sizes consistent with the DLS measurements (Fig. 1B). The TEM micrograph shows discrete dark spots corresponding to individual quantum dots distributed uniformly across the field of view, with minimal aggregation and a scale bar of 10 nm providing clear size reference.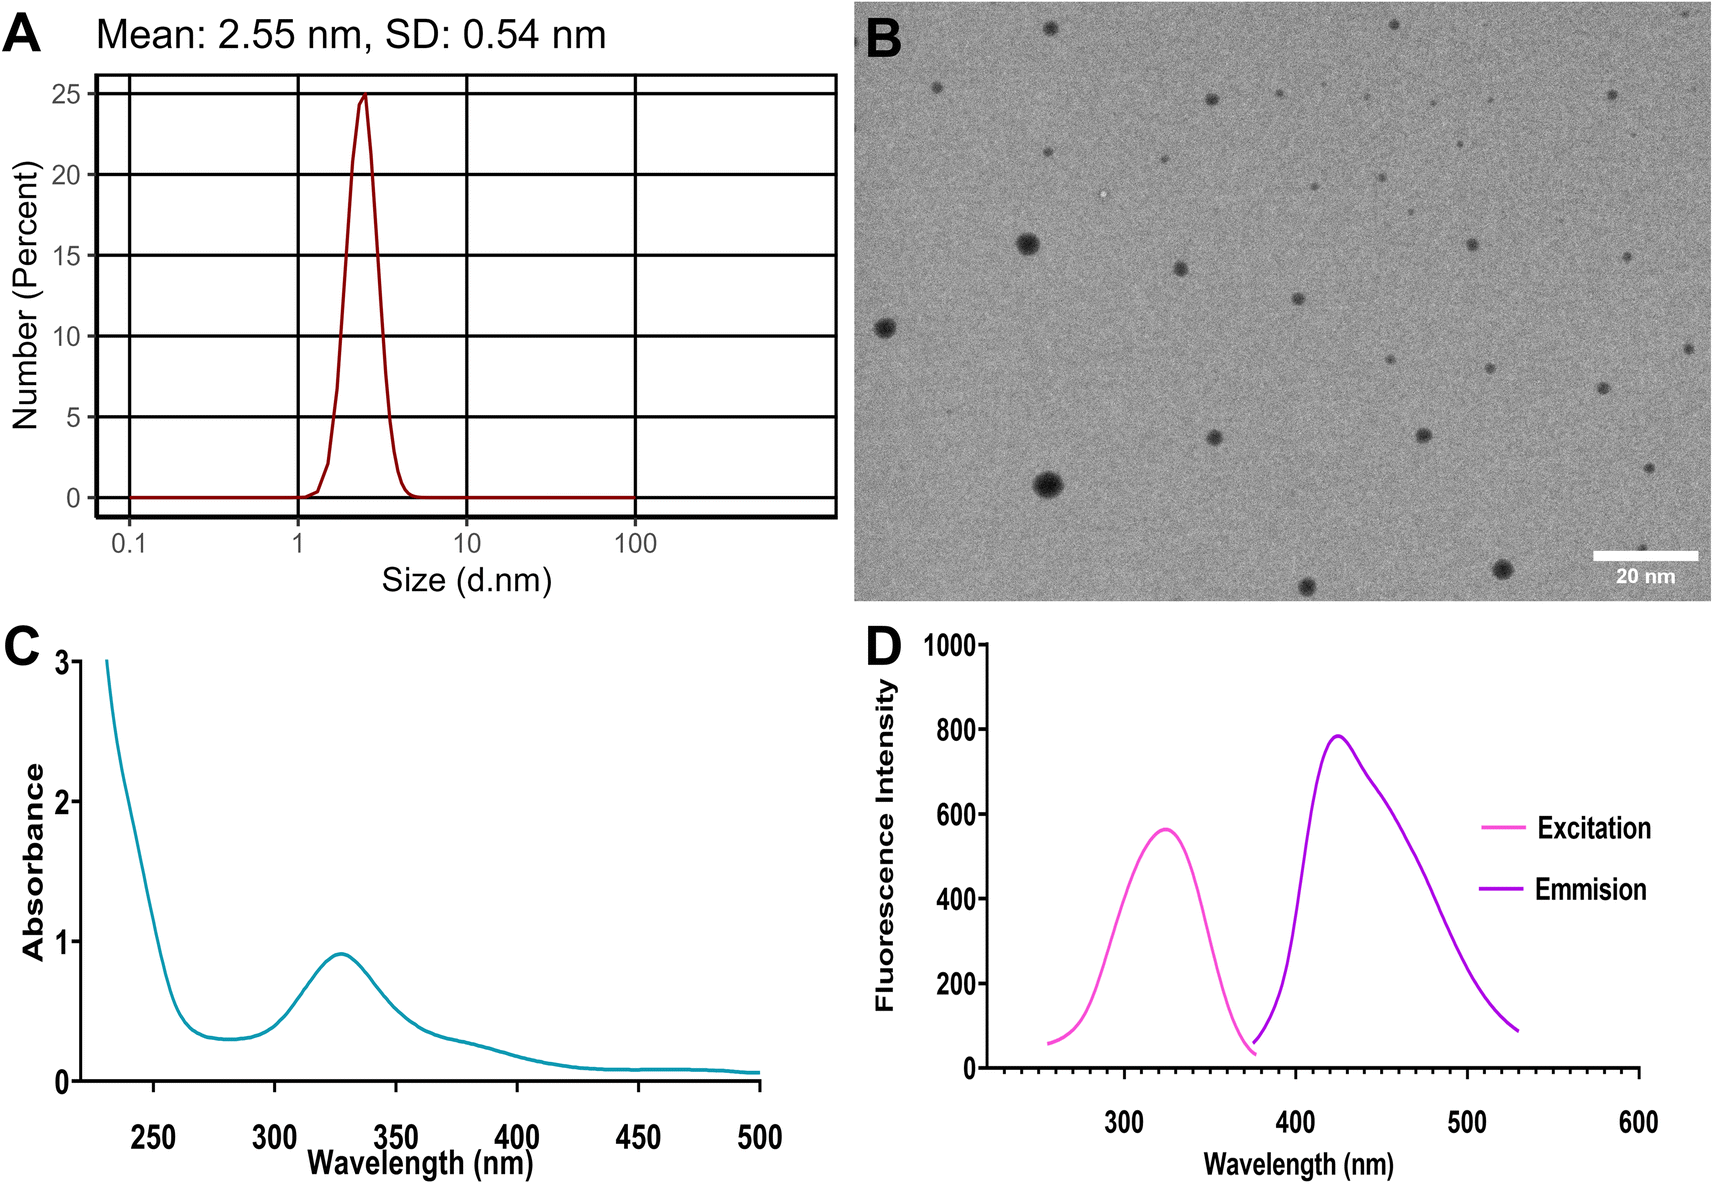 | ||
| Fig. 1 Physicochemical and optical characterization of synthesized N,P-CQDs: (A) dynamic light scattering (DLS) size distribution showing mean diameter of 2.55 ± 0.54 nm, (B) transmission electron microscopy (TEM) image demonstrating spherical morphology and uniform dispersion (scale bar = 10 nm), (C) UV-visible absorption spectrum exhibiting characteristic peak at 327 nm, and (D) fluorescence excitation (λex = 324 nm) and emission (λem = 425 nm) spectra showing strong photoluminescence properties. | ||
The optical properties of the N,P CQDs were investigated through UV-visible absorption and fluorescence spectroscopy. The UV-vis spectrum (Fig. 1C) exhibited a characteristic absorption peak centered at 327 nm, attributed to the n–π* electronic transitions of the C![[double bond, length as m-dash]](https://www.rsc.org/images/entities/char_e001.gif) O bonds, along with a shoulder around 275 nm corresponding to π–π* transitions of the aromatic sp2 domains. The gradual decrease in absorption at longer wavelengths is typical for carbon quantum dots and indicates successful carbonization during synthesis. The fluorescence properties revealed strong photoluminescence with an excitation maximum at 324 nm and a corresponding emission peak at 425 nm (Fig. 1D). The well-defined excitation and emission bands with minimal overlap demonstrate the excellent optical properties of the N,P CQDs. The large Stokes shift of approximately 100 nm between excitation and emission maxima is advantageous for analytical applications as it minimizes self-quenching effects. Quantum yield measurements using quinine sulfate as a reference standard revealed a remarkably high value of 72.3%, indicating successful nitrogen and phosphorus doping that enhanced the fluorescence properties through the creation of new emissive states. These exceptional optical characteristics, combined with uniform size distribution and morphology, make the N,P CQDs highly suitable as fluorescent probes for the sensitive detection of fexofenadine.
O bonds, along with a shoulder around 275 nm corresponding to π–π* transitions of the aromatic sp2 domains. The gradual decrease in absorption at longer wavelengths is typical for carbon quantum dots and indicates successful carbonization during synthesis. The fluorescence properties revealed strong photoluminescence with an excitation maximum at 324 nm and a corresponding emission peak at 425 nm (Fig. 1D). The well-defined excitation and emission bands with minimal overlap demonstrate the excellent optical properties of the N,P CQDs. The large Stokes shift of approximately 100 nm between excitation and emission maxima is advantageous for analytical applications as it minimizes self-quenching effects. Quantum yield measurements using quinine sulfate as a reference standard revealed a remarkably high value of 72.3%, indicating successful nitrogen and phosphorus doping that enhanced the fluorescence properties through the creation of new emissive states. These exceptional optical characteristics, combined with uniform size distribution and morphology, make the N,P CQDs highly suitable as fluorescent probes for the sensitive detection of fexofenadine.
3.2. Fluorescence quenching mechanism
A key aspect of this study was the investigation of the fluorescence quenching mechanism between the N,P CQDs and fexofenadine. Upon addition of increasing concentrations of fexofenadine to the N,P CQD solution, a progressive decrease in fluorescence intensity was observed, indicating an efficient quenching effect (Fig. 2A). Hence, the mechanism of this fluorescence quenching was further elucidated through Stern–Volmer analysis and thermodynamic studies (Table 1). A temperature-depending Stern–Volmer plot was constructed, and a decrease in the slope of the Stern–Volmer plot with increasing temperature suggested that the quenching process was predominantly static in nature (Fig. 2B). The Stern–Volmer constants were calculated at three different temperatures (298, 303, and 308 K) to corroborate the quenching mechanism using the following equation:| F0/F = 1 + Ksv[Q] |
| kq = Ksv/τ0 |
 | ||
| Fig. 2 Fluorescence quenching mechanism study of N,P CQDs by fexofenadine. (A) Fluorescence emission spectra of N,P CQDs with increasing concentrations of fexofenadine (0–1.5 μg mL−1). (B) Stern–Volmer plots at different temperatures (298, 303, and 308 K) showing decreasing slopes with increasing temperature, characteristic of static quenching. (C) UV-visible absorption spectra of N,P CQDs (blue), fexofenadine (red), and their ion pair complex (green) demonstrating ground-state complex formation. | ||
| Temperature (K) | Ksv (106 M−1) | Ka (106 M−1) | ΔG (kJ mol−1) | ΔH (kJ mol−1) | ΔS (J mol−1 K−1) |
|---|---|---|---|---|---|
| 298 | 1.36 | 2.23 | −36.23 | −30.31 | 19.86 |
| 303 | 1.09 | 1.89 | −36.43 | ||
| 308 | 0.95 | 1.50 | −36.43 |
To gain deeper insights into the interaction between N,P CQDs and fexofenadine, UV-vis absorption spectroscopy was employed to investigate ground–state complex formation (Fig. 2C). The absorption spectrum of the N,P CQDs-fexofenadine mixture showed distinct changes compared to the individual spectra of N,P CQDs and fexofenadine alone. The appearance of a new spectral feature in the ion–pair complex spectrum that differs from the simple superposition of individual component spectra provided direct spectroscopic evidence for ground-state complex formation. This observation aligns with the static quenching mechanism proposed from the Stern–Volmer analysis and further supports the conclusion that quenching occurs through the formation of a non-fluorescent ground-state complex rather than through dynamic collisional processes.
Different thermodynamic parameters were calculated to further elucidate the nature of the interaction (Table 1). The van't Hoff plot was constructed (Fig. S1†), and the calculated values of enthalpy change (ΔH° = −30.31 kJ mol−1) and entropy change (ΔS° = 19.86 J mol−1 K−1) suggest that the binding between N,P CQDs and fexofenadine is an exothermic process driven by both enthalpy and entropy. The negative values of Gibbs free energy change indicate the spontaneous nature of the complex formation, with values ranging from −36.23 to −36.43 kJ mol−1. These thermodynamics studies suggest that the interaction between N,P CQDs and fexofenadine is spontaneous, exothermic, and driven by both enthalpy and entropy, typical of static quenching through the formation of a stable ground-state complex. The negative enthalpy change suggests the dominance of hydrogen bonding and electrostatic interactions between the N,P CQDs and fexofenadine. Although the increased entropy of the system seems contradictory despite complex formation, this can be attributed to the release of water molecules from the hydration shells surrounding the N,P CQDs and fexofenadine upon complex formation, leading to an overall increase in the disorder of the system.
To further validate the experimental thermodynamic findings and gain deeper molecular-level insights into the binding mechanism, quantum mechanical calculations using the PM3 semi-empirical method were performed. The PM3 method was selected over density functional theory (DFT) approaches due to the large size of the N,P-CQDs-fexofenadine system and the need to balance computational efficiency with adequate accuracy for non-covalent interaction analysis. For complex biomolecular systems of this scale, semi-empirical methods have been demonstrated to provide reliable structural and energetic information while requiring significantly fewer computational resources than full DFT calculations. The optimized structures of fexofenadine, N,P-CQDs, and their complex are presented in Fig. 3, along with their respective electronic energies.
 | ||
| Fig. 3 Optimized molecular structures from PM3 semi-empirical quantum mechanical calculations showing: (A) fexofenadine molecule with energy of −0.20866 hartree, (B) simplified model of N,P-CQDs with energy of −0.21848 hartree, and (C) optimized complex between fexofenadine and N,P-CQDs with energy of −0.43773 hartree, revealing significant hydrogen bonding interactions at distances of 2.6 Å and 2.9 Å. Atom colors: carbon (gray), hydrogen (white), oxygen (red), nitrogen (blue), and phosphorus (orange). The negative binding energy of −0.0106 hartree (−27.8 kJ mol−1) indicates favorable complex formation, supporting the static quenching mechanism. | ||
In addition, the electronic energy (E) for fexofenadine (−0.20866 hartree), N,P-CQDs (−0.21848 hartree) and their binding complex (−0.43773 hartree) were calculated based on the optimized structures as shown in Fig. 3. The changes in energy (ΔE) associated with the binding of fexofenadine to the N,P-CQDs were calculated according to the following equation:
| ΔE = E(N,P-CQDs-fexofenadine) − E(N,P-CQDs) − E(fexofenadine) = −0.43773 − (−0.21848) − (−0.20866) = −0.0106 hartree |
This negative value indicates a favorable binding between fexofenadine and the N,P-CQDs, corresponding to approximately −27.8 kJ mol−1, which aligns well with the experimentally determined ΔG° values (−36.23 to −36.43 kJ mol−1). The close agreement between computational and experimental binding energies confirms the suitability of the PM3 method for this particular system. The slight difference can be attributed to the inherent parametrization limitations of semi-empirical methods and the simplified model of N,P-CQDs used in the calculations.
The optimized geometry of the complex (Fig. 3C) reveals specific interaction sites that contribute to the binding affinity. Particularly noteworthy are two key hydrogen bonding interactions: one between the hydroxyl group of fexofenadine and a carboxylate oxygen on the N,P-CQDs with a distance of 2.6 Å, and another between a carboxyl group on the N,P-CQDs and a hydroxyl group of fexofenadine with a distance of 2.9 Å. These short interatomic distances are characteristic of strong hydrogen bonds and corroborate the thermodynamic data suggesting the importance of hydrogen bonding in the complex formation. Additionally, in the spatial arrangement of the complex, the tertiary amine group of fexofenadine is positioned favorably for electrostatic interaction with the electron-rich regions of the N,P-CQDs. The aromatic rings of fexofenadine are aligned with the graphitic domains of the quantum dots, facilitating π–π stacking interactions that further stabilize the complex. This computational analysis provides a molecular rationale for the static quenching mechanism observed in the experimental studies, offering a clear explanation for the high binding affinity and selectivity observed in the N,P-CQDs-fexofenadine system.
3.3. Optimization of experimental parameters
Optimization of the experimental parameters affecting the fluorescence quenching process, such as pH, N,P CQDs volume, and incubation time, was carried out using a Box–Behnken experimental design to achieve maximum sensitivity. A total of 17 experimental runs were performed, and the response surface methodology was employed to obtain the optimum conditions (Table S1†). The QE% was selected as the response variable, which represents the analytical sensitivity of the N,P CQDs-fexofenadine system. Second-order polynomial models were developed for the QE% as a function of the three variables, followed by backward elimination to remove insignificant terms. The final regression equation obtained was:| QE% = 64.3991 + 8.96337A + 11.2763B + 16.1039AB − 17.106A2 −8.35054B2 |
ANOVA analysis of the reduced quadratic model confirmed its statistical significance with an F-value of 60.60 and a p-value less than 0.0001 (Table S2†). The model exhibited a high coefficient of determination (R2 = 0.9650) and an adjusted R2 of 0.9490, indicating that the model can explain 96.50% of the total variation in the QE%. The lack of fit test was insignificant, confirming the adequacy of the model to represent the experimental data (Table S2†). Furthermore, the adequate precision ratio of 24.47 indicates an adequate signal, suggesting that the model can be used to navigate the design space. Several diagnostic plots, such as normal probability (Fig. S2†), and predicted vs. actual (Fig. S3†), were examined to validate the model's assumptions. The results demonstrated the good fit of the model to the experimental data. Moreover, the influence of run order effect was found to be negligible (Fig. S4 and S5†), confirming the reliability of the experiments.
The main effect plots (Fig. 4A–C) clearly illustrate how each individual parameter affects the quenching efficiency. For pH (Fig. 4A), a pronounced quadratic relationship is observed, with QE% increasing from pH 5.0, reaching a maximum at approximately pH 8.8, and then slightly decreasing at higher pH values. This pattern is attributed to the optimal ionization state of both the N,P CQDs surface functional groups and the fexofenadine molecule at slightly alkaline conditions. Similarly, the N,P CQDs volume (Fig. 4B) shows a positive effect on QE% up to approximately 0.85 mL, after which the effect plateaus, likely due to reaching saturation in the quantum dot–analyte interaction. In contrast, incubation time (Fig. 4C) shows a remarkably flat profile across the entire range (1–10 min), indicating that equilibrium between N,P CQDs and fexofenadine is achieved rapidly, which is advantageous for developing a rapid analytical method.
 | ||
| Fig. 4 Main effect plots from Box–Behnken optimization showing the influence of individual parameters on the quenching efficiency (QE%) of N,P CQDs by fexofenadine: (A) effect of pH demonstrating optimal response at approximately pH 8.8 with significant quadratic relationship; (B) effect of N,P CQDs volume (mL) showing optimal response around 0.85 mL of 1 mg per mL N,P CQDs solution; (C) effect of incubation time (min) indicating rapid equilibrium with minimal influence across the studied range (1–10 min). Experiments conducted with fexofenadine concentration of 1.0 μg mL−1 under controlled conditions. | ||
Moving from individual parameter effects to their interactions, Fig. 5A presents the interaction plot between pH and N,P CQDs volume, revealing a strong synergistic effect. At low pH (5.0, black line), the effect of increasing N,P CQDs volume is minimal, while at higher pH values (10.0, red line), increasing the N,P CQDs volume substantially enhances the quenching efficiency. This synergistic effect can be attributed to the increased ionization of the carboxyl groups on the N,P CQDs surface at higher pH, enhancing the electrostatic interaction with the protonated tertiary amine group of fexofenadine. Considering that the pKa of fexofenadine is approximately 9.53, at slightly alkaline pH, the optimal balance between N,P CQDs surface charge and fexofenadine ionization state is achieved, favoring the formation of a stable complex. To better visualize this complex interaction, a 3D response surface plot was generated (Fig. 5B), which comprehensively illustrates the combined effects of pH and N,P CQDs volume on the quenching efficiency. The 3D plot shows a clear nonlinear relationship with a well-defined optimal region where maximum QE% is achieved. This visualization makes it apparent that both parameters must be carefully controlled to achieve maximum analytical sensitivity, with the highest QE% values occurring in the region of pH 8.5–9.0 and N,P CQDs volume 0.8–0.9 mL.
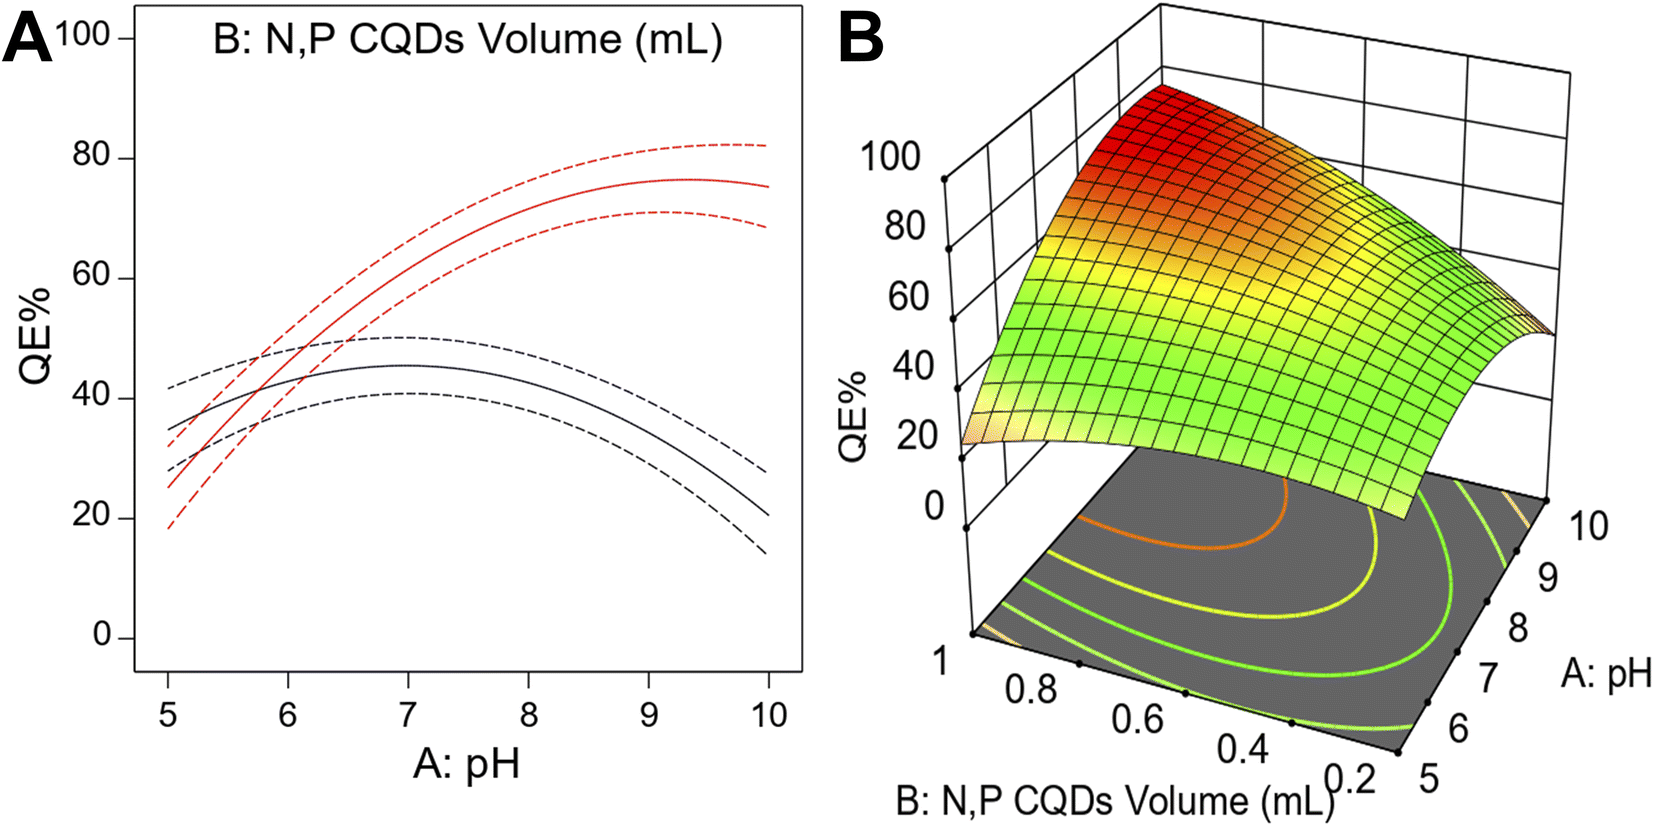 | ||
| Fig. 5 Advanced visualization of parameter interactions in the N,P CQDs-fexofenadine system: (A) interaction plot demonstrating the synergistic effect between pH and N,P CQDs volume at different pH values (5.0, 7.5, and 10.0), with enhanced quenching efficiency observed at higher pH and increased N,P CQDs volume; (B) 3D response surface plot illustrating the combined effects of pH and N,P CQDs volume on quenching efficiency (QE%), revealing the optimal region (pH 8.5–9.0, N,P CQDs volume 0.8–0.9 mL) that maximizes the analytical sensitivity of the method. | ||
Based on these comprehensive analyses, desirability function analysis was used to determine the specific optimal conditions that maximize the QE% while keeping the N,P CQDs volume and pH within practical limits (Fig. S6†). Since the incubation time did not have a significant effect, it was minimized to allow rapid analysis. The optimal conditions were determined to be pH 8.8, N,P CQDs volume of 0.85 mL, and incubation time of 1.5 min, which resulted in a maximum QE% of 73.4% for 1 μg per mL fexofenadine. These optimized conditions were subsequently used for all analytical performance evaluations, providing the foundation for a sensitive, rapid, and reliable analytical method for fexofenadine determination.
3.4. Validation of the analytical method
The analytical performance of the developed N,P CQDs-based fluorescence quenching method for fexofenadine determination was evaluated according to the ICH M10 guidelines for bioanalytical method validation. The linearity of the method was assessed by constructing a calibration curve in the concentration range of 0.02–1.5 μg per mL fexofenadine. The calibration curve exhibited excellent linearity with a coefficient of determination (R2) of 0.9998 (Table 2). The regression equation was Y = 2.5185X + 1.1368, where Y is F0/F and X is the fexofenadine concentration in μg mL−1. The limit of detection and limit of quantification were calculated to be 0.0058 μg mL−1 and 0.0173 μg mL−1, respectively, indicating the high sensitivity of the proposed method (Table 2). When compared to previously reported methods based on UV-vis spectrophotometry and HPLC-UV6,7 for fexofenadine determination, the current method demonstrated significantly improved sensitivity. Comparable LOD and LOQ values have only been achieved using sophisticated techniques like LC-MS/MS, which are not readily available in most pharmaceutical laboratories in resources limited settings.| Parameter | Fexofenadine |
|---|---|
| Linearity range (μg mL−1) | 0.02–1.5 |
| Intercept (a) | 1.1368 |
| Slope (b) | 2.5185 |
| Coefficient of determination (r2) | 0.9998 |
| SE of intercept (Sa) | 0.0108 |
| SE of slope (Sb) | 0.0150 |
| SD of residuals | 0.0044 |
| LOD (μg mL−1) | 0.0058 |
| LOQ (μg mL−1) | 0.0173 |
The accuracy and precision of the method were evaluated by spiking fexofenadine at four different concentration levels (0.02, 0.06, 0.75, and 1.25 μg mL−1) in rabbit plasma (n = 5). The intra-day and inter-day accuracy ranged from 96.39% to 103.86% and 97.81% to 103.02%, respectively, demonstrating excellent accuracy (Table S3†). The intra-day and inter-day precision, expressed as the relative standard deviation, were less than 3.57% and 3.69%, respectively, meeting the ICH acceptance criteria of ≤15% (Table S3†). The method also exhibited good robustness, as evidenced by the recovery values of 97.22% to 102.63% when the critical parameters like pH, N,P CQDs volume, and incubation time were deliberately varied within the optimal range (Table S4†).
Furthermore, the selectivity of the method was evaluated by assessing the interference from common drug excipients, metabolites, and endogenous compounds in rabbit plasma (Fig. 6). The QE% of the interfering compounds were less than 5% of the QE% of fexofenadine even at 10-fold higher concentrations, indicating the high selectivity of the proposed method. To further validate the N,P-CQDs system's response characteristics, control experiments were conducted with well-established fluorescence quenchers. Heavy metal ions including Fe3+ and Cu2+, known to strongly quench fluorescence through electron or energy transfer processes, were tested. These metal ions demonstrated significant quenching effects on the N,P-CQDs, with quenching efficiencies of 45% and 38% for Fe3+ and Cu2+, respectively, at concentrations of μg mL−1. However, 0.5 mM EDTA effectively masked the interference from Fe3+ and Cu2+ without affecting the fexofenadine-induced quenching response. This approach ensured the method's selectivity even in samples containing these potential interferents. The matrix effect was evaluated by spiking fexofenadine at low, medium, and high concentrations in 3 different batches of rabbit plasma (Table S4†). The accuracy and precision ranged from 95.55% to 102.70% and 1.29% to 3.89%, respectively, confirming the absence of significant matrix effects.
 | ||
| Fig. 6 Selectivity study showing the quenching efficiency (QE%) of fexofenadine and potential interfering substances in rabbit plasma. Fexofenadine (1.0 μg mL−1) demonstrates high quenching efficiency (74%), while potential interferents tested at 10-fold higher concentrations show minimal effect (<5%). Fe3+ and Cu2+ exhibit significant quenching but show minimal interference after treatment with 0.5 mM EDTA, demonstrating effective masking of these known fluorescence quenchers without affecting fexofenadine response. Error bars represent standard deviation (n = 3). | ||
3.5. Pharmaceutical application
The developed N,P CQDs-based fluorescence quenching method was successfully applied for the determination of fexofenadine in pharmaceutical formulations. The recovery of fexofenadine from commercial tablets was found to be 99.96 ± 1.081% of the labeled claim, demonstrating the reliability of the method for routine quality control of fexofenadine drug products (Table 3). The results were in good agreement with those obtained using a reported HPLC-UV method7 with a mean recovery of 100.33 ± 0.793%. Statistical comparison using Student's t-test showed no significant difference between the two methods (P = 0.558), further confirming the accuracy of the proposed method (Table 3). Additionally, F-test revealed no significant difference in the precision of the two methods (P = 0.564) (Table 3). Interval hypothesis testing was then performed to determine the extent of equivalence between the two analytical methods. The calculated θL (−1.750) and θU (1.015) values were within the acceptance criteria of ±2%, indicating that the two methods are equivalent for the determination of fexofenadine in pharmaceutical formulations (Table 3).| Method | Meana | SD | t-Test (2.306)b | P value | F-Value (6.338)b | P value | θLc | θUc |
|---|---|---|---|---|---|---|---|---|
| a Average of five determinations.b The values in parenthesis are tabulated values of “t” and “F” at (P = 0.05).c Bias of ±2% is acceptable. | ||||||||
| Developed method | 99.96 | 1.081 | 0.613 | 0.558 | 1.856 | 0.564 | −1.750 | 1.015 |
| Reported method | 100.33 | 0.793 | ||||||
3.6. Pharmacokinetic application
The plasma concentration–time profile (Fig. 7) and pharmacokinetic parameters of fexofenadine following oral administration to rabbits were investigated using the developed N,P-CQDs fluorescent probe method (Table 4). After a single oral dose of 10 mg kg−1, fexofenadine exhibited a mean maximum plasma concentration (Cmax) of 344 ± 84 ng mL−1 achieved at 3.6 ± 1.3 h (Tmax). The drug was characterized by moderate elimination with a mean half-life (t1/2) of 12.5 ± 1.3 h and elimination rate constant (λz) of 0.06 ± 0.01 h−1. The extent of drug exposure was determined by mean AUC0→t and AUC0→∞ values of 6018 ± 1116 and 6495 ± 1174 ng·h mL−1, respectively, with a mean residence time (MRT) of 15.5 ± 1.3 h. | ||
| Fig. 7 Mean plasma concentration–time profile of fexofenadine following oral administration (10 mg kg−1) to rabbits (n = 5). Data points represent mean ± SD. | ||
| Parameters | Mean values | (CV%) |
|---|---|---|
| Cmax (ng mL−1) | 344 | 24.31 |
| Tmax (h) | 3.6 | 37.27 |
| t1/2 (h) | 12.5 | 10.35 |
| λz (h) | 0.06 | 11.71 |
| AUC0→t (ng mL−1 h−1) | 6018 | 18.55 |
| AUC0→∞ (ng mL−1 h−1) | 6495 | 18.08 |
| MRT0-inf_obs (h) | 15.5 | 8.40 |
When compared with previously published data, the observed Tmax was found to be longer than values reported in human studies (0.83–1.33 h). This difference can be attributed to interspecies variations in gastrointestinal motility and P-glycoprotein (P-gp)-mediated efflux, which are known to slow absorption in rabbits.29 The Cmax was determined to be lower than values reported in humans at therapeutic doses (200–400 ng mL−1 at 120 mg), which may be explained by higher metabolic clearance in rabbits or differences in formulation bioavailability.5
Comparative analysis with previous literature revealed that the t1/2 (12.5 h) closely matches human data (∼14 h), suggesting similar elimination mechanisms primarily through renal excretion and P-gp-mediated transport.30 The AUC0→∞ (6495 ng·h mL−1) demonstrated proportional differences when compared to human studies after dose adjustment [5]. Relatively high interindividual variability was observed in Cmax (CV% = 24.3) and Tmax (CV% = 37.3), which is characteristic of fexofenadine's disposition. This variability can be attributed to the significant influence of drug transporters such as P-gp and OATP on fexofenadine pharmacokinetics, contributing to the documented variability in its oral bioavailability.
Based on these pharmacokinetic findings, the successful application of the N,P-CQDs-based fluorescence quenching method for the quantitative determination of fexofenadine in rabbit plasma was demonstrated, establishing its suitability for pharmacokinetic studies. It should be noted that cross-validation with a reference bioanalytical method such as LC-MS/MS would further strengthen the reliability of the developed method, an approach that will be implemented in future investigations.
3.7. Comparative analysis of greenness and blueness of the developed method
The environmental impact and practical applicability of the developed N,P CQDs-based method was comprehensively evaluated using three complementary assessment tools: AGREE, MOGAPI and BAGI (Table 5). These assessments were compared with conventional HPLC-UV7 and UPLC-MS/MS10 methods for fexofenadine determination to provide a holistic evaluation of the method's sustainability and practicality.


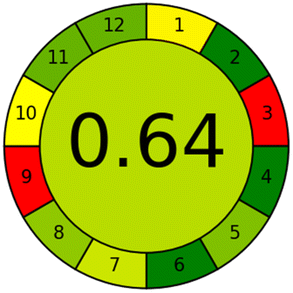


The AGREE assessment demonstrated that the N,P CQDs-based method achieved a greenness score of 0.78, significantly higher than HPLC-UV (0.65) and UPLC-MS/MS (0.64) (Table 5). This superior performance can be attributed to several factors: minimal solvent consumption (only using acetonitrile for protein precipitation), reduced energy requirements due to room temperature operation, absence of complex sample preparation steps, and elimination of toxic mobile phases typically associated with chromatographic methods. When examining individual AGREE criteria, our method scored particularly well in the categories of reagent toxicity, energy consumption, and waste generation. The primary contribution to point deduction came from the necessity of using acetonitrile for sample preparation, though this impact was minimal compared to the extensive solvent requirements of chromatographic methods.
The MOGAPI evaluation yielded scores of 78, 70, and 70 for the N,P CQDs method, HPLC-UV, and UPLC-MS/MS, respectively (Table 5). The pentagram analysis revealed predominantly green and yellow sections for the N,P CQDs method, particularly in the areas of reagent consumption, energy usage, and waste generation. Notable strengths included the use of water as the primary analysis medium, and minimal waste generation. The chromatographic methods showed more red sections, especially in terms of solvent consumption and energy requirements for maintaining high pressures.
BAGI assessment provided a comprehensive evaluation of practical applicability, revealing that our method achieved a score of 77.5, which was comparatively lower than both UPLC-MS/MS (82.5) and HPLC-UV (80.0) (Table 5). This lower score primarily reflected limitations in two key aspects: the method's single-analyte determination capability and its manual operational nature. Unlike UPLC-MS/MS and HPLC-UV systems, which offer automated sample injection and multi-analyte analysis capabilities, our fluorescence-based method requires manual sample handling and can only determine fexofenadine specifically. Nevertheless, the method demonstrated strong performance in other practical aspects, including rapid analysis time, simple sample preparation, cost-effectiveness of reagents and instrumentation, and minimal maintenance requirements. The combined assessment using these three tools demonstrates that while our N,P CQDs-based method may have certain practical limitations compared to well-established chromatographic techniques, it offers a more environmentally sustainable approach with acceptable practical applicability for routine pharmaceutical analysis and pharmacokinetic studies, particularly in laboratories where resource availability might limit the use of more sophisticated instrumentation.
3.8. Analytical performance compared to reported methods
The analytical performance of the developed N,P-CQDs based fluorescence quenching method was compared with previously reported methods for fexofenadine determination (Table S6†). A comprehensive evaluation of various chromatographic, spectroscopic, and electrochemical techniques was conducted to highlight the relative merits of the current approach.Excellent sensitivity was demonstrated by the present method with an LOD of 6 ng mL−1 and an LOQ of 17 ng mL−1, which was found to be significantly superior to conventional HPLC-UV methods (LOD: 1.64 μg mL−1) and comparable to more sophisticated techniques such as HPLC with fluorescence detection (LOD: 1 ng mL−1). While slightly better sensitivity was offered by UPLC-MS/MS (LOD: 0.25 ng mL−1), the current method provides a more accessible alternative without the requirement for expensive instrumentation. Better sensitivity than potentiometric methods using carbon paste electrodes (LOD: 9 ng mL−1) and synchronous spectrofluorimetry (LOD: 24 ng mL−1) was also observed, while comparable sensitivity to silver nanoparticle-based fluorescence quenching (LOD: 5.4 ng mL−1) was achieved.
A significant advantage of the present method is its rapid analysis time (1.5 min), which was determined to be considerably shorter than HPLC-UV (>10 min), HPLC-fluorescence (∼17 min), and even UPLC-MS/MS (4 min). This rapid analysis capability, combined with simple sample preparation and room temperature reaction conditions, makes the method particularly suitable for high-throughput analyses. Furthermore, unlike the silver nanoparticle-based method where complex synthesis procedures are required and environmental concerns due to potential silver toxicity are raised, the N,P-CQDs are synthesized from environmentally benign precursors through a green approach.
The linear range of the developed method (0.02–1.5 μg mL−1) was found to be appropriate for pharmaceutical analysis and pharmacokinetic studies, covering concentrations typically encountered in biological samples after therapeutic doses. While wider linear ranges are offered by some methods such as HPLC-UV (20–70 μg mL−1) and potentiometric methods (2.28–4569 μg mL−1), these approaches lack the sensitivity required for bioanalytical applications. Conversely, highly sensitive techniques like UPLC-MS/MS provide excellent sensitivity but at significantly higher operational costs and environmental impact.
The N,P-CQDs fluorescence quenching method represents an effective analytical solution for fexofenadine determination, balancing analytical performance, operational simplicity, and environmental considerations. The method is particularly well-suited for routine pharmaceutical analysis and pharmacokinetic applications in resource-limited settings where advanced instrumentation might be unavailable.
4. Conclusion
The present work described the development and application of a highly sensitive and selective fluorescence quenching method for the determination of fexofenadine using N,P CQDs as a fluorescent probe. Characterization of the N,P CQDs revealed their suitable morphological and optical properties for use as an analytical sensor with excitation and emission maxima at 324 and 425 nm, respectively. Upon interaction with fexofenadine, the fluorescence of the N,P CQDs was quenched through a static quenching mechanism, which was optimized using a Box–Behnken design. The proposed method demonstrated excellent analytical performance in terms of linearity (R2 > 0.999), sensitivity (LOD 0.0058 μg mL−1), accuracy (recovery 96.39% to 103.86%), and precision (RSD < 4%) in compliance with ICH M10 guidelines. Notably, the method was successfully applied for the determination of fexofenadine in pharmaceutical formulations and pharmacokinetic studies in rabbit plasma revealing comparable pharmacokinetic parameters to previous literature reports. Comprehensive evaluation of the method's greenness and practicality using AGREE, MOGAPI and BAGI tools demonstrated its superior environmental sustainability and acceptable practical applicability compared to conventional HPLC-UV and UPLC-MS/MS techniques. Hence, the developed N,P CQDs-based fluorescence quenching method provides a sensitive, selective, rapid, and environmentally friendly approach for the quantification of fexofenadine in pharmaceutical and bioanalytical applications. Such green analytical techniques hold great promise for broader implementation in the pharmaceutical industry, contributing to more sustainable analytical practices.Future work will focus on the development of automated sample handling systems compatible with this fluorescence-based approach to address the current limitation of manual operation, potentially increasing sample throughput and reducing operator variability. Cross-validation with reference LC-MS/MS methods will be undertaken to further establish the reliability of the N,P-CQDs method for bioanalytical applications. Furthermore, the integration of these fluorescent nanoprobes into portable, low-cost analytical devices presents an intriguing avenue for point-of-care therapeutic drug monitoring in clinical settings. The applicability of similar N,P-CQDs systems for other pharmaceuticals will also be explored, potentially establishing a versatile platform for bioanalytical applications. Overall, the developed N,P-CQDs-based fluorescence quenching method provides a sensitive, selective, rapid, and environmentally friendly approach for the quantification of fexofenadine in pharmaceutical and bioanalytical applications. Such green analytical techniques hold great promise for broader implementation in the pharmaceutical industry, contributing to more sustainable analytical practices.
Data availability
The authors confirm that the data supporting the findings of this study are available within the article and its ESI file.†Conflicts of interest
There are no conflicts to declare.Acknowledgements
The authors extend their appreciation to the Deanship of Research and Graduate Studies at King Khalid University for funding this work through Large Research Project under grant number RGP2/384/46.References
- I. J. Ansotegui, J. Bousquet, G. W. Canonica, P. Demoly, R. M. Gómez, E. O. Meltzer, M. Murrieta-Aguttes, R. M. Naclerio, N. Rosario Filho and G. K. Scadding, Curr. Med. Res. Opin., 2024, 40, 1297–1309 CrossRef CAS PubMed.
- R. Chaudhari, S. Gosavi, P. Bornare, S. Sonawane and T. Ahire, Anti-Inflammatory Anti-Allergy Agents Med. Chem., 2023, 22, 220–229 CrossRef CAS PubMed.
- M. Molimard, B. Diquet and M. S. Benedetti, Fund. Clin. Pharmacol., 2004, 18, 399–411 Search PubMed.
- M. Elmeliegy, M. Vourvahis, C. Guo and D. D. Wang, Clin. Pharmacokinet., 2020, 59, 699–714 CrossRef CAS PubMed.
- M. Batool, A. Zamir, F. Alqahtani, T. Ahmad, H. Saeed and M. F. Rasool, Pharmaceutics, 2024, 16, 1619 CrossRef CAS PubMed.
- T. Radhakrishna and G. Om Reddy, J. Pharm. Biomed. Anal., 2002, 29, 681–690 CrossRef CAS PubMed.
- I. O. A. Reid, Pharm. Chem. J., 2023, 56, 1426–1432 CrossRef CAS.
- T. Uno, N. Yasui-Furukori, T. Takahata, K. Sugawara and T. Tateishi, J. Pharm. Biomed. Anal., 2004, 35, 937–942 CrossRef CAS PubMed.
- E. A. Ö. İşleyen, T. Özden, S. Özilhan and S. Toptan, Chromatographia, 2007, 66, 109–113 CrossRef.
- R. E. West, J. Zhang, M. S. Joy and T. D. Nolin, J. Pharm. Biomed. Anal., 2024, 245, 116179 CrossRef CAS PubMed.
- D. Guo, J. Zou, Y. Zhu, S. Lou, H. Fan and Q. Qin, Biomed. Chromatogr., 2010, 24, 335–341 CrossRef CAS PubMed.
- A. A. Sakur, D. Nashed and I. Noureldin, Talanta Open, 2022, 5, 100116 CrossRef.
- A. M. Abass, O. S. Hassan, A. Rikabi, H. T. Salim and A. Ahmed, Egypt. J. Chem., 2021, 64, 6293–6300 Search PubMed.
- S. Ramzy, A. H. Abdelazim and M. A. Hasan, BMC Chem., 2022, 16, 62 CrossRef CAS PubMed.
- Z. A. Alothman, N. Bukhari, S. Haider, S. M. Wabaidur and A. A. Alwarthan, Arabian J. Chem., 2010, 3, 251–255 CrossRef CAS.
- Y. Wang and A. Hu, J. Mater. Chem. C, 2014, 2, 6921–6939 RSC.
- S. Miao, K. Liang, J. Zhu, B. Yang, D. Zhao and B. Kong, Nano Today, 2020, 33, 100879 CrossRef CAS.
- F. Wang, Y. Zhang, H. Li, W. Gong, J. Han, S. Jiang, D. Li and Z. Yao, Food Chem., 2025, 463, 141122 CrossRef CAS PubMed.
- C. Verma, S. Dubey, A. Alfantazi and K. Y. Rhee, J. Ind. Eng. Chem., 2024, 133, 90–111 CrossRef CAS.
- A. Alqahtani, T. Alqahtani, A. A. Fatease, A. Alshehri and A. A. Almrasy, Spectrochim. Acta, Part A, 2025, 332, 125820 CrossRef CAS PubMed.
- J. Song, J. Li, Z. Guo, W. Liu, Q. Ma, F. Feng and C. Dong, RSC Adv., 2017, 7, 12827–12834 RSC.
- S. M. Abd Elhaleem, F. Elsebaei, S. Shalan and F. Belal, Spectrochim. Acta, Part A, 2022, 272, 120954 CrossRef CAS PubMed.
- V. K. Singh, V. Singh, P. K. Yadav, S. Chandra, D. Bano, V. Kumar, B. Koch, M. Talat and S. H. Hasan, New J. Chem., 2018, 42, 12990–12997 RSC.
- F. Pena-Pereira, W. Wojnowski and M. Tobiszewski, Anal. Chem., 2020, 92, 10076–10082 CrossRef CAS PubMed.
- F. R. Mansour, J. Płotka-Wasylka and M. Locatelli, Analytica, 2024, 5, 451–457 CrossRef.
- N. Manousi, W. Wojnowski, J. Płotka-Wasylka and V. Samanidou, Green Chem., 2023, 25, 7598–7604 RSC.
- I. Guideline, ICH Harmonised Guideline, Geneva, Switzerland, 2022 Search PubMed.
- Y. Zhang, M. Huo, J. Zhou and S. Xie, Comput. Methods Progr. Biomed., 2010, 99, 306–314 CrossRef PubMed.
- T. Russell, M. Stoltz and S. Weir, Clin. Pharmacol. Therapeut., 1998, 64, 612–621 CrossRef CAS PubMed.
- S. M. Smith and J. G. Gums, Expert Opin. Drug Metab. Toxicol., 2009, 5, 813–822 CrossRef CAS PubMed.
Footnote |
| † Electronic supplementary information (ESI) available. See DOI: https://doi.org/10.1039/d5ra01920f |
| This journal is © The Royal Society of Chemistry 2025 |