
 Open Access Article
 This Open Access Article is licensed under a Creative Commons Attribution-Non Commercial 3.0 Unported Licence
Study of diclofenac distribution in aqueous two-phase PEG/salt/water systems†
Diana Esmeralda Martínez-Rodríguez a,
Edgar Daniel Martínez-Rodríguezbc,
Liliana Hernández-Peralesa,
María del Pilar González-Muñoza and
Mario Avila-Rodriguez*a
a,
Edgar Daniel Martínez-Rodríguezbc,
Liliana Hernández-Peralesa,
María del Pilar González-Muñoza and
Mario Avila-Rodriguez*a
aDepartamento de Química, División de Ciencias Naturales y Exactas, Universidad de Guanajuato, Cerro de la Venada S/N, Pueblito de Rocha, 36040 Guanajuato, Mexico. E-mail: avilam@ugto.mx
bSecretaría de Ciencia, Humanidades, Tecnologías e Innovación (SECIHTI), Mexico City, 03940, Mexico
cCentro de Investigación en Matemáticas, CIMAT, 36023 Guanajuato, Mexico
First published on 23rd June 2025
Abstract
Diclofenac is a nonsteroidal anti-inflammatory drug (NSAID). Due to its extensive use, it has been detected in various environmental compartments, where it has been shown to exert adverse effects on living organisms. This underscores the need to develop efficient and environmentally benign removal strategies. Aqueous Two-Phase Systems (ATPS) offer a promising alternative for liquid–liquid extraction without the use of organic solvents, providing a sustainable separation technique. This study evaluated the effectiveness of diclofenac extraction using ATPS. Results demonstrated that, at low drug concentrations (10 ppm), extraction yields exceeded 95% across all systems tested, regardless of whether the pH values were above or below the pKa of diclofenac. The ATPS composed of polyethylene glycol (PEG) 1000 g mol−1 at 25.5% w w−1 and sodium citrate at 21.5% w w−1 was identified as the most efficient, achieving an extraction efficiency of up to 99.9% and minimal mass transfer of PEG and salt between phases. UV-Vis spectroscopy analysis suggests that the drug's phase transfer occurs via hydrogen bond formation between diclofenac and PEG. The proposed method exhibits high efficiency for diclofenac recovery and stands out for its low environmental impact.
1 Introduction
Emerging pollutants are defined as compounds that are not currently regulated by any environmental legislation. Due to the lack of regulation, their potential harmful effects on the environment and living organisms remain largely unknown.1 Among the pharmaceutical residues most frequently detected in aquatic environments are carbamazepine and diclofenac, with estimated global annual consumption of 1014 and 940 tons, respectively.2Diclofenac (2-(2,6-dichloroanilino)phenylacetic acid) (DFC) (Fig. 1), is a nonsteroidal anti-inflammatory drug (NSAID) with a water solubility of 2.37 mg L−1 (25 °C) and a dissociation constant (pKa) of 4.15.3
 | ||
| Fig. 1 Chemical structure of diclofenac. | ||
DFC is used therapeutically as an analgesic, antipyretic, and anti-inflammatory agent4 and it has also been shown to possess angiogenic activity.5 The drug is available in oral, intramuscular, and topical formulations, most of which are over-the-counter and relatively inexpensive,4 contributing to its widespread use as one of the most commonly used anti-inflammatory drugs worldwide. However, prolonged administration of DFC has been associated with hepatotoxicity, nephrotoxicity, and an increased risk of myocardial infarction.4,6 Moreover, DFC metabolites have been shown to exhibit greater toxicity than the parent compound.2 Environmental compartments in which these pollutants are most frequently detected include surface water, groundwater, drinking water, seawater, wastewater, soil, sediments, suspended solids, sludge from wastewater treatment plants, and leachates.7 These compounds have also been detected in various species, including aquatic animals, mammals, birds, fruits, and plant leaves.7 Given their potential adverse health effects8 and environmental impact, the development of new methods for detecting and evaluating remediation or elimination strategies for DFC and other pollutants is essential.
An efficient and environmentally friendly alternative for drug recovery is the use of Aqueous Two-Phase Systems (ATPS), which retain the advantages of conventional Liquid–Liquid Extraction (LLE) while eliminating the use of organic solvents with high vapor pressure. ATPS operate based on the differential partitioning of solutes within a two-phase system composed predominantly of water (70–90%, depending on the type of system).9 These systems are formed by mixing two water-soluble components, which, upon reaching equilibrium, separate into two immiscible aqueous phases.
A wide range of ATPS types is currently available, including polymer/polymer (of different chemical nature), polymer/salt, and systems incorporating ionic liquids, copolymers, or deep eutectic solvents. ATPS are highly versatile and have been successfully employed for the partitioning of metal ions, drugs, nanomaterials, and metabolites, among other compounds.10,11 Specifically, this technique has been used for the recovery, separation, and concentration of roxithromycin,12 sulfonamides,13 and tetracycline14 from water samples, animal-derived food products, and plant matrices. These systems are also being explored for future applications in the manufacturing of biopharmaceuticals15 and the removal of pharmaceutical contaminants from water samples.16 Furthermore, due to their concentration effect, ATPS can enhance the detection and recovery of drug residues in water bodies, even at trace levels (i.e., emerging pollutants).
Various applications of ATPS have been explored in the pharmaceutical industry, owing to their high capacity to efficiently and selectively separate, purify, and concentrate solutes in a mild environment, facilitated by the use of low-toxicity compounds and their predominantly aqueous composition. Table 1 presents several examples of these applications. These systems represent a key tool in drug development, pharmaceutical biotechnology, and biological therapies. Although this review is not exhaustive, it provides a clear overview of the potential applications of ATPS in this field.
| Application | Advantage | Examples | Reference |
|---|---|---|---|
| Purification of proteins and enzymes | Efficient separation | Purification of therapeutic proteins such as insulin, interferons, or monoclonal antibodies | 17 |
| High recovery | |||
| Preservation of biological activity | |||
| Extraction of antibiotics and metabolites | Improved recovery of natural products from fermentation broths | Penicillin separation | 18 |
| Separation and isolation of cells | Gentle process that maintains cell viability | Separation of stem cells, immunological cells, and bacteria | 19 |
| Design of controlled extraction systems, microencapsulation, and product stability | ATPS can be designed for drug encapsulation or controlled release. Microencapsulation of pharmaceutical compounds improves stability and shelf life | Hydrogels and polymersomes | 20 |
| Formulation of micro/nanoparticles | |||
| Extraction and purification of DNA and RNA | Useful for isolating genetic material in diagnostic or gene therapy processes | Plasmid DNA | 21 |
Despite the promising laboratory results, the industrial application of ATPS faces technical, economic, and operational limitations. Key challenges include process scalability, high material costs, and the need for additional downstream treatments to recover the target compound. The use of copolymers or ionic liquids, while sometimes effective, may compromise the sustainability of the process due to their toxicity and cost.
From a process engineering perspective, optimizing phase stability, separation kinetics, and partitioning efficiency is essential. Process design, variable control, and compliance with stringent regulations—particularly in the pharmaceutical and food industries—must also be carefully addressed.
Nevertheless, the advantages of ATPS—such as low energy consumption, biocompatibility, high selectivity, and phase reusability—support their development as a green technology. Successful scale-up examples and potential long-term cost savings further strengthen their promise for sustainable pharmaceutical and environmental applications.
In the existing literature on DFC extraction using ATPS, only two studies have explored this application, and none have investigated the specific system evaluated in the present study. Ahsaie et al.22 reported the use of ATPS composed of various copolymers and dextran, achieving extraction efficiencies between 39% and 99.6%, depending on the system composition and operational conditions. The authors attributed the preferential partitioning of DFC into the top phase to its hydrophobic nature and the higher hydrophobicity of the copolymer-rich phase. Priyanka et al.23 employed ATPS based on ionic liquids—both mono- and dicationic species derived from imidazolium, pyrrolidinium, morpholinium, and ammonium (with bromide as the common anion) combined with potassium salts. Reported extraction efficiencies ranged from 80% to 100%, depending on the ATPS conformation. The authors concluded that systems maintaining either acidic or alkaline conditions achieved high extraction efficiencies regardless of pH, suggesting that electrostatic interactions between the ionic liquid species and the charged form of DFC play a negligible role. They further highlighted the suitability of highly hydrophobic ionic liquids for the extraction of hydrophobic pharmaceuticals such as sodium diclofenac.
In contrast, the present study utilizes polyethylene glycol/citrate/water and polyethylene glycol/sulfate/water systems, which consist of more accessible and biodegradable components. The selection of these materials enhances the environmental compatibility of the process, supporting ongoing efforts to develop greener and more sustainable extraction methodologies.
This project aims to evaluate the extraction efficiency of sodium diclofenac using ATPS composed of polyethylene glycol (PEG) of different molecular weights (400 g mol−1 and 1000 g mol−1) and two types of sodium salts, one inorganic (sodium sulfate) and one organic (sodium citrate), which has the advantage of being biodegradable, as a sustainable strategy for its recovery from aqueous solutions. To achieve this, various ATPS are formulated by combining PEGs of different molecular weights with salts at varying concentrations (operating points), assessing their influence on phase formation, drug partitioning, diclofenac concentration, and system pH. The extraction efficiency under each condition is determined to identify those that optimize recovery while minimizing environmental impact. Additionally, an extraction mechanism is proposed based on UV/Vis spectroscopy, and the potential of these systems is evaluated as a green alternative for wastewater treatment and their prospective application in the pharmaceutical industry. The working hypothesis posits that PEG/salt/water ATPS promote the partitioning of DFC into the polymer phase, thereby facilitating its recovery and contributing to the development of sustainable remediation technologies.
2 Material and methods
2.1. Materials
Polyethylene glycol (PEG) with molecular weights of 400 g mol−1 and 1000 g mol−1, along with sodium citrate dihydrate and anhydrous sodium sulfate, were used as phase-forming components for the preparation of ATPS. Sodium diclofenac (DFC) was selected as the model compound for the extraction process. All solutions were prepared using deionized water. Detailed information on the materials used, including supplier, CAS number, and purity, is provided in Table 2.| Name of the compound | Molecular formula | Molecular weight (g mol−1) | CAS number | % purity, grade, other specifications | Source |
|---|---|---|---|---|---|
| a n.a – not applicable. | |||||
| Polyethylene glycol 400 (PEG-400) | HO–(CH2–CH2–O–)n–H | 400 | 25322-68-3 | ≥99% reactive grade | Polioles S.A. de C.V. |
| Polyethylene glycol 1000 (PEG-1000) | HO–(CH2–CH2–O–)n–H | 1000 | 25322-68-3 | ≥99% reactive grade | Karal |
| Sodium citrate dihydrate (Na3Cit) | C6H5Na3O7·2H2O | 294.10 | 6132-04-3 | ≥99% reactive grade | Karal |
| Sodium sulfate anhydrous | Na2SO4 | 142.04 | 7757-82-6 | ≥99% reactive grade | Karal |
| Deionized water | H2O | 18.02 | 7732-18-5 | Conductivity 1.5 μmhos cm−1 | Karal |
| Sodium diclofenac (DFC) | C14H10Cl2NNaO2 | 318.13 | 15307-79-6 | ≥98% reactive grade | Sigma-Aldrich |
| Buffer pH 4 (sodium citrate) | n.a | n.a | 6132-04-3 | pH at 25 °C: 3.98–4.02 reactive grade | Karal |
| 7732-18-5 | |||||
| Buffer pH 7 (phosphate) | n.a | n.a | 7778-77-0 | pH at 25 °C: 6.98–7.02 reactive grade | Karal |
| 7558-79-4 | |||||
| 7732-18-5 | |||||
| Buffer pH 10 (sodium borate) | n.a | n.a | 1303-96-4 | pH at 25 °C: 9.98–10.02 reactive grade | Karal |
| 7732-18-5 | |||||
2.2. Methods
| ATPS | Component X (% w w−1) | Component Y (% w w−1) |
|---|---|---|
| PEG-400/Sodium citrate | 40 | 50 |
| PEG-400/Sodium sulfate | 20 | 50 |
| PEG-1000/Sodium citrate | 40 | 30 |
| PEG-1000/Sodium sulfate | 20 | 30 |
wtPEG = A![[thin space (1/6-em)]](https://www.rsc.org/images/entities/char_2009.gif) exp[(Bwtsalt0.5) − (Cwtsalt3)] exp[(Bwtsalt0.5) − (Cwtsalt3)]
| (1) |
 | (2) |
 | (3) |
 | ||
| Fig. 2 Schematic diagram of the sodium diclofenac extraction process for each ATPS. | ||
| (wtPEG)Top = A exp[(B(wtsalt)Top0.5) − ((wtsalt)Top3)] | (4) |
| (wtPEG)Bot = A exp[(B(wtsalt)Bot0.5) − ((wtsalt)Bot3)] | (5) |
 | (6) |
 | (7) |
A calibration curve was constructed using seven DFC solutions of increasing concentrations, prepared in deionized water (without salt). Deionized water served as the blank. Absorbance at 276 nm was measured for each solution using a 10 mm quartz cell. Based on this calibration curve, which showed a correlation coefficient of R2 = 0.998, the initial concentrations of DFC were determined for subsequent extraction experiments.
Following extraction, UV-Vis spectroscopy was employed to quantify DFC in the polymer phase. The absorption spectrum was recorded over the 200–400 nm range using a 10 mm quartz cell. As reference, a blank solution was prepared containing the same concentrations of PEG, salt, and water as the polymer phase, depending on the ATPS composition. The maximum absorption wavelength varied between 280 and 284 nm, depending on the system.
A calibration curve was established using seven drug solutions of increasing concentration, each prepared in the corresponding PEG/salt/water matrix to match the polymer phase conditions. The appropriate blank (polymer phase matrix) was used for each ATPS. Absorbance measurements were taken at the system-specific maximum wavelength, and the extracted DFC concentrations in the polymer phase were calculated accordingly.
The extraction efficiency was determined using eqn (8).
 | (8) |
Additionally, the absorption spectra of DFC in deionized water (prior to extraction), as well as those of the PP and SP after the extraction process, were recorded. These spectra were compared with the corresponding blanks (polymer and saline phases solutions containing the same PEG/salt/water concentrations as the selected ATPS). The resulting spectra were subsequently analyzed to evaluate the behavior of DFC in the polymer phase following extraction.
3 Results and discussion
3.1. Experimental binodal curves, their modeling, and selection of operating points
It is generally recommended that binodal curves be constructed experimentally, as the conditions under which phase separation occurs are inherently variable and dependent on the specific experimental setup and context.11 As a result, the volumes and concentrations at phase equilibrium may exhibit significant variability. Fig. S1 in the ESI† compares the binodal curves obtained in this study with those previously reported in the literature. The observed differences are minimal, supporting the conclusion that the methodology employed is robust and reliable.After constructing the binodal curves for the ATPS under investigation, it was necessary to define the boundaries of the two-phase region. This was achieved using the Merchuk equation (eqn (1)).22,24 The parameters A, B, and C, along with their respective standard deviations, are provided in Table S1 (ESI†). The results demonstrate a strong correlation between the experimental and calculated data.25 Operating points were selected to ensure that the concentration of the phase-forming components in each ATPS yielded a phase volume ratio (VPP/VSP) of 1 (see Fig. 3). The conditions were defined such that the first operating point (FOP) was located near the binodal curve, while the last operating point (LOP) was positioned farther from it. Based on the theoretical tie-lines, the equilibrium concentrations of polymer and salt in both the polymer and saline phases were determined. These data are summarized in Table 4.
 | ||
| Fig. 3 Operating points (VPP/VSP = 1) used in the study of DFC recovery for each ATPS: PEG-400/Sodium citrate (◆), PEG-400/Sodium sulfate (●), PEG-1000/Sodium citrate (▲) PEG-1000/Sodium sulfate (■), at 298.15 K. | ||
| First operating point (FOP) | ||||||
|---|---|---|---|---|---|---|
| PEG-400/Sodium citrate | PEG-400/Sodium sulfate | |||||
| Total system | PP | SP | Total system | PP | SP | |
| a PP: polymer phase; SP: saline phase. | ||||||
| Polymer (% w w−1) | 21 | 36.55 | 3.05 | 16.5 | 24.53 | 7.44 |
| Salt (% w w−1) | 21 | 9.18 | 34.63 | 12.5 | 8.75 | 16.71 |
| PEG-1000/Sodium citrate | PEG-1000/Sodium sulfate | |||||
|---|---|---|---|---|---|---|
| Total system | PP | SP | Total system | PP | SP | |
| Polymer (% w w−1) | 16 | 24.03 | 6.53 | 14.5 | 27.24 | 1.66 |
| Salt (% w w−1) | 15 | 10.52 | 20.10 | 10.5 | 4.94 | 16.23 |
| Last operating point (LOP) | ||||||
|---|---|---|---|---|---|---|
| PEG-400/Sodium citrate | PEG-400/Sodium sulfate | |||||
| Total system | PP | SP | Total system | PP | SP | |
| Polymer (% w w−1) | 23 | 41.69 | 0.31 | 20.5 | 45.37 | 0.15 |
| Salt (% w w−1) | 23 | 5.72 | 43.95 | 16.5 | 2.45 | 27.98 |
| PEG-1000/Sodium citrate | PEG-1000/Sodium sulfate | |||||
|---|---|---|---|---|---|---|
| Total system | PP | SP | Total system | PP | SP | |
| Polymer (% w w−1) | 25.5 | 56.83 | 0.0003 | 21 | 48.24 | 0.0002 |
| Salt (% w w−1) | 21.5 | 0.99 | 38.51 | 14 | 1.59 | 23.51 |
3.2. Sodium diclofenac extraction
The extraction of DFC was evaluated at an initial concentration of 10 ppm for both selected operating points. Table 4 presents the initial concentrations chosen for each operating point used in the DFC recovery experiments, along with the corresponding equilibrium concentrations derived from the theoretical tie-lines calculated for each condition.Table 5 presents the results of the extraction process performed using a [DFC] = 10 ppm, along with the standard deviations obtained from three independent replicates. The ATPS composed of PEG-400/Sodium citrate, PEG-1000/Sodium citrate, and PEG-1000/Sodium sulfate exhibited extraction efficiencies exceeding 99.9%. In contrast, the PEG-400/Sodium sulfate system showed slightly lower extraction efficiencies—94.2% for the first operating point (FOP) and 97.7% for the last operating point (LOP).
| ATPS | Extraction (%) | Sd | |
|---|---|---|---|
| a Sd = standard deviation; FOP = first operating point; LOP = last operating point. | |||
| PEG-400 g mol−1/Sodium citrate | FOP | > 99.9 | 0.2206 |
| LOP | > 99.9 | 0.3936 | |
| PEG-400 g mol−1/Sodium sulfate | FOP | 94.2 | 0.7607 |
| LOP | 97.7 | 0.3740 | |
| PEG-1000 g mol−1/Sodium citrate | FOP | > 99.9 | 0.9819 |
| LOP | > 99.9 | 1.2971 | |
| PEG-1000 g mol−1/Sodium sulfate | FOP | > 99.9 | 1.9922 |
| LOP | > 99.9 | 1.4663 | |
This reduced performance may be attributed to two main factors. First, the lower molecular weight of PEG in the PEG-400/Sodium sulfate system results in a polymer phase with decreased hydrophobicity compared to that formed with PEG-1000 (Mw = 1000 g mol−1). Second, the lower concentration of Na2SO4—relative to the PEG-400/Sodium citrate system—leads to a weaker salting-out effect, thereby reducing the partitioning of the drug into the polymer phase and slightly diminishing extraction efficiency.
The DFC extraction results confirm that the process is highly efficient across all the ATPSs evaluated. Furthermore, an analysis of the total concentrations of the phase-forming components indicates that the concentrations of both PEG and salt are higher at the last operating point (LOP) compared to the first operating point (FOP). As a result, the presence of PEG in the saline phase (SP) and salt in the polymer phase (PP) at equilibrium is significantly reduced at the LOP relative to the FOP. This effect is further enhanced when using a higher molecular weight polymer (PEG-1000 g mol−1).
These observations suggest that the LOP provides a more favorable environment for DFC extraction, and that PEG with a molecular weight of 1000 g mol−1 is the most suitable polymer for achieving maximum extraction efficiency.
3.3. Influence of phase volume ratio variation at the last operating point (LOP)
To assess the effect of phase volume ratio on the LOP, the same tie-line was employed while adjusting the initial concentrations of salt and polymer. This adjustment allowed for variation in the phase volume ratio without altering the final equilibrium concentrations. Table 6 summarizes the initial concentrations of PEG and salt, the drug extraction percentage, the phase volume ratio, the concentration factor in the polymer phase, and the standard deviation for each experiment.| ATPS | Initial concentrations (% w·w−1) | Volume ratio | Concentration factor in PP | Extraction (%) | Sd | |
|---|---|---|---|---|---|---|
| PEG | Salt | |||||
| a PP = polymer phase; SP = salt phase; Sd = standard deviation. | ||||||
| PEG-400 g mol−1/Sodium citrate | 30 | 17 | 1.9 | 0.52 | >99.9 | 1.03 |
| 15 | 30 | 0.4 | 2.5 | >99.9 | 0.84 | |
| PEG-400 g mol−1/Sodium sulfate | 28 | 13 | 1.8 | 0.55 | >99.9 | 0.62 |
| 14 | 20 | 0.5 | 2.0 | >99.9 | 2.94 | |
| PEG-1000 g mol−1/Sodium citrate | 36 | 15 | 2.2 | 0.45 | >99.9 | 7.56 |
| 16 | 28 | 0.5 | 2.0 | >99.9 | 2.45 | |
| PEG-1000 g mol−1/Sodium sulfate | 30 | 10 | 2 | 0.5 | >99.9 | 6.30 |
| 12 | 18 | 0.5 | 2.0 | >99.9 | 0.52 | |
Notably, despite the changes in phase ratio, extraction efficiencies remained consistently above 99.9%, indicating the robustness of the system. In particular, for the ATPS composed of PEG-400/Sodium sulfate, an increase in drug extraction efficiency was observed, which can be attributed to the higher concentrations of both salt and polymer in the selected two-phase systems.
Overall, for the two-phase volume ratios evaluated in each ATPS, modifying the initial salt and polymer concentrations maintained high extraction efficiency. This finding is especially relevant from an industrial and environmental perspective, as it enables a reduction in reagent consumption, waste generation, and overall processing costs. Additionally, a notable concentration effect was observed, with DFC reaching up to 2.5 times its original concentration in the aqueous medium.
3.4. Influence of initial DFC concentration and pH on extraction efficiency
The extraction of DFC was evaluated as a function of its initial concentration (ranging from 10 to 1000 ppm) for each of the ATPS systems studied, considering the two operating points: the FOP and the LOP, with a phase volume ratio R = (VPP/VSP) = 1. For each condition, the pH of both phases was measured after the extraction process. The results are presented in Fig. 4 for DFC extraction in citrate-based media, and in Fig. 5 for extraction in sulfate-based media. | ||
| Fig. 4 Extraction percentages of DFC as a function of its initial concentration ([DFC]) in ATPS composed of: (A and B) PEG-400/Sodium citrate and (C and D) PEG-1000/Sodium citrate, under FOP and LOP conditions at 298.15 K. | ||
 | ||
| Fig. 5 Extraction percentages of DFC as a function of its initial concentration ([DFC]) in ATPS composed of: (A and B) PEG-400/Sodium sulfate and (C and D) PEG-1000/Sodium sulfate, under FOP and LOP conditions at 298.15 K. | ||
As illustrated in Fig. 4A–D, the Na3Cit-based systems exhibited high extraction efficiencies under both FOP and LOP conditions (extraction% >99.9%) across the entire range of initial DFC concentrations. Subsequent analyses will demonstrate the correlation between this behavior and the pH of the medium.
In contrast, the behavior of the systems with Na2SO4 is quite different (see Fig. 5). A consistent decrease in extraction efficiency (R%) was observed as the concentration of the drug increased. Under FOP conditions (Fig. 5A and C), this reduction in R% occurred at relatively low DFC concentrations for both PEG-400 and PEG-1000. While, under LOP conditions (Fig. 5B and D), R% remained close to 99% at approximately 400 ppm and 700 ppm for PEG-400 and PEG-1000, respectively. Notably, in the sulfate-based medium, the decline in R% was accompanied by the formation of a DFC precipitate. Despite this precipitation occurring in the saline phase, the evaluation of extraction efficiency remains valid, as it is determined based on the composition of the polymer phase.
Accordingly, R% in the sulfate medium may decrease to values ranging from 75% to 20%, depending on the extent of precipitation. As will be further discussed, this behavior is closely related to the nature of the salt (e.g., the pH of the medium), its concentration, and both the concentration and molecular weight of the PEG present in the polymer phase.
To understand the above results, it is necessary to identify the chemical species of DFC as a function of pH using a species distribution diagram.
The DFC species distribution diagram as a function of pH, shown in Fig. 6, was made considering the chemical equilibrium (represented by eqn (9)) and eqn (10) and (11), where fDFC− and fHDFC are the fractions of the protonated and deprotonated drug, respectively, as a function of the concentration of protons [H+] and the value of its acid dissociation constant  .
.
| HDFC ⇄ H+ + DFC− | (9) |
 | (10) |
 | (11) |
 | ||
| Fig. 6 Species distribution diagram of diclofenac as a function of pH. | ||
Fig. 6 shows that the neutral form (HDFC) of diclofenac is the predominant species at pH values below 4.15 (pKa value), while the DFC− (deprotonated) species is the predominant species above this pH.
As previously mentioned, pH measurements were performed in both phases after DFC extraction for each of the systems studied. It was observed that the pH values in both phases were very similar; therefore, the pH values reported in Fig. 7(A and B) represent the average pH of both phases under each condition.
 | ||
| Fig. 7 pH variation as a function of DFC concentration for the different systems studied at 298.15 K. (A) ATPS composed of PEG-400/salt/H2O; (B) ATPS composed of PEG-1000/salt/H2O. | ||
In the case of the Na3Cit medium (FOP and LOP), the equilibrium pH is consistently above 6 (see Fig. 7A), which exceeds the pKa of DFC (4.15). Therefore, the predominant species in all cases is the deprotonated form, DFC−, as shown in Fig. 6. As will be discussed later, this form of DFC is favorable for achieving high extraction efficiencies (R%).
In contrast, in the sulfate-based medium, the minimum pH value is close to 3, and the highest is around pH 5.5 (see Fig. 7B). This implies that the protonated species, HDFC, may predominate at pH values below 4.15 (the pKa of DFC), whereas the deprotonated form, DFC−, becomes dominant above this threshold, as illustrated in Fig. 6.
The presence of the HDFC species significantly limits its solubility in the saline (sulfate) phase and competes with its solubility (or partitioning) in the polymer phase. This clearly explains the trends observed in Fig. 5A to D.
In conclusion, pH is a critical factor in the recovery process of DFC, as is the nature (pH controllability) and concentration (which influences the “salting out” effect) of each salt, as well as the concentration and molecular weight of the polymer. In all the systems studied, at low drug concentrations (10 ppm), high extraction efficiency was observed, suggesting that pH does not have a significant influence under these conditions. However, at concentrations higher than 10 ppm, pH becomes a relevant parameter, especially in the ATPS formed with sodium sulfate.
3.5. Analysis of the mass transfer process of DFC into the polymer phase
The mass transfer of DFC was investigated by analyzing the extraction process using UV-Vis absorption spectroscopy. Measurements were carried out for both phases of each ATPS at the LOP with an initial DFC concentration of 10 ppm. The corresponding spectra for the extracted DFC in each phase (PP EXT DFC and SP EXT DFC) were obtained. For comparison, the absorption spectra of DFC in aqueous solution (10 ppm), as well as the polymer and saline phases in the absence of DFC (blank PP and blank SP), are included in Fig. 8. | ||
| Fig. 8 UV-Vis spectral behavior during the DFC extraction process in ATPS under LOP conditions: (A) PEG-400/Sodium citrate, (B) PEG-400/Sodium sulfate, (C) PEG-1000/Sodium citrate, and (D) PEG-1000/Sodium sulfate. | ||
The drug in aqueous solution exhibits a maximum absorption peak at 276 nm, which is characteristic of DFC in this medium. In contrast, during the extraction process, when DFC is transferred to the polymer phase, an increase in absorbance is observed—attributable to the concentration effect of DFC in the polymeric environment. Additionally, the DFC absorption profile in the polymer phase displays a distinct positive band shape compared to its spectrum in aqueous solution.
A bathochromic shift is also evident, with the absorption maximum shifting to wavelengths between 280 and 283 nm, depending on the specific ATPS. This enhanced signal and red shift are likely due to hydrogen bonding interactions between DFC and PEG.26–28 Notably, PEG is capable of forming a broad range of molecular associations due to its terminal primary hydroxyl groups, which can readily interact with various compounds and functional groups—including ethers, amines, fatty acids, and propylene glycols—among others.29 These interactions suggest that complex formation between DFC and PEG is a plausible mechanism contributing to the observed spectral behavior.
In light of the observations above and the changes in behavior observed during the DFC extraction process as a function of pH, we propose two possible mechanisms for drug extraction.
In the first mechanism (Fig. 9A), at pH values above the pKa of DFC (Fig. 6), the drug exists predominantly in its anionic form (DFC−). In this state, the hydroxyl hydrogen atoms of the PEG chain may form hydrogen bonds with the negatively charged oxygen atom of the carboxyl group in DFC−. Additionally, the sodium counterion (Na+) may associate with the ether oxygen atoms of the PEG chain, contributing to charge neutralization within the polymer phase.
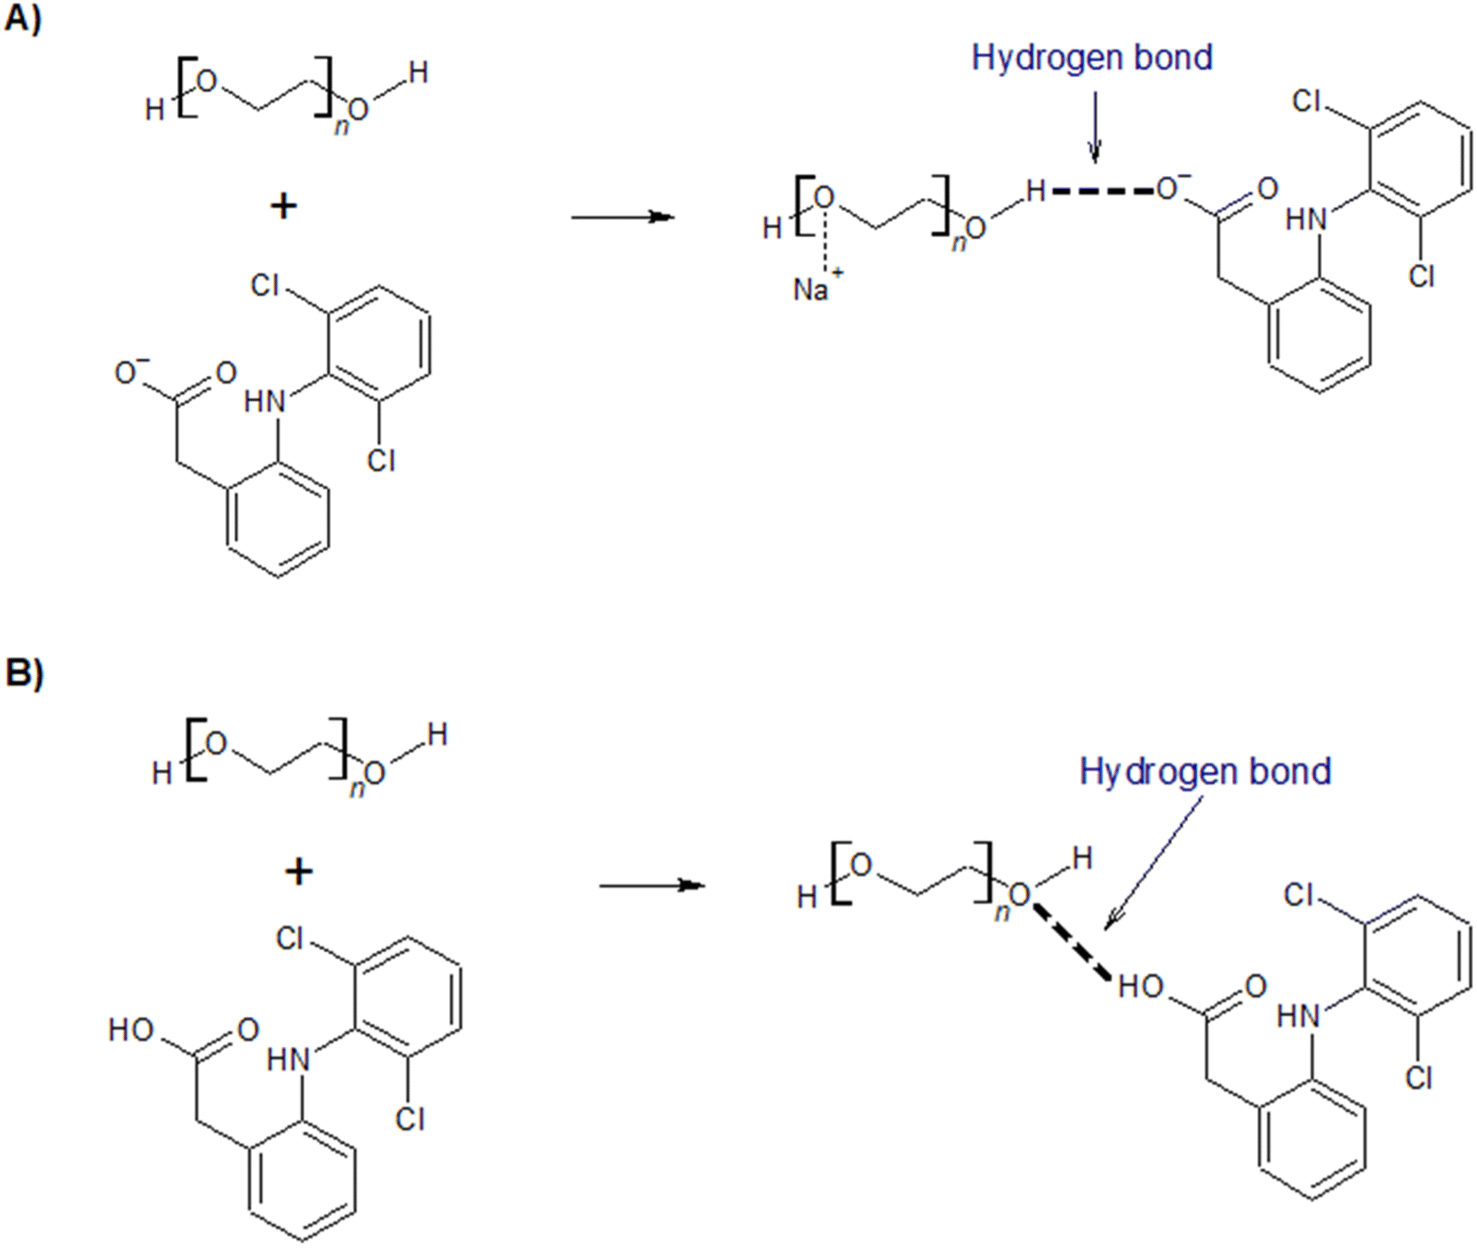 | ||
| Fig. 9 Proposed mechanisms for drug extraction via hydrogen bonding between: (A) the terminal hydrogen of PEG and sodium diclofenac, and (B) the terminal oxygen of PEG and sodium diclofenac. | ||
In the second mechanism (Fig. 9B), at pH values below the pKa, DFC is present primarily in its neutral (acidic) form (HDFC). Under these conditions, hydrogen bonding may occur between the ether oxygen atoms of PEG and the hydrogen atom of the carboxylic group in HDFC.
In both mechanisms, the formation of hydrogen bonds induces an electron redistribution within the DFC molecule. This redistribution lowers the molecular energy and leads to a red shift in the absorption maximum (i.e., an increase in wavelength), as observed in Fig. 8 and consistent with previous findings.27,28 Given the structural characteristics of DFC, it is postulated that the phenylacetic acid moiety plays a central role in conferring the chromophoric properties of the molecule. This group contains a carbonyl functional group with non-bonding electron pairs on the oxygen atom, making it highly susceptible to electronic delocalization. Consequently, changes in electron distribution within this group are responsible for the observed shifts in the absorption wavelength.
Our findings are in good agreement with the studies conducted by Li et al.,27,28 who investigated the formation of hydrogen bonds between polyethylene glycol and various drugs in two independent works. In the first,27 they analyzed a liquid–liquid extraction system composed of a non-ionic surfactant (PEG-1000), ammonium sulfate ((NH4)2SO4), and water, applied to the extraction of chlorpromazine (CPZ) and procaine (PCN). The results showed a red shift in the UV-Vis absorption spectra upon transfer of the drugs to the PEG phase (254 → 256 nm for CPZ and 290 → 295 nm for PCN), indicating the formation of hydrogen bonds between PEG and the drugs, particularly in the case of PCN.
In a second study,28 the authors extended the analysis to the distribution behavior of three drugs—CPZ, PCN, and procaine amide (PCNA)—in aqueous two-phase systems (ATPS) formed by PEG-800 or PEG-1500 and (NH4)2SO4. Again, UV-Vis spectra revealed red shifts upon partitioning of the compounds into the PEG phase: +2 nm for CPZ, +3 nm for PCN, and +5 nm for PCNA. These findings further support the presence of hydrogen bonding interactions, which are more pronounced in PCNA due to its greater ability to form such bonds.
Therefore, this type of bathochromic shift caused by PEG–drug interactions within PEG/salt/water-based ATPS has been previously reported, thus supporting the findings observed in this study.
4 Conclusions
The results obtained in this study demonstrate that the extraction of sodium diclofenac using ATPS is highly efficient under most of the evaluated conditions, achieving extraction percentages greater than 99.9%, particularly in systems composed of PEG-1000 g mol−1 to 25.5% w w−1 and Na3Cit to 21.5% w w−1. It was identified that pH, the nature of salt, the concentration and molecular weight of the polymer, and the modification of the drug concentration are key factors in the efficiency of the process. Furthermore, UV-Vis spectroscopic analysis suggests that the transfer of the drug to the polymer phase occurs through the formation of hydrogen bonds with PEG, contributing to the understanding of the partitioning mechanism.From a sustainability perspective, the use of biodegradable and low-toxicity compounds such as PEG and sodium citrate, along with the predominantly aqueous nature of the system, positions ATPS as a green and viable alternative for environmental remediation.
However, although the scalability potential of the system is mentioned, this claim requires further evaluation. Industrial-scale implementation faces technical and economic challenges, such as the design of continuous processes, recovery and reuse of components, and integration with existing water treatment technologies. Economic feasibility will also depend on the cost of materials, the efficiency of the process at scale, and the regeneration of components without significant loss of performance.
Looking ahead, future research could focus on evaluating the scalability of the process through pilot studies that consider process engineering aspects, energy efficiency, and life cycle analysis; exploring the efficacy of the ATPS system in extracting other pharmaceutical contaminants such as antibiotics, hormones, and metabolites; optimizing the system formulation to maximize recovery with minimal input consumption, thereby reducing operational costs and environmental impact; investigating phase reuse and recovery of the extracted drug, which are essential for the sustainability of the process.
Overall, this work not only demonstrates the efficacy of the ATPS system for diclofenac recovery but also lays the groundwork for its development as a clean, efficient, and adaptable separation technology for various industrial and environmental applications.
Abbreviations
| DFC | Diclofenac |
| ATPS | Aqueous two-phase systems |
| PEG | Polyethylene glycol |
| UV-Vis | Ultraviolet-visible |
| NSAID | Nonsteroidal anti-inflammatory drug |
| PP | Polymer phase |
| SP | Saline phase |
| FOP | First operation point |
| LOP | Last operation point |
| Sd | Standard deviation |
| wtsalt | Percentage by weight of the salt |
| wtPEG | Percentage by weight of the polymer |
| wtPEGcal | Percentage by weight of the polymer calculated |
| wtPEGexp | Percentage by weight of the polymer experimental |
| N | Amount of data of the binodal curve |
| U | Minimization function |
| R | Volume ratio |
| fi | Fraction of species i |
Data availability
The data of submitted manuscript “Study Of Diclofenac Distribution In Aqueous Two-Phase Peg/Salt/Water Systems”, authored by Diana Esmeralda Martínez-Rodríguez, Edgar Daniel Martínez-Rodríguez, Liliana Hernández-Perales, María del Pilar González-Muñoz & Mario Avila-Rodriguez, could be found in the next link: https://drive.google.com/drive/folders/1udganmlxzmqimtc1cn0hxoym3juzdt7y?usp=sharing.Author contributions
Diana Esmeralda Martínez-Rodríguez: conceptualization, methodology, investigation, formal analysis, writing – original draft, writing – review & editing, Visualization. Edgar Daniel Martínez-Rodríguez: methodology, software, investigation, writing – review & editing. Liliana Hernández-Perales: supervision, writing – review & editing. María del Pilar González-Muñoz: supervision, writing – review & editing. Mario Avila-Rodriguez: conceptualization, methodology, investigation, resources, writing – review & editing, visualization, supervision, funding acquisition.Conflicts of interest
There are no conflicts of interest to declare.Acknowledgements
The authors would like to thank LANCAPFEM UG-UAA for the analysis services, “POLIOLES S.A. de C.V” for providing PEG, SECIHTI (CB 259307 project), and the ‘Universidad de Guanajuato’ (55-2024 project) for the financial support. Diana Esmeralda Martínez-Rodríguez thanks the Universidad de Guanajuato and SECIHTI (grant 926294).References
- M. Gil, A. Soto, J. Usma and O. Gutiérrez, Contaminantes emergentes en aguas, efectos y posibles tratamientos, Producción más limpia, 2012, 7, 52–73, DOI:10.22507/pml.
- Y. Zhang, S. Geißen and C. Gal, Carbamazepine and diclofenac: Removal in wastewater treatment plants and occurrence in water bodies, Chemosphere, 2008, 73, 1151–1161, DOI:10.1016/j.chemosphere.2008.07.086.
- PubChem, Diclofenac, Bethesda (MD): National Center for Biotechnology Information, 2020, available from: https://pubchem.ncbi.nlm.nih.gov/compound/diclofenac#section=Chemical-and-Physical-Properties.
- US National Library of Medicine, Diclofenac, Bethesda (MD, MedlinePlus, 2020, available from: https://medlineplus.gov/spanish/druginfo/meds/a689002-es.html.
- A. Abadi, A. Eissa and G. Hassan, Synthesis of novel 1,3,4-trisubstituted pyrazole derivatives and their evaluation as antitumor and antiangiogenic agents, Chem. Pharm. Bull., 2003, 51, 838–844, DOI:10.1248/cpb.51.838.
- M. Gómez-Lechón, X. Ponsoda, E. O'Connor, T. Donato, R. Jover and J. Castell, Diclofenac induces apoptosis in hepatocytes, Toxicol. In Vitro, 2003, 17, 675–680, DOI:10.1016/S0887-2333(03)00105-X.
- P. Sathishkumar, R. A. Meena, T. Palanisami, V. Ashokkumar, T. Palvannan and F. L. Gu, Occurrence, interactive effects and ecological risk of Diclofenac in environmental compartments and biota— a review, Sci. Total Environ., 2020, 698, 134057, DOI:10.1016/j.scitotenv.2019.134057.
- J. Schwaiger, H. Ferling, U. Mallow, H. Wintermayr and R. Negele, Toxic effects of the nonsteroidal anti-inflammatory drug diclofenac: Part I: histopathological alterations and bioaccumulation in rainbow trout, Aquat. Toxicol., 2004, 68, 141–150, DOI:10.1016/j.aquatox.2004.03.014.
- S. C. Silvério, A. Wegrzyn, E. Lladosa, O. Rodríguez and E. A. Macedo, Effect of aqueous two-phase system constituents in different poly(ethylene glycol)–salt phase diagrams, J. Chem. Eng. Data, 2012, 57, 1203–1208, DOI:10.1021/je2012549.
- M. Iqbal, Y. Tao, S. Xie, Y. Zhu, D. Chen and X. Wang, et al., Aqueous two-phase system (ATPS): an overview and advances in its applications, Biol. Proced. Online, 2016, 18, 18, DOI:10.1186/s12575-016-0048-8.
- Aqueous Two-phase Systems: Methods and Protocols, ed. R. Hatti-Kaul, Springer, New York, 2000, vol. 11, DOI:10.1385/1592590284.
- C. X. Li, J. Han, Y. Wang, Y. S. Yan, X. H. Xu and J. M. Pan, Extraction and mechanism investigation of trace roxithromycin in real water samples by use of ionic liquid–salt aqueous two-phase system, Anal. Chim. Acta, 2009, 653, 178–183, DOI:10.1016/j.aca.2009.09.011.
- M. Shao, X. Zhang, N. Li, J. Shi, H. Zhang and Z. Wang, et al., Ionic liquid-based aqueous two-phase system extraction of sulfonamides in milk, J. Chromatogr. B, 2014, 961, 5–12, DOI:10.1016/j.jchromb.2014.04.054.
- J. F. Pereira, F. Vicente, V. C. Santos-Ebinuma, J. M. Araújo, A. Pessoa and M. G. Freire, et al., Extraction of tetracycline from fermentation broth using aqueous two-phase systems composed of polyethylene glycol and cholinium-based salts, Process Biochem., 2013, 48, 716–722, DOI:10.1016/j.procbio.2013.02.025.
- P. A. J. Rosa, I. F. Ferreira, A. M. Azevedo and M. R. Aires-Barros, Aqueous two-phase systems: a viable platform in the manufacturing of biopharmaceuticals, J. Chromatogr. A, 2010, 1217, 2296–2305, DOI:10.1016/j.chroma.2009.11.034.
- R. C. Assis, A. B. Mageste, L. R. de Lemos, R. M. Orlando and G. D. Rodrigues, Application of aqueous two-phase systems for the extraction of pharmaceutical compounds from water samples, J. Mol. Liq., 2020, 301, 112411, DOI:10.1016/j.molliq.2019.112411.
- J. A. Asenjo and B. A. Andrews, Aqueous two-phase systems for protein separation: a perspective, J. Chromatogr. A, 2011, 1218, 8826–8835, DOI:10.1016/j.chroma.2011.06.051.
- Q. Liu, J. Yu, W. Li, X. Hu, H. Xia and H. Liu, et al., Partitioning behavior of penicillin G in aqueous two phase system formed by ionic liquids and phosphate, Sep. Sci. Technol., 2006, 41, 2849–2858, DOI:10.1080/01496390600786135.
- M. González-González, M. Rito-Palomares and O. Méndez-Quintero, Partition behavior of CD133+ stem cells from human umbilical cord blood in aqueous two-phase systems: in route to establish novel stem cell primary recovery strategies, Biotechnol. Prog., 2014, 30, 700–707, DOI:10.1002/btpr.1875.
- M. Baghbanbashi, H. S. Shiran, A. Kakkar, G. Pazuki and K. Ristroph, Recent advances in drug delivery applications of aqueous two-phase systems, PNAS Nexus, 2024, 3, 255, DOI:10.1093/pnasnexus/pgae255.
- F. Luechau, T. C. Ling and A. Lyddiatt, Partition of plasmid DNA in polymer–salt aqueous two-phase systems, Sep. Purif. Technol., 2009, 66, 397–404, DOI:10.1016/j.seppur.2008.12.003.
- F. G. Ahsaie, G. Pazuki, T. E. Sintra, P. Carvalho and S. P. Ventura, Study of the partition of sodium diclofenac and norfloxacin in aqueous two-phase systems based on copolymers and dextran, Fluid Phase Equilib., 2021, 530, 112868, DOI:10.1016/j.fluid.2020.112868.
- V. P. Priyanka and R. L. Gardas, Mono-and di-cationic ionic liquids based aqueous biphasic systems for the extraction of diclofenac sodium, Sep. Purif. Technol., 2020, 234, 116048, DOI:10.1016/j.seppur.2019.116048.
- J. C. Merchuk, B. A. Andrews and J. A. Asenjo, Aqueous two-phase systems for protein separation: studies on phase inversion, J. Chromatogr. B:Biomed. Sci. Appl., 1998, 711, 285–293, DOI:10.1016/S0378-4347(97)00594-X.
- M. T. Zafarani-Moattar and S. Tolouei, Liquid-liquid equilibria of aqueous two-phase systems containing polyethylene glycol 4000 and di-potassium tartrate, potassium sodium tartrate, or di-potassium oxalate: Experiment and correlation, Calphad, 2008, 32, 655–660, DOI:10.1016/j.calphad.2008.09.006.
- A. S. Murthy and C. N. R. Rao, Spectroscopic studies of the hydrogen bond, Appl. Spectrosc. Rev., 1968, 2, 69–191, DOI:10.1080/05704926808050887.
- L. Li, F. Liu, X. Kong, S. Su and K. A. Li, Investigation of a liquid-liquid extraction system based on non-ionic surfactant–salt–H2O and mechanism of drug extraction, Anal. Chim. Acta, 2002, 452, 321–328, DOI:10.1016/S0003-2670(01)01471-4.
- L. Li, C. Y. He, S. H. Li, F. Liu, S. Su and X. X. Kong, et al., Study on PEG-(NH4)2SO4 aqueous two-phase system and distribution behavior of drugs, Chin. J. Chem., 2004, 22, 1313–1318, DOI:10.1002/cjoc.20040221120.
- H. Jang, C. Shin and K. Kim, Safety evaluation of polyethylene glycol (PEG) compounds for cosmetic use, Toxicol. Res., 2015, 31, 105–136, DOI:10.5487/TR.2015.31.2.105.
Footnote |
| † Electronic supplementary information (ESI) available. See DOI: https://doi.org/10.1039/d5ra01070e |
| This journal is © The Royal Society of Chemistry 2025 |