
 Open Access Article
 This Open Access Article is licensed under a Creative Commons Attribution-Non Commercial 3.0 Unported Licence
Effect of honey, as a natural deep eutectic solvent, on the phytochemical stability and anti-inflammatory activity of Eurycoma longifolia Jack†
Chanakan
Sitthisak
a,
Juntratip
Jomrit
a,
Warangkana
Chunglok
 bc,
Waraporn
Putalun
d,
Tripetch
Kanchanapoom
d,
Thaweesak
Juengwatanatrakul
e and
Gorawit
Yusakul
*afg
bc,
Waraporn
Putalun
d,
Tripetch
Kanchanapoom
d,
Thaweesak
Juengwatanatrakul
e and
Gorawit
Yusakul
*afg
aSchool of Pharmacy, Walailak University, Thasala, Nakhon Si Thammarat 80160, Thailand. E-mail: gorawit.yu@mail.wu.ac.th; Fax: +66-75-67-2814; Tel: +66-75-67-2839
bSchool of Allied Health Sciences, Walailak University, Nakhon Si Thammarat, Thailand
cFood Technology and Innovation Research Center of Excellence, Walailak University, Nakhon Si Thammarat, Thailand
dFaculty of Pharmaceutical Sciences, Khon Kaen University, Khon Kaen, Thailand
eFaculty of Pharmaceutical Sciences, Ubon Rachathani University, Ubon Ratchathani, Thailand
fFunctional Materials and Nanotechnology Center of Excellence, Walailak University, Nakhon Si Thammarat, Thailand
gHub of Knowledge in Microwave Heating and Applications, Walailak University, Nakhon Si Thammarat, Thailand
First published on 17th February 2025
Abstract
The use of Eurycoma longifolia Jack (EL) in combination with honey is widely recognized in conventional medicine because of its aphrodisiac and pyretic properties. However, the effects of honey, a natural deep eutectic solvent (NADES), on the phytochemical stability and anti-inflammatory activity of EL remain unknown. This study aimed to investigate the effect of honey on phytochemical and anti-inflammatory effects of EL. The stabilities of bioactive compounds, including eurycomanone (EU), 9-hydroxycanthine-6-one (9HCO), and 9-methoxycanthine-6-one (9MCO), were evaluated after treating EL with honey. The anti-inflammatory activity was assessed by measuring the inhibition of NO production in lipopolysaccharide-induced RAW264.7 macrophages. The EL formulations treated with honey exhibited significantly higher yields of EU and 9HCO; however, a decrease in 9MCO was observed. After a 90 day infusion, the anti-inflammatory activities of honey-treated EL (9.19–68.73% NO inhibition) and simulated honey-NADES-treated EL (5.37–66.68% NO inhibition) were slightly lower than that of the non-treated EL extract (10.34–77.93% NO inhibition). Nonsugar honey constituents also exhibited anti-inflammatory effects. The combination of EL extract and honey resulted in a slightly lower anti-inflammatory activity (11.66–68.55% NO inhibition) compared with the EL extract. Honey and NADES enhanced the extraction and stabilization of bioactive compounds from EL. The anti-inflammatory properties of EL were preserved after honey treatment, indicating that honey-treated EL is a potential natural treatment for inflammatory conditions.
Introduction
Eurycoma longifolia Jack (EL) is used in traditional Southeast Asian medicine, predominantly in Thailand and Malaysia, and is known for its aphrodisiac properties, antipyretic properties, and effectiveness against the human coronavirus OC43 and severe acute respiratory syndrome coronavirus-2.1,2 Traditional medicinal practices have combined EL into infused honey and Chanta-lee-la formulations; however, the anti-inflammatory potential of EL in these formulations remains unexplored.Honey exhibits the characteristics of natural deep eutectic solvents (NADES) due to its composition of glucose, fructose, and sucrose, as evidenced by the similarity between its 1H NMR spectra and that of NADES, indicating comparable chemical compositions.3 Honey has been used in traditional Chinese medicine, traditional Thai medicine, Ayurveda, Kampo, Korean medicine, and Unani medicine to alleviate inflammation associated with gastritis, colitis, and respiratory conditions.4 Its phenolic components demonstrate antioxidant and anti-inflammatory properties, which are beneficial in wound healing and in treating cough, respiratory issues, diarrhea, and other gastrointestinal disorders.4
Honey enhances the safety of Astragali radix by preventing the heat-induced acetylation of compounds, such as calycosin-7-O-β-D-glucoside-6″-O-malonate into calycosin-7-O-β-D-glucoside-6″-O-acetate, and improving the heat stability of astragaloside I and II during frying.3 Honey and NADES significantly improve the oral bioavailability of calycosin-7-O-β-D-glucoside of A. radix.3 Honey or NADES, when combined with plant extracts, modulate antioxidant activity.5 The interaction between honeysuckle flower extract and honey showed moderate synergism in the Ferric reducing antioxidant power (FRAP) assay, nearly additive behavior in the ABTS [2,2′-azino-bis(3-ethylbenzothiazoline-6-sulfonic acid)] assay, and moderate antagonism in the DPPH (2,2-diphenyl-1-picrylhydrazyl) assay and CUPRAC (cupric reducing antioxidant capacity) assays.5 Modulation varied between honeysuckle and raspberry extracts, possibly due to different polyphenol compositions; however, the results of DPPH and FRAP assays indicated that honey enhanced the antioxidant activity of raspberry extract.5 In addition, honey contains enzyme, which catalyzes the phytochemical transformations of Pueraria candollei var. mirifica roots.6
Honey-infused herb formulations may enhance the extraction and preservation of bioactive compounds, making them valuable for medicinal purposes. The anti-inflammatory effects of EL may be beneficial for conditions involving erectile dysfunction and fever.7–9 A key component of EL is eurycomanone (EU), which exerts anti-inflammatory effects by inhibiting the production of NO and the expression of inducible nitric oxide synthase (iNOS), interleukin-6, and cyclooxygenase-2 (COX-2) genes.10 9-Methoxycanthin-6-one (9MCO) and 9-hydroxycanthin-6-one (9HCO), both of which are also present in EL, act as anti-inflammatory agents.10 Honey is an immunomodulatory agent and elicits anti-inflammatory effects by downregulating inflammatory transcription factors NF-κB and by suppressing the production of pro-inflammatory cytokines.11,12 Thus, honey potentially affect the anti-inflammatory properties of EL roots. However, the effects of honey and NADES on the chemical constituents of EL remain unclear.
This study aimed to examine the effects of honey on the stability and anti-inflammatory properties of EL constituents. A cell-based experiment was conducted to investigate how infusion of EL into honey influences its inflammatory properties. Providing insights into how honey influences EL not only supports the traditional use of this plant but also offers guidance for developing and standardizing recipes for EL.
Experimental
Chemicals
Analytical reagent (AR)-grade anhydrous D(+)-glucose, sucrose, and D(−)-fructose were procured from KemAusTM (Elago Enterprises Pty Ltd., NSW, Australia). Food-grade honey was obtained from three distinct sources. Honey1 (HN-1) was obtained from the Royal Chitralada Projects (Bangkok, Thailand) and was sourced from bees foraging on longan flowers. Honey2 (HN-2) and Honey3 (HN-3) were obtained from a local beekeeper (Nakhon Si Thammarat, Thailand) and Talaypu Natural Products Co., Ltd. (Bangkok, Thailand), respectively, where bees forage in a mixed deciduous forest.Reference standards for 9HCO (97%) and 9MCO (97%), which were used for high-performance liquid chromatography (HPLC), were previously isolated from the roots of Eurycoma harmandiana.13 Compound EU (≥98%) was purchased from Wuhan ChemFaces Biochemical Co., Ltd. (Wuhan, Hubei, China).
Plant material and preparation
EL roots were collected from Than-To District of Yala Province, Thailand. This plant was identified by Dr. Gorawit Yusakul of the School of Pharmacy, Walailak University, Thailand. The specimen (PHWU53) was deposited at Walailak University, Nakhon Si Thammarat, Thailand. The roots were cleaned, sectioned, and dried at 50 °C for 48 h. The authenticity of the plant was verified by the detection of EU and 9MCO, which are the marker components of EL roots. EU and 9MCO were quantified using HPLC coupled with photodiode array detection (HPLC-PDA).Preparation of NADES
A sugar-based NADES mimicking honey, termed MH-NADES, was formulated using a ratio of water, sucrose, glucose, and fructose (18![[thin space (1/6-em)]](https://www.rsc.org/images/entities/char_2009.gif) :3:18:22), and synthesized by heating under continuous stirring at 70 °C. Honey, a naturally occurring NADES, consists primarily of water, fructose, glucose, sucrose, and constituents such as minerals, vitamins, amino acids, organic acids, flavonoids, phenolic compounds, and various aromatic compounds.14 The phenolic and aromatic compounds present in honey, including chrysin, ferulic acid, and pinocembrin, exhibit pharmacological properties.15 These constituents were extracted from honey to facilitate the derivation of honey-sugar-based NADES (HN-NADES). Honey (70 g) was diluted in 200 mL water and subjected to octadecyl (C18) resin column chromatography (20 mL column volume). The column was then eluted with water (100 mL). The resulting flow-through and water-eluent fractions were lyophilized to eliminate water and obtain HN-NADES. This process was designed to facilitate the adsorption of nonsugar components using a C18 resin, which was then eluted with absolute EtOH (100 mL). Phenolic and flavonoid constituents were isolated and concentrated using a vacuum rotary evaporator, followed by lyophilization.
:3:18:22), and synthesized by heating under continuous stirring at 70 °C. Honey, a naturally occurring NADES, consists primarily of water, fructose, glucose, sucrose, and constituents such as minerals, vitamins, amino acids, organic acids, flavonoids, phenolic compounds, and various aromatic compounds.14 The phenolic and aromatic compounds present in honey, including chrysin, ferulic acid, and pinocembrin, exhibit pharmacological properties.15 These constituents were extracted from honey to facilitate the derivation of honey-sugar-based NADES (HN-NADES). Honey (70 g) was diluted in 200 mL water and subjected to octadecyl (C18) resin column chromatography (20 mL column volume). The column was then eluted with water (100 mL). The resulting flow-through and water-eluent fractions were lyophilized to eliminate water and obtain HN-NADES. This process was designed to facilitate the adsorption of nonsugar components using a C18 resin, which was then eluted with absolute EtOH (100 mL). Phenolic and flavonoid constituents were isolated and concentrated using a vacuum rotary evaporator, followed by lyophilization.
The total phenolic content (TPC) of natural honey, HN-NADES, and non-sugar fractions was determined using the Folin–Ciocalteu colorimetric assay with gallic acid as the calibration standard. The samples were diluted to various concentrations using 80% ethanol as solvent. In each well of a 96-well plate, 20 µL of either the sample or gallic acid solution was added (triplicates), followed by the addition of 100 µL of Folin–Ciocalteu reagent and 80 µL of 7% (w/v) Na2CO3 solution. After incubating the plates at 25 °C for 30 min, the absorbance was measured at 760 nm. The TPC was calculated based on a gallic acid calibration curve and expressed as micrograms of gallic acid equivalents (µg GAE) per gram of sample.
The dinitrosalicylic acid (DNS) method was used to quantify the sugar content of natural honey samples (HN-1, HN-2, and HN-3) and their corresponding non-sugar fractions (HN-1-constituent, HN-2-constituent, HN-3-constituent). Glucose was used as a calibration standard. Each sample (3.5 mL) was combined with 2 mL of the DNS reagent, vortexed, heated to boiling for 5 min, and subsequently cooled to ambient temperature. The absorbance was measured at 540 nm using a UV-visible spectrophotometer, and the sugar content was determined based on the glucose standard curve.
Characterization of NADES
Sugar-based NADES (MH-NADES), honey-derived NADES (HN-1-NADES), and natural honey (HN-1) were characterized. The pH of HN-1, HN-1-NADES, and MH-NADES was measured at 25 ± 2 °C using a pH meter (3510, Jenway, Staffordshire, UK). The density of each sample was determined volumetrically at 25 °C using a 5 mL volumetric flask and an analytical balance with a precision of ±0.0001 g (Model AG200, Gehaka, São Paulo, Brazil). The water content was also determined gravimetrically to compare the water content retained in HN-1-NADES after lyophilization with that in MH-NADES and HN-1.Thermal analysis was conducted using a differential scanning calorimeter (DSC 6000, PerkinElmer, Waltham, MA, USA) connected to an IntraCooler system to evaluate the melting points of HN-1, HN-1-NADES, and MH-NADES in comparison with the individual components of glucose, fructose, and sucrose. Samples with masses of 2–5 mg were placed in aluminum pans with lids and equilibrated at 30 °C for 5 min prior to cooling to −40 °C. The thermal behavior was analyzed over a temperature range of −40 to 250 °C at a heating rate of 10 °C min−1.
Viscosities of undiluted HN-1, HN-1-NADES, and MH-NADES were measured using a cone-and-plate viscometer (LVD-III ULTRA; Brookfield Engineering, Middleboro, MA, USA). The setup included a small sample adapter (13R/RP) with a diameter of 19.05 mm and a spindle SC4-27 (diameter 11.76 mm, length 33.02 mm) with a torque range of 100%.
Determination of chemical constituents
EL samples were treated with honey or MH-NADES. EL root powder (5 g) was suspended in honey or MH-NADES (20 mL), and then the sample was placed at 25 °C for 90 d. Next, the samples were extracted using 80% (v/v) ethanol (80 mL). The extraction was assisted by microwave irradiation at 450 W (20 s, four repetitions). The extract solutions were collected by filtration, and ethanol was removed using a vacuum rotary evaporator. The resultant extracts were diluted with water (500 mL) and subjected to octadecyl (C18) resins (30 mL column volume). Sugar and highly polar contaminants were washed out with water (300 mL). The column was eluted with ethanol, and the eluted components were evaporated and lyophilized.EU, 9HCO, and 9MCO were quantified using HPLC-PDA using a previously described method with modification.16 HPLC analysis was performed using a Thermo Scientific Dionex Ultimate 3000 system equipped with a VWD-3400 RS detector, WPS-3000SL autosampler, LPG-4300SD pump, and TCC-3000SL column compartments. Chemical separation of the EL extract was achieved on a VertiSep™ C18 column (250 mm × 4.6 mm, 5 µm) from Vertical Chromatography Co., Ltd., maintained at 35 ± 2 °C. The gradient mobile phase consisted of solvent B (80% acetonitrile in 0.02% aqueous trifluoroacetic acid) and solvent A (0.02% trifluoroacetic acid in water). The gradient program was divided into three phases: 10–40% B over 0 to 24 min, a steady phase at 40% B for 24 to 40 min, and a shift from 40% to 80% B from 40 to 43 min. Subsequently, the mobile phase was reverted to 10% B to recondition the column for subsequent analysis. The analysis was performed at a flow rate of 1 mL min−1, with detection wavelengths of 244 and 272 nm, and a 5 µL sample injection volume. The chemical constituents of the extracts were identified by comparing their UV-vis spectra and retention times with those of reference standards.
Stability of EL constituents in honey
We evaluated the stability of the bioactive constituents of EL. EL root powder (100 mg) was suspended in 0.5 mL each of HN-1 and MH-NADES, and the samples were stored at 4, 30, and 40 °C with a relative humidity of 75 ± 5%. Over a period of 90 d, we systematically collected samples (n = 3) on days 5, 9, 15, 30, 60, and 90 to assess the stability of the EL constituents.The EU, 9HCO, and 9MCO concentrations in the treated EL samples were quantified. Initially, samples were subjected to extraction using 0.5 mL of 80% (v/v) ethanol, facilitated by ultrasonication at 37 kHz for 30 min. The resulting mixture was centrifuged at 8000g for 10 min, and the supernatant was carefully collected. The remaining solid matter was resuspended in 1 mL of 80% (v/v) ethanol. This extraction procedure was repeated thrice to ensure thorough extraction. Subsequently, all extract solutions were pooled and adjusted to a final volume of 5 mL using 80% (v/v) ethanol. Quantitative analysis of the three biomarkers in the extracts was performed using HPLC-PDA.
Anti-inflammatory properties of honey-infused EL
The anti-inflammatory properties of extracts derived from honey-treated EL, honey constituents, and honey supplemented with the EL extract were investigated. Cell viability was assessed using the 3-(4,5-dimethylthiazol-2-yl)-2,5-diphenyltetrazolium bromide (MTT) assay. RAW264.7 macrophages (American Type Culture Collection, Manassas, VA, USA) were cultured in Dulbecco's modified Eagle medium (DMEM) and seeded at a density of 1 × 10⁵ cells per well in 96-well plates. Following an initial 24 h incubation period, the cells were treated with a vehicle control consisting of 0.1% dimethyl sulfoxide (DMSO, Sigma-Aldrich) or at various concentrations of the sample extracts containing 0.1% DMSO. The extracts were co-incubated with 50 ng mL−1 LPS (Sigma-Aldrich) for 24 h. After removing the medium, 100 µL of MTT solution (0.5 mg mL−1) was added to each well and incubated for 3 h. The resulting formazan crystals were dissolved by adding 100 µL of DMSO and incubating for 1 h. The absorbance of the resulting solution was measured at 595 nm and the background at 670 nm was subtracted using a microplate reader (Multiskan SkyHigh Microplate Spectrophotometer, Thermo Scientific, USA). Cell survival was calculated using the following equation:| Cell viability (%) = (Abssample treated cell/Abscontrol cell) × 100. | (1) |
The anti-inflammatory properties of the extracts were assessed via the inhibition of NO secretion by LPS-induced RAW264.7 cells. Cells were treated with extracts at concentrations that maintained cell viability of at least 80% compared to the control cells. Additionally, 400 µM N-nitro-L-arginine methyl ester (L-NAME; Sigma-Aldrich) was used as a positive control. The culture supernatant from the treated cells was collected, and NO production was measured by adding Griess reagent containing sulfanilamide and N-(1-naphthyl)ethylenediamine dihydrochloride. The absorbance of the resulting mixture was measured at 540 nm using a microplate reader. Anti-inflammatory activity was calculated using the following equation:
 | (2) |
Results and discussion
Preparation of NADES
Whole honey was fractionated into sugar and non-sugar components to generate the HN-NADES and HN constituents (presumed to contain phenolic and flavonoid compounds). The utilization of 70 g of honey yielded 55.59 ± 2.95, 56.95 ± 1.53, and 57.28 ± 6.94 g of HN-1-NADES, HN-2-NADES, and HN-3-NADES, respectively, while producing 0.7107, 0.3982, and 0.2927 g of HN-constituents.The total phenolic content in natural honey ranged from 15.30 to 25.73 µg GAE per g. However, following fractionation, the phenolic contents in the HN-NADES fractions were still detected, albeit at lower concentrations than those observed in natural honey (Table 1). The total phenolic content in HN-NADES ranged from 8.64 to 11.52 µg GAE per g, and that in HN-constituents ranged from 40.2 to 84.9 µg GAE per mg. Consequently, the phenolic content in HN constituents was at least 2343 times higher than that in natural honey and at least 4652 times higher than that in HN-NADES. The analysis revealed significant variations in the phenolic contents across honey sources. These differences reflect the influence of floral source and geographical origin on phenolic compound composition. The phenolic constituents of honey have been previously identified. Manuka honey is abundant in flavonoids, including chrysin, galangin, isorhamnetin, kaempferol, luteolin, pinobanksin, pinocembrin, and quercetin.17 Eucalyptus honey contains flavonoids such as chrysin, isorhamnetin, kaempferol, luteolin, myricetin, pinobanksin, pinocembrin, tricetin, and quercetin.17 Acacia honey is rich in flavonoids such as apigenin, kaempferol, and quercetin.17
| Sample | Total phenolic content | ||
|---|---|---|---|
| Natural honey (µg GAE per g) | HN-NADES (µg GAE per g) | HN-constituents (µg GAE per mg) | |
| HN-1 | 15.30 ± 0.76 | 8.64 ± 2.84 | 40.2 ± 2.6 |
| HN-2 | 15.61 ± 0.77 | 11.52 ± 2.27 | 84.9 ± 16.6 |
| HN-3 | 25.73 ± 1.38 | 8.88 ± 2.93 | 60.3 ± 10.5 |
The glucose residues in the non-sugar fractions (HN-1-constituent, HN-2-constituent, and HN-3-constituent) were determined to be 0.98%, 1.39%, and 1.95% w/w, respectively. Consequently, only a small amount of glucose was present in the HN constituents compared to natural honey and MH-NADES. The concentrations of fructose, glucose, and sucrose in honey were 36.24–39.07%, 26.86–31.38%, and 0.10–1.50%, respectively.18 MH-NADES comprised sucrose, glucose, and fructose at 4.92%, 29.51%, and 36.07% w/w, respectively.
Characterization of NADES
The pH values of HN-1 and HN-1-NADES were 3.77 and 3.52, respectively (Table 2). In contrast, MH-NADES exhibited a more pronounced acidic nature, with a pH of 2.43. These acidic properties inherent in honey and NADES have the potential to modulate the ionization process and solubility characteristics of ionizable compounds, such as 9HCO and 9MCO. The density of HN-1-NADES (1.39 g mL−1) was similar to that of natural honey (Table 2). Conversely, MH-NADES demonstrated a marginally lower density (1.37 g mL−1).| Sample | pH | Density (g mL−1) | Viscosity (cP) | Water content (%) |
|---|---|---|---|---|
| HN-1 | 3.77 ± 0.01 | 1.39 ± 0.01 | 44212.00 ± 0.02 |
2.10 ± 0.05 |
| HN-1-NADES | 3.52 ± 0.01 | 1.39 ± 0.02 | 8614.67 ± 0.58 | 7.62 ± 0.02 |
| MH-NADES | 2.43 ± 0.01 | 1.37 ± 0.02 | 1557.33 ± 0.58 | 11.55 ± 0.07 |
The water content was correlated with the viscosity characteristics of the eutectic mixture. Honey (HN-1) demonstrated the lowest water content (2.10%) and highest viscosity (44212.00 cP), whereas HN-1-NADES maintained a moderate water content (7.62%) and lower viscosity (8614.67 cP). Conversely, MH-NADES had the highest water content (11.55%) and lowest viscosity (1557.33 cP). Notably, while water content affects the viscosity of the eutectic mixture, the interaction between the eutectic components also plays a role.
DSC results revealed distinct endothermic peaks for glucose, fructose, and sucrose (Fig. 1). Broad endothermic peaks were observed for HN-1-NADES and HN-1 at temperatures lower than those of the individual sugars, which is characteristic of eutectic mixtures. Although a characteristic endothermic peak was observed for MH-NADES, its melting temperature remained lower than those of the constituent components.
 | ||
| Fig. 1 DSC curves for glucose, fructose, sucrose, and their NADESs, including MH-NADES, HN-1-NADES, and HN-1. The peaks above the baseline represent endothermic peaks. | ||
Honey exhibits several physicochemical properties consistent with its nature as an NADES.19 The viscosity of honey is inversely related to its water content, and decreases as the temperature increases. Both NADES and honey demonstrated a glass transition point between −50 and −60 °C, and neither substance exhibited a melting point, which imply eutectic characteristic.3
Chemical constituents of honey-treated EL
To explore the effects of honey in traditional medicine, EL treated with honey was subjected to comprehensive chemical analysis by HPLC-PDA (chromatograms of EL components shown in Fig. S1†). In addition, the simulation of the sugar-rich environment in MH-NADES was compared with that of natural honey.The results revealed that honey-treated EL formulations, including MH-NADES-treated EL, HN-1-treated EL, HN-2-treated EL, and HN-3-treated EL exhibited significantly higher yields of all compounds than the untreated EL extract (Table 3). Notably, HN-1-treated EL exhibited the highest yields of 9HCO (9.01 µg mg−1 dry weight) and 9MCO (16.08 µg mg−1 dry weight), whereas HN-2-treated EL showed the highest amount of EU (17.69 µg mg−1 dry weight) (Table 3).
| Extracts | Extraction yields (mean ± SD) | Chemical contenta (µg mg−1 crude extract) | ||
|---|---|---|---|---|
| EU | 9HCO | 9MCO | ||
| a The use of the same letters implies that there are no significant differences in the extraction yield of each compound, whereas different letters indicate significant differences when comparing the extracts. Statistical significance was determined using one-way analysis of variance, followed by the LSD test (p < 0.05). | ||||
| HN-1-treated EL | 86 mg | 16.13 ± 0.01b | 9.01 ± 0.04a | 16.08 ± 0.04a |
| HN-2-treated EL | 62 mg | 17.69 ± 0.27a | 8.03 ± 0.19b | 15.48 ± 0.30b |
| HN-3-treated EL | 113 mg | 12.95 ± 0.04c | 4.76 ± 0.01c | 8.41 ± 0.03d |
| MH-NADES-treated EL | 90 mg | 10.83 ± 0.02d | 2.51 ± 0.02e | 6.18 ± 0.04e |
| EL root | 49 mg | 10.40 ± 0.10e | 6.29 ± 0.10d | 14.67 ± 0.21c |
A significant increase in yield was observed for honey-treated EL. Both honey and MH-NADES possess unique physicochemical properties that contribute to the ability of NADESs to partially disrupt plant cell walls.20 Thus, treating EL with both honey and MH-NADES facilitated the microwave-assisted extraction of EL constituents (80% ethanol as solvent). Previously, when honey was used directly for extraction, it demonstrated superior performance compared to artificial honey mixtures in extracting bioactive compounds from propolis and showed potential as an alternative extractant to ethanol and water.21 An NADES that mimicked the composition of honey and contained glucose, fructose, sucrose, and water enhanced the extraction of flavonoids and saponins from A. radix.3 For Pueraria candollei var. mirifica root, a 50% (v/v) sugar-based NADES solution was an optimal solvent for daidzin extraction, and superior to honey, water, and ethanol.6 The extraction efficiency of honey is influenced by various factors, such as the honey–water ratio, extraction time, and nature of the target compound(s).6 An NADES involves hydrogen bond interactions between hydrogen bond donors and acceptors in the mixture.22 These hydrogen bond interactions contribute to the solubilization and extraction of target compounds from various sources, such as coffee husk waste and Chuanxiong-Honghua.23,24 An NADES comprising choline chloride, citric acid, glucose, and water was effective in extracting chemical components from EL, including EU, 9HCO, and 9MCO, yielding higher amounts than extractions with water and aqueous ethanol.16 Overall, NADESs have the capacity to disrupt cellular structures and facilitate the solubilization of compounds during the extraction process.
Stability of chemical constituents of honey-treated EL
The primary objective of this study was to assess the stability of three biomarkers, namely EU, 9HCO, and 9MCO, in MH-NADES and HN-1 at three different temperatures: 4, 30, and 40 °C. The stabilities of the two media were evaluated at these temperatures over various time periods (5, 9, 15, 30, 60, and 90 d).In MH-NADES and under storage conditions of 4 °C, the concentrations of all three compounds remained stable for up to 90 d, in contrast to those at temperatures of 30 and 40 °C. At 30 °C, EU and 9HCO levels increased after 30 d of storage, and 9MCO levels showed a slight increase at 60 d. At 40 °C, both EU and 9HCO levels significantly increased after 30 d. In contrast, 9MCO levels significantly decreased after 9 d, suggesting the degradation or conversion of other compounds (Table 4).
| Storage medium | Storage condition | Chemical content (µg mg−1 dry weight) | |||
|---|---|---|---|---|---|
| Temperature | Storage duration (day) | EU | 9HCO | 9MCO | |
| a The asterisk (*) indicates a significant difference in the chemical composition compared to that of the raw material. Statistical significance was determined using one-way analysis of variance, followed by the LSD test (p < 0.05). | |||||
| Raw material | — | 1.3355 ± 0.0326 | 0.2765 ± 0.0121 | 0.1119 ± 0.0107 | |
| MH-NADES | 4 °C | 5 | 1.3921 ± 0.0896 | 0.2789 ± 0.0077 | 0.1134 ± 0.0122 |
| 9 | 1.3629 ± 0.0399 | 0.2829 ± 0.0077 | 0.1220 ± 0.0071 | ||
| 15 | 1.1993 ± 0.0174* | 0.2572 ± 0.0114* | 0.0857 ± 0.0006* | ||
| 30 | 1.2997 ± 0.0039 | 0.2620 ± 0.0028* | 0.1070 ± 0.0011 | ||
| 60 | 1.2687 ± 0.0067 | 0.2540 ± 0.0037* | 0.1093 ± 0.0015 | ||
| 90 | 1.3318 ± 0.0051 | 0.2909 ± 0.0061* | 0.1154 ± 0.0022 | ||
| HN-1 | 4 °C | 5 | 1.3024 ± 0.0193 | 0.2688 ± 0.0187 | 0.1137 ± 0.0041 |
| 9 | 1.4731 ± 0.1529* | 0.2845 ± 0.0214 | 0.1319 ± 0.0213* | ||
| 15 | 1.0273 ± 0.0076* | 0.1745 ± 0.0014* | 0.0638 ± 0.0013* | ||
| 30 | 0.9866 ± 0.0007* | 0.1387 ± 0.0017* | 0.0587 ± 0.0027* | ||
| 60 | 0.9871 ± 0.0036* | 0.1464 ± 0.0050* | 0.0490 ± 0.0006* | ||
| 90 | 1.3050 ± 0.0020* | 0.2797 ± 0.0001 | 0.0996 ± 0.0005 | ||
| MH-NADES | 30 °C | 5 | 1.3973 ± 0.0398* | 0.2853 ± 0.0109 | 0.1231 ± 0.0081* |
| 9 | 1.2319 ± 0.0443* | 0.2178 ± 0.0037* | 0.0887 ± 0.0067* | ||
| 15 | 1.4016 ± 0.0186* | 0.2709 ± 0.0014 | 0.1175 ± 0.0020 | ||
| 30 | 1.5261 ± 0.0097* | 0.2917 ± 0.0024* | 0.1207 ± 0.0033 | ||
| 60 | 1.7485 ± 0.0134* | 0.3632 ± 0.0037* | 0.1308 ± 0.0019* | ||
| 90 | 1.8185 ± 0.0086* | 0.4202 ± 0.0014* | 0.1078 ± 0.0023 | ||
| HN-1 | 30 °C | 5 | 1.3065 ± 0.0279 | 0.2789 ± 0.0077 | 0.1100 ± 0.0048 |
| 9 | 1.1527 ± 0.0150* | 0.2347 ± 0.0056* | 0.0889 ± 0.0045* | ||
| 15 | 1.0829 ± 0.0003* | 0.2339 ± 0.0048* | 0.0758 ± 0.0007* | ||
| 30 | 1.2751 ± 0.0042* | 0.3431 ± 0.0014* | 0.1044 ± 0.0006 | ||
| 60 | 1.0863 ± 0.0029* | 0.2781 ± 0.0014 | 0.0677 ± 0.0006* | ||
| 90 | 1.2532 ± 0.0060* | 0.4363 ± 0.0042* | 0.0687 ± 0.0010* | ||
| MH-NADES | 40 °C | 5 | 1.4101 ± 0.0424* | 0.2612 ± 0.0014* | 0.1050 ± 0.0080 |
| 9 | 1.3721 ± 0.0285 | 0.2339 ± 0.0024* | 0.0786 ± 0.0049* | ||
| 15 | 1.3207 ± 0.0082 | 0.2211 ± 0.0028* | 0.0574 ± 0.0011* | ||
| 30 | 1.7076 ± 0.0056* | 0.3616 ± 0.0048* | 0.1121 ± 0.0017 | ||
| 60 | 1.3786 ± 0.0085* | 0.3415 ± 0.0014* | 0.0614 ± 0.0013* | ||
| 90 | 1.5047 ± 0.0080* | 0.4363 ± 0.0001* | 0.0823 ± 0.0010* | ||
| HN-1 | 40 °C | 5 | 1.4175 ± 0.0417* | 0.3785 ± 0.0087* | 0.1293 ± 0.0091* |
| 9 | 1.0053 ± 0.0098* | 0.2524 ± 0.0070* | 0.0544 ± 0.0019* | ||
| 15 | 1.2253 ± 0.0045* | 0.3544 ± 0.0048* | 0.0786 ± 0.0017* | ||
| 30 | 1.4296 ± 0.0059* | 0.4709 ± 0.0050* | 0.0904 ± 0.0020* | ||
| 60 | 1.2816 ± 0.0094* | 0.4524 ± 0.0091* | 0.0582 ± 0.0023* | ||
| 90 | 1.2758 ± 0.0204* | 0.4259 ± 0.0074* | 0.0580 ± 0.0028* | ||
Under honey storage conditions, the levels of EU, 9HCO and 9MCO decreased significantly after 15 d when stored at 4 °C. At 30 °C, the concentrations of all three compounds fluctuated over time. Initially, the EU and HCO levels decreased but then increased at later time points (90 d). At 40 °C, the EU content exhibited a stable trend. As 9HCO levels gradually increased, 9MCO levels gradually decreased (Table 4).
Previously, carnosic acid showed remarkable stability in a DES (menthol and lauric acid, 2:1 molar ratio), with only a 25% decrease in antioxidant activity after three months.25 Conversely, carnosic acid extracted with methanol was no longer detected after 15 d.25 NADESs containing sugars, including glucose, sucrose, and xylitol, enhanced the stability of carthamins derived from safflower under elevated temperature, exposure to light, and the NADES extended storage duration as compared with water or ethanol solutions.26 The stabilizing effects of citric acid–glucose NADES on curcuminoids derived from Curcuma longa were more evident at 80 °C compared with those of ethanol or methanol.27 The improved stability can be ascribed to hydrogen bond interactions between the NADES components and the phytochemicals that block degradation pathways. The extent of stabilization is influenced by the NADES components, pH, polarity, and water content.28
Overall, these findings demonstrate that MH-NADES is more effective than honey at stabilizing these biomarkers, particularly at lower temperatures. However, at higher temperatures, the biomarkers underwent significant concentration changes in both solvents, which may be indicative of degradation or conversion; therefore, further research is required. Honey is a naturally acidic substance with a pH that typically falls between 3.98 and 5.14.29 The acidity is primarily attributed to the presence of various organic acids, the most abundant of which is gluconic acid. This acid is produced by the enzyme glucose oxidase, which breaks down glucose. Other organic acids present in honey include acetic, citric, lactic, and malic acids.30 Notably, the pH of honey can vary depending on its floral and botanical origin because different nectars contain varying levels of acids. A low pH coupled with elevated temperatures may promote the degradation or conversion of EL constituents.
Honey and other NADESs have been suggested to enhance the solubility, extraction, and stability of plant metabolites.25–27 Honey is conventionally used as a natural NADES, it is also culturally and historically significant in traditional medicine. Although synthetic NADESs can be optimized for specific purposes, potentially offering greater control and consistency than natural honey, the application of synthetic NADESs and EL still necessitates a comprehensive evaluation of their safety implications.
Anti-inflammatory properties of honey-treated EL and honey constituents
In this study, EL root powder was immersed in honey for 90 d at 30 °C and then extracted with 80% aqueous ethanol. Obtained extracts were tested for anti-inflammatory properties.The viability assay demonstrated that the RAW264.7 cell death rate was greater than 20% when the concentration of the honey-treated EL extract was 400 µg mL−1 (Fig. 2A). To examine the inflammatory characteristics, concentrations ranging from 12.5 to 200 µg mL−1 were selected. L-NAME (400 µM), used as a positive control for NO production inhibition, inhibited NO secretion by 40.89 ± 1.12%. The inhibition of NO production by EL extracts was concentration-dependent. At a concentration of 12.5 µg mL−1, there were no significant differences in % NO inhibition between the samples. However, as the concentration increased to 25 µg mL−1, HN-1-treated EL exhibited higher % NO inhibition (24.70 ± 12.03%) than nontreated EL (16.84 ± 6.08%). The results of the study indicate that both HN-1-treated EL and nontreated EL (50 µg mL−1) displayed NO inhibition values of 31.78 ± 6.37% and 37.34 ± 6.29%, respectively. However, at 100 and 200 µg mL−1, untreated EL showed significantly higher NO inhibition than the other samples. NO inhibition by the MH-NADES- and HN-1-treated EL extracts was comparable and slightly lower than that of the untreated EL extract (Fig. 2B).
 | ||
| Fig. 2 (A) Cytotoxicity of honey-infused EL in RAW264.7 murine macrophage cells. (B) NO inhibition of honey-infused LPS-induced RAW264.7 murine macrophage cells. The same letters indicate no significant differences in the effects of each concentration. One-way analysis of variance was used to determine statistical significance, followed by LSD (p < 0.05). | ||
These results aligned with the stability test conducted with MH-NADES and HN-1, which demonstrated their ability to stabilize the components of the EL root and, hence, preserve their anti-inflammatory effects. Previously, at a concentration of 3.8 µM, 9HCO exhibited anti-inflammatory properties by inhibiting the NF-κB pathway.31 Furthermore, 9HCO can regulate the activity of PDE-5 at a concentration of 4.66 ± 1.13 µM.32 Both 9HCO and 9MCO demonstrated anti-inflammatory properties by inhibiting the production of NO and suppressing the expression of iNOS and COX-2 in LPS-stimulated macrophages.10 EU, a major quassinoid found in EL roots, exerted anti-inflammatory effects by inhibiting NO production and suppressing iNOS expression in LPS-stimulated macrophages.10
Overall, the anti-inflammatory effects were attributed to the presence of bioactive compounds, such as 9HCO, 9MCO, and EU, in the EL roots. These compounds inhibit NO production, suppress iNOS and COX-2 expression, and exert anti-inflammatory effects by inhibiting the NF-κB pathway. The infusion of EL into honey and MH-NADES effectively stabilized and preserved the anti-inflammatory components of EL roots.
The anti-inflammatory properties of the non-sugar fractions from different honey sources (HN-1-constituents, HN-2-constituents, and HN-3-constituents) were investigated. Concentrations ranging from 12.5 to 400 µg mL−1 were tested, and it was found that 400 µg mL−1 of HN-1-constituents resulted in cell death exceeding 20% (Fig. 3A). The anti-inflammatory properties of the constituents were evaluated at concentrations of 12.5 to 200 µg mL−1. At a concentration of 12.5 µg mL−1, no clear differences in the % NO inhibition were observed among the various constituents. However, as the concentration increased from 25 to 200 µg mL−1, HN-1-constituents exhibited significantly higher % NO inhibition (19.91–46.74%) than HN-2-constituents (1.8–11.84%) and HN-3-constituents (4.04–12.22%), as shown in Fig. 3B.
 | ||
| Fig. 3 (A) Cytotoxicity of nonsugar components isolated from three distinct honey sources (HN-1-constituents, HN-2-constituents, and HN-3-constituents), in RAW264.7 murine macrophage cells. (B) NO inhibition of HN-1-constituents, HN-2-constituents, and HN-3-constituents in LPS-induced RAW264.7 murine macrophage cells. The same letters indicate no significant differences in the effects of each concentration. One-way analysis of variance was used to determine statistical significance, followed by LSD (p < 0.05). | ||
Evaluation of the constituents revealed a positive correlation between the concentration and the percentage of NO inhibition. Honey contains non-sugar constituents, such as phenolic acids, including gallic, caffeic, p-coumaric, and sinapic acids, which exhibit anti-inflammatory properties.33–36 The flavonoids found in honey also contribute to its anti-inflammatory effect.33 HN-1 contained fewer phenolic compounds (Table 1) and exhibits stronger anti-inflammatory properties than HN-2 and HN-3. The differences in anti-inflammatory action among the HN-1-constituents, HN-2-constituents, and HN-3-constituents highlight the impact of the honey source on its composition and associated anti-inflammatory properties. Notably, the HN-1-treated EL extract demonstrated the strongest anti-inflammatory activity, which is consistent with the observed potency of the HN-1-constituents.
Honey has several pharmacological properties that make it a potential therapeutic agent for various diseases. The consumption of diluted natural honey can reduce the concentrations of prostaglandins such as PGE2, PGF2α, and thromboxane B2 in the plasma of normal individuals.37 According to previous studies, the phenolic compounds in honey play a pivotal role in exerting various pharmacological effects, rather than the sugar components.38
NADESs have not yet been approved for use in clinical trials. However, natural NADESs, such as honey, have been used by ancient civilizations, such as the Egyptians, Assyrians, Chinese, Greeks, and Romans, to treat gut wounds and diseases of the gut.39 This suggests that NADESs, like honey, have the potential for widespread use in medical and food applications. The phenolic content of honey varies depending on factors, such as the source and batch of honey. These variations can pose challenges when honey is used as a base for drug preparation.
As described in the previous section, honey infusion over a period of 90 d, in conjunction with the use of MH-NADES appeared to maintain and preserve the anti-inflammatory components of EL roots (Fig. 2). Additionally, the nonsugar constituents of honey exhibit anti-inflammatory properties (Fig. 3). Therefore, we investigated the anti-inflammatory effects of different matrices, including MH-NADES, HN1-NADES, and HN-1. EL extracts were prepared using the three solvents, with each solvent diluted at a ratio of 1:160 to maintain cell viability above 80%.
The highest concentration of EL extract (400 µg mL−1) increased cell viability in the presence of MH-NADES, H-NADES1, and HN-1 compared with the EL extract without the NADES. However, all EL extract samples spiked into MH-NADES, H-NADES1, and HN-1 exhibited lower NO inhibitory activity than the EL extract alone. At concentrations ranging from 50 to 100 µg mL−1, the EL extract combined with MH-NADES, H-NADES1, and HN-1 showed a much lower anti-inflammatory effect than the EL extract alone (Fig. 4). However, when the EL extract concentration was increased to 200 µg mL−1, the anti-inflammatory effect of the EL extract in combination with the three NADESs was slightly lower than that of the EL extract alone (Fig. 4). The NO inhibition ability of the EL extracts treated with MH-NADES, H-NADES1, and HN-1 showed no significant differences, implying that the nonsugar components of honey did not significantly influence the anti-inflammatory properties of EL.
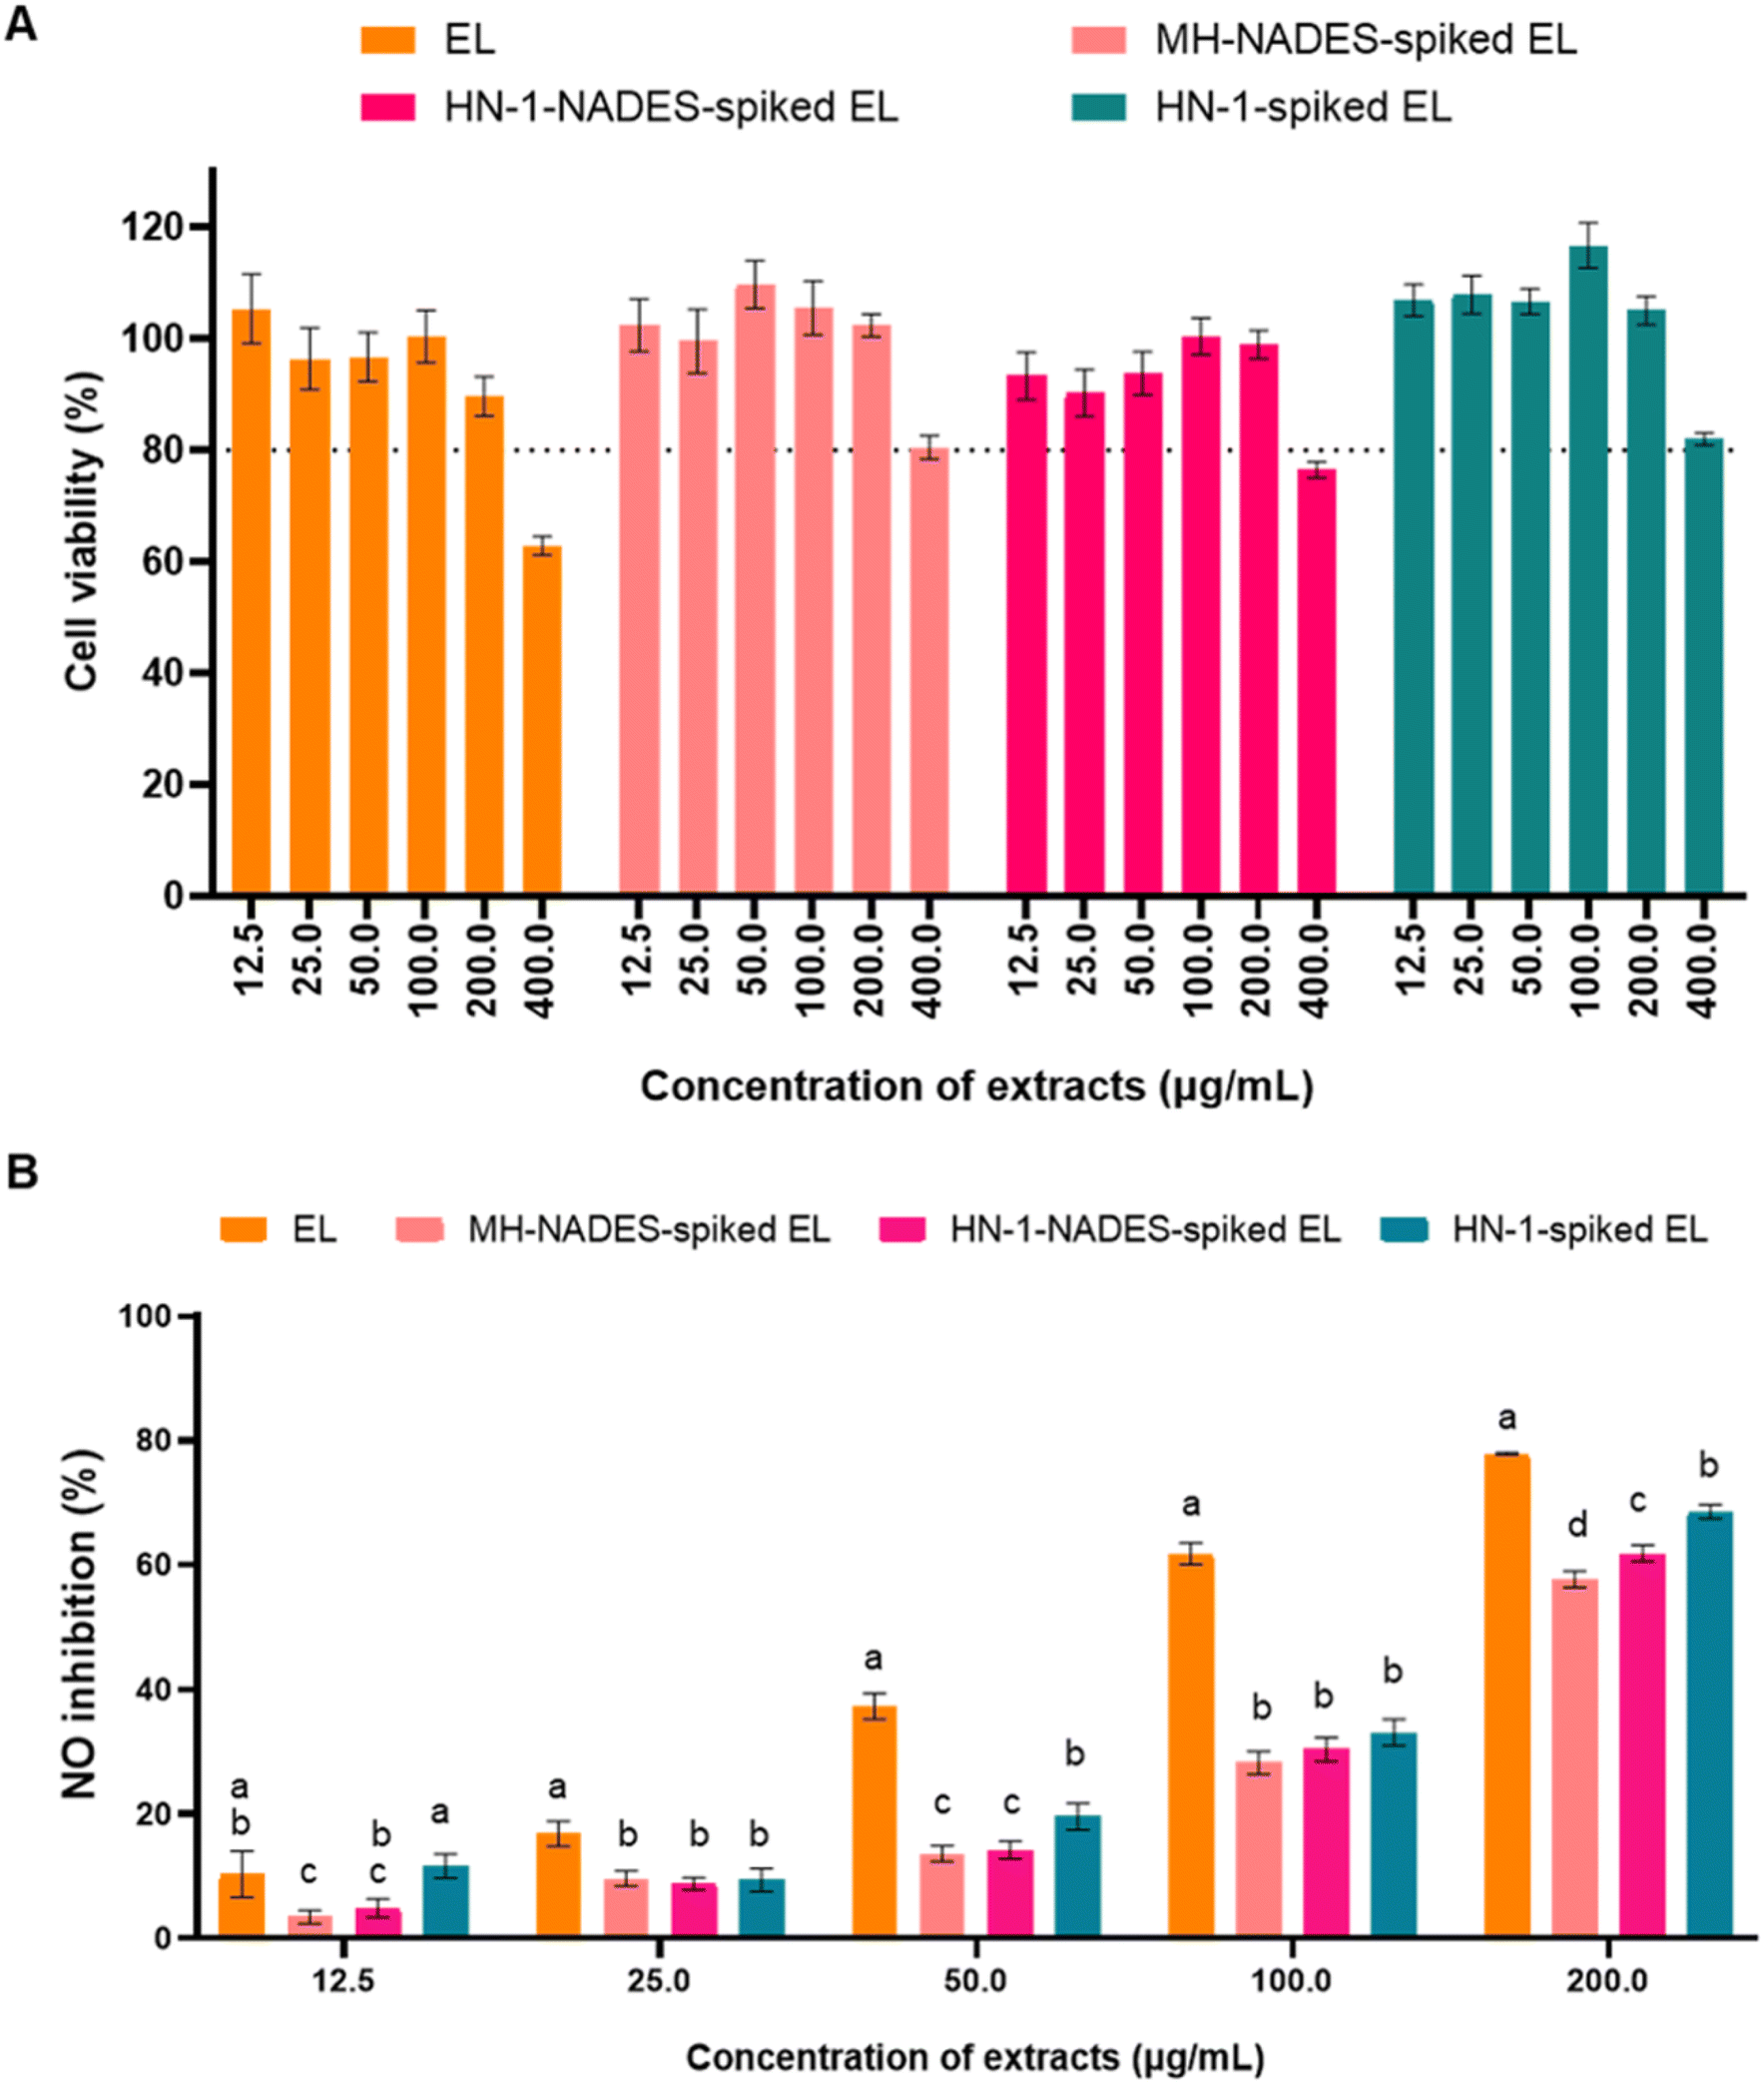 | ||
| Fig. 4 (A) Cytotoxicity of honey-spiked EL in RAW264.7 murine macrophage cells. (B) NO inhibition of honey-spiked in LPS-induced RAW264.7 murine macrophage cells. The same letters indicate no significant differences in the effects of each concentration. One-way analysis of variance was used to determine statistical significance, followed by LSD (p < 0.05). | ||
Both HN constituents and EL phytochemicals contribute inhibiting NO secretion in LPS-induced Raw264.7 macrophages. However, HN-1-, HN-2-, and HN-3-infused EL formulations (which combine EL compounds with honey constituents, Fig. 2) do not exhibit much higher NO inhibition than honey constituents alone (Fig. 3). For instance, untreated EL, HN-1-infused EL, and isolated HN-1-constituents demonstrated NO inhibition of 77.39, 68.73, and 46.74%, respectively, at the same concentration (200 µg mL−1). At the extract concentration of 200 µg mL−1, the combination of EL compounds with honey constituents lead to diluted final concentrations of bioactive compounds in HN-constituents and EL phytochemicals, resulting in no significant increase in NO inhibition in HN-infused EL formulations.
EL bioactive molecules with reactive functional groups (e.g., hydroxyl or methoxy groups in quassinoids like EU) may interact with phenolic compounds and flavonoids in honey through non-covalent interactions (e.g., hydrogen bonding, π–π stacking), altering their solubility, bioavailability, or accessibility to biological targets. Thus, specific interactions between the HN constituents and EL phytochemicals, such as synergism, combination, and antagonism, should be systematically investigated. The presence of NADESs (MH-NADES, H-NADES1, and HN-1) slightly enhanced cell viability, but reduced anti-inflammatory activity (Fig. 4). Previously, blueberry phenolic compounds extracted using a NADES showed a 140% increase in the bioavailability of anthocyanins compared with conventional solvent extraction.40 Curcumin, a poorly bioavailable compound, exhibited enhanced bioavailability when extracted and formulated using a NADES.41 Thus, EL extracted from honey should undergo further investigation in vivo to explore its bioavailability, safety, and efficacy.
In summary, treatment of EL roots with honey or NADESs can increase the extraction yield of key compounds such as EU, 9HCO, and 9MCO. This is due to the NADES-like properties of honey and its ability to disrupt the cell wall and solubilize target compounds from EL. The stabilities of EU, 9HCO, and 9MCO in honey and simulated NADES (MH-NADES) were also evaluated under various storage conditions (temperature and duration). Honey and MH-NADES can stabilize EU and 9HCO in an infusion formulation of EL. However, 9MCO gradually degrades after storage at high temperatures. After 90 d of infusion, the anti-inflammatory activity of HN-1-treated EL was slightly lower than that of the untreated EL extract. These results indicate that honey and NADES are suitable for preserving EL constituents. The anti-inflammatory properties of honey-treated EL extracts were assessed by measuring their ability to inhibit NO production in LPS-induced RAW264.7 macrophages. The isolated nonsugar constituents of honey exerted potent anti-inflammatory activity, although their content was not high enough to interfere with the anti-inflammatory effect when EL was spiked into honey and tested directly. This study presents a comprehensive evaluation of honey as a natural NADES for the extraction, stabilization, and preservation of bioactive compounds from EL, as well as its anti-inflammatory properties. This study bridges the gap between traditional medicinal practices and modern scientific understanding, potentially leading to the development of standardized and effective natural products.
Ethical compliance
The protocols below relate to the cell culture and treatment methods used in the research project “Chemical constituents and anti-inflammatory properties of the folk recipe and honey-infused recipes of Eurycoma longifolia Jack”. This study was approved by the Institutional Biosafety Committee of Walailak University. Approval under clearance no. WU-IBC-66-061 was effective from January 1, 2024, to December 31, 2025.Data availability
Data are available upon request from the authors.Author contributions
Chanakan Sitthisak: conceptualization, methodology, formal analysis, investigation, writing – original draft, visualization, funding acquisition; Juntratip Jomrit: methodology, resources, writing – review & editing; Warangkana Chunglok: methodology, resources, writing – review & editing; Waraporn Putalun: methodology, resources, writing – review & editing; Tripetch Kanchanapoom: methodology, resources, writing –review & editing; Thaweesak Juengwatanatrakul: methodology, resources, writing – review & editing; Gorawit Yusakul: conceptualization, methodology, formal analysis, resources, writing – review and editing, supervision, project administration, funding acquisition. All authors have approved the manuscript for publication.Conflicts of interest
The authors declare no competing final interest.Acknowledgements
This research was supported by Walailak University [Grant No. WU67213 and RSPG-WU-02/2567]. Furthermore, the authors acknowledge the support from the Hub of Knowledge in Microwave Heating and Applications, Walailak University, Nakhon Si Thammarat 80160, Thailand. During the preparation of this study, the author used https://chat.openai.com/ to improve readability and language. After using this tool/service, the authors reviewed and edited the content as required and took full responsibility for the publication.References
- S. U. Rehman, K. Choe and H. H. Yoo, Molecules, 2016, 21, 331 Search PubMed.
- R. Choonong, S. Ruangdachsuwan, T. Churod, S. Palabodeewat, S. Punyahathaikul, S. Juntarapornchai, K. Ketsuwan, J. Komaikul, P. Masrinoul, T. Kitisripanya, T. Juengwatanatrakul, G. Yusakul, T. Kanchanapoom and W. Putalun, J. Nat. Prod., 2022, 85, 2779–2788 CrossRef CAS PubMed.
- Y. Dai, R. Jin, R. Verpoorte, W. Lam, Y. C. Cheng, Y. Xiao, J. Xu, L. Zhang, X. M. Qin and S. Chen, J. Ethnopharmacol., 2020, 250, 112460 CrossRef CAS PubMed.
- S. Kumar, M. Verma, Y. A. Hajam and R. Kumar, Heliyon, 2024, 10, e23302 Search PubMed.
- L. Dimitriu, D. Constantinescu-Aruxandei, D. Preda, I. Moraru, N. E. Băbeanu and F. Oancea, Antioxidants, 2023, 12, 1678 CrossRef CAS PubMed.
- S. Phaisan, G. Yusakul, P. Nuntawong, S. Sakamoto, W. Putalun, S. Morimoto and H. Tanaka, Pharmacogn. Mag., 2020, 16, 524–530 CAS.
- D. M. Aronoff and E. G. Neilson, Am. J. Med., 2001, 111, 304–315 CrossRef CAS PubMed.
- F. S. Carneiro, R. C. Webb and R. C. Tostes, J. Sex. Med., 2010, 7, 3823–3834 CrossRef CAS PubMed.
- F. Giugliano, K. Esposito, C. Di Palo, M. Ciotola, G. Giugliano, R. Marfella, M. D'Armiento and D. Giugliano, J. Endocrinol. Invest., 2004, 27, 665–669 CrossRef CAS PubMed.
- J. Chaingam, R. Choonong, T. Juengwatanatrakul, T. Kanchanapoom, W. Putalun and G. Yusakul, Food Agric. Immunol., 2022, 33, 530–545 CrossRef CAS.
- S. Z. Hussein, K. Mohd Yusoff, S. Makpol and Y. A. Mohd Yusof, PLoS One, 2013, 8, e72365 CrossRef CAS PubMed.
- N. Kalantari, M. Ghasemi, M. Bayani and S. Ghaffari, Cytokine, 2016, 88, 85–90 CrossRef CAS PubMed.
- T. Kanchanapoom, R. Kasai, P. Chumsri, Y. Hiraga and K. Yamasaki, Phytochemistry, 2001, 56, 383–386 CrossRef CAS PubMed.
- C. Santos-Buelga and A. M. González-Paramás, in Bee Products - Chemical and Biological Properties, ed. J. M. Alvarez-Suarez, Springer International Publishing, Cham, 2017, ch. 3, pp. 43–82, DOI:10.1007/978-3-319-59689-1_3.
- S. Daher and F. O. Gulacar, J. Agric. Food Chem., 2008, 56, 5775–5780 CrossRef CAS PubMed.
- C. Sitthisak, M. Nisoa, W. Chunglok, A. Prasopthum, S. Phaisan, W. Putalun, T. Kanchanapoom, T. Juengwatanatrakul and G. Yusakul, Microchem. J., 2024, 196, 109676 CrossRef CAS.
- B. Olas, Nutrients, 2020, 12, 283 Search PubMed.
- A. Pascual-Maté, S. M. Osés, G. L. Marcazzan, S. Gardini, M. A. Fernández Muiño and M. Teresa Sancho, J. Food Compos. Anal., 2018, 74, 34–43 CrossRef.
- Y. Dai, Y. H. Choi and R. Verpoorte, Adv. Bot. Res., 2021, 97, 361–384 CAS.
- P. Jauregi, L. Esnal-Yeregi and J. Labidi, PeerJ Anal. Chem., 2024, 6, e32 CrossRef CAS.
- C. S. Funari, A. T. Sutton, R. L. Carneiro, K. Fraige, A. J. Cavalheiro, V. da Silva Bolzani, E. F. Hilder and R. D. Arrua, Food Res. Int., 2019, 125, 108559 CrossRef CAS PubMed.
- K. Wu, J. Ren, Q. Wang, M. Nuerjiang, X. Xia and C. Bian, Foods, 2022, 11, 3528 CrossRef CAS PubMed.
- A. Maimulyanti, I. Nurhidayati, B. Mellisani, F. A. R. Putri, F. Puspita and A. R. Prihadi, Arabian J. Chem., 2023, 16, 104634 Search PubMed.
- R.-S. Hu, L. Yu, S.-Y. Zhou, H.-F. Zhou, H.-T. Wan and J.-H. Yang, LWT, 2023, 184, 114991 Search PubMed.
- C. Vieira, S. Rebocho, R. Craveiro, A. Paiva and A. R. C. Duarte, Front. Chem., 2022, 10, 954835 CrossRef CAS PubMed.
- Y. Dai, R. Verpoorte and Y. H. Choi, Food Chem., 2014, 159, 116–121 CrossRef CAS PubMed.
- Y. Liu, J. Li, R. Fu, L. Zhang, D. Wang and S. Wang, Ind. Crops Prod., 2019, 140, 111620 CrossRef CAS.
- N. P. E. Hikmawanti, D. Ramadon, I. Jantan and A. Mun’im, Plants, 2021, 10, 2091 Search PubMed.
- M. Schiassi, V. R. de Souza, A. M. T. Lago, G. R. Carvalho, P. N. Curi, A. S. Guimaraes and F. Queiroz, J. Food Sci. Technol., 2021, 58, 4167–4177 Search PubMed.
- M. A. Rahman, M. M. Hossain and D. N. Barman, Honey, 2023, 102–112, DOI:10.1002/9781119113324.ch8.
- T. V. A. Tran, C. Malainer, S. Schwaiger, A. G. Atanasov, E. H. Heiss, V. M. Dirsch and H. Stuppner, J. Nat. Prod., 2014, 77, 483–488 CrossRef CAS PubMed.
- R. Choonong, J. Chaingam, R. Chantakul, S. Mukda, P. Temkitthawon, K. Ingkaninan, T. Juengwatanatrakul, G. Yusakul, T. Kanchanapoom and W. Putalun, Chem. Biodiversity, 2022, 19, e202200121 CrossRef CAS PubMed.
- Y. Ranneh, A. M. Akim, H. A. Hamid, H. Khazaai, A. Fadel, Z. A. Zakaria, M. Albujja and M. F. A. Bakar, BMC Complementary Med. Ther., 2021, 21, 30 CrossRef PubMed.
- L. Tribalat, O. Paisse, G. Dessalces and M. F. Grenier-Loustalot, Anal. Bioanal. Chem., 2006, 386, 2161–2168 CrossRef CAS PubMed.
- O. O. Erejuwa, S. A. Sulaiman and M. S. Ab Wahab, Molecules, 2012, 17, 4400–4423 CrossRef CAS PubMed.
- R. K. Kishore, A. S. Halim, M. N. Syazana and K. Sirajudeen, Nutr. Res., 2011, 31, 322–325 CrossRef CAS PubMed.
- N. S. Al-Waili and N. S. Boni, J. Med. Food, 2003, 6, 129–133 CrossRef CAS PubMed.
- A. Otmani, N. Amessis-Ouchemoukh, C. Birinci, S. Yahiaoui, S. Kolayli, M. S. Rodríguez-Flores, O. Escuredo, M. C. Seijo and S. Ouchemoukh, Food Biosci., 2021, 42, 101070 CrossRef CAS.
- T. Eteraf-Oskouei and M. Najafi, Iran. J. Basic Med. Sci., 2013, 16, 731–742 Search PubMed.
- D. T. da Silva, F. A. Smaniotto, I. F. Costa, J. Baranzelli, A. Muller, S. Somacal, C. S. Monteiro, M. Vizzotto, E. Rodrigues, M. T. Barcia and T. Emanuelli, Food Chem., 2021, 364, 130370 CrossRef CAS PubMed.
- S. A. Abouheif, S. M. Sallam, S. M. El Sohafy, F. F. Kassem and E. Shawky, Ind. Crops Prod., 2022, 189, 115790 CrossRef CAS.
Footnote |
| † Electronic supplementary information (ESI) available. See DOI: https://doi.org/10.1039/d4ra05005c |
| This journal is © The Royal Society of Chemistry 2025 |