
 Open Access Article
 This Open Access Article is licensed under a Creative Commons Attribution-Non Commercial 3.0 Unported Licence
Rate-dependent structure-electrochemistry relationships and origins of capacity fading in P2-type Na2/3Fe2/3Mn1/3O2†
Damian
Goonetilleke‡
 *a,
Begoña
Silvan§
bc,
Elena
Gonzalo
b,
Montserrat
Galcerán
b,
Montse
Casas-Cabanas
bd,
Maxim
Avdeev
ef,
François
Fauth
g,
Teófilo
Rojo
bh,
Neeraj
Sharma
a and
Damien
Saurel
*b
*a,
Begoña
Silvan§
bc,
Elena
Gonzalo
b,
Montserrat
Galcerán
b,
Montse
Casas-Cabanas
bd,
Maxim
Avdeev
ef,
François
Fauth
g,
Teófilo
Rojo
bh,
Neeraj
Sharma
a and
Damien
Saurel
*b
aSchool of Chemistry, UNSW Sydney, Sydney, NSW 2052, Australia. E-mail: damian.goonetilleke@eu.umicore.com
bCentre for Cooperative Research on Alternative Energies (CIC energiGUNE), Basque Research and Technology Alliance (BRTA), Alava Technology Park, Albert Einstein 48, 01510, Vitoria-Gasteiz, Spain. E-mail: dsaurel@cicenergigune.com
cDepartamento de Física de la Materia Condensada, Facultad de Ciencia y Tecnología, Universidad del País Vasco, UPV/EHU, Apdo 644, 48080 Bilbao, Spain
dIkerbasque Basque Foundation for Science, María Díaz de Haro 3, 48013, Bilbao, Spain
eAustralian Nuclear Science and Technology Organisation, New Illawarra Road, Lucas Heights, NSW 2234, Australia
fSchool of Chemistry, The University of Sydney, Sydney, NSW 2006, Australia
gCELLS – ALBA Synchrotron, E-08290 Cerdanyola del Vallès, Barcelona, Spain
hDepartamento de Química Orgánica e Inorgánica, Universidad del País Vasco UPV/EHU, P.O. Box. 644, 48080, Bilbao, Spain
First published on 14th February 2025
Abstract
Sodium transition metal oxides with layered structures have generated significant research interest as promising cathode materials for use in ambient temperature sodium-ion batteries. In this study, the structure and magnetic properties of P2-Na2/3Fe2/3Mn1/3O2 are investigated, in tandem with operando diffraction studies to resolve the structural changes taking place in the material when subject to variable current cycling in the range 1.5–4.2 V vs. Na+/Na0. Complementary diffraction studies are used to provide insight into the mechanism of sodium de-intercalation in P2-Na2/3Fe2/3Mn1/3O2 at low rates, as well as high current densities up to 1 C, enabled by the excellent time resolution allowed by high intensity synchrotron radiation. The structural evolution is found to differ markedly depending on the applied current density which illustrates the need to perform such structural studies under various applied current rates to better understand processes taking place in the electrode. The results obtained shed new light on the reaction mechanism of P2-type layered oxides and provide insight into some of the causes for their capacity fading.
1. Introduction
The successful commercialisation of various positive electrode materials with layered structures for use in lithium-ion batteries (LIBs) has proven that intercalation materials exhibiting these structures can offer high energy density, good capacities and long cycle life.1–5 A good understanding of the reaction pathways and structural evolution during cycling has proven key to overcoming issues with cycle life due to structural degradation after repeated (de-)intercalation reactions and therefore to avoid unfavourable reactions taking place.6–8 Sodium-ion batteries (SIBs) present a more economical and sustainable alternative to LIBs and there has similarly been significant interest in developing sodium transition metal oxide materials with layered structures for use in high-performance SIBs.9–11 Although SIBs will struggle to match the energy densities offered by LIBs, it is expected they would be favourable for use in larger-scale energy storage systems to support renewable energy sources where capacity per unit mass or volume is less of a concern.9,12,13A variety of different promising positive electrode materials have been reported for SIBs including layered transition metal oxides,10,14–18 polyanionic compounds such as sodium vanadium phosphates or fluorophosphates,19–22 Prussian blue analogues,23,24 and organic compounds.25–27 Among these candidates, the layered transition metal oxides, with formula NaxTMO2 (where TM is typically a transition metal or combination of transition metals), appear most promising in terms of performance and continue to generate significant interest from researchers.28–30 Materials in this system adopt numerous polytypes with different stacking arrangements of the metal–oxygen layers. These are typically denoted as P-type or O-type corresponding to whether Na+ is situated in a prismatic or octahedral coordination environment, respectively. The P2 (ABBA stacking), P3 (ABBCCA stacking) and O3 (ABCABC) polytype notation was first proposed by Delmas.31 Layered sodium metal oxides tend to exhibit limited cycling performance due to unfavourable structural changes such as transition metal (TM) migration, Na site ordering, and Jahn–Teller collective ordering, which occur as sodium is (de-)intercalated within the structure.32–34 As a consequence, significant research is devoted to the understanding of the structural evolution occurring in this class of materials in order to further improve their performance in SIBs.35 In P2-type materials sodium diffusion is more favourable than in O type phases, which gives rise to superior rate capability of the former compared to O3-type oxides.36–38 It is also known that O3 phases are less stable at high state of charge, inducing poorer reversibility and faster capacity fading upon cycling.39,40 This is believed to be related to TM migration to the tetrahedral vacancies in the Na interlayers, which is expected to be more pronounced for an O-type phase than P-type phase.41–45 In fact, the migration of TM ions in O-type phases is one of the main contributors to the poor capacity retention of these materials.46 Previous studies suggest that the P-type materials are not prone to TM migration, and thus when cycled to higher states of charge these materials will deliver a higher reversible capacity.45,47,48
Several ternary transition metal layered oxides have been investigated for SIBs including NaCoO2, NaNiO2, NaFeO2, and NaMnO2, which have similar high theoretical capacities of 243, 235, 241, and 243 mA h g−1 respectively, assuming reversible extraction of 1 Na. However, in practice these materials are reported to exhibit significantly lower reversible capacities of 70, 123, 80 and 197 mA h g−1, respectively.49–53 In these materials, the extraction of Na+ is associated with several structural transitions, some of which may be irreversible, leading to poor cycling stability and limited reversible capacities.54,55 These properties have, until now, limited their implementation in commercial SIBs as energy storage devices, and researchers continue to identify new, more complex quaternary or quintenary NaxTMO2 compounds, with several elements occupying the transition metal site, in order to manipulate the redox behaviour and structural stability of the electrode material and alleviate the issues mentioned above.53,56,57
In particular, Mn- or Fe-based oxides have attracted significant research interest as they offer high capacities as well as high natural abundance and non-toxicity of the resources.58–64 The O3-type NaFeO2 end member presents poor reversibility when de-sodiated to x(Na) < 0.5 (charged to >3.6 V), but reversible capacity can be improved by cycling in a narrower window of 2.5–3.4 V vs. Na+/Na0 (or until x(Na) ≈ 2/3), albeit with a relatively low capacity of 80 mA h g−1.51,65 The Na2/3Fe1/2Mn1/2O2 composition was first reported by Yabuuchi et al. and the P2-type and O3-type materials were found to deliver capacities of 190 mA h g−1 and 111 mA h g−1 respectively when cycled from 1.5–4.3 V vs. Na+/Na0. Various stoichiometries of Nax[FeyMn1−y]O2 have since been reported.40,66–69 However, the 3d transition metal ions MnIII and FeIV both elicit Jahn–Teller distortion effects in octahedral coordination environments, which can have a strong influence on Na+ mobility within the structure.70–72 The synthesis and characterisation of both P2-type and O3-type Na2/3Fe2/3Mn1/3O2 have also been reported and direct comparisons made between the two materials.68,73 Interestingly, despite differing initial capacities, both materials exhibited a reversible capacity of 122 mA h g−1 after 10 cycles which remained stable to the 15th cycle. Compared to MnIII/IV, the FeIII/FeIV redox couple offers a higher working voltage, improving energy density, and also enhanced Na diffusion through the Jahn–Teller activity of FeIV.73 Thus, the combination of these elements in appropriate ratios could give rise to a co-operative Jahn–Teller distortion, enabling greater reversible capacities to be achieved.74,75
In this study, P2-type Na2/3Fe2/3Mn1/3O2 is investigated first through the combination of X-ray and neutron diffraction to obtain a precise depiction of the initial structure. The structural evolution of this material during cycling is then studied using operando X-ray diffraction by incorporating these materials into electrodes for SIBs. Synchrotron radiation enables excellent time resolution and angular resolution to precisely model the structural changes taking place in the electrode material in real-time.76–78 The significant influence of current density on the observed reaction mechanisms has also been previously highlighted in studies regarding a variety of cathode materials.79–83 The material studied herein was subjected to cycling at low and at relatively high rates of up to 1 C over an extended voltage window of 1.5–4.2 V vs. Na+/Na0 to investigate the structural stability and structure-dependent rate capability of these materials. The results obtained shed new light on the reaction mechanism of P2-type layered oxides, providing insight into some of the causes for their capacity fading.
2. Experimental
P2-type Na2/3Fe2/3Mn1/3O2 (hereafter denoted P2-NFMO) was synthesized by the ceramic method as previously reported.73,84 In summary, a stoichiometric mixture of Na2CO3, Fe2O3, and Mn2O3 was ground in a planetary ball mill for 1 hour at 250 rpm with 12 mm diameter zirconia balls (1![[thin space (1/6-em)]](https://www.rsc.org/images/entities/char_2009.gif) :20 sample:balls weight ratio) and pressed into pellets. Then, the pellets were fired at 1000 °C for 12 hours under O2 flow with 1 bar of pressure, followed by slow cooling.
:20 sample:balls weight ratio) and pressed into pellets. Then, the pellets were fired at 1000 °C for 12 hours under O2 flow with 1 bar of pressure, followed by slow cooling.
Synchrotron X-ray diffraction (SXRD) data were collected at the materials science and powder diffraction (MSPD) beamline85 (ALBA Synchrotron, Barcelona, Spain). Data were collected in transmission geometry at a wavelength of λ = 0.82589 Å determined using the NIST 640d Silicon standard reference material.86 Prior to the operando experiment, SXRD data were collected from the as-synthesised powder which was packed into a glass capillary of outer diameter 0.5 mm.
Neutron diffraction (ND) data were collected using ECHIDNA, the high-resolution powder diffractometer at the open-pool Australian light-water (OPAL) reactor, Sydney, Australia.87 Data suitable for structural characterization were collected at a wavelength of λ ≈ 1.6217 Å. The as-synthesised powder was packed into a vanadium can of 9 mm diameter for data collection at temperatures ranging from 1.5 to 300 K. Diffraction patterns were collected in the angular range 6° < 2θ < 164°.
Magnetic measurements have been carried out using a quantum design physical properties measurement system (PPMS), equipped with an AC measurement system (ACMS) option. The zero-field cooled (ZFC) susceptibility measurements have been performed while heating from 2.5 to 300 K in an AC magnetic field of 10 Oe at a frequency of 1000 Hz, allowing the temperature to stabilize for each point. The field cooled (FC) susceptibility measurements have been performed in a similar manner to the ZFC measurements, cooling to 2.5 K under an applied DC magnetic field of 0.1 T followed by the procedure for the ZFC. The M(H) curves have been measured at constant temperature (2.5 K) with an applied external DC field ranging from −9 to 9 T. The samples have been measured in mildly packed powder form placed inside an airtight sample holder, surrounded by a pure He atmosphere. To avoid any exposure to moisture or air, the sample was loaded into the sample holder in an argon glove box and transferred to the PPMS sample chamber in an airtight container.
For operando electrochemical characterisation, the P2-NFMO active material was prepared into a positive electrode by mixing with Ketjen carbon black at the weight ratio of 80:20. The electrode is then incorporated into a custom-designed in situ cell equipped with beryllium (Be) window.88 The cell features Be windows, and a thin Al sheet is used to cover the positive electrode window, onto which 100–150 mg of electrode material is dispersed. This is followed by 2 sheets of glass-fibre separator and 1 M NaPF6 in ethylene carbonate:dimethyl carbonate (EC:DMC 1:1 wt%) electrolyte solution, before closing the cell with a Na metal counter electrode and stainless steel current collector.
Operando X-ray diffraction (XRD) data at slow rates were collected in reflection geometry using a lab-scale Bruker D8 Advance diffractometer equipped with a Cu anode (λCuKα = 1.5418 Å) and a LinxEye 1D detector. Slow-rate cycling was undertaken over a voltage window of 1.5–4.2 V vs. Na+/Na0 at C/20 (1 C was defined as 260 mA g−1), using a biologic potentiostat. Diffraction patterns were collected in the angular range 15° < 2θ < 50° with an acquisition time of 30 minutes. Operando SXRD data during cycling was collected using the same cell was used described above, but equipped with a Be window to allow collection in transmission geometry.89 The cell was cycled while collecting data with 40 seconds exposures in the angular range 0.3° < 2θ < 42°. The cell was subjected to variable current cycling (C/10–1 C) over a voltage window of 1.5–4.2 V vs. Na+/Na0 using a biologic potentiostat.
Processing, visualization and analysis of operando diffraction patterns was undertaken using the large array manipulation program (LAMP).90 Le Bail refinements were performed using the FullProf software suite.91 Rietveld refinements were performed using GSAS-II,92 and further details about the refined parameters and constraints are provided below and in the results and discussion section. Crystal structure illustrations were rendered using VESTA.93 Ionic form factors were chosen for all sites in the structural models refined against SXRD and ND. It should be noted that during the operando experiment, each diffraction pattern contains contributions (peaks, background, self-attenuation) from the electrode materials as well as electrochemically inactive phases such as the cell casing and current collectors. The operando data collected from the lab diffractometer were analysed using the Le Bail method, while the synchrotron data were analysed using Rietveld refinement as the significantly higher intensity and angular resolution enable more precise resolution of peaks from the active material. For sequential Rietveld refinements, the structural parameters of the electrochemically inactive phases were determined from the first dataset and then fixed. The peak profile functions, atomic parameters (including atomic coordinates, atomic occupancies, and atomic displacement parameters (ADPs)) of inactive phases and the background profile were also fixed to those obtained from the first dataset. The structural parameters of the active material allowed to refine include the lattice parameters and scale factors of each observed phase. For the P2 phase, the site occupancy factors (SOFs) of the sodium sites and positional parameter of the oxygen site (zO) were also allowed to refine.
3. Results and discussion
3.1 Structural characterisation
The fitting profiles resulting from Rietveld refinement of structural models against SXRD and ND patterns collected from P2-NFMO are shown in Fig. 1, and the corresponding refined structural parameters are detailed in Tables 1 and 2 respectively. The material adopts a structure with P63/mmc symmetry and was determined to have lattice parameters of a = 2.9408(1) Å and c = 11.1811(2) Å from the SXRD data. The P2-type structure contains two sodium sites, where the Na(1) site face shares and the Na(2) site edge shares with transition metal octahedra. The Na(1) and Na(2) sites are refined to have SOFs of 0.223(6) and 0.439(1), respectively, reaching a total Na amount per formula unit of 0.662(8), in good agreement with the target stoichiometry. Fe2O3 is also identified as minor impurity phase with a refined weight fraction of 5.9(2) wt%. Closer inspection of the 10° < 2θ < 20° region of the SXRD pattern reveals the presence of an additional reflection at 2θ ≈ 11° (d ≈ 4.4 Å), which can be attributed to presence of -type in-plane Na-vacancy ordering.94–97 A supercell model, involving both FeIII/MnIV and Na/vacancy ordering, has been predicted for P2-NFMO based on theoretical calculations.68 Several supercell models were trialled to account for the reflections observed here, see Fig. S1, S2 and Table S1 in the ESI.† Despite this, the supercell models adopting P63 symmetry still provided unsatisfactory fits (supercells #1–#3), especially due to the absence of additional superlattice reflections in the experimental SXRD data. A more satisfactory Le Bail fit was obtained using a Pm space group with a relative cell parameter of
  (supercell #4 in ESI†).
 | ||
| Fig. 1 Rietveld refinement profile of (a) SXRD data and (b) ND data collected from P2-NFMO. The diffraction data is represented as blue crosses, the calculated model in orange, and the difference profile is shown in cyan. The inset of figure (a) highlights the region 10.2° < 2θ < 19.5°. The arrow indicates the position of the superstructure reflection which was ascribed to Na vacancy ordering (2θ = 10.972°). The illustration of the P2-type unit cell shows the partially occupied Na sites, Na(1) in blue and Na(2) in yellow, while the transition metal octahedra are shown in magenta. The interlayer distance, labelled and referred to as ‘I’ in throughout the text, is defined as the distance between the sites of adjacent transition metal layers. | ||
| Atom | x | y | z | SOF | U iso/Å |
|---|---|---|---|---|---|
| R w = 6.34%, space group = P63/mmc, a = 2.9408(1) Å, c = 11.1811(2) Å. | |||||
| Na1 | 0 | 0 | 0.25 | 0.223(6) | 0.0450(50) |
| Na2 | 0.6667 | 0.3333 | 0.25 | 0.439(1) | 0.0104(28) |
| Mn | 0 | 0 | 0 | 0.333 | 0.00116(20) |
| Fe | 0 | 0 | 0 | 0.667 | 0.00116(20) |
| O | 0.3333 | 0.6667 | 0.0829(4) | 1.000 | 0.0030(11) |
| Atom | x | y | z | SOF | U iso/Å |
|---|---|---|---|---|---|
| R w = 4.61%, space group = P63/mmc, a = 2.9432(1) Å, c = 11.1827(3) Å. | |||||
| Na1 | 0 | 0 | 0.25 | 0.136(7) | 0.0080(37) |
| Na2 | 0.6667 | 0.3333 | 0.25 | 0.552(8) | 0.0438(16) |
| Mn | 0 | 0 | 0 | 0.379(3) | 0.0056(5) |
| Fe | 0 | 0 | 0 | 0.621(3) | 0.0056(5) |
| O | 0.3333 | 0.6667 | 0.0926(1) | 1.000 | 0.0101(3) |
The NPD data do not show any superstructure reflections, characteristic of honeycomb ordering on the transition metal sites, observed in, for instance in P2-type Na2/3Mn2/3Ni1/2O2, which results in symmetry lowering to the space group P63.98,99 This is not surprising since due to the close ionic radius of MnIV (0.53 Å) and FeIII (0.645 Å),100 also reducing the likelihood of Fe/Mn atomic ordering. Moreover, this also indicates that Na/vacancy ordering, evidenced by superstructure reflections in the SXRD data, is not driven by or coupled to Fe/Mn ordering in the TM layers. The NPD patterns collected above the Néel temperature (TN = 8 K, see Fig. S3†) of the material do not contain any extraneous reflections, see Fig. S8,† however the pattern collected at 3 K exhibits two new reflections at d ≈ 4.7 Å and 4.2 Å which may be attributed to long-range magnetic ordering in the material.
3.2 Operando diffraction studies at low rates
The evolution of operando XRD data collected during cycling of P2-NFMO at C/20 is shown in Fig. 2. Due to the compromise between angular range and signal/noise ratio, the evolution of the superstructure peak was not observed here, however its evolution is resolved below in the SXRD data. Initially, Na is extracted from the initial P2 phase via a solid solution mechanism as evidenced from the monotonous shifting of the reflections and absence of any phase transitions (until t ≈ 5 h). This coincides with the shift of the (00l) reflections to lower 2θ angles, indicating an expansion of the interlayer distance I, defined as the distance between transition metal sites along the c axis, as depicted in Fig. 1, from 5.63 Å to 5.70 Å. Meanwhile, the (100) peak shifts to higher 2θ angle, denoting in-plane compression of the a lattice parameter from 2.93 Å to 2.90 Å. These structural changes, common in layered oxides upon Na extraction, can be ascribed, respectively, to an increased electrostatic O–O repulsion between TM–O layers and a decreased TM-Na electrostatic repulsion within the layers.55,101–104 | ||
| Fig. 2 Evolution of diffraction data collected during cycling of P2-NFMO at a rate of C/20. Right panel: evolution of the cell voltage (black line) and Na content x(Na) (orange line), together with shaded area indicating the domain of existence of the P2 and Z phases – when two phases coexist the phase in brackets is the minority phase; purple arrows indicate the voltage drop ascribed to transition from FeIII/IV to MnIII/IV redox activity. Left panel: contour plot of the XRD pattern evolution. The peaks are indexed according to the P63/mmc space group. | ||
As the cell reaches ≈ 4.0 V vs. Na+/Na0 (x(Na) = 0.4, t = 5 h), an abrupt shift in position of the (002) reflection from 15.60° to 16.65° is observed, see Fig. 3a, indicating collapse of the interlayer distance from I = 5.70 to 5.15 Å (see Fig. 3b). During this period the (100) reflection evolution does not seem to be as affected, demonstrating that the change is mainly on the interlayer distance. As can be seen in Fig. 3, this sudden phase transition toward a new phase with a more compact structure occurs through a biphasic transformation mechanism. Previous studies have attributed this to the appearance of Na-poor O-type interlayers within the initial P-type structure through a gliding of the TMO6 oxide layers.40,73 If the resultant O–P stacking is ordered, the phase can be identified as OP4, while if the O–P stacking is aleatory, the phase is referred to as “Z”.105,106 The fact that only the (002) and (100) peaks of the newly formed phase are visible, with no appearance of any additional peaks, demonstrates that the stacking sequence of P and O interlayers follows a random pattern. The Le Bail refinements suggest that during this biphasic region the P2 phase presents a constant interlayer distance of 5.69 Å, see Fig. 3b and Fig. S4,† while that of the Z phase decreases from 5.35 Å to 5.25 Å, i.e., showing some degree of solid solution. Note that the interlayer distance determined for the Z phase (Fig. 3b) corresponds to an average over the O and P interlayers. Since the interlayer distance is related to the repulsive electrostatic O–O interaction, it will be higher for the direct oxygen stacking of the P-type interlayers than for the shifted stacking of the O-type interlayers, leading to an average interlayer distance that will be shorter for the Z phase compared to the P2 phase at same Na content.40 The changes in a are however small during the P2 → Z transformation, with very close values for the two separated phases, with a slight increase from 2.88 Å to 2.90 Å for the Z phase. Further Na extraction leads to a solid solution-type evolution of the Z phase, as indicated by the continuous shift of the peaks, see Fig. 2 and 3a, with the interlayer distance decreasing from I = 5.25 Å to 5.15 Å. At the same time, the in-plane parameter a evolves less drastically from 2.91 to 2.89 Å (see Fig. 3b).
 | ||
| Fig. 3 (a) Stacked representation of the XRD patterns at the vicinity of the main interlayer peak (002) during the low-rate (C/20) lab-scale operando XRD measurements of P2-NFMO. (b) Evolution of the P63/mmc unit cell parameter a and (c) interlayer distance I of P2-NFMO, determined from refinement of structural models against lab-scale XRD data (“Lab”, black/grey dots, Le Bail refinement) and synchrotron XRD data (“SR”, orange/red data points, Rietveld refinement). Up and down pointing triangles represent charge and discharge results, respectively. Sodium content x(Na) calculated from the measured charge delivered by the cell. | ||
At the end of the first charge cycle, when the P2 → Z transition is complete, the (002) peak of the Z phase is broader compared to the initial P2 phase, FWHMZ ≈ 0.3°–0.6° versus FWHMP2 ≈ 0.1°, see Fig. 3a. This indicates a partial loss of crystallinity, possibly due to inhomogeneous Na concentration combined with disorder in the O/P stacking sequence.105 Since the reflections get sharper again upon discharge one can exclude a possible loss of integrity of the particles as source of this peak broadening.
At first glance the phase evolution of P2-NFMO on the first charge appears reversible during the following discharge. While reversibility of P2 ↔ Z or P2 ↔ OP4 transitions has been previously observed in Na2/3Ni1/2Mn1/2O2 and Na2/3Ni1/3Mn2/3O2,107 closer examination of the data presented here reveals several irregularities between charge and discharge. For instance, while the P2 → Z transition occurs at x(Na) ≈ 0.35 upon charge, the reverse transition Z → P2 occurs at x(Na) ≈ 0.55 upon discharge. The latter concentration corresponds to the onset of MnIV→III redox activity, as revealed by a drop in the voltage-composition curve (indicated by a purple arrow in the right panel of Fig. 2). Indeed, according to previous studies,68,73,99,108 the lower voltage plateau (typically observed for x > 2/3) can be ascribed to MnIII/IV redox activity, while the higher voltage plateau (typically observed for x < 2/3) can be ascribed to the FeIII/IV redox activity. This means that most of the Na reinsertion (discharge) during the FeIV/III reaction occurs within the Z phase, while it occurs predominantly within the P2 phase upon initial Na extraction (charge). It also suggests that the change from FeIV→III to MnIV→III redox activity might be what triggers the Z → P2 transition upon Na reinsertion. The charge–discharge asymmetry of the transition can be also observed from the evolution of the cell parameters of the Z phase, as seen in Fig. 3b, which presents a clear hysteresis between charge and discharge, more pronounced than in the case of the P2 phase. Moreover, when the P2 phase re-appears upon discharge near x(Na) = 0.55, its interlayer distance is slightly shorter than upon charge at the same Na composition: 5.70 Å upon charge compared to 5.63 Å upon discharge. Finally, the Z → P2 transition upon discharge spans over a larger range of composition than the P2 → Z reaction during charge.
This charge–discharge asymmetry of the structural evolution is associated with differing reaction pathways which differ in their kinetics. This is also in agreement with the more pronounced slope of the voltage-composition profile upon discharge compared to the charge (see Fig. 2). Indeed, as can be seen in Fig. 3a, the peaks are broader during the P2 solid solution upon discharge compared to the charge (FWHM002(charge) ≈ 0.10° vs. FWHM002(discharge) ≈ 0.14°). This is indicative of a less homogeneous Na concentration, or microstructural changes such as O-type stacking faults inherited from the Z phase during the P2 → Z transition.105 Inhomogeneous Na concentration could be a consequence of sluggish kinetics, while the presence of O-type interlayers could be responsible for the kinetic degradation. Furthermore, in addition to the poorer diffusion of Na+ in O-type interlayers compared to P-type, previous studies suggest that O-type interlayers could be prone to Fe migration,44,105 which is not energetically favourable in a P-type structure.44,45 Therefore, discharge is likely to be more sluggish than charge in this material and this asymmetry is likely to affect subsequent cycles. Degraded electrochemical performance is to be expected when too much alkali metal is extracted upon charge from an O-type-stacking component in phases such as Z or OP.109,110
At the end of the discharge, the interlayer distance of the P2 phase is shorter than that of the initial P2 phase, as the contribution of the MnIV/III reaction allows a higher Na concentration (x(Na) = 0.72) to be reached compared to the as-synthesized composition (x(Na) ≈ 2/3), although full sodiation is not achieved. The incomplete sodiation can be correlated to the fact the P2 to O2 transition, commonly observed in P2 phases near complete sodiation,107 is not observed in the operando study. This is likely due to sluggish kinetics, as consequence of the irreversible structural degradation and/or asymmetric charge–discharge structural evolution mentioned above.
The irregularity between charge and discharge of the P2-phase and Z-phase concentration domains is in fact observed at all cycles, see Fig. 2. Likewise, during all cycles, the Z → P2 transition upon discharge occurs at the vicinity of the drop in the voltage-composition curve indicating change from the FeIV/III to MnIV/III reaction, confirming the correlation between the two phenomena. Fig. 4 shows XRD patterns collected at the charged state of the first four cycles and reveals that while the P2 → Z transition appears nearly complete at the end of the first cycle, it becomes less pronounced in the subsequent cycles and is no longer observed after the fourth charge cycle. Concomitantly, the amplitude of the change in x(Na), shown in the right panel of Fig. 2, also decreases progressively.
 | ||
| Fig. 4 Operando XRD patterns of P2-NFMO collected at the charged state during cycles 1 to 4. The shaded 2θ regions highlight the evolution of reflections originating from the P2-type and Z structures. | ||
To better understand the link between the observed phase transitions, Na content in the structure, and redox activity, Fig. 5a shows the differential capacity curve (dx/dE) of P2-NFMO. Three processes can be observed during charge: a broad peak at low voltage, which can be ascribed to the MnIII/IV redox activity, and two overlapping peaks at higher voltage which are ascribed to the FeIII/IV redox activity. A local minimum, indicated by the purple arrows, corresponds to the composition x(Na) ≈ 2/3 (Na2/3FeIII2/3MnIV1/3O2), which is ascribed to the transition from FeIII/IV to MnIII/IV redox activity. The FeIII/IV peak appearing at lower voltage is broad, while the one observed at higher voltage is sharp, as shown in Fig. 5a. According to the phase sequence observed in Fig. 2, these peaks in the dx/dE curve can be ascribed to the P2 solid solution and the P2 → Z transition, respectively. Upon discharge (cathodic FeIV/III activity), these two peaks are inverted, with the sharp peak observed at lower voltage, suggesting that Na is first extracted from the Z phase before the Z → P2 transition occurs. This agrees with what was concluded from the operando XRD analysis. As can be seen from Fig. 5b, while the average voltage of the P2 ↔ Z reaction remains constant with the number of cycles at 〈E〉 ≈ 3.58 ± 0.01 V vs. Na+/Na0, the related voltage hysteresis ΔE between Na insertion and extraction evolves within the range 0.79–0.98 V. ΔE first decreases from 0.9 to 0.79 V from cycle 1 to 2, and it continuously increases from cycle 2 (0.79 V vs. Na+/Na0) to cycle 4 (0.98 V vs. Na+/Na0). Because this reaction is very close to the cut-off voltage of 4.2 V vs. Na+/Na0, this increasing over polarization is possibly the reason why the Na concentration domain over which the Z phase is observed progressively shrinks upon cycling. This results in a decrease of the capacity related to the FeIII→IV reaction, see Fig. 5c, while that of the MnIII→IV reaction remains constant, leading to an overall capacity fading, as indicated by the progressive decrease of the amplitude of the Na concentration change in Fig. 2 (right panel). It should be noted that the loss of capacity for FeIII/IV reaction from the 1st to 2nd cycle is partially compensated by additional capacity provided by MnIII/IV during the first discharge, leading to an overall coulombic efficiency that is higher (90%) than the 67% that would be expected taking into account the initial stoichiometry, x(Na) = 0.67.
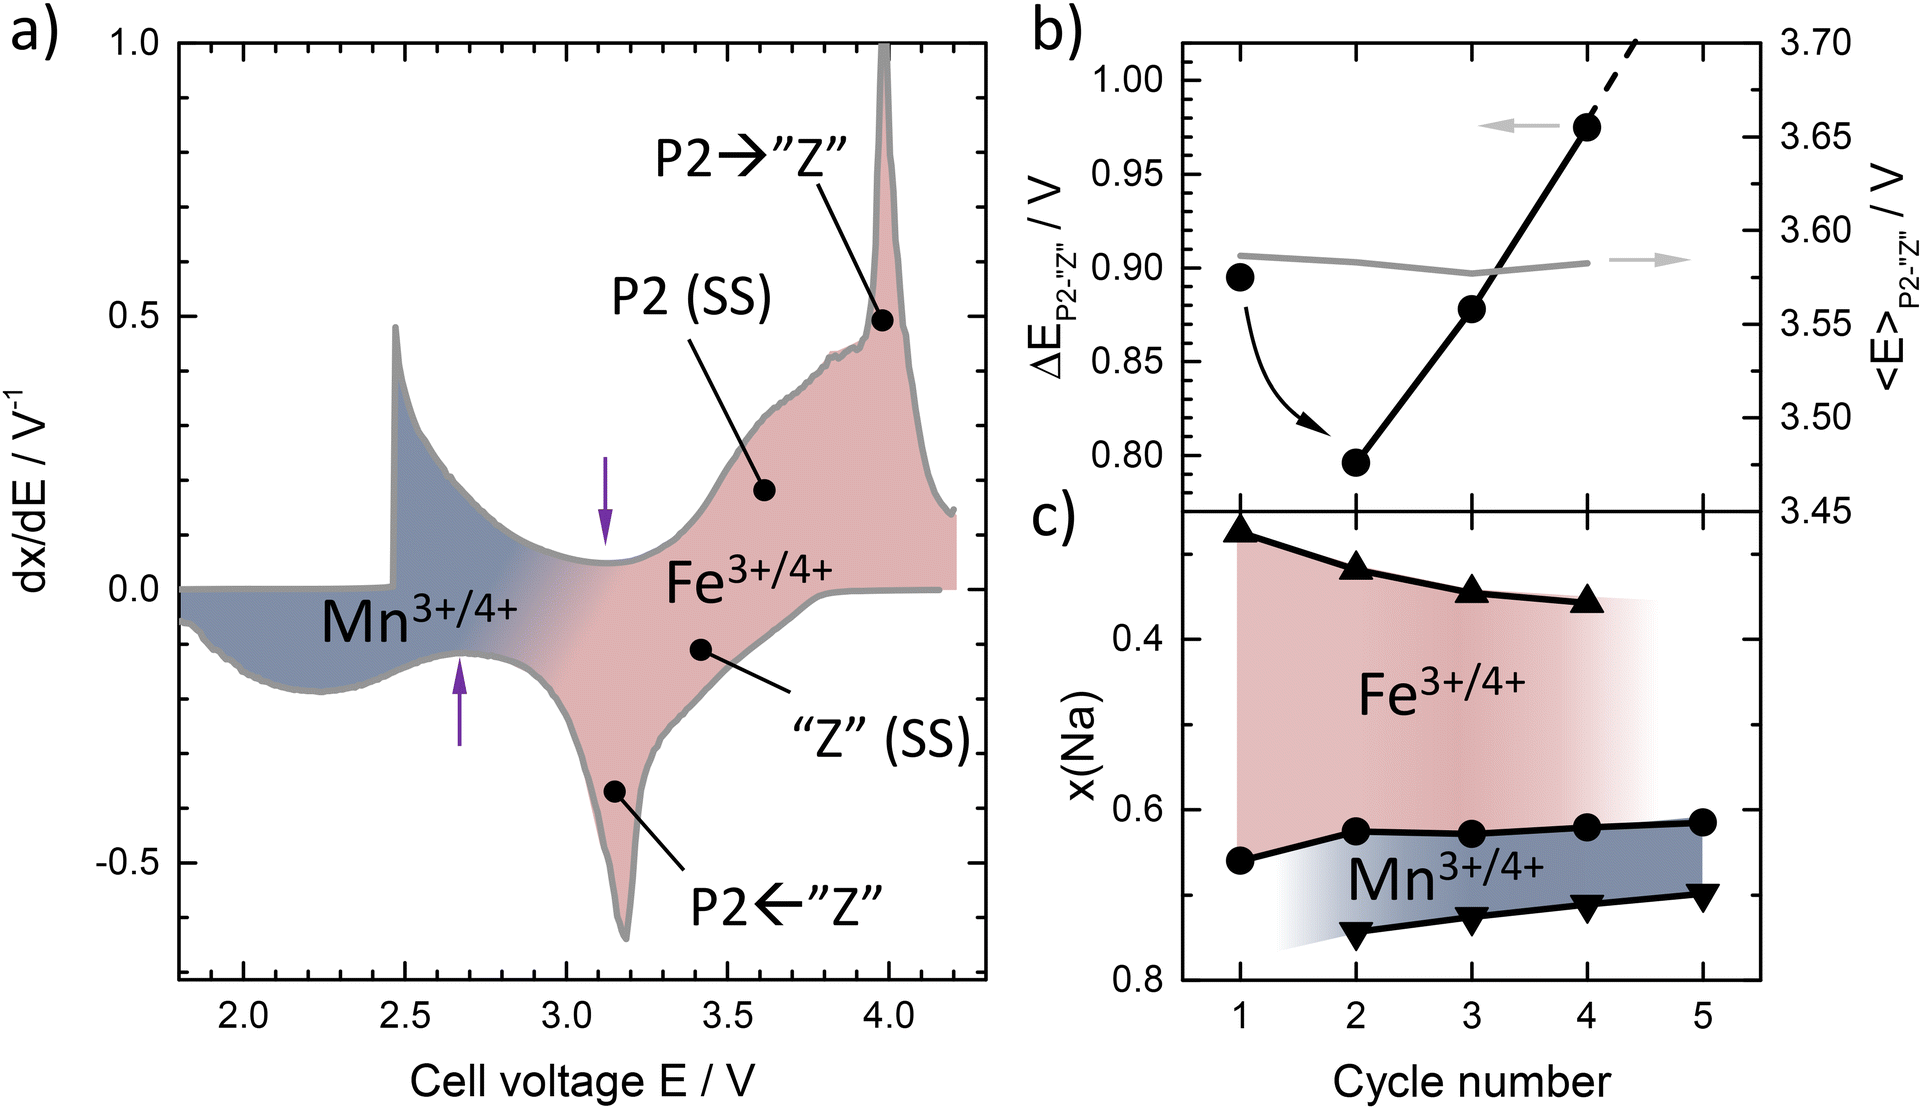 | ||
| Fig. 5 (a) Example of differential voltage-composition curve recorded at C/20 (second cycle) (b) Left axis: polarization between charge and discharge for the P2-Z reaction, determined as the difference in position of the peak ascribed to the P2-Z transition in the differential voltage-composition curve; Right axis: observed voltage of the P2-Z reaction, calculated as the average between charge and discharge of P2-Z peak position in the derivative voltage-composition curves. (c) Attribution of capacity (sodium content determined by electrochemistry) to Fe and Mn redox with successive cycles; upward triangles refer to end of charge, downward triangles refer to the end of previous discharge, and circle symbols correspond to the transition from Mn to Fe redox, as indicated by the purple arrow upon charge in panel (a). | ||
Interestingly, upon discharge, the XRD patterns recorded in the vicinity of the Fe to Mn redox activity transition, see Fig. 6, are all identical to each other in terms of peak position and peak width, but broader than that of the pristine material. This indicates that, although irreversible microstructural changes occur during the first cycle, the fading of the Fe redox activity observed for the next cycles is not related to any further detectable structural or microstructural degradation. Hence, the short term capacity loss of this material can be ascribed essentially to increasing overpotential or large voltage hysteresis of the P2 ↔ Z transition during the Fe redox process. The detrimental effect of phase transitions involving layers gliding for electrochemical performance has been already pointed out in this family of materials.105,111 This is however a surprising result as Jahn–Teller distortion induced by MnIII is expected to influence the redox activity and hence the structure, by inducing lattice strain and reducing Na ion mobility, and therefore is the main factor affecting cyclability in Mn-rich transition metal layered oxides.71,112–114 However, the observations presented here suggest that the onset of Fe redox activity contributes more strongly to initial capacity fading as it is most prominently observed during the initial cycles, coinciding with the P2 → Z transition. This transition may also involve the migration of Fe ions to the Na layer, which once migrated reduce the decay contribution from this transition during long-term cycling.115,116 Meanwhile, the Jahn–Teller activity of MnIII contributes more strongly to the long-term cycling stability of the material.117,118
 | ||
| Fig. 6 Selected lab-scale XRD patterns collected during discharge of P2-NFMO at C/20 recorded at cell voltage E ≈ 2.7 V, coinciding with the transition from Fe to Mn redox activity (x(Na) ≈ 2/3). The peaks of the P2 phase are indexed according to the P63/mmc space group. Peaks indicated by an (*) are due to inactive cell components. | ||
3.3 Operando diffraction studies at higher rates
Fig. 7 shows the evolution of the operando synchrotron SXRD data over time, correlated with the recorded cell voltage during variable current cycling ranging from C/10 to 1 C. The evolution of the reflections is very similar to that of the lab-scale operando XRD experiment. During charge, de-sodiation, the (002) and (004) reflections are again observed to move to lower angles, which correspond to an expansion of the lattice along the c-axis as sodium is removed. During discharge, the reflections also return to their original positions. The (100) and (102) reflections meanwhile are found to behave inversely but exhibit the same reversibility, which can be related to the inverse evolution of the a and c parameters during de-sodiation, see Fig. 8b. As the applied current increases, the capacity delivered by the cell decreases, and as expected a lower magnitude of structural expansion is observed with each cycle. The capacity decreases from 136 mA h g−1 at C/6 to 107 mA h g−1 at C/2. During high rate cycling at 1 C, the capacity drop is more severe, reducing successively over each cycle from 71 mA h g−1 to 42 mA h g−1, as depicted in Fig. S4.† | ||
| Fig. 7 The evolution of selected reflections during variable current cycling of the P2-NFMO. (a) (002), (b) (004), (100) and (102) (c) ‘ordering’ reflection. An overview of the full angular range is shown in Fig. S6.† | ||
 | ||
| Fig. 8 Refined structural parameters of the P2 phase determined from sequential Rietveld refinement of the operando SXRD data. (a) Unit cell volume (left axis) and cell voltage (right axis). (b) Interlayer distance I and in plane distance a. (c) Na occupancy in the two Na sites Na(1) and Na(2). (d) Total Na occupancy Na(1) + Na(2) from Rietveld and calculated Na content x(Na) in the electrode from electrochemical measurement (assuming an initial stoichiometry x(Na) = 0.67). Evolution of the a and c lattice parameters is shown in Fig. S6.† | ||
The results of peak fitting to the superstructure reflection at 2θ ≈ 11° (d ≈ 4.4 Å) is presented in Fig. 9. The superstructure reflection is observed to initially move to higher angles before diminishing in intensity by ≈40% at the end of the first charge cycle (see Fig. 7c). The fact that the superstructure reflection has retained ≈60% of its original intensity when the sodium content in the electrode is at a minimum demonstrates that the Na/vacancy ordering remains during the whole charge process. Beyond the end of the first charge and during all the following cycles, the intensity of the superstructure reflection remains constant, independent of the charge–discharge sequence and on Na content as well as lattice parameters of the P2 phase. This could indicate that part of the Na remains trapped in the structure in a persistent Na-vacancy ordering, and that the Na that reinserts into the structure is likely to be more disordered. From the comparison of these observations with the refined structural parameters of P2-NFMO during cycling, see Fig. 8, it can be observed that the intensity of the superstructure reflection drops when the occupancy of the Na(1) starts to decrease, at t ≈ 2 h, while the occupancy of the Na(2) starts to decrease from the beginning of the charge. This suggests that the Na/vacancy ordering maybe related to the Na(1) site. Interestingly, the Na(2) site is less occupied at the end of the first charge at C/6 than the Na(1) site.
 | ||
| Fig. 9 Integrated peak intensity and peak position of the superstructure reflection shown in Fig. 7c over the first 800 datasets (first charge–discharge cycle). | ||
The P2 → Z transition observed at the end of charge during the operando lab-scale XRD (Fig. 3a), and associated with a shrinking of the c parameter, is not observed in the SXRD after increasing the current density to C/10, compared to the C/20 rate used for lab-scale measurement. The higher rate used may induce larger overpotentials, causing the cell to reach the cut-off voltage of 4.2 V before the level of de-sodiation is sufficient to observe the P2 ↔ Z transition. Nonetheless, there are indirect indications that the transition might actually occur, or be very close to being initiated: (i) at the discharged state there is some evidence of a secondary phase which correlates to the stabilisation of the lattice parameters and sodium occupancy as shown in Fig. 8. (ii) Towards the end of the first discharge, t ≈ 6.7 h, a subtle fluctuation in the symmetry and intensity of 002 reflection is observed, see Fig. 7a, which coincides with a change in the slope of the electrochemical curve and a change in the rate of lattice parameter evolution. This behaviour has been previously observed in studies of P2-type materials, and may be attributed to an inhomogeneous transition rate within the electrode.67,119 As the current rate is increased, these features are smoothed out, which is consistent with the assumption that the appearance of the P2 → Z transition may be either rate dependent or dependent on the amount of sodium transferred to/from the electrode.
During the operando experiment the current density was increased successively with each cycle from C/6 to 1 C to investigate the higher rate behaviour of this material. Upon the 1st discharge at C/6 the c lattice parameter is found to reduce from 11.365(3) Å (I = 5.683 Å, 4.2 V vs. Na+/Na0) to 11.153(3) Å (I = 5.577 Å, 1.5 V vs. Na+/Na0), but returns to only 11.323(3) Å (I = 5.662 Å) upon the cell being recharged to 4.2 V vs. Na+/Na0 at C/3, see Fig. 8. At the highest current density of 1 C, the c lattice parameter is found to vary between ≈11.23 Å and ≈11.25 Å (I ≈ 5.615 Å and ≈5.625 Å) at the discharged and charged states respectively. Similarly, the atomic parameters exhibit less variation with increasing current density, in agreement with the reduced capacities observed at higher current, see Fig. S5.† The largest change in sodium content is observed during the first cycle at C/10–C/6, where it reduces from an initial value of 0.658(3) to 0.309(16) upon de-sodiation. When subsequently discharging at a higher current density of C/3 the total sodium content returns to a value of 0.658(8). Although there seems to be a good qualitative agreement between the refined Na occupancies and the sodium content estimated from electrochemical control, they progressively depart from each other while the rate increases. This could be due to inhomogeneous de-sodiation of the electrode at high current densities, as highlighted in Fig. 8c. Previous studies of Fe-substitution into Ni- and/or Mn-based sodium layered oxide materials have shown that the formation of the Z phase coincides with the onset of Fe redox activity,107,120 which is expected to occur at a potential of ≈4 V vs. Na+/Na on charge composition. This is consistent with the structural evolution observed here showing the onset of P2 > Z transition in this voltage region in the low-rate experiment (Fig. 3a and 5), as discussed earlier. Indeed, as shown in Fig. 8, there is good agreement in the low-rate region, however during the high rate region, the total sodium content varies between only ≈0.63 and ≈0.69. This is about one third of the Na concentration within the whole electrode, according to electrochemical control, which varies between ≈0.25 and ≈0.44. In the lab-experiment, evidence of a inhomogeneous Na distribution was identified and related to sluggish kinetics of Na diffusion after transition to the O-type structure, and additionally a more pronounced slope in the voltage profile upon discharge compared to charge, suggesting better kinetics upon sodiation than de-sodiation. This behaviour is observed again in the SXRD experiment, where the asymmetric (de-)sodiation kinetics become particularly prominent during the high-rate 1 C cycling. Better kinetics of the reverse sodiation reaction result in a gradual increase of the total refined sodium occupancy. The refined structural parameters, such as the a parameter and interlayer spacing d also show a asymmetric increase and decrease respectively to accommodate the increasing Na concentration in the structure. Further comparison with the data presented earlier in Fig. 3b and c, shows that the degree of reversibility of the structural changes occurring during the first cycle in the operando synchrotron SXRD experiment at C/10–C/6 is much higher than in the case of the lab-experiment at C/20. This further confirms that the P2 → Z transition, which was not observed in the “more reversible” synchrotron experiment, is detrimental for the reversibility of the electrochemical process and hence the performance of the material. Furthermore, the fact that this detrimental P2 → Z transition is prevented at higher rates explains the generally observed tendency of P2 layered oxides to present better cyclability as the rate increases.
4. Conclusions
P2-type Na2/3Fe2/3Mn1/3O2 has been successfully synthesized by the ceramic method, and its structure has been resolved by neutron and synchrotron X-ray powder diffraction. Neutron diffraction data confirm the absence of Fe–Mn ordering, while synchrotron diffraction data revealed Na-vacancy ordering as a superstructure peak observed at d ≈ 4.4 Å. Insights into the relationship between electrochemical performance and structural evolution in P2-NFMO have been presented based on the results of two experimental protocols.In the low-rate lab-scale experiment, a Z phase is observed to form in the second part of the charge as x(Na) reaches ≈ 0.4. This Z phase consists of disordered O- and P-type interlayers. The P2 → Z phase transition hence occurs through layer gliding, which leads to (over-)polarization in the electrochemical curve. This P2 → Z transition is partially reversible upon discharge, but the reverse Z → P2 transition does not occur until the drop in cell voltage at x(Na) ≈ 0.55. The P2 → Z and Z → P2 transitions were shown to be directly related to the change from Mn to Fe redox activity, i.e., the redox activity triggers the structural change and vice versa. In particular the P2 → Z phase transition has an associated over-polarization and thus the compositional range at which the Z phase is observed on charge progressively reduces as the cycle number increases, with the P2 phase being the main phase during the entire fourth cycle. The presence of the Z phase and associated Fe redox activity are identified as the main causes of irreversible capacity fading during the first cycles at C/20. The P2 → Z transition must thus be avoided by reducing the charge voltage for improved cyclability. In the variable rate SXRD experiment, it was found that the two Na sites in the P2-type structure exhibit selective extraction, one of them presenting Na/Vac ordering which is preserved during cycling, which presumably assists in the stabilization of the P2 phase upon Na extraction. The results herein shed new light on the structural evolution and reaction mechanism of P2-type Fe-, Mn-based sodium layered oxides during (de-)sodiation at current densities relevant for practical application and provide new insight into the causes of capacity fading and how this can be alleviated.
Data availability
The data supporting this article have been included as part of the ESI.† Additionally, crystallographic data for structures refined against data presented in the article have been previously reported and deposited in the ICSD repository and can be obtained from Coll. Codes 252021.Conflicts of interest
All authors declare they have no competing interests to disclose which could be perceived to influence the results and discussion reported in this paper.Acknowledgements
This worked was financially supported through the R&D project (No. PID2022-140823OB-I00), funded by MICIU/AEI/10.13039/501100011033 and by EDRF A Way of Making Europe, and by Gobierno Vasco/Eusko Jaurlaritza through the ELKARTEK project: CICe2024 and KK2024-00062. This work was also funded by the Australian Research Council through the Future Fellowship (FT200100707) and DP (DP200100959) programs. The authors acknowledge MSPD and the ALBA Synchrotron for the beamtime allocated under proposal 2016021566, and travel funding provided by the International Synchrotron Access Program (ISAP) managed by the Australian Synchrotron, part of ANSTO, and funded by the Australian Government. Dr Damian Goonetilleke acknowledges the support of the Australian Government Research Training Program (RTP) Scholarship. Dr Man Han and Begoña Acebedo are acknowledged for their support with the sample preparation.References
- P. Rozier and J. M. Tarascon, Review—Li-Rich Layered Oxide Cathodes for Next-Generation Li-Ion Batteries: Chances and Challenges, J. Electrochem. Soc., 2015, 162, A2490–A2499 CrossRef CAS.
- Y.-H. Luo, H.-X. Wei, L.-B. Tang, Y.-D. Huang, Z.-Y. Wang, Z.-J. He, C. Yan, J. Mao, K. Dai and J.-C. Zheng, Nickel-rich and cobalt-free layered oxide cathode materials for lithium ion batteries, Energy Storage Mater., 2022, 50, 274–307 CrossRef.
- C. Delmas, D. Carlier and M. Guignard, The layered oxides in lithium and sodium–ion batteries: a solid–state chemistry approach, Adv. Energy Mater., 2021, 11, 2001201 CrossRef CAS.
- A. Manthiram, A reflection on lithium-ion battery cathode chemistry, Nat. Commun., 2020, 11, 1550 CrossRef CAS.
- M. Li, J. Lu, Z. Chen and K. Amine, 30 Years of Lithium-Ion Batteries, Adv. Mater., 2018, 30, e1800561 CrossRef.
- D. Goonetilleke, J. H. Stansby and N. Sharma, In situ studies: electrochemistry and scattering, Curr. Opin. Electrochem., 2019, 15, 18–26 CrossRef CAS.
- J. Yang, S. Muhammad, M. R. Jo, H. Kim, K. Song, D. A. Agyeman, Y. I. Kim, W. S. Yoon and Y. M. Kang, In situ analyses for ion storage materials, Chem. Soc. Rev., 2016, 45, 5717–5770 RSC.
- Q. Shen, Y. Liu, L. Jiao, X. Qu and J. Chen, Current state-of-the-art characterization techniques for probing the layered oxide cathode materials of sodium-ion batteries, Energy Storage Mater., 2021, 35, 400–430 CrossRef.
- S. Mariyappan, Q. Wang and J. M. Tarascon, Will Sodium Layered Oxides Ever Be Competitive for Sodium Ion Battery Applications?, J. Electrochem. Soc., 2018, 165, A3714–A3722 CrossRef CAS.
- Q. Liu, Z. Hu, W. Li, C. Zou, H. Jin, S. Wang, S. Chou and S.-X. Dou, Sodium transition metal oxides: the preferred cathode choice for future sodium-ion batteries?, Energy Environ. Sci., 2021, 14, 158–179 RSC.
- K. Kubota, S. Kumakura, Y. Yoda, K. Kuroki and S. Komaba, Electrochemistry and Solid–State Chemistry of NaMeO2 (Me = 3d Transition Metals), Adv. Energy Mater., 2018, 8, 1703415 CrossRef.
- H. Pan, Y.-S. Hu and L. Chen, Room-temperature stationary sodium-ion batteries for large-scale electric energy storage, Energy Environ. Sci., 2013, 6, 2338 RSC.
- G. L. Soloveichik, Battery technologies for large-scale stationary energy storage, Annu. Rev. Chem. Biomol. Eng., 2011, 2, 503–527 CrossRef CAS PubMed.
- H. Su, S. Jaffer and H. Yu, Transition metal oxides for sodium-ion batteries, Energy Storage Mater., 2016, 5, 116–131 CrossRef.
- G.-L. Xu, R. Amine, Y.-F. Xu, J. Liu, J. Gim, T. Ma, Y. Ren, C.-J. Sun, Y. Liu, X. Zhang, S. M. Heald, A. Solhy, I. Saadoune, W. L. Mattis, S.-G. Sun, Z. Chen and K. Amine, Insights into the structural effects of layered cathode materials for high voltage sodium-ion batteries, Energy Environ. Sci., 2017, 10, 1677–1693 RSC.
- M. H. Han, E. Gonzalo, G. Singh and T. Rojo, A comprehensive review of sodium layered oxides: powerful cathodes for Na-ion batteries, Energy Environ. Sci., 2015, 8, 81–102 RSC.
- I. Hasa, D. Buchholz, S. Passerini and J. Hassoun, A comparative study of layered transition metal oxide cathodes for application in sodium-ion battery, ACS Appl. Mater. Interfaces, 2015, 7, 5206–5212 CrossRef CAS PubMed.
- S. Jia, E. Yao, R. Peng, A. Jonderian, M. Abdolhosseini and E. McCalla, Chemical Speed Dating: The Impact of 52 Dopants in Na–Mn–O Cathodes, Chem. Mater., 2022, 34, 11047–11061 CrossRef CAS.
- J. Barker, M. Saidi and J. Swoyer, A sodium-ion cell based on the fluorophosphate compound NaVPO4 F, Electrochem. Solid-State Lett., 2003, 6, A1–A4 CrossRef CAS.
- V. Palomares, P. Serras, H. Brand, T. Rojo and N. Sharma, Structural evolution of mixed valent (V 3+/V 4+) and V 4+sodium vanadium fluorophosphates as cathodes in sodium-ion batteries: comparisons, overcharging and mid-term cycling, J. Mater. Chem. A, 2015, 3, 23017–23027 RSC.
- P. Serras, V. Palomares, T. Rojo, H. E. Brand and N. Sharma, Structural evolution of high energy density V 3+/V 4+mixed valent Na 3 V 2 O 2x (PO 4) 2 F 3− 2x (x = 0.8) sodium vanadium fluorophosphate using in situ synchrotron X-ray powder diffraction, J. Mater. Chem. A, 2014, 2, 7766–7779 RSC.
- S. Park, J.-N. Chotard, D. Carlier, I. Moog, M. Duttine, F. Fauth, A. Iadecola, L. Croguennec and C. Masquelier, An Asymmetric Sodium Extraction/Insertion Mechanism for the Fe/V-Mixed NASICON Na4FeV(PO4)3, Chem. Mater., 2022, 34, 4142–4152 CrossRef CAS.
- Y. Lu, L. Wang, J. Cheng and J. B. Goodenough, Prussian blue: a new framework of electrode materials for sodium batteries, Chem. Commun., 2012, 48, 6544–6546 RSC.
- J. C. Pramudita, S. Schmid, T. Godfrey, T. Whittle, M. Alam, T. Hanley, H. E. Brand and N. Sharma, Sodium uptake in cell construction and subsequent in operando electrode behaviour of Prussian blue analogues, Fe [Fe (CN) 6] 1− x· y H 2 O and FeCo (CN) 6, Phys. Chem. Chem. Phys., 2014, 16, 24178–24187 RSC.
- W. Luo, M. Allen, V. Raju and X. Ji, An Organic Pigment as a High–Performance Cathode for Sodium–Ion Batteries, Adv. Energy Mater., 2014, 4, 1400554 CrossRef.
- S. Wang, L. Wang, Z. Zhu, Z. Hu, Q. Zhao and J. Chen, All Organic Sodium–Ion Batteries with Na4C8H2O6, Angew. Chem., 2014, 126, 6002–6006 CrossRef.
- J. Xiao, X. Li, K. Tang, D. Wang, M. Long, H. Gao, W. Chen, C. Liu, H. Liu and G. Wang, Recent progress of emerging cathode materials for sodium ion batteries, Mater. Chem. Front., 2021, 5, 3735–3764 RSC.
- J. Lamb and A. Manthiram, Synthesis Control of Layered Oxide Cathodes for Sodium-Ion Batteries: A Necessary Step Toward Practicality, Chem. Mater., 2020, 32, 8431–8441 CrossRef CAS.
- X. Gao, X. Zhang, X. Liu, Y. Tian, Q. Cai, M. Jia and X. Yan, Recent Advances for High–Entropy based Layered Cathodes for Sodium Ion Batteries, Small Methods, 2023, 7, 2300152 CrossRef CAS.
- C. Zhao, Q. Wang, Z. Yao, J. Wang, B. Sánchez-Lengeling, F. Ding, X. Qi, Y. Lu, X. Bai and B. Li, Rational design of layered oxide materials for sodium-ion batteries, Science, 2020, 370, 708–711 CrossRef CAS PubMed.
- C. Delmas, C. Fouassier and P. Hagenmuller, Structural classification and properties of the layered oxides, Physica B+C, 1980, 99, 81–85 CrossRef CAS.
- S. Guo, Y. Sun, J. Yi, K. Zhu, P. Liu, Y. Zhu, G.-Z. Zhu, M. Chen, M. Ishida and H. Zhou, Understanding sodium-ion diffusion in layered P2 and P3 oxides via experiments and first-principles calculations: a bridge between crystal structure and electrochemical performance, NPG Asia Mater., 2016, 8, e266 CrossRef CAS.
- L. Vitoux, M. Guignard, M. R. Suchomel, J. C. Pramudita, N. Sharma and C. Delmas, The NaxMoO2 Phase Diagram (1/2≤x < 1): An Electrochemical Devil's Staircase, Chem. Mater., 2017, 29, 7243–7254 CrossRef CAS.
- J. H. Stansby, N. Sharma and D. Goonetilleke, Probing the charged state of layered positive electrodes in sodium-ion batteries: reaction pathways, stability and opportunities, J. Mater. Chem. A, 2020, 8, 24833–24867 RSC.
- Y. Liu, Y.-H. Zhang, J. Ma, J. Zhao, X. Li and G. Cui, Challenges and Strategies toward Practical Application of Layered Transition Metal Oxide Cathodes for Sodium-Ion Batteries, Chem. Mater., 2023, 36, 54–73 CrossRef.
- Y. Mo, S. P. Ong and G. Ceder, Insights into Diffusion Mechanisms in P2 Layered Oxide Materials by First-Principles Calculations, Chem. Mater., 2014, 26, 5208–5214 CrossRef CAS.
- A. J. Toumar, S. P. Ong, W. D. Richards, S. Dacek and G. Ceder, Vacancy Ordering in O3-Type Layered Metal Oxide Sodium-Ion Battery Cathodes, Phys. Rev. Appl., 2015, 4, 064002 CrossRef.
- C. Zhao, Z. Yao, Q. Wang, H. Li, J. Wang, M. Liu, S. Ganapathy, Y. Lu, J. Cabana and B. Li, Revealing high Na-content P2-type layered oxides as advanced sodium-ion cathodes, J. Am. Chem. Soc., 2020, 142, 5742–5750 CrossRef CAS PubMed.
- J. W. Choi and D. Aurbach, Promise and reality of post-lithium-ion batteries with high energy densities, Nat. Rev. Mater., 2016, 1, 16013 CrossRef CAS.
- N. Yabuuchi, M. Kajiyama, J. Iwatate, H. Nishikawa, S. Hitomi, R. Okuyama, R. Usui, Y. Yamada and S. Komaba, P2-type Na x [Fe 1/2 Mn 1/2] O 2 made from earth-abundant elements for rechargeable Na batteries, Nat. Mater., 2012, 11, 512 CrossRef CAS PubMed.
- E. Talaie, V. Duffort, H. L. Smith, B. Fultz and L. F. Nazar, Structure of the high voltage phase of layered P2-Na2/3−z[Mn1/2Fe1/2]O2 and the positive effect of Ni substitution on its stability, Energy Environ. Sci., 2015, 8, 2512–2523 RSC.
- K. Kubota, I. Ikeuchi, T. Nakayama, C. Takei, N. Yabuuchi, H. Shiiba, M. Nakayama and S. Komaba, New Insight into Structural Evolution in Layered NaCrO2 during Electrochemical Sodium Extraction, J. Phys. Chem. C, 2015, 119, 166–175 CrossRef CAS.
- N. Yabuuchi, K. Kubota, M. Dahbi and S. Komaba, Research Development on Sodium-Ion Batteries, Chem. Rev., 2014, 114, 11636–11682 CrossRef CAS PubMed.
- L. Liu, X. Li, S.-H. Bo, Y. Wang, H. Chen, N. Twu, D. Wu and G. Ceder, High-Performance P2-Type Na2/3(Mn1/2Fe1/4Co1/4)O2Cathode Material with Superior Rate Capability for Na-Ion Batteries, Adv. Energy Mater., 2015, 5, 1500944 CrossRef.
- B. Silván, E. Gonzalo, L. Djuandhi, N. Sharma, F. Fauth and D. Saurel, On the dynamics of transition metal migration and its impact on the performance of layered oxides for sodium-ion batteries: NaFeO2 as a case study, J. Mater. Chem. A, 2018, 6, 15132–15146 RSC.
- S. Chu and S. Guo, From Rotten to Magical: Transition Metal Migration in Layered Sodium–Ion Battery Cathodes, Adv. Funct. Mater., 2024, 34, 2313234 CrossRef CAS.
- Y. Li, Y. Gao, X. Wang, X. Shen, Q. Kong, R. Yu, G. Lu, Z. Wang and L. Chen, Iron migration and oxygen oxidation during sodium extraction from NaFeO2, Nano Energy, 2018, 47, 519–526 CrossRef CAS.
- X. Zhang, S. Guo, P. Liu, Q. Li, S. Xu, Y. Liu, K. Jiang, P. He, M. Chen, P. Wang and H. Zhou, Capturing Reversible Cation Migration in Layered Structure Materials for Na–Ion Batteries, Adv. Energy Mater., 2019, 9, 1900189 CrossRef.
- A. K. Rai, L. T. Anh, J. Gim, V. Mathew and J. Kim, Electrochemical properties of NaxCoO2 (x∼ 0.71) cathode for rechargeable sodium-ion batteries, Ceram. Int., 2014, 40, 2411–2417 CrossRef CAS.
- P. Vassilaras, X. Ma, X. Li and G. Ceder, Electrochemical properties of monoclinic NaNiO2, J. Electrochem. Soc., 2013, 160, A207–A211 CrossRef CAS.
- N. Yabuuchi, H. Yoshida and S. Komaba, Crystal Structures and Electrode Performance of Alpha-NaFeO2 for Rechargeable Sodium Batteries, Electrochemistry, 2012, 80, 716–719 CrossRef CAS.
- X. Ma, H. Chen and G. Ceder, Electrochemical properties of monoclinic NaMnO2, J. Electrochem. Soc., 2011, 158, A1307–A1312 CrossRef CAS.
- J. H. Stansby, N. Sharma, M. Avdeev, H. E. A. Brand, B. Johannessen, E. Gonzalo, N. E. Drewett, N. Ortiz-Vitoriano and T. Rojo, P2-Na2/3Mn0.8M0.1M′0.1O2 (M = Zn, Fe and M′ = Cu, Al, Ti): A Detailed Crystal Structure Evolution Investigation, Chem. Mater., 2021, 33, 3905–3914 CrossRef CAS.
- Y. S. Meng, Doctor of Philosophy, Nanyang Technical University of Singapore, 2005.
- D. Goonetilleke, F. Riewald, A. O. Kondrakov, J. Janek, T. Brezesinski and M. Bianchini, Alleviating Anisotropic Volume Variation at Comparable Li Utilization during Cycling of Ni-Rich, Co-Free Layered Oxide Cathode Materials, J. Phys. Chem. C, 2022, 126, 16952–16964 CrossRef CAS.
- S. Wang, C. Sun, N. Wang and Q. Zhang, Ni- and/or Mn-based layered transition metal oxides as cathode materials for sodium ion batteries: status, challenges and countermeasures, J. Mater. Chem. A, 2019, 7, 10138–10158 RSC.
- H. Fatima, Y. Zhong, H. Wu and Z. Shao, Recent advances in functional oxides for high energy density sodium-ion batteries, Mater. Rep.: Energy, 2021, 1, 100022 CAS.
- E. Gonzalo, M. Zarrabeitia, N. E. Drewett, J. M. L. del Amo and T. Rojo, Sodium manganese-rich layered oxides: potential candidates as positive electrode for sodium-ion batteries, Energy Storage Mater., 2021, 34, 682–707 CrossRef.
- X. Wang, S. Roy, Q. Shi, Y. Li, Y. Zhao and J. Zhang, Progress in and application prospects of advanced and cost-effective iron (Fe)-based cathode materials for sodium-ion batteries, J. Mater. Chem. A, 2021, 9, 1938–1969 RSC.
- J. H. Stansby, W. M. Dose, N. Sharma, J. A. Kimpton, J. M. López del Amo, E. Gonzalo and T. Rojo, Structural evolution and electrochemistry of the Mn-Rich P2− Na2/3Mn0.9Ti0.05Fe0.05O2 positive electrode material, Electrochim. Acta, 2020, 341, 135978 CrossRef CAS.
- R. J. Clément, P. G. Bruce and C. P. Grey, Manganese-based P2-type transition metal oxides as sodium-ion battery cathode materials, J. Electrochem. Soc., 2015, 162, A2589 CrossRef.
- B. Peng, Z. Zhou, J. Shi, X. Huang, Y. Li and L. Ma, Earth–Abundant Fe–Mn–Based Compound Cathodes for Sodium–Ion Batteries: Challenges and Progress, Adv. Funct. Mater., 2024, 34, 2311816 CrossRef CAS.
- H. Kim, G. Yoon, I. Park, J. Hong, K.-Y. Park, J. Kim, K.-S. Lee, N.-E. Sung, S. Lee and K. Kang, Highly stable iron-and manganese-based cathodes for long-lasting sodium rechargeable batteries, Chem. Mater., 2016, 28, 7241–7249 CrossRef CAS.
- P. F. Wang, Y. You, Y. X. Yin and Y. G. Guo, Layered Oxide Cathodes for Sodium–Ion Batteries: Phase Transition, Air Stability, and Performance, Adv. Energy Mater., 2017, 8, 1701912 CrossRef.
- E. Lee, D. E. Brown, E. E. Alp, Y. Ren, J. Lu, J.-J. Woo and C. S. Johnson, New Insights into the Performance Degradation of Fe-Based Layered Oxides in Sodium-Ion Batteries: Instability of Fe3+/Fe4+ Redox in α-NaFeO2, Chem. Mater., 2015, 27, 6755–6764 CrossRef CAS.
- W. M. Dose, N. Sharma, J. C. Pramudita, J. A. Kimpton, E. Gonzalo, M. H. Han and T. Rojo, Crystallographic Evolution of P2 Na2/3Fe0.4Mn0.6O2 Electrodes during Electrochemical Cycling, Chem. Mater., 2016, 28, 6342–6354 CrossRef CAS.
- D. Goonetilleke, S. Wang, E. Gonzalo, M. Galcerán, D. Saurel, S. J. Day, F. Fauth, T. Rojo and N. Sharma, Exploring the rate dependence of phase evolution in P2-type Na2/3Mn0.8Fe0.1Ti0.1O2, J. Mater. Chem. A, 2019, 7, 12115–12125 RSC.
- N. A. Katcho, J. Carrasco, D. Saurel, E. Gonzalo, M. Han, F. Aguesse and T. Rojo, Origins of Bistability and Na Ion Mobility Difference in P2- and O3-Na2/3Fe2/3Mn1/3O2Cathode Polymorphs, Adv. Energy Mater., 2017, 7, 1601477 CrossRef.
- N. Sharma, E. Gonzalo, J. C. Pramudita, M. H. Han, H. E. A. Brand, J. N. Hart, W. K. Pang, Z. Guo and T. Rojo, The Unique Structural Evolution of the O3-Phase Na2/3Fe2/3Mn1/3O2during High Rate Charge/Discharge: A Sodium-Centred Perspective, Adv. Funct. Mater., 2015, 25, 4994–5005 CrossRef CAS.
- X. Li, Y. Wang, D. Wu, L. Liu, S.-H. Bo and G. Ceder, Jahn–Teller Assisted Na Diffusion for High Performance Na Ion Batteries, Chem. Mater., 2016, 28, 6575–6583 CrossRef CAS.
- A. Mendiboure, C. Delmas and P. Hagenmuller, Electrochemical intercalation and deintercalation of NaxMnO2 bronzes, J. Solid State Chem., 1985, 57, 323–331 CrossRef CAS.
- S. Kumakura, Y. Tahara, S. Sato, K. Kubota and S. Komaba, P′2-Na2/3Mn0.9Me0.1O2 (Me = Mg, Ti, Co, Ni, Cu, and Zn): Correlation between Orthorhombic Distortion and Electrochemical Property, Chem. Mater., 2017, 29, 8958–8962 CrossRef CAS.
- E. Gonzalo, M. H. Han, J. M. Lopez del Amo, B. Acebedo, M. Casas-Cabanas and T. Rojo, Synthesis and characterization of pure P2- and O3-Na2/3Fe2/3Mn1/3O2 as cathode materials for Na ion batteries, J. Mater. Chem. A, 2014, 2, 18523–18530 RSC.
- S. Kumakura, Y. Tahara, K. Kubota, K. Chihara and S. Komaba, Sodium and manganese stoichiometry of P2−type Na2/3MnO2, Angew. Chem., Int. Ed., 2016, 55, 12760–12763 CrossRef CAS PubMed.
- J. Xu, J. Chen, K. Zhang, N. Li, L. Tao and C.-P. Wong, Nax (Cu–Fe–Mn) O2 system as cathode materials for Na-ion batteries, Nano Energy, 2020, 78, 105142 CrossRef CAS.
- S.-M. Bak, Z. Shadike, R. Lin, X. Yu and X.-Q. Yang, In situ/operando synchrotron-based X-ray techniques for lithium-ion battery research, NPG Asia Mater., 2018, 10, 563–580 CrossRef.
- F. Lin, Y. Liu, X. Yu, L. Cheng, A. Singer, O. G. Shpyrko, H. L. Xin, N. Tamura, C. Tian, T. C. Weng, X. Q. Yang, Y. S. Meng, D. Nordlund, W. Yang and M. M. Doeff, Synchrotron X-ray Analytical Techniques for Studying Materials Electrochemistry in Rechargeable Batteries, Chem. Rev., 2017, 117, 13123–13186 CrossRef CAS PubMed.
- M. Morcrette, Y. Chabre, G. Vaughan, G. Amatucci, J. B. Leriche, S. Patoux, C. Masquelier and J. M. Tarascon, In situ X-ray diffraction techniques as a powerful tool to study battery electrode materials, Electrochim. Acta, 2002, 47, 3137–3149 CrossRef CAS.
- D. Goonetilleke, T. Faulkner, V. K. Peterson and N. Sharma, Structural evidence for Mg-doped LiFePO4 electrode polarisation in commercial Li-ion batteries, J. Power Sources, 2018, 394, 1–8 CrossRef CAS.
- D. Saurel, M. Galceran, M. Reynaud, H. Anne and M. Casas-Cabanas, Rate dependence of the reaction mechanism in olivine NaFePO4 Na-ion cathode material, Int. J. Energy Res., 2018, 42, 3258–3265 CrossRef CAS.
- Q. Liu, H. He, Z. F. Li, Y. Liu, Y. Ren, W. Lu, J. Lu, E. A. Stach and J. Xie, Rate-dependent, Li-ion insertion/deinsertion behavior of LiFePO4 cathodes in commercial 18650 LiFePO4 cells, ACS Appl. Mater. Interfaces, 2014, 6, 3282–3289 CrossRef CAS PubMed.
- L. Zou, W. Zhao, Z. Liu, H. Jia, J. Zheng, G. Wang, Y. Yang, J.-G. Zhang and C. Wang, Revealing cycling rate-dependent structure evolution in Ni-rich layered cathode materials, ACS Energy Lett., 2018, 3, 2433–2440 CrossRef CAS.
- N. Sharma, N. Tapia-Ruiz, G. Singh, A. R. Armstrong, J. C. Pramudita, H. E. Brand, J. Billaud, P. G. Bruce and T. Rojo, Rate dependent performance related to crystal structure evolution of Na0. 67Mn0. 8Mg0. 2O2 in a sodium-ion battery, Chem. Mater., 2015, 27, 6976–6986 CrossRef CAS.
- T. Matsumura, N. Sonoyama and R. Kanno, Synthesis, structure and electrochemical properties of layered material, Li2/3 [Mn1/3Fe2/3] O2, with mixed stacking states, Solid State Ionics, 2003, 161, 31–39 CrossRef CAS.
- F. Fauth, I. Peral, C. Popescu and M. Knapp, The new material science powder diffraction beamline at ALBA synchrotron, Powder Diffr., 2013, 28, S360–S370 CrossRef CAS.
- D. R. Black, D. Windover, A. Henins, D. Gil, J. Filliben and J. P. Cline, Certification of NIST Standard Reference Material 640d, Powder Diffr., 2010, 25, 187–190 CrossRef CAS.
- M. Avdeev and J. R. Hester, ECHIDNA: a decade of high-resolution neutron powder diffraction at OPAL, J. Appl. Crystallogr., 2018, 51, 1597–1604 CrossRef CAS.
- M. Galceran, D. Saurel, B. Acebedo, V. V. Roddatis, E. Martin, T. Rojo and M. Casas-Cabanas, The mechanism of NaFePO 4 (de) sodiation determined by in situ X-ray diffraction, Phys. Chem. Chem. Phys., 2014, 16, 8837–8842 RSC.
- D. Saurel, A. Pendashteh, M. Jáuregui, M. Reynaud, M. Fehse, M. Galceran and M. Casas-Cabanas, Experimental Considerations for Operando Metal–Ion Battery Monitoring using X–ray Techniques, Chem.: Methods, 2021, 1, 249–260 CAS.
- D. Richard, M. Ferrand and G. Kearley, Lamp, the large array manipulation program, J. Neutron Res., 1996, 4, 33–39 CrossRef.
- J. R. Carvajal, Recent development of the Program FULLPROF, Commission on Powder Diffraction (IUCr), Newsletter, 2001, 26, 12–19 Search PubMed.
- B. H. Toby and R. B. Von Dreele, GSAS-II: the genesis of a modern open-source all purpose crystallography software package, J. Appl. Crystallogr., 2013, 46, 544–549 CrossRef CAS.
- K. Momma and F. Izumi, VESTA: a three-dimensional visualization system for electronic and structural analysis, J. Appl. Crystallogr., 2008, 41, 653–658 CrossRef CAS.
- J. M. Paulsen, R. A. Donaberger and J. R. Dahn, Layered T2-, O6-, O2-, and P2-Type A2/3[M‘2+1/3M4+2/3]O2 Bronzes, A = Li, Na; M‘ = Ni, Mg; M = Mn, Ti, Chem. Mater., 2000, 12, 2257–2267 CrossRef CAS.
- N. Yabuuchi, R. Hara, K. Kubota, J. Paulsen, S. Kumakura and S. Komaba, A new electrode material for rechargeable sodium batteries: P2-type Na2/3[Mg0.28Mn0.72]O2 with anomalously high reversible capacity, J. Mater. Chem. A, 2014, 2, 16851–16855 RSC.
- E. Talaie, V. Duffort, H. L. Smith, B. Fultz and L. F. Nazar, Structure of the high voltage phase of layered P2-Na2/3(-z[Mn1/2Fe1/2]O2 and the positive effect of Ni substitution on its stability, Energy Environ. Sci., 2015, 8, 2512–2523 RSC.
- J. Xu, D. H. Lee, R. J. Clement, X. Q. Yu, M. Leskes, A. J. Pell, G. Pintacuda, X. Q. Yang, C. P. Grey and Y. S. Meng, Identifying the Critical Role of Li Substitution in P2-Na-x LiyNizMn1-y-z O-2 (0<x, y, z < 1) Intercalation Cathode Materials for High-Energy Na-Ion Batteries, Chem. Mater., 2014, 26, 1260–1269 CrossRef CAS.
- A. Gutierrez, W. M. Dose, O. Borkiewicz, F. Guo, M. Avdeev, S. Kim, T. T. Fister, Y. Ren, J. Bareño and C. S. Johnson, On Disrupting the Na+-Ion/Vacancy Ordering in P2-Type Sodium–Manganese–Nickel Oxide Cathodes for Na+-Ion Batteries, J. Phys. Chem. C, 2018, 122, 23251–23260 CrossRef CAS.
- B. M. de Boisse, Structural and Electrochemical studies of NaxMn1-yFeyO2 and NaNiO2 materials as positive electrode for Na-ion batteries, Doctoral dissertation, Université de Bordeaux, 2014 Search PubMed.
- R. D. Shannon, Revised Effective Ionic-Radii and Systematic Studies of Interatomic Distances in Halides and Chalcogenides, Acta Crystallogr., Sect. A, 1976, 32, 751–767 CrossRef.
- D. Goonetilleke, N. Sharma, W. K. Pang, V. K. Peterson, R. Petibon, J. Li and J. R. Dahn, Structural Evolution and High-Voltage Structural Stability of Li(NixMnyCoz)O2 Electrodes, Chem. Mater., 2018, 31, 376–386 CrossRef.
- J. N. Reimers and J. R. Dahn, Electrochemical and In Situ X–Ray Diffraction Studies of Lithium Intercalation in Li x CoO2, J. Electrochem. Soc., 1992, 139, 2091–2097 CrossRef CAS.
- Z. Lu and J. Dahn, In Situ X-Ray Diffraction Study of P 2 Na2/3 [Ni1/3Mn2/3] O 2, J. Electrochem. Soc., 2001, 148, A1225–A1229 CrossRef CAS.
- W. Li, H. Y. Asl, Q. Xie and A. Manthiram, Collapse of LiNi1- x- yCo xMn yO2 Lattice at Deep Charge Irrespective of Nickel Content in Lithium-Ion Batteries, J. Am. Chem. Soc., 2019, 141, 5097–5101 CrossRef CAS PubMed.
- J. W. Somerville, A. Sobkowiak, N. Tapia-Ruiz, J. Billaud, J. G. Lozano, R. A. House, L. C. Gallington, T. Ericsson, L. Haggstrom, M. R. Roberts, U. Maitra and P. G. Bruce, Nature of the “Z”-phase in layered Na-ion battery cathodes, Energy Environ. Sci., 2019, 12, 2223–2232 RSC.
- J. Feng, S.-H. Luo, L. Qian, S. Yan, Q. Wang, X. Ji, Y. Zhang, X. Liu, P. Hou and F. Teng, Properties of the “Z”-Phase in Mn-Rich P2-Na0.67Ni0.1Mn0.8Fe0.1O2 as Sodium-Ion-Battery Cathodes, Small, 2023, 2208005 CrossRef CAS PubMed.
- H. Liu, X. Gao, J. Chen, J. Gao, S. Yin, S. Zhang, L. Yang, S. Fang, Y. Mei and X. Xiao, Reversible OP4 phase in P2−Na2/3Ni1/3Mn2/3O2 sodium ion cathode, J. Power Sources, 2021, 508, 230324 CrossRef CAS.
- B. Mortemard de Boisse, J. H. Cheng, D. Carlier, M. Guignard, C. J. Pan, S. Bordère, D. Filimonov, C. Drathen, E. Suard, B. J. Hwang, A. Wattiaux and C. Delmas, O3−NaxMn1/3Fe2/3O2 as a positive electrode material for Na-ion batteries: structural evolutions and redox mechanisms upon Na+ (de)intercalation, J. Mater. Chem. A, 2015, 3, 10976–10989 RSC.
- A. R. Armstrong, N. Dupre, A. J. Paterson, C. P. Grey and P. G. Bruce, Combined Neutron Diffraction, NMR, and Electrochemical Investigation of the Layered-to-Spinel Transformation in LiMnO2, Chem. Mater., 2004, 16, 3106–3118 CrossRef CAS.
- J. Cabana, S.-H. Kang, C. S. Johnson, M. M. Thackeray and C. P. Grey, Structural and electrochemical characterization of composite layered-spinel electrodes containing Ni and Mn for Li-ion batteries, J. Electrochem. Soc., 2009, 156, A730–A736 CrossRef CAS.
- Y. Sun, S. Guo and H. Zhou, Adverse effects of interlayer-gliding in layered transition-metal oxides on electrochemical sodium-ion storage, Energy Environ. Sci., 2019, 12, 825–840 RSC.
- A. Caballero, L. Hernan, J. Morales, L. Sanchez, J. S. Pena and M. Aranda, Synthesis and characterization of high-temperature hexagonal P2-Na 0.6 MnO 2 and its electrochemical behaviour as cathode in sodium cells, J. Mater. Chem., 2002, 12, 1142–1147 RSC.
- J. Billaud, G. Singh, A. R. Armstrong, E. Gonzalo, V. Roddatis, M. Armand, T. Rojo and P. G. Bruce, Na 0.67 Mn 1− x Mg x O 2 (0≤x≤ 0.2): a high capacity cathode for sodium-ion batteries, Energy Environ. Sci., 2014, 7, 1387–1391 RSC.
- M. H. Han, E. Gonzalo, N. Sharma, J. M. López del Amo, M. Armand, M. Avdeev, J. J. Saiz Garitaonandia and T. F. Rojo, High-Performance P2-Phase Na2/3Mn0. 8Fe0. 1Ti0. 1O2 Cathode Material for Ambient-Temperature Sodium-Ion Batteries, Chem. Mater., 2015, 28, 106–116 CrossRef.
- W. Zhao, S.-H. Luo, L. Qian, R. Huang, G. Wang, H. Zhang, G. Hao and S. Yan, Suppressed P2-Z phase transition and Fe-migration in Na layered of Fe/Mn-based layered oxide cathode for advanced sodium-ion batteries, J. Mater. Chem. C, 2025 10.1039/D4TC04961F.
- T. Lan, W. Wei, S. Xiao, G. He and J. Hong, P2-type Fe and Mn-based Na0.67Ni0.15Fe0.35Mn0.3Ti0.2O2 as cathode material with high energy density and structural stability for sodium-ion batteries, J. Mater. Sci.: Mater. Electron., 2020, 31, 9423–9429 CrossRef CAS.
- D. Zhou, C. Zeng, J. Xiang, T. Wang, Z. Gao, C. An and W. Huang, Review on Mn-based and Fe-based layered cathode materials for sodium-ion batteries, Ionics, 2022, 28, 2029–2040 CrossRef CAS.
- Z. Xiao, F. Xia, L. Xu, X. Wang, J. Meng, H. Wang, X. Zhang, L. Geng, J. Wu and L. Mai, Suppressing the Jahn–Teller Effect in Mn–Based Layered Oxide Cathode toward Long–Life Potassium–Ion Batteries, Adv. Funct. Mater., 2021, 32, 2108244 CrossRef.
- W. M. Dose, N. Sharma, J. C. Pramudita, M. Avdeev, E. Gonzalo and T. Rojo, Rate and Composition Dependence on the Structural–Electrochemical Relationships in P2−Na2/3Fe1−yMnyO2 Positive Electrodes for Sodium-Ion Batteries, Chem. Mater., 2018, 30, 7503–7510 CrossRef CAS.
- B. Mortemard de Boisse, D. Carlier, M. Guignard, L. Bourgeois and C. Delmas, P2-Na x Mn1/2Fe1/2O2 Phase Used as Positive Electrode in Na Batteries: Structural Changes Induced by the Electrochemical (De) intercalation Process, Inorg. Chem., 2014, 53, 11197–11205 CrossRef CAS PubMed.
Footnotes |
| † Electronic supplementary information (ESI) available. See DOI: https://doi.org/10.1039/d4qi02804j |
| ‡ Current affiliation: Umicore Corporate Research & Development, Watertorenstraat 33, 2250 Olen, Belgium |
| § Current affiliation: LiNa Energy Ltd, Unit 1 Sharpes, Mill St, South Rd, Lancaster LA1 4XQ, United Kingdom |
| This journal is © the Partner Organisations 2025 |