
 Open Access Article
 This Open Access Article is licensed under a Creative Commons Attribution-Non Commercial 3.0 Unported Licence
Biocompatible ionic liquid-based nanoparticles for effective skin penetration and intracellular uptake of antisense oligonucleotides†
Kiyohiro
Toyofuku
a,
Rie
Wakabayashi
 ab,
Yoshirou
Kawaguchi
a,
Noriho
Kamiya
abc and
Masahiro
Goto
*abc
ab,
Yoshirou
Kawaguchi
a,
Noriho
Kamiya
abc and
Masahiro
Goto
*abc
aDepartment of Applied Chemistry, Graduate School of Engineering, Kyushu University, 744 Motooka, Fukuoka 819-0395, Japan. E-mail: m-goto@mail.cstm.kyushu-u.ac.jp
bAdvanced Transdermal Drug Delivery System Center, Kyushu University, Motooka 744, Nishi-ku, Fukuoka 819-0395, Japan
cCenter for Future Chemistry, Kyushu University, Motooka 744, Nishi-ku, Fukuoka 819-0395, Japan
First published on 1st July 2025
Abstract
A novel formulation (IL-NP) for the transdermal delivery of nucleic acid medicines was developed using biocompatible ionic liquid (IL). The formulation was created by mixing DNA in water with an IL in ethanol, followed by freeze-drying and dispersion in oil, producing uniformly sized particles. In vitro studies demonstrated the enhanced skin penetration of IL-NP, while mechanistic studies showed that the IL increased cell membrane fluidity to promote cellular uptake. In vivo experiments with tumor-bearing mice confirmed that transdermal administration of IL-NP achieved comparable antitumor effects as direct injection of DNA, without side effects. This formulation effectively overcomes barriers to both stratum corneum penetration and cellular uptake, providing a non-invasive alternative to injecting nucleic acid therapeutics.
Introduction
Nucleic acid medicines are drugs that use DNA or RNA with specific sequences to control the expression of disease-related genes. They represent a new treatment approach for diseases that are difficult to target with conventional small molecule drugs.1,2 Various types of nucleic acid medicines have been developed, including antisense oligonucleotides (ASOs), small interfering RNA (siRNA), microRNA (miRNA), and aptamers, with some already in clinical applications.3 These medicines are expected to treat intractable diseases such as cancer, neurodegenerative diseases, and metabolic diseases.4 However, most nucleic acid medicines are currently administered by injection, such as intravenous or subcutaneous injection, which presents several problems. These include decreased patient compliance, infection risk, the need for administration by medical professionals, and injection site reactions and systemic side effects.5,6 Crooke et al. pointed out that injection administration of ASO preparations may cause injection site reactions, hepatotoxicity, and thrombocytopenia.7 Additionally, repeated injections increase the burden on patients when nucleic acid medicines must be applied over a long period of time.Transdermal administration is expected to be a route that can solve the problems associated with injection-based administration. The advantages of transdermal administration include non-invasiveness, which allows for self-administration, avoidance of the first-pass effect in the liver, and promotion of sustained drug release over a long period of time.8,9 Prausnitz and Langer emphasized that transdermal drug delivery systems provide “painless drug administration” and contributes to improving patients’ quality of life.10 Furthermore, they offer a significant advantage for the treatment of local diseases, especially skin cancer, because they can act directly on the lesion.11
To achieve transdermal delivery of nucleic acid medicines, it is necessary to overcome several important barriers. The most significant barrier is the stratum corneum, the outermost layer of the skin, whose dense lipid bilayer structure severely restricts the penetration of macromolecular and hydrophilic nucleic acids.12,13 Zheng et al. pointed out that the molecular weight (usually 5–15 kDa or more) and strong negative charge of nucleic acids are the main factors that suppress their permeation through the skin.14 Furthermore, even after the nucleic acid drug reaches the target cells, there are still issues with intracellular uptake, such as low permeation through cell membranes and escape of nucleic acid drugs from endosomes.15 Conventional transdermal delivery systems cannot simultaneously satisfy multiple requirements, including improved penetration of the stratum corneum, efficient uptake into cells, protection and stabilization of nucleic acid structures, and high reproducibility of formulations.16
Comprising organic cations paired with organic or inorganic anions, ionic liquids (ILs) are unique salts that maintain a liquid state at room temperature17 and exhibit distinctive properties, including non-volatility, non-flammability, thermal stability, and ionic conductivity. Notably, they have been established as versatile “designer solvents” across numerous fields,18 with researchers engineering ILs with specific properties, such as surfactant properties or enhanced transdermal penetration.19–21 Recent advances have yielded biocompatible ILs suitable for drug delivery.22,23 Particularly promising are ILs composed of biocompatible cations (such as choline, imidazolium, and ammonium) and biologically derived anions (including amino acids and fatty acids), demonstrating low toxicity and biodegradability.24 In the context of transdermal delivery, Moniruzzaman et al. demonstrated that ILs can temporarily disrupt the skin's lipid bilayer, significantly enhancing drug permeation.25 This surfactant-like behavior facilitates the transdermal delivery of challenging therapeutic agents like nucleic acids.
The ethanol dilution method represents an elegant approach for creating lipid nanoparticles, including liposomes. This technique involves dissolving the lipid in ethanol, followed by dilution in an aqueous medium, resulting in spontaneous self-assembly of uniformly sized nanoparticles. In contrast, the solid-in-oil (S/O) preparation method26 requires high-energy homogenization to degrade high-molecular-weight drugs and nucleic acids (such as mRNA). Thus, the ethanol dilution method is particularly suitable for formulating delicate nucleic acid medicines, preserving their structural integrity and therapeutic efficacy. Justo and Moraes highlighted this method's simplicity, scalability, and capability to precisely control the particle size.27 In the specific context of nucleic acid delivery, Leung et al. demonstrated the effectiveness of liposomal formulations prepared using this technique.28
In this study, we prepared a nanoparticle formulation (denoted as IL-NP) for the transdermal delivery of nucleic acid drugs using a novel process. This process hinges on the use of a biocompatible ionic liquid as a surfactant. Specifically, we prepared a water/ethanol mixture containing an ionic liquid and nucleic acid, which we freeze-dried and then dispersed in oil to produce uniformly sized nanoparticles. Subsequently, we determined its physicochemical characteristics, evaluated its skin permeation in vitro, analyzed its mechanism of intracellular uptake, and evaluated its antitumor effect in vivo using a mouse model of cancer. We focused on the molecular mechanism of how IL-NP penetrated the stratum corneum, affected the fluidity of the cell membrane, and ultimately delivered the nucleic acid efficiently into cells. Here, we present new findings to facilitate the development of transdermal delivery formulations encapsulating nucleic acid medicines for clinical applications.
Materials and methods
Materials
Trabedersen (sequence: 5′-CGGCATGTCTATTTTGTA-3′) and FAM-labeled Trabedersen were purchased from Eurofins Genomics (Tokyo, Japan). 1,2-Dimyristoyl-sn-glycero-3-phosphocholine (DMPC), ethyl trifluoromethyl sulfonate, and isopropyl myristate were purchased from Tokyo Chemical Industry (Tokyo, Japan). Linoleic acid, oleic acid, and stearic acid were purchased from Sigma-Aldrich (Purity: >85.0% (GC), St Louis, MO, USA). Oligofectamine™ transfection reagent and 2-hydroxy-3-[2-[(2-hydroxyethyl) dimethylaminio] ethyl]-4-[2-[6-(dibutylamino)-2-naphthyl]ethenyl]pyridinium dibromide (di-4-ANEPPDHQ) were purchased from Thermo Fisher Scientific (Waltham, MA, USA).Cells
A murine melanoma cell line was purchased from RIKEN Cell Bank (Tsukuba, Japan). The cells were incubated in RPMI 1640 medium (Nacalai Tesque, Kyoto, Japan) supplemented with 10% fetal bovine serum (Thermo Fisher Scientific), antibiotic–antimycotic (anti–anti; Thermo Fisher Scientific), and 50 μM 2-mercaptoethanol (Fujifilm Wako Pure Chemical Industries). LabCyte EPI-MODEL was obtained from Japan Tissue Engineering (Aichi, Japan). The cells were cultured according to the manufacturer's procedure.Animals
Mouse skin (Hos![[thin space (1/6-em)]](https://www.rsc.org/images/entities/char_2009.gif) :HR-1) for in vitro permeation experiments was purchased from Hoshino Laboratory Animals (Ibaraki, Japan). The skin was kept at −80 °C until use. For the tumor challenge experiment and skin irritation test, six-week-old female C57BL/6N mice were purchased from Kyudo (Saga, Japan) and raised under standard conditions. All animal experiments were approved by the Ethics Committee for Animal Experiments of Kyushu University (approval no. A20-326-0) and carried out in accordance with the Guide for the Care and Use of Laboratory Animals (Science Council of Japan).
:HR-1) for in vitro permeation experiments was purchased from Hoshino Laboratory Animals (Ibaraki, Japan). The skin was kept at −80 °C until use. For the tumor challenge experiment and skin irritation test, six-week-old female C57BL/6N mice were purchased from Kyudo (Saga, Japan) and raised under standard conditions. All animal experiments were approved by the Ethics Committee for Animal Experiments of Kyushu University (approval no. A20-326-0) and carried out in accordance with the Guide for the Care and Use of Laboratory Animals (Science Council of Japan).
Synthesis of ILs
1,2-Dimyristoyl-sn-glycero-3-phosphatidylcholine (DMPC) lipid powder was mixed with ethyl trifluoromethanesulfonate in a 1:1 mole ratio. The mixture was heated at 45 °C for 12 h under a continuous flow of nitrogen gas (N2). Synthesized 1,2-dimyristoyl-sn-glycero-3-ethylphosphatidylcholi (EDMPC) trifluoro salt was dissolved in chloroform, followed by the addition of 0.2 N HCl, with shaking, to form EDMPC-Cl. The byproduct, trifluoromethyl sulfonate, and unreacted HCl were removed from the transparent aqueous phase. The non-aqueous phase consisting of EDMPC-Cl was further purified with Milli-Q water. Chloroform and Milli-Q water were removed by freeze-drying. Finally, the purity of EDMPC-Cl was determined with 1H-NMR. EDMPC-Cl and the fatty acid in equimolar ratio were mixed in chloroform and heated at 45 °C for approximately 12 h (overnight) under a continuous flow of N2 with light shielding. The reaction solution was freeze-dried to obtain the IL, which was characterized with 1H-NMR.
IL-NP preparation
To prepare IL-NP, 2 mL of an aqueous solution of DNA (0.5 mg mL−1) and 0.2 mL of an ethanol solution of the IL (50 mg mL−1) were mixed with a stirrer at 400 rpm for 6 h. The stirring time was optimized (Fig. S1†). The resulting solution was freeze-dried (FD5N; YELA, Tokyo, Japan) to remove water and ethanol, leaving an IL–DNA complex. This complex contained 1 mg of DNA and 10 mg of IL, and it was dispersed in 1 mL of isopropyl myristate (IPM) solution to give IL-NP. The final concentration of DNA was 1.0 mg mL−1. The particle size and polydispersity index (PDI) of IL-NP (loaded with DNA) were determined using dynamic light scattering (DLS; Zetasizer Nano series, Malvern Panalytical, Malvern, UK). Samples were loaded in capped quartz cells (1 cm long) and maintained at an angle of 173° and temperature of 35 ± 0.1 °C. The mean diameter of 10 replicates of each sample was taken as the particle size. The particle size distribution was compared with that of particles prepared in the same way using ER-290 (sucrose erucate), a non-ionic surfactant. The particle sizes and shapes were further characterized using transmission electron microscopy (TEM). In brief, 2 μL of the test solution was placed on the carbon film of a copper TEM grid. After 2 min of incubation, the solution was absorbed by the carbon-coated film. The oil phase (IPM) of the formulation was washed with cyclohexane and again incubated for 2 min. The deposited complex was stained with 2% uranyl acetate solution, and finally, [EDMPC][Lin]-NP was observed on a TEM-2010 (JEOL, Tokyo, Japan) operated at 120 kV. Here, IL-NP prepared using IL [EDMPC][Lin, Ole, Ste] was defined as [EDMPC][Lin, Ole, Ste]-NP.Small-angle X-ray scattering (SAXS)
Prepared IL-NP was sandwiched between the sample support film (RIGAKU, Tokyo, Japan) or filled into LB grade polyimide resin (Protein Wave Corporation, Nara, Japan). The diffraction patterns were obtained using Nanoviewer (RIGAKU) equipped with a sealed copper tube (Cu-Kα, λ = 0.15418 nm) operated at 40 kV and 30 mA. The distance between the sample and detector was 725 mm, and the acquisition time was 30 min. The obtained images were analyzed using DP2 (Rigaku), and the scattering vector (q) and interplanar spacing (d) were calculated using the following formula:
In vitro skin permeation
Skin permeation was evaluated using a Franz diffusion cell at 32.5 °C, as previously reported. Mouse skin purchased from Hoshino Laboratory Animals (Ibaraki, Japan) was stored at −80 °C and thawed at room temperature. The skin was cut into 2 × 2 cm segments and placed in the Franz diffusion cell. Then, the receiver chamber was filled with 5 mL of phosphate-buffered saline (PBS). The donor chamber was filled with IL-NP and 200 μL of PBS and maintained at 32.5 °C. After 6 h, skin segments were washed with 70% ethanol and immersed in optimal cutting temperature (OCT) compound (Sakura Finetek Japan, Tokyo, Japan). The sections were then cut into slices (20 μm thick) with a cryostat microtome (CM1860UV, Leica Biosystems, Wetzlar, Germany). Skin sections were placed onto glass slides and observed using a confocal laser scanning microscope (CLSM; LSM700, Carl Zeiss, Oberkochen, Germany). The obtained images were then processed using LSM (Carl Zeiss). For the quantification experiments, skin segments were thoroughly washed with 70% ethanol and soaked in PBS to extract Trabedersen. The receiver compartment was also sampled, and the concentration of DNA was determined using a microplate reader.In vitro cellular uptake
B16, a mouse melanoma cell line, was used as the model cancer cell and cultured using D-MEM (10% FBS, 1% anti–anti) as the medium. Specifically, B16 was cultured on TC Petri dishes (10 cm) in an incubator under 5% CO2 at 37 °C. The frozen cells were immersed in a water bath set to 37 °C. After approximately 80% of the volume was dissolved, the cells were removed from the water bath, and all the volume was dissolved using residual heat. All cells (1 mL) were added to 5 mL of the prepared medium and centrifuged at 1200 rpm for 3 min to sediment the cells. The medium was removed with an aspirator, and 1 mL of new medium was added to float the cells. All cells (1 mL) were seeded on Petri dishes containing 10 mL of new medium and incubated in a CO2 incubator. After confirming by microscopy that the cells were 70% confluent, the medium was removed with an aspirator and the cells were washed twice with 2 mL of D-PBS (−). Subsequently, D-PBS (−) was removed with an aspirator, and 1 mL of trypsin-EDTA was added. The cells were allowed to react in a CO2 incubator for 3 min (37 °C). After confirming under a microscope that the cells were suspended, 5 mL of the medium was added without removing trypsin-EDTA. The mixture was transferred to a centrifuge tube (15 mL) and centrifuged at 1200 rpm for 3 min to sediment the cells. Only the medium was removed with an aspirator, and 1 mL of new medium was added to float the cells. The cells were seeded on a Petri dish containing 10 mL of new medium and incubated in a CO2 incubator.The various preparation methods are described below. The amount of solution per well is shown. DNA PBS solution (0.5 μL, 20 μM) was diluted with serum-free D-MEM (16.5 μL). Oligofectamine (0.4 μL) was diluted with serum-free D-MEM to a final volume of 3 μL. The samples were then incubated at room temperature for 10 min. Diluted Trabedersen solution (17 μL) was mixed with diluted Oligofectamine (3 μL) to a final nucleic acid concentration of 0.5 μM. The mixture was then incubated at room temperature for 20 min. IL-S/O prepared using the above method was diluted with IPM to a nucleic acid concentration of 0.5 μM in a volume of 20 μL. The transfection test was performed as follows. One day prior to transfection, cells were seeded on 4-well plates at a ratio of 2000 cells per 200 μL (well). Antibiotic-free D-MEM (10% FBS) was used as the growth medium. After removing the growth medium, the cells were washed once with serum-free D-MEM medium. Serum-free medium (200 μL) was added to each well, and various samples (20 μL) were added to the cells. For IL-S/O samples, the solution was added directly on top of the medium. Cells were incubated in a CO2 incubator at 37 °C for 24 h. Adherent cells were then detached using Accutase and replaced with Opti-MEM before analysis using flow cytometry.
Di-4-ANEPPDHQ imaging and analysis of GP values
Di-4-ANEPPDHQ is generally used to analyse lipid packing in both cell membranes and artificial vesicles because its fluorescence shifts to longer wavelengths in either a more hydrophilic environment or membranes with more defects. Di-4-ANEPPDHQ fluoresces in the ranges of 490–580 nm (green) and 615–700 nm (red), and the intensity ratio of the green fluorescence to red fluorescence changes depending on the fluidity of the membrane. When the fluidity of the membrane is low, the fluorescence at 490–580 nm (green) becomes stronger. In contrast, when the fluidity of the membrane is high, the fluorescence at 615–700 nm (red) becomes stronger. In this study, ethanol/water solutions of ILs at different concentrations were added to the cell membrane, and the fluidity of the membrane was visually observed using CLSM and quantitatively evaluated by calculating the generalized polarization (GP) value from the respective fluorescence intensity ratio. The specific procedure is as follows: B16 cells were seeded in a 4-well glass-bottom dish at a density of 5000 cells per well. The cells were left to stand for 1 day in a CO2 incubator at 37 °C. The cells were washed with 150 μL of PBS (−), and 150 μL of Opti-MEM was added. Then, 50 μL of ethanol/water solution was added so that the final IL concentration was 0.5, 1.5, or 3.0 mM, and the cells were left to stand for 10 min in a CO2 incubator at 37 °C. After washing the cells with 150 μL of PBS (−), the medium was removed, and 100 μL of Opti-MEM solution containing 5 μM di-4-ANEPPDHQ was added. The fluorescence of the cell membrane was observed using CLSM under the following conditions: 40× magnification, excitation at 488 nm, detection at 500–580 and 620–700 nm.The GP value, an indicator of membrane fluidity, was calculated using the following formula:
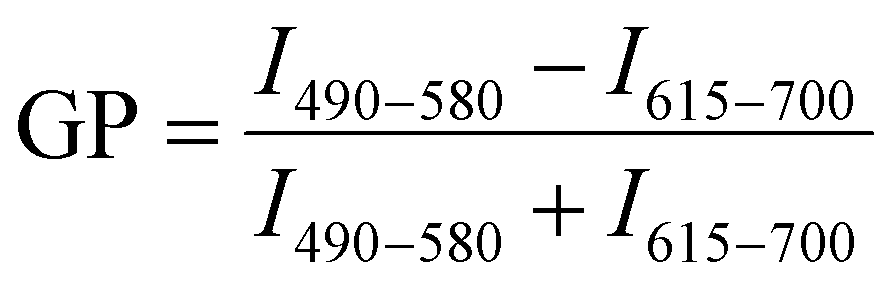
A lower GP value indicates a higher membrane fluidity. When the GP value of the untreated cell membrane is set to 0, the GP value is calculated as ΔGP.
In vivo antitumor effect
B16F10, a mouse melanoma cell line, was used as the model cancer cell and cultured using RPMI 1640 (10% FBS, 1% anti–anti) as the medium. B16F10 was cultured on TC Petri dishes (10 cm) in a 5% CO2 incubator (37 °C). The frozen cells were immersed in a water bath set to 37 °C. After approximately 80% of the volume was lysed, the cells were removed from the water bath and all the volume was lysed using residual heat. All cells (1 mL) were added to the prepared medium (5 mL) and centrifuged at 1200 rpm for 3 min to sediment the cells. The medium was removed with an aspirator, and 1 mL of new medium was added to float the cells. The cells were then seeded on a Petri dish containing 10 mL of new medium and incubated in a CO2 incubator.After confirming by microscopy that the cells were 70% confluent, the medium was removed with an aspirator and the cells were washed twice with 2 mL of D-PBS (−). Subsequently, D-PBS (−) was removed with an aspirator, 1 mL of Trypsin-EDTA was added, and the cells were allowed to react in a CO2 incubator for 3 min (37 °C). After confirming under a microscope that the cells were suspended, 5 mL of the medium was added without removing trypsin-EDTA. The mixture was transferred to a centrifuge tube (15 mL) and centrifuged at 1200 rpm for 3 min to sediment the cells. Only the medium was removed with an aspirator, and 1 mL of new medium was added to float the cells. The cells were incubated in a CO2 incubator until the growth rate of the cells recovered sufficiently. Cells were passaged until the cell growth rate recovered sufficiently, and at the last passage before carcinogenesis, the number of Petri dishes was increased to five to ensure sufficient cells for carcinogenesis.
Cultured B16F10 cells were stained with trypan blue and counted using an automated cell counter. The cells were diluted with HBSS (−) to a cell count of 2.0 × 10⁶ cells per mL. Then, the cells were injected intradermally into the backs of dewormed C57BL/6N mice. Ten days after carcinogenesis, the major axis and minor axis of the tumor were measured, and the tumor volume was calculated using the following formula:

Mice were considered dead when the long axis of the tumor exceeded 20 mm (or an ulcer formed). The mass of the mice was also recorded using a scale 0, 2, 3, 4, and 5 days after the formulation was administered.
Statistical analysis
Statistical analysis was performed using Python. The data on skin permeability and tumor volume were tested using Welch's t-test, and the data on membrane fluidity were tested using one-way ANOVA. Significance is indicated as *p < 0.05, **p < 0.01, ***p < 0.001 and ****p < 0.0001. Data are expressed as the mean ± standard error unless specified.Results and discussion
Characterization of IL-NP
Our group has been studying ILs composed of lipid components with high biocompatibility and surface activity for transdermal drug delivery.29 In 2019, we synthesized and characterized ILs comprising choline and fatty acids,30 and in 2020, we reported the synthesis and characterization of ILs comprising EDMPC and fatty acids with an 18-carbon chain length, such as linoleic acid (Lin), oleic acid (Ole), and stearic acid (Ste).31 In 2021, we used these lipid-based ILs to prepare transdermal delivery systems for hydrophilic peptides.32 Furthermore, in 2023, we used these ILs as a surfactant in the S/O method to prepare transdermal delivery systems for ASOs.33 In this study, we used a lipid-based IL comprising EDMPC and Lin, denoted as IL [EDMPC][Lin], to prepare a formulation for the transdermal delivery of nuclei acid drugs.The particle size distribution of the new formulation was measured using DLS. This formulation was prepared by simply mixing an aqueous solution of DNA with an ethanol solution of IL [EDMPC][Lin], followed by freeze-drying and dispersion in oil. For comparison, ER-290, a non-ionic surfactant found in conventional transdermal formulations, was used to prepare the control. In this case, the same ethanol dilution steps applied to obtain IL-NP were used to obtain the control, denoted as ER-290-NP. Fig. 1a shows the results of 10 measurements. Particles of ER-290-NP (grey line) were unevenly distributed on the microscale. In contrast, particles of IL-NP (blue line) were evenly distributed around 200 nm. These results suggest that the IL, which carries a charge, engages in electrostatic interactions with polyanionic DNA, producing uniformly sized particles.
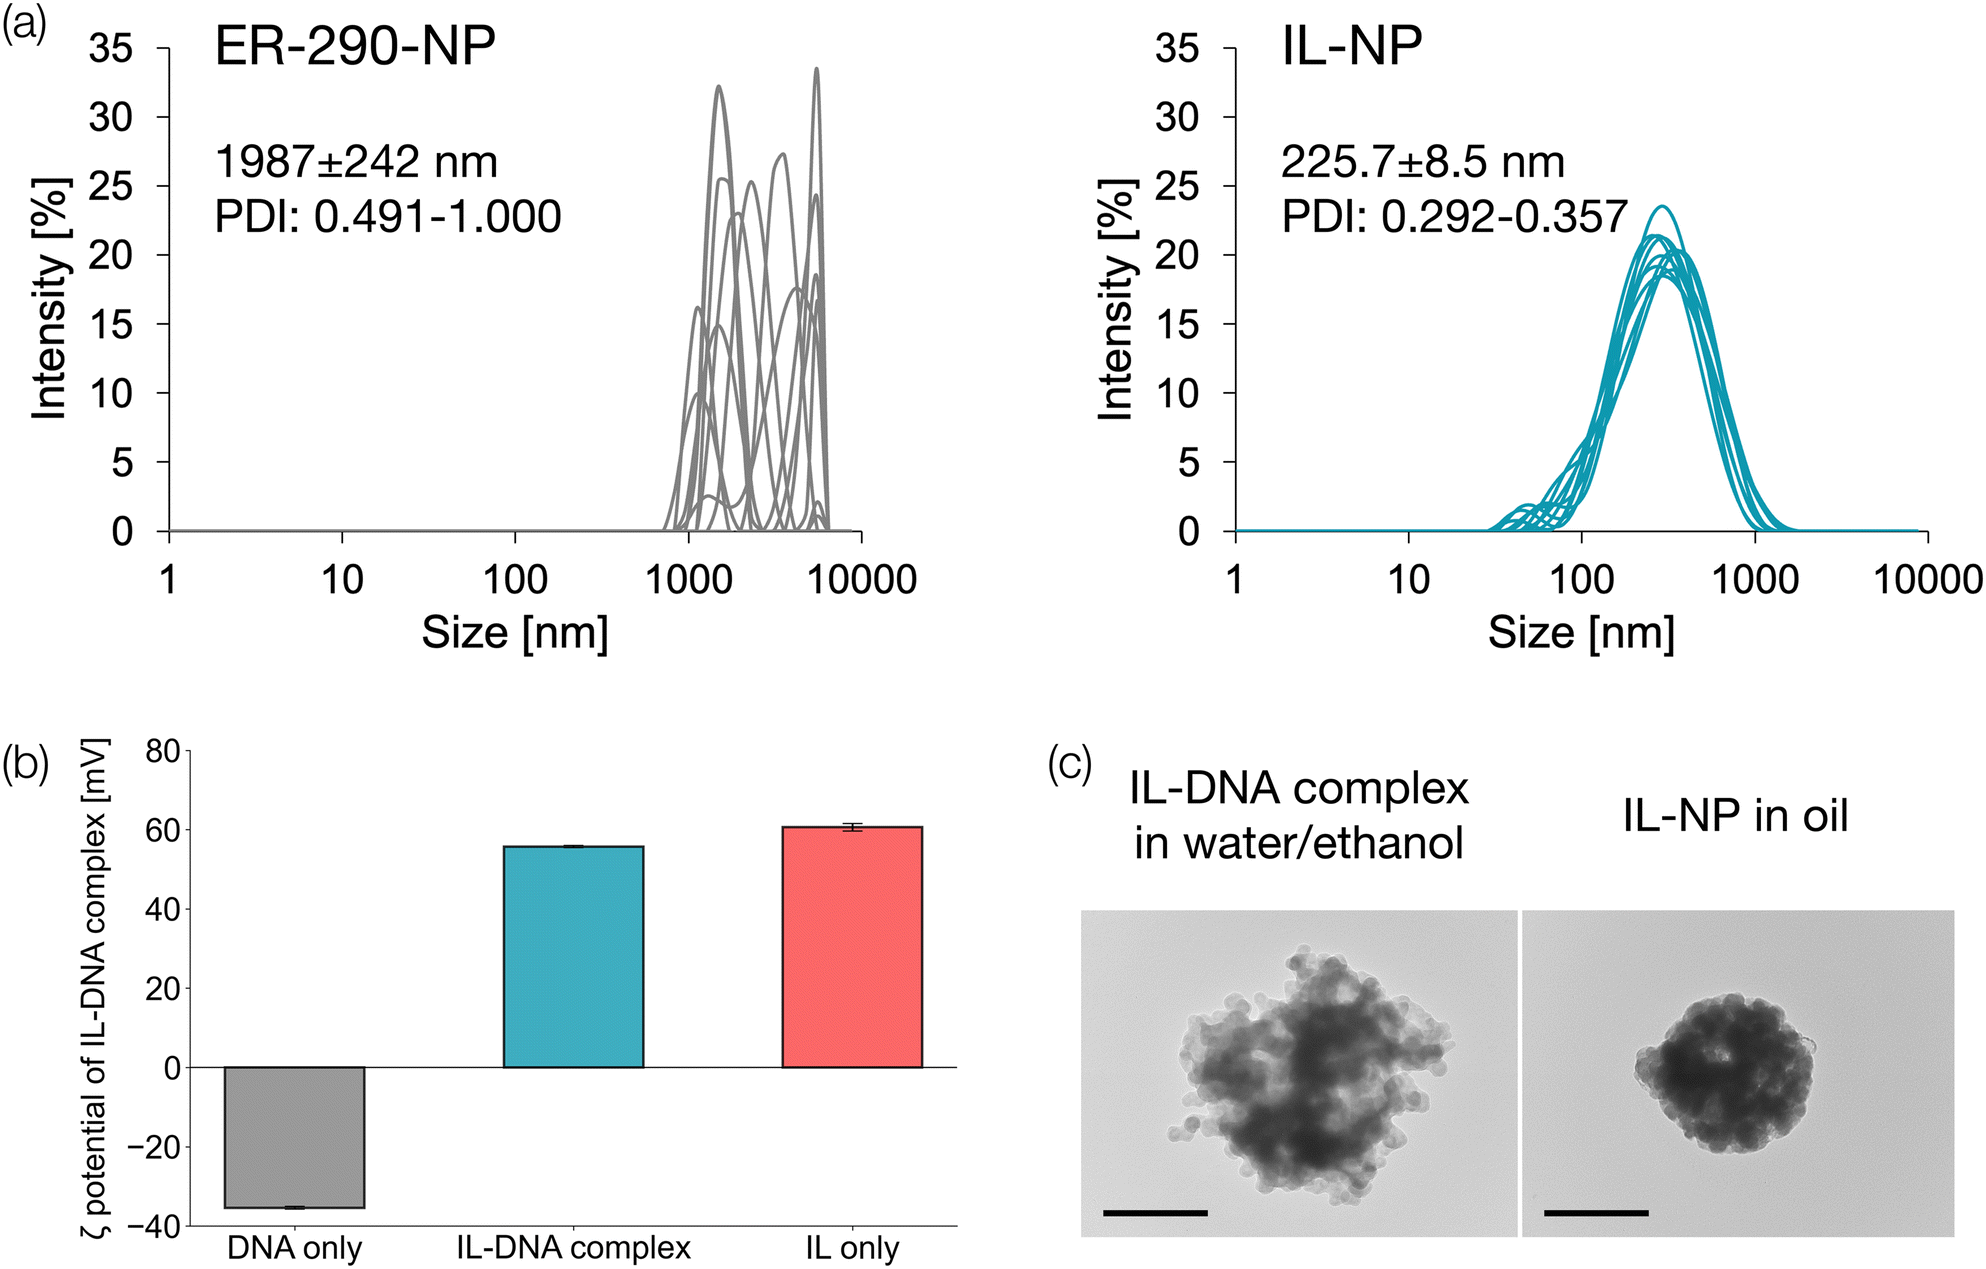 | ||
| Fig. 1 Characterization of IL-NP. (a) Particle size distribution of nanoparticles obtained using ER-290 or IL [EDMPC][Lin] as the surfactant, measured over 10 runs. (b) Zeta potential of DNA only, IL–DNA complex, and IL only. (c) TEM image of IL–DNA complex in a mixture of water and ethanol (left) and after freeze-drying and dispersion in oil (right). Scale bars: 0.2 μm. | ||
Next, we investigated whether DNA was coated by the IL by measuring the zeta potential of the IL–DNA complex using DLS. Fig. 1b shows the zeta potential of the IL–DNA complex compared with those of DNA alone and IL alone. The IL had a positive charge in solution, and the IL–DNA complex was also positively charged, indicating that DNA was coated by the IL. Additionally, we observed the morphology of the IL–DNA complex in a water/ethanol solution using TEM to examine how it changed after it was freeze-dried and then dispersed in oil. TEM images of the complex in water/ethanol solution and IL-NP (Fig. 1c, left to right) revealed that the IL–DNA complex in the water/ethanol miscible system formed aggregates of micelle-like structures with a diameter of approximately 10 nm, creating a structure with a diameter of approximately 600 nm. After freeze-drying and dispersion in oil, the IL and DNA aggregated to form a structure of approximately 200 nm.
Structures of ILs in water/ethanol mixtures
The structures of ILs were determined using DLS and SAXS to elucidate the process of IL-NP formation. First, we varied the concentration of [EDMPC][Lin] in the water/ethanol solution in the range of 0.5–5.0 mM and measured the zeta potential and size (PDI) of the resulting particles using DLS. The results are plotted in Fig. 2a. Under all conditions, IL alone was added to 99.5% ethanol and Milli-Q water (volume ratio of 1:10) unless otherwise stated. This volume ratio was optimized by comparing two conditions (Table S1 and Fig. S2†). These conditions were used in the following experiments. The results revealed that when the concentration of the IL in the solution increased, the particles did not aggregate, and the zeta potential remained constant, indicating that [EDMPC][Lin] formed individual micelles in water/ethanol. Nevertheless, the TEM image (Fig. 1c) showed that particles of approximately 10 nm in size aggregated to form a single particle.
 | ||
| Fig. 2 Process of IL–DNA complex formation. (a) Particle size and zeta potential of IL as the concentration of IL alone in the water/ethanol solution changes. (b) Particle size and zeta potential of IL–DNA complex as the weight ratio of IL to DNA changes. (c) SAXS diffraction pattern. | ||
To evaluate the behavior of IL-NP in solution, we changed the weight ratio of the IL: Trabedersen (ssDNA, 18 mer), the model nucleic acid, from 1/1 to 1/50. We measured the zeta potential and diameter (PDI) of the particles in the water/ethanol solution using DLS and plotted the results, as shown in Fig. 2b. In this case, the IL was first dissolved in ethanol, and the solution was diluted 10 times with water. Then, the DNA aqueous solution was added in an amount equal to the initial ethanol solution. As the weight ratio of DNA/IL changed from 1/1 to 1/10, the zeta potential increased, suggesting that cationic IL micelles covered the DNA molecule to form a complex. When the weight ratios were 1/1 and 1/5, the zeta potential was negative even though the complex had a uniform size. This indicated that the IL micelles did not completely cover the DNA molecule, leaving the anionic sites of the DNA molecule exposed. Additionally, the zeta potential leveled off when the weight ratios were 1/10 to 1/50, presumably because the IL micelles completely covered the DNA molecule, reaching a saturated state.
The SAXS diffraction pattern of IL-NP is shown in Fig. 2c. The single sharp peak and the broad peak in this diffraction pattern supported the above hypothesis of micelle aggregation. Specifically, the sharp peak represents the internal structure of individual micelles and specific repeating units, while the broad peak represents the overall shape and size distribution of the micelle aggregates.
In vitro skin permeation
To evaluate the skin permeation of IL-NP in vitro, we used hairless mouse skin as an animal skin model. First, we applied a PBS solution of FAM-labeled DNA (negative control) or [EDMPC][Lin]-NP to the mouse skin using a Franz cell. Then, we observed the cross-section of the skin sample using CLSM to determine the distribution of DNA (Fig. 3a). DNA remained on the surface of the skin exposed to the PBS solution. In contrast, strong fluorescence was detected in the basal and dermal layers of the skin sample treated with [EDMPC][Lin]-NP. These results support the hypothesis that the IL and nucleic acid form a complex that can penetrate the stratum corneum to reach the living epidermis. | ||
| Fig. 3 Skin permeation of DNA. (a) CLSM image of the cross-section of mouse skin treated with FAM-DNA in [EDMPC][Lin]-NP (DNA = 1.0 mg mL−1). The image was obtained with a 20× lens. Scale bars: 100 μm. (b) Amount of DNA permeated through the mouse skin into the receiver phase. N = 3; mean ± SD; **p < 0.01, ***p < 0.001, ****p < 0.0001. | ||
Next, DNA extracted from mouse skin exposed to various IL-NP preparations was quantified using a microplate reader. The results indicated that IL-NP preparations delivered significantly more DNA than the PBS solution (Fig. 3b). These results show that using an IL as a surfactant (i.e., using fatty acids as an anion) promotes transdermal penetration owing to the effect of the decreased melting point that accompanies the formation of ILs, which improves transdermal permeation, in addition to the extraction of intercellular lipids and the disruption of the structure of lipids in the stratum corneum.
The results shown in Fig. 3b suggest that the anionic species of the IL affect the skin permeation of DNA. The skin permeation of DNA was highest with Lin, followed by Ole, and then Ste. This effect likely originates in the cis-type folded C![[double bond, length as m-dash]](https://www.rsc.org/images/entities/char_e001.gif) C bonds, which easily disrupt the lamellar structure, and the IL (or anionic fatty acids), which promotes skin penetration. Because [EDMPC][Lin]-NP exhibited the highest skin permeability among the prepared ILs, it was used in the following investigations.
C bonds, which easily disrupt the lamellar structure, and the IL (or anionic fatty acids), which promotes skin penetration. Because [EDMPC][Lin]-NP exhibited the highest skin permeability among the prepared ILs, it was used in the following investigations.
In vitro cellular uptake
Here, the target disease is melanoma, a type of skin cancer, and the model DNA is Trabedersen, an antisense drug. We conducted in vitro experiments to determine whether IL-nucleic acid complexes could improve the efficiency of transfecting B16 melanoma cells. In this experiment, we used TAMRA-labeled DNA as the model nucleic acid and observed the fluorescence of the cells after transfection using CLSM. The fluorescence images of the cells after DAPI staining are shown in Fig. 4a. These results indicated that IL-NP had the highest transfection efficiency and that some of the nucleic acid was taken into the nucleus. | ||
| Fig. 4 Cellular uptake and behaviour of IL-NP in the cytoplasm. (a) CLSM images showing the cellular uptake of TAMRA-labeled DNA. (b) Distribution of NBD-labeled IL-NP, which contains TAMRA-labeled DNA, in the cytoplasm. Scale bars: 20 μm. | ||
Previously, we used a fluorescent IL–DNA complex to evaluate mouse skin penetration, and the results suggested that IL and DNA penetrated the living epidermis as a complex (Fig. S1†). Therefore, we investigated how this complex acted on cells using a similar fluorescent complex (TAMRA-labeled DNA and NBD-labeled IL). Although previous studies30 indicate that DNA is taken into cells, the behavior of IL remains unknown. We believe that this investigation will provide details of the mechanism of intracellular uptake. The cells were observed 1 h after the addition of the formulation using a Keyence fluorescence microscope. The results (Fig. 4b) indicated that both IL and DNA were present in the cells. However, DNA was taken into the nucleus, whereas IL was accumulated in the cytoplasm only. It is possible that the interaction between the IL and DNA weakens in the cells, and only DNA migrates to the nucleus.
Mechanism by which ILs promote cellular uptake of ASOs
Lipid packing is an important feature of cell membranes. Membrane lipid packing can be quantitatively analyzed using a polar-sensitive probe whose emission spectrum responds to lipid packing. Here, we used di-4-ANEPPDHQ, a polar-sensitive probe, to determine how ILs acted on cell membranes to promote the cellular uptake of DNA.Di-4-ANEPPDHQ fluoresces in the ranges of 490–580 nm (green) and 615–700 nm (red), and the intensity ratio of the green fluorescence to red fluorescence changes depending on the fluidity of the membrane. When the membrane fluidity is low, the fluorescence at 490–580 nm (green) becomes stronger, and when the membrane fluidity is high, the fluorescence at 615–700 nm (red) becomes stronger. Here, we added the IL in a water/ethanol solution at different concentrations to the cell membrane and visually observed the membrane fluidity using CLSM. We also quantitatively evaluated the fluidity by calculating the GP from the respective fluorescence intensity ratio.
The results of CLSM observations are shown in Fig. 5a, and the GP values calculated for 10 randomly selected cells are shown in Fig. 5b. The CLSM images showed that the red fluorescence became stronger as the IL concentration increased. Moreover, the GP value decreased as the IL concentration increased. Both results indicated that membrane fluidity increased with increased IL concentration. Furthermore, we evaluated the correlation between membrane fluidity and cellular uptake by plotting the data with ΔGP on the horizontal axis and the cellular uptake of FAM-labeled ASO on the vertical axis (Fig. 5c). The results indicated that there was a positive correlation between membrane fluidity and cellular uptake, up to a certain ΔGP value.
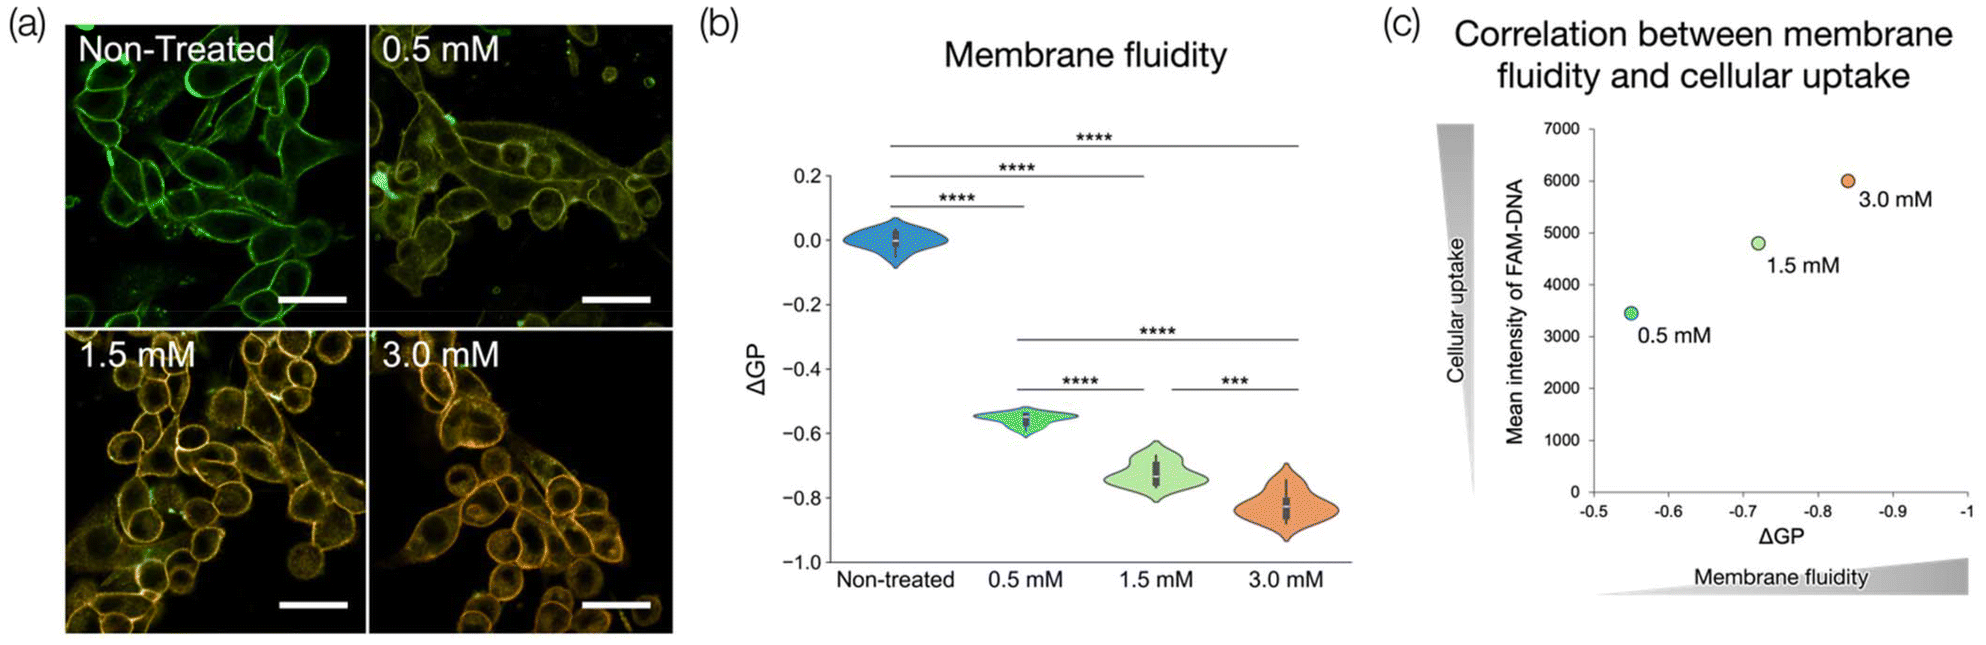 | ||
| Fig. 5 Cell membrane fluidity and cellular uptake. (a) CLSM images of the cell membrane treated with IL [EDMPC][Lin] at different concentrations. Scale bars: 20 μm. (b) GP value of the cell membrane treated with the IL at different concentrations (N = 10, mean ± SE, ***p < 0.001, ****p < 0.0001). (c) Correlation between cell membrane fluidity and cellular uptake of DNA. | ||
In vivo antitumor effect of IL-S/O
To evaluate the antitumor effect and biotoxicity of IL-NP (containing DNA), B16F10 tumor-bearing C57BL/6N mice were treated with the formulation by injection and transdermal administration. DNA was administered 7 days after the subcutaneous inoculation of B16F10 melanoma cells, and tumor growth was monitored until the humane endpoint. The subcutaneous injection delivered the drug in a single dose, and the transdermal administration delivered the drug continuously from a patch over 48 h. The results shown in Fig. 6a indicated that DNA in IL-NP was delivered into cells, where it exerted an antisense effect. The anti-tumor effect was the same in both the injection and transdermal administration groups, suggesting that the amount of DNA ultimately delivered to the tumor cells was the same because DNA was not formulated in the injection group. The temporary decrease in body weight observed in the IL-S/O patch group may be due to limited access to food following the start of administration. The subsequent recovery of body weight suggests this is a transient and reversible physiological response, with no serious toxicity or adverse effects detected (Fig. 6b). Additionally, CLSM observations of tumor sections stained with DAPI revealed that fluorescence was distributed throughout the intercellular region in the injection group, whereas it was strong within the cells in the IL-NP patch group (Fig. 6c). These results suggest that transdermal administration of IL-NP facilitated the penetration of DNA through the stratum corneum and the uptake of DNA by tumor cells, inhibiting tumor growth. | ||
| Fig. 6 Antitumor effect against B16F10 melanoma. After tumor inoculation, Trabedersen was administered to C57BL/6N mice by injection and transdermal patch. The dose of Trabedersen for each immunization was 300 μg per mouse. (a) Changes in (a) tumor volume and (b) body weight. (c) CLSM images of tumor sections. N = 8, mean ± SD, **p < 0.01. | ||
Conclusions
In this study, we developed a novel formulation for the transdermal delivery of nucleic acid medicines using biocompatible ionic liquid-based nanoparticles. The formulation was created by mixing DNA in water with the ionic liquid in ethanol, followed by freeze-drying and dispersion in oil, producing uniformly sized particles of approximately 200 nm. In vitro studies demonstrated the enhanced penetration of the nucleic acid through the stratum corneum, with the IL increasing cell membrane fluidity to promote cellular uptake. The formulation successfully delivered the ASO to target cells both in vitro and in vivo. The in vivo experiments with tumor-bearing mice confirmed that transdermal administration of IL-NP achieved comparable antitumor effects as the direct injection of IL-NP, without observable side effects. This formulation effectively overcame the barriers impeding the clinical application of nucleic acid medicines, namely poor stratum corneum penetration and low cellular uptake. The results presented indicate that non-invasive transdermal delivery of nucleic acid medicines using this formulation is a promising alternative to the injection route, potentially improving patient compliance and quality of life by eliminating injection-related issues such as pain, infection risk, and localized reactions.Author contributions
K. T.: writing of the original draft, investigation, and methodology. R. W., Y. K.: investigation, and methodology. N. K.: methodology, validation, writing/reviewing, editing. M. G.: conceptualization, supervision, validation, and editing. All authors contributed to the discussion of the paper and approved the manuscript.Conflicts of interest
There are no conflicts to declare.Data availability
The data supporting this article have been included as part of the Manuscript and ESI.†Acknowledgements
The authors acknowledge financial support from the Japan Society for the Promotion of Science (KAKENHI numbers JP22K18314 and JP24KJ1798) and from AMED (22ak0101174h0002). We thank Edanz (https://jp.edanz.com/ac) for editing a draft of this manuscript.References
- R. Kole, A. R. Krainer and S. Altman, Nat. Rev. Drug Discovery, 2012, 11, 125–140 CrossRef CAS PubMed.
- J. C. Burnett and J. J. Rossi, Chem. Biol., 2012, 19, 60–71 CrossRef CAS PubMed.
- A. Wittrup and J. Lieberman, Nat. Rev. Genet., 2015, 16, 543–552 CrossRef CAS.
- A. Khvorova and J. K. Watts, Nat. Biotechnol., 2017, 35, 238–248 CrossRef CAS.
- C. A. Stein and D. Castanotto, Mol. Ther., 2017, 25, 1069–1075 CrossRef CAS PubMed.
- R. L. Juliano, Nucleic Acids Res., 2016, 44, 6518–6548 CrossRef PubMed.
- S. T. Crooke, J. L. Witztum, C. F. Bennett and B. F. Baker, Cell Metab., 2017, 27, 714–739 CrossRef.
- M. R. Prausnitz and R. Langer, Nat. Biotechnol., 2008, 26, 1261–1268 CrossRef CAS.
- C. M. Schoellhammer, D. Blankschtein and R. Langer, Expert Opin. Drug Delivery, 2014, 11, 393–407 CrossRef CAS.
- A. Z. Alkilani, M. T. McCrudden and R. F. Donnelly, Pharmaceutics, 2015, 7, 438–470 CrossRef CAS PubMed.
- P. R. Desai, S. Marepally, A. R. Patel, C. Voshavar, A. Chaudhuri and M. Singh, J. Controlled Release, 2013, 170, 51–63 CrossRef CAS PubMed.
- J. D. Bos and M. M. Meinardi, Exp. Dermatol., 2000, 9, 165–169 CrossRef CAS.
- P. M. Elias, J. Invest. Dermatol., 2005, 125, 183–200 Search PubMed.
- D. Zheng, D. A. Giljohann, D. L. Chen, M. D. Massich, X. Q. Wang, H. Iordanov and A. S. Paller, Proc. Natl. Acad. Sci. U. S. A., 2012, 109, 11975–11980 CrossRef CAS.
- G. Sahay, D. Y. Alakhova and A. V. Kabanov, J. Controlled Release, 2010, 145, 182–195 Search PubMed.
- A. Wittrup, A. Ai, X. Liu, P. Hamar, R. Trifonova, K. Charisse and J. Lieberman, Nat. Biotechnol., 2015, 33, 870–876 Search PubMed.
- T. Welton, Chem. Rev., 1999, 99, 2071–2084 CrossRef CAS PubMed.
- J. P. Hallett and T. Welton, Chem. Rev., 2011, 111, 3508–3576 Search PubMed.
- W. Gao, W. Xing, Z. Tang, Q. Wang, W. Yu and Q. Zhang, Drug Delivery, 2025, 32, 2489730 CrossRef.
- R. Islam, F. H. Nabila, R. Wakabayashi, N. Kamiya, M. Moniruzzaman and M. Goto, J. Mol. Liq., 2024, 397, 124184 Search PubMed.
- F. H. Nabila, R. Islam, I. M. Shimul, M. Moniruzzaman, R. Wakabayashi, N. Kamiya and M. Goto, Chem. Commun., 2024, 60, 4036–4039 Search PubMed.
- K. S. Egorova, E. G. Gordeev and V. P. Ananikov, Chem. Rev., 2017, 117, 7132–7189 CrossRef CAS.
- N. Adawiyah, M. Moniruzzaman, S. Hawatulaila and M. Goto, MedChemComm, 2016, 7, 1881–1897 RSC.
- M. Taha, M. R. Almeida, F. A. Silva, P. Domingues, S. P. Ventura, J. A. Coutinho and M. G. Freire, Chem. – Eur. J., 2015, 21, 4781–4788 Search PubMed.
- M. Moniruzzaman, M. Tamura, Y. Tahara, N. Kamiya and M. Goto, Int. J. Pharm., 2010, 400, 243–250 CrossRef CAS PubMed.
- Y. Tahara, S. Honda, N. Kamiya, H. Piao, A. Hirata, E. Hayakawa, T. Fujii and M. Goto, J. Controlled Release, 2008, 131, 14–18 CrossRef CAS PubMed.
- O. R. Justo and Â.M Moraes, Chem. Eng. Res. Des., 2011, 89, 785–792 CrossRef CAS.
- A. K. Leung, Y. Y. Tam, S. Chen, I. M. Hafez and P. R. Cullis, J. Phys. Chem. B, 2015, 119, 8698–8706 CrossRef CAS.
- R. Md Moshikur, M. R. Chowdhury, M. Moniruzzaman and M. Goto, Green Chem., 2020, 22, 8116–8139 RSC.
- M. K. Ali, R. M. Moshikur, R. Wakabayashi, Y. Tahara, M. Moniruzzaman, N. Kamiya and M. Goto, J. Colloid Interface Sci., 2019, 551, 72–80 CrossRef CAS PubMed.
- S. Uddin, M. R. Chowdhury, R. Wakabayashi, N. Kamiya, M. Moniruzzaman and M. Goto, Chem. Commun., 2020, 56, 13756–13759 RSC.
- S. Uddin, M. R. Islam, M. R. Chowdhury, R. Wakabayashi, N. Kamiya, M. Moniruzzaman and M. Goto, ACS Appl. Bio Mater., 2021, 4, 6256–6267 CrossRef CAS.
- K. Toyofuku, R. Wakabayashi, N. Kamiya and M. Goto, ACS Appl. Mater. Interfaces, 2023, 15, 33299–33308 CrossRef CAS.
Footnote |
| † Electronic supplementary information (ESI) available. See DOI: https://doi.org/10.1039/d5pm00087d |
| This journal is © The Royal Society of Chemistry 2025 |