Open Access Article
This Open Access Article is licensed under a
Creative Commons Attribution 3.0 Unported Licence

Correction: Micellar nanoparticles inhibit breast cancer and pulmonary metastasis by modulating the recruitment and depletion of myeloid-derived suppressor cells

Zhengze Lu , Houqin Liu , Ling Ma , Kebai Ren , Zhidi He , Man Li and Qin He *
Key Laboratory of Drug-Targeting and Drug Delivery System of the Education Ministry and Sichuan Province, Sichuan Engineering Laboratory for Plant-Sourced Drug and Sichuan Research Center for Drug Precision Industrial Technology, West China School of Pharmacy, Med-X Center for Materials, Sichuan University, Chengdu 610041, People's Republic of China. E-mail: qinhe@scu.edu.cn; Fax: +86-28-85502532; Tel: +86-28-85502532

Received 2nd May 2025 , Accepted 2nd May 2025

First published on 13th May 2025


Abstract

Correction for ‘Micellar nanoparticles inhibit breast cancer and pulmonary metastasis by modulating the recruitment and depletion of myeloid-derived suppressor cells’ by Zhengze Lu et al., Nanoscale, 2022, 14, 17315–17330, https://doi.org/10.1039/D2NR03880C.


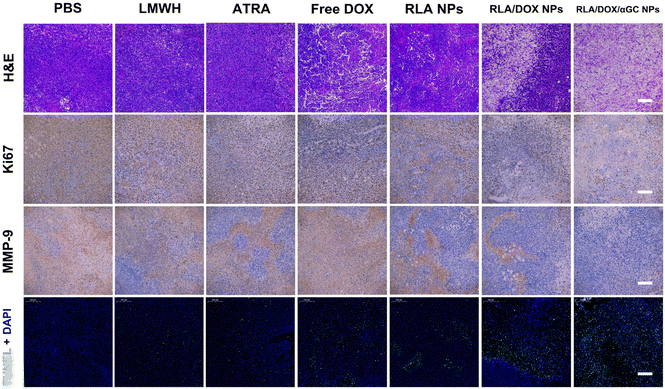
The authors regret that incorrect versions of Fig. 8 and Fig. S16 were included in the originally published article and ESI, respectively. The correct versions of Fig. 8 and Fig. S16 are shown below.
image file: d5nr90094h-f8.tif
Fig. 8 RLA/DOX/αGC NPs inhibited the progression of 4T1 breast cancer and pulmonary metastasis. (A) The timeline of this therapeutic experiment. (B) In vivo living images of 4T1-Luc tumor-bearing mice in the therapeutic experiment. (C) The distribution of metastatic nodules in the lungs of 4T1-Luc tumor-bearing mice. The dark purple areas in the images were the metastases. Scale bar represents 200 μm. (D) The semi-quantitative results of the metastatic area ratio (means ± SD, n = 3, *p < 0.05, **p < 0.01 and ***p < 0.001). (E) Tumor volume curves of mice in the therapeutic experiment (means ± SD, n = 7, *p < 0.05 and ***p < 0.001). (F) Body weight curves of mice in the therapeutic experiment (means ± SD, n = 7, **p < 0.01). (G) Overall survival curves of mice in the therapeutic experiment (Log-rank Test, n = 7, ***p < 0.001).


image file: d5nr90094h-u1.tif
Fig. S16 Immunohistochemical staining results of tumor tissue sections of 4T1-Luc tumor-bearing mice. (HE staining: hematoxylin stained nuclei (blue) and eosin stained cytoplasm and extracellular matrix (pink); Ki67 and MMP-9 staining: hematoxylin stained nuclei (blue), Ki67 positive cells (brown) and MMP-9 (brown); TUNEL staining: DAPI stained nuclei (blue) and TUNEL positive cells (green); scale bars represent 200 μm).

The Royal Society of Chemistry apologises for these errors and any consequent inconvenience to authors and readers.


This journal is © The Royal Society of Chemistry 2025
Click here to see how this site uses Cookies. View our privacy policy here.