
 Open Access Article
 This Open Access Article is licensed under a Creative Commons Attribution-Non Commercial 3.0 Unported Licence
Mesoporous anatase TiO2 mesocrystal for high-performance photocatalysis and lithium-ion batteries†
Wenxiong
Zhang
 *a,
Fangyi
Yao
b,
Mustafa
Al Samarai
a and
Qi
Feng
*c
*a,
Fangyi
Yao
b,
Mustafa
Al Samarai
a and
Qi
Feng
*c
aInstitute for Solid State Physics, The University of Tokyo, 5-1-5 Kashiwanoha, Kashiwa, Chiba 277-8581, Japan. E-mail: wenxiong_zhang@issp.u-tokyo.ac.jp
bGraduate School of Engineering, Osaka University, 2-1 Yamadaoka, Suita, Osaka 565-0871, Japan
cDepartment of Advanced Materials Science, Faculty of Engineering and Design, Kagawa University, 2217-20 Hayashi-Cho, Takamatsu-Shi 761-0396, Japan
First published on 18th March 2025
Abstract
Mesocrystals, with their unique structures composed of aligned nanocrystals, hold promise for energy conversion and storage applications. This study presents a novel approach to synthesizing platelike mesoporous anatase TiO2 mesocrystals from non-porous H1.07Ti1.73O4·nH2O (HTO) precursors. The synthesis involves solvothermal, acid, and heat treatments, starting with the formation of a BaTiO3/HTO (BT/HTO) nanocomposite via topochemical conversion. Subsequent selective acid leaching and controlled heat treatment at 700–900 °C produced mesoporous anatase TiO2 mesocrystals with a high specific surface area and mesoporosity. These mesocrystals exhibited outstanding photocatalytic activity, achieving a surface-specific degradation efficiency of methylene blue surpassing that of commercial P25. As an anode material for lithium-ion batteries, the mesocrystals delivered an exceptional initial discharge capacity of 667.5 mA h g−1 and maintained a reversible capacity of 243.1 mA h g−1 after 100 cycles at 100 mA g−1. The enhanced performance is attributed to their optimized mesoporosity, crystallinity, and nanostructural alignment. This study advances the understanding of mesocrystal synthesis and underscores the potential of mesoporous anatase TiO2 mesocrystals in sustainable energy and environmental applications.
Introduction
The escalating global energy crisis has promoted researchers to investigate novel strategies for energy harvesting, conversion, and storage.1,2 Within this context, mesocrystals have gained significant attention due to their unique properties and potential applications in various fields.3,4 Mesocrystals are polycrystalline structures composed of nanocrystals aligned along the same crystal-axis orientation.5 Their ordered nanoparticle assembly results in a rather novel and remarkable characteristic, making them promising candidates for applications in catalysis, sensing, and energy storage and conversion.Among various metal oxide materials, titanium dioxide (TiO2) has emerged as one of the prime candidates in environmental protection, energy, photocatalysis, and sensing applications.6,7 Among its different polymorphs, anatase TiO2 is particularly renowned for its superior photocatalytic performance, attributed to its high electron mobility,8 extended charge carrier lifetime,9 and longer exciton diffusion length.10 Furthermore, anatase is a highly active anode material for lithium-ion batteries (LIBs), offering high-rate performance, excellent cycling stability, and enhanced safety.11–14 Notably, TiO2 mesocrystals have already gained significant attention for their performance in diverse applications due to their relatively high specific surface area,15 porosity,16 and crystallinity.17 Compared to their counterparts, such as nanocrystals or polycrystals, TiO2 mesocrystals demonstrate distinct advantages, such as enhanced charge carrier mobility, improved catalytic efficiency, and superior structural stability.18
Mesocrystal fabrication typically involves either self-assembly or topotactic transformation methods.4 While self-assembly is relatively simple, it often involves complex processes with limited control over the final structure. In contrast, topotactic transformation allows for precise manipulation of crystal structure and morphology, making it particularly valuable for applications requiring specific dimensional characteristics, such as oriented ceramics for ferroelectric devices and efficient energy harvesting systems.19–26 Since Zhou et al. first successfully synthesized anatase TiO2 mesocrystals via topotactic conversion from NH4TiOF3 mesocrystals,19 there has been growing interest in designing these mesocrystals for enhanced photocatalysis and energy storage applications. Ye et al. first reported the formation of anatase mesocrystal by additive-free self-assembly synthesis, where a highly improved rate performance of LIB was achieved.27 In our previous research, we reported the formation of platelike TiO2 mesocrystalline polymorphs by heating a H1.07Ti1.73O4·H2O (HTO) single crystal with lepidocrocite-like (γ-FeOOH) structure and platelike morphology by topochemical conversion.20 Unfortunately, these mesocrystals demonstrated a relatively low photocatalytic performance due to the low specific surface area and porosity. This is due to the inheritance of the non-porous plate-like structure from the parental HTO precursor.
In this study, we present a straightforward method involving solvothermal, acid, and heating treatments to fabricate the 2D platelike mesoporous anatase TiO2 mesocrystals from the platelike HTO precursors. Introducing porosity is crucial for improving the specific surface area and reaction kinetics of mesocrystals, thereby enhancing their performance in charge/discharge processes and photocatalytic reactions.28,29 For instance, in LIB anodes, porous structures enable better electrolyte flow, and reduce Li-ion diffusion lengths, leading to enhanced reaction kinetics, yielding an increased performance and stability. Similarly, in photocatalysis, the high crystallinity and specific surface area of porous mesocrystals increase catalytic efficiency, offering promising solutions for environmental remediation and energy conversion. This study aims to explore and develop energy-related technologies by optimizing the synthesis strategy and by elucidating structural characteristics of mesoporous TiO2 mesocrystals, contributing to the further development of sustainable energy solutions for the future.
Experimental
Sample preparation
H1.07Ti1.73O4·H2O (HTO) powder sample was synthesized using the K0.80Ti1.73Li0.27O4 precursor following a previously reported method.23,24 Then platelike mesoporous anatase TiO2 mesocrystals were obtained using a topochemical conversion process. Initially, platelike HTO crystals (0.4 g) and Ba(OH)2·8H2O (mole ratio of Ba/Ti = 0.5) were solvothermally mixed in a 30 mL of distilled water/ethanol (5/25) mixture by vigorous stirring and heating at 150 °C for 12 h. To obtain mesocrystalline BaTiO3/HTO (BT/HTO) nanocomposites, the resulting product was washed with distilled water and dried at 60 °C for 12 in air. Subsequently, the mesocrystalline BT/HTO sample (1 g) was purified from excess BT by washing with 2 M HCl for 12 h. The resulting powder sample was then dried at 60 °C for 12 h in air. Finally, the obtained porous HTO (P-HTO) samples were heated in the air at a temperature range of 200–1000 °C for 3 h, (10 °C min−1), then cooled to room temperature to obtain mesoporous anatase TiO2 mesocrystals. Samples prepared from P-HTO precursor are abbreviated as P-HTO-X, where X corresponds to the temperature of heat treatment. Additionally, for the sake of reference, TiO2 mesocrystal was prepared by direct heating treatment of HTO at 700 °C in air.20Physical properties analysis
The crystal structures of the resulting powder samples were investigated using a powder X-ray diffractometer (Shimadzu, XRD-6100) with Cu Kα (λ = 0.15418 nm) radiation. The particle size and morphology of the samples were defined using field emission scanning electron microscopy (FE-SEM) (Hitachi, S-900). In addition, transmission electron microscopy (TEM) and selected-area electron diffraction (SAED) were performed on a JEOL Model JEM-3010 system at 300 kV, with the powder sample supported on a Cu microgrid to study the intrinsic properties of a relatively thin section of the sample. The thermal behavior of P-HTO crystals was studied by thermogravimetric and differential thermal analyses (TG-DTA) using a DTG-60H thermogravimetric analyzer (Shimadzu) in static air, with a heating speed of 10 °C min−1 from room temperature to 1000 °C. N2 physisorption experiments were performed to define pore size distributions and specific surface and pore areas were using a Quantachrome Autosorb-1-MP apparatus at 77 K. The specific surface area was calculated from the N2 adsorption isotherm using the Brunauer–Emmett–Teller (BET) method.Photocatalytic characterization
The TiO2 samples (20 mg) were immersed in 20 mg L−1 methylene blue (MB) aqueous solution (100 mL). The resulting suspension was then stored in the dark for 2 h under stirring to reach the adsorption/desorption equilibrium. Subsequently, under continuous stirring, the sample was irradiated by 100 W ultraviolet light (UVA, Asahi Spectra, LAX-Cute) beam source distanced at ∼5.0 cm from the sample. Also, variations in the concentrations of MB in the suspension during the UV-exposure experiment were recorded by a Shimadzu UV-2450 spectrophotometer.Electrochemical measurements
The working electrode was prepared by mixing the active material with acetylene black and a polyvinylidene fluoride (PVDF) binder at a weight ratio of 7![[thin space (1/6-em)]](https://www.rsc.org/images/entities/char_2009.gif) :2:1 in N-methylpyrrolidone (NMP). The resulting slurry was then pasted on copper foil and dried in vacuum oven at 110 °C for 48 h. After drying, the material was pressed into ∼15.8 mm diameter disk. The average loading mass of active material was ∼1.0 mg cm−2. Electrochemical measurements were conducted using CR2032 half cells, assembled in an argon-filled glovebox (Mbraun, Germany) with O2 and H2O levels maintained below 0.5 ppm. Furthermore, metallic Li foil was used as the counter electrode, while a microporous polypropylene film served as the separator. The electrolyte was a solution of LiPF6 dissolved in a mixture of ethylene carbonate, ethyl methyl carbonate, and dimethyl carbonate (DMC) in a 1:1:1 volumetric ratio. Charge/discharge and rate performances within a voltage range of 0.01 to 3.0 V were evaluated using a battery testing system (Shenzhen, Neware, China).
:2:1 in N-methylpyrrolidone (NMP). The resulting slurry was then pasted on copper foil and dried in vacuum oven at 110 °C for 48 h. After drying, the material was pressed into ∼15.8 mm diameter disk. The average loading mass of active material was ∼1.0 mg cm−2. Electrochemical measurements were conducted using CR2032 half cells, assembled in an argon-filled glovebox (Mbraun, Germany) with O2 and H2O levels maintained below 0.5 ppm. Furthermore, metallic Li foil was used as the counter electrode, while a microporous polypropylene film served as the separator. The electrolyte was a solution of LiPF6 dissolved in a mixture of ethylene carbonate, ethyl methyl carbonate, and dimethyl carbonate (DMC) in a 1:1:1 volumetric ratio. Charge/discharge and rate performances within a voltage range of 0.01 to 3.0 V were evaluated using a battery testing system (Shenzhen, Neware, China).
Results and discussion
To obtain the mesoporous anatase TiO2 mesocrystals, a BT/HTO nanocomposite was first synthesized by the solvothermal reaction of the platelike HTO single crystal with Ba(OH)2·8H2O.23,30,31 After that, the BT component in the BT/HTO nanocomposite was discarded by 2 M HCl acid treatment. Finally, the resulting P-HTO was calcined at different temperatures to obtain the porous TiO2 mesocrystals. As shown in Fig. 1a, the layered HTO phase exhibited a basal spacing of 0.882 nm that corresponds to the d-value of the (020) plane at the 2θ of 9.8°. Meanwhile, the platelike morphology of the resulting HTO was confirmed by the TEM result (Fig. 2a). The SAED pattern of HTO exhibited distinct diffraction spots attributed to the orthorhombic HTO phase along the [010] (b-axis), which is perpendicular to the basal plane of the platelike HTO crystal (Fig. 2b). Based on the analysis results of XRD (Fig. 1b) and TEM data (Fig. 2c), the formation of homogeneously distributed BT nanocrystals within the HTO host crystal with a size of ∼40 nm was confirmed. Notably, the single-crystal-like SAED pattern revealed uniform-orientated BT nanocrystals in the HTO exhibited along the [110] direction, thus confirming the formation of the BT/HTO nanocomposite mesocrystal (Fig. 2d).32 Furthermore, TEM data of the acid-treated sample displayed the complete leaching of the BT nanocrystals in the BT/HTO nanocomposite, resulting in the formation of holes (∼40 nm) in the platelike HTO particles (Fig. 2e), resulting in porous HTO (P-HTO). Moreover, the structure of the resulting P-HTO was verified as HTO nanosheets with uniformly distributed mesopores, following exfoliation with 0.016 mol L−1 TBAOH solution (Fig. S1†).33 Additionally, the weak (101) peak of anatase (JCPDS file no. 21-1272) was also detected by XRD (Fig. 1c), which was further confirmed by the HRTEM image in Fig. 2f. These TiO2 nanoparticles were formed firstly by a dissolution reaction (1) of the BT nanoparticles followed by a deposition reaction (2):| BaTiO3 + 2H+ + H2O = Ba2+ + Ti(OH)4 | (1) |
| Ti(OH)4 = TiO2 + 2H2O | (2) |
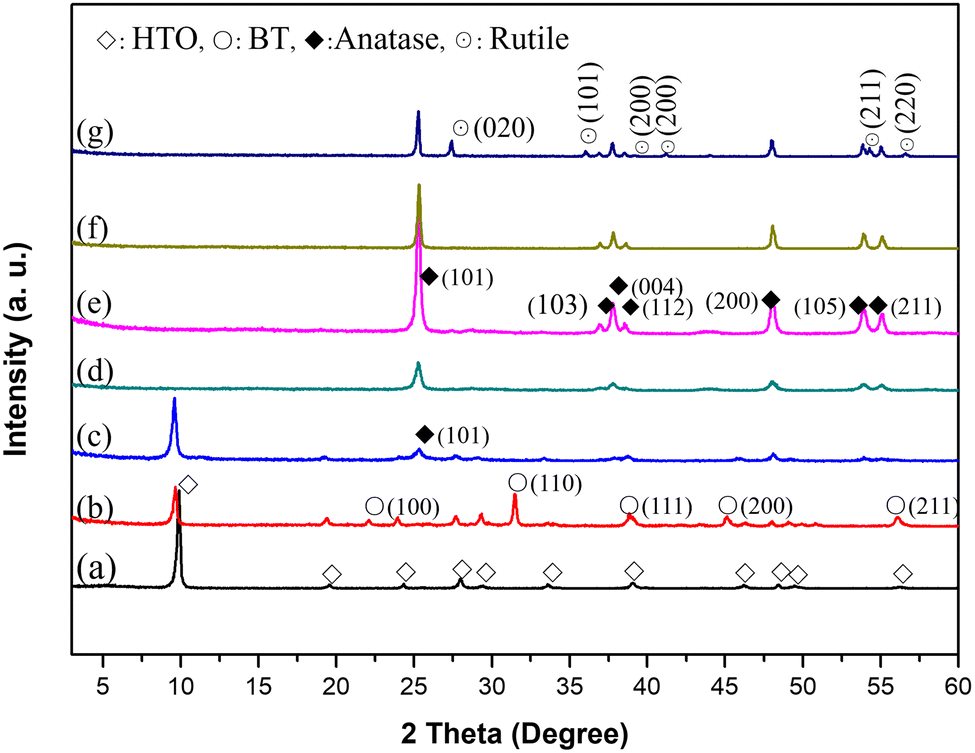 | ||
| Fig. 1 XRD patterns of (a) HTO single crystal, (b) BT/HTO nanocomposite obtained from the solvothermal reaction of HTO and Ba(OH)2·8H2O, (c) P-HTO obtained from the HCl treatment of the BT/HTO nanocomposite for 12 h and samples obtained from the heat treatments of P-HTO at (d) 700, (e) 800, (f) 900 and (g) 1000 °C for 3 h. | ||
 | ||
| Fig. 2 (a, c and e) TEM images and (b and d) SAED patterns of (a and b) HTO single crystal precursor, (c and d) BT/HTO sample obtained after solvothermal treatment of HTO in Ba(OH)2 solution with the molar ratio of Ba/Ti = 0.5 at 150 °C for 12 h, and (e) sample obtained by acid treatment of BT/HTO by 2 M HCl solution. (f) HRTEM image derived from the white pane in the TEM image (e). (g) FFT pattern obtained from the HRTEM (f). | ||
To explore the phase transformation from P-HTO to porous anatase TiO2, P-HTO crystals were annealed at different temperatures up to 1000 °C, and XRD patterns of the resultant products are shown in Fig. S2† and Fig. 1c–g. The P-HTO phase transitioned through three TiO2 polymorphs: TiO2(B), anatase, and rutile upon heat treatments. During the heat treatment step, initially, the most intense (020) peak of the lepidocrocite HTO phase shifted rightward (Fig. 1a and Fig. S2a†), implying deintercalation of interlayer H2O, which reduced the basal spacing of layers until its complete decay with a temperature over 300 °C (Fig. S2†). The TG-DTA curves of the P-HTO crystal displayed a prominent endothermic peak at 90 °C, corresponding to significant weight loss due to H2O deintercalation (Fig. S3†). An almost full dehydration of P-HTO was achieved at 400 °C (Fig. S3†).
After heat treatment at 300 °C, the XRD pattern indicated the presence of both the layered HTO phase and a monoclinic TiO2(B) phase (JCPDS file no. 74-1940) (Fig. S2a†). The weak diffraction peaks indicate the low crystallinity in both phases. With further increasing temperature, the TiO2(B) phase gradually transformed into the anatase phase (Fig. S2†). Finally, the pure anatase phase was achieved following the heat treatment at 700 and 900 °C (Fig. 1d–f), while a further partial transformation of anatase into the rutile phase (JCPDS file no. 21-1276) was also confirmed by heating at 1000 °C (Fig. 1g). Interestingly, obtaining the anatase single phase via calcination of P-HTO is consistent with the behavior observed in H2Ti2O4(OH)2 and H2Ti3O7 crystals, where a single anatase phase was obtained after calcination at 700 °C.34,35 These XRD results suggest that P-HTO, derived from the acid treatment of the BT/HTO nanocomposite, undergoes an initial transformation from the TiO2(B) phase to the anatase phase, and subsequently at more elevated temperatures to the rutile phase, with the anatase phase being stable within the 700–900 °C temperature range.
Fig. 3 shows the TEM, HRTEM images, and SAED patterns of the samples following heat treatments of P-HTO crystals at 200 and 300 °C for 3 h. Both samples retained their platelike morphology. Simultaneously, nanocrystals formed on the surface of the platelike particles can be identified as anatase derived from the dissolution of BT (Fig. 3b and e). At 200 °C, three distinct sets of SAED patterns were observed (Fig. 3c). The first set corresponds to the HTO (M) phase,20 where the angle between the (002) and (200) planes shifting from 90° to 91°, indicating a structural change from an orthorhombic to a monoclinic system due to dehydration of the interlayer water. The second and third sets of patterns were attributed to TiO2(B) and anatase phases, respectively. This result is consistent with the XRD results shown in Fig. S2a.† The diffraction spots for TiO2(B) (020) and (−402) and for anatase (303) and (−303) were verified. Upon further heating to 300 °C, there are still three sets of SAED patterns corresponding to the HTO (M), TiO2(B), and anatase phases, thus further confirming the XRD results shown in Fig. S2b.† It is noted that the diffraction spots are slightly elongated, indicating a minor lattice mismatch between the boundaries of the nanoparticles when assembled in the same orientation denoted as a characteristic of mesocrystals.27 As the temperature increased to 500 and 600 °C, the HTO (M) phase disappeared, while the coexistence of TiO2(B) and anatase phases remained discernable (Fig. S2d and e†). This sequential transformation highlights the stability of the anatase phase at higher temperatures.
 | ||
| Fig. 3 (a and d) TEM images and (c and f) SAED patterns of samples after heat treatments of P-HTO crystals at (a–c) 200 and (d–f) 300 °C for 3 h, respectively. (b and e) HRTEM images are enlarged areas derived from the white panes shown in the TEM images (a) and (d), respectively. | ||
Fig. 4 shows the TEM images and SAED patterns of the samples after heat treatment of P-HTO crystals at 700, 800, and 900 °C for 3 h. Notably, the platelike morphology of the samples is maintained at 900 °C, which is further confirmed by the FE-SEM results shown in Fig. S4.† As the temperature rises from 700 to 900 °C, the size of the nanocrystals forming these platelike particles grow from 20 to 180 nm. The platelike particles collapse and the nanocrystals grow to a micrometer scale at 1000 °C (Fig. S4f†). Importantly, although the samples consist of polycrystals identified as anatase nanocrystals, they exhibit single-crystal-like SAED patterns, indicating the formation of anatase mesocrystals and that all anatase nanocrystals share the same orientation along the [010] zone axis. Furthermore, the porous structure of these anatase mesocrystals is also confirmed in the TEM images.
 | ||
| Fig. 4 (a–c) TEM images and (d–f) SAED patterns of samples after heating treatment of P-HTO crystals at (a and d) 700 °C, (b and e) 800 °C and (c and f) 900 °C for 3 h, respectively. | ||
The schematic in Fig. 5 illustrates and summarizes the formation mechanism of mesoporous anatase TiO2 mesocrystals from HTO single crystals. The process initiates with the formation of BT/HTO, where Ba2+ ions are intercalated into the layered bulk HTO crystal through the interlayer pathway via an H+/Ba2+ exchange reaction. Due to the 0.5 Ba/Ti molar ratio in the reaction system, approximately 50% of the HTO phase transforms into uniformly distributed BT nanocrystals within the platelike HTO particles (Fig. 2). There is a correlation between the crystal-axis directions of the HTO precursor and the BT product in the topochemical system, i.e. the [200] and [002] directions of the HTO phase align with the [002] and [1−10] directions of the BT phase, respectively (Fig. 2d). Consequently, all BT nanocrystals within a single platelike crystal of the BT/HTO nanocomposite share the same crystal-axis orientation along the [110] zone axis, aligning with the [010] zone direction of the HTO matrix crystal (Fig. 2d). Following the acid treatment of BT/HTO, the BT nanocrystals are completely dissolved, resulting in fully P-HTO particles. These P-HTO particles then transform into mesoporous anatase mesocrystals when subjected to heat treatments at 700, 800, and 900 °C (Fig. S5†). This process outlines a detailed pathway from the initial ion intercalation to the final formation of mesoporous anatase mesocrystals, highlighting the complex chemical reactions and physical transformations involved in this synthesis.
 | ||
| Fig. 5 Schematic illustration of the formation mechanism for the mesoporous anatase mesocrystal derived from the layered HTO single crystal. | ||
Considering the potential applications of anatase nanocrystals in photocatalysis, the photocatalytic activity of the mesoporous TiO2 mesocrystals prepared from P-HTO crystals was assessed by using commercial P25 nanocrystals as a benchmark (Fig. 6). The photocatalytic experiments demonstrated the photocatalytic efficiency with the following order: P-HTO-900 < P-HTO-800 < P-HTO-600 < P-HTO-700 (Fig. 6a). It is well established that the photocatalytic performance of TiO2 is influenced by crystal structure, specific surface area, and crystallinity.36 To understand the observed photocatalytic result, we analyzed the N2 physisorption results hence assessing the surface area and pore size of the synthesized TiO2 samples (Table 1 and Fig. S6†).37 All the samples prepared from P-HTO exhibited a distinct H3-type hysteresis loop, indicating a mesoporous structure with varying pore sizes.38 Notably, P-HTO-600, despite the larger surface area (38.6 m2 g−1) than P-HTO-700 (33.3 m2 g−1), it exhibited lower photocatalytic performance. This can be attributed to a reduced crystallinity as shown in Fig. S2.† The crystallinity of the prepared anatase mesocrystal increased with increasing the calcination temperature, but led to a significant reduction in surface area due to the nanocrystal growth within the mesocrystal (Table 1), thereby reducing the photocatalytic efficiency.
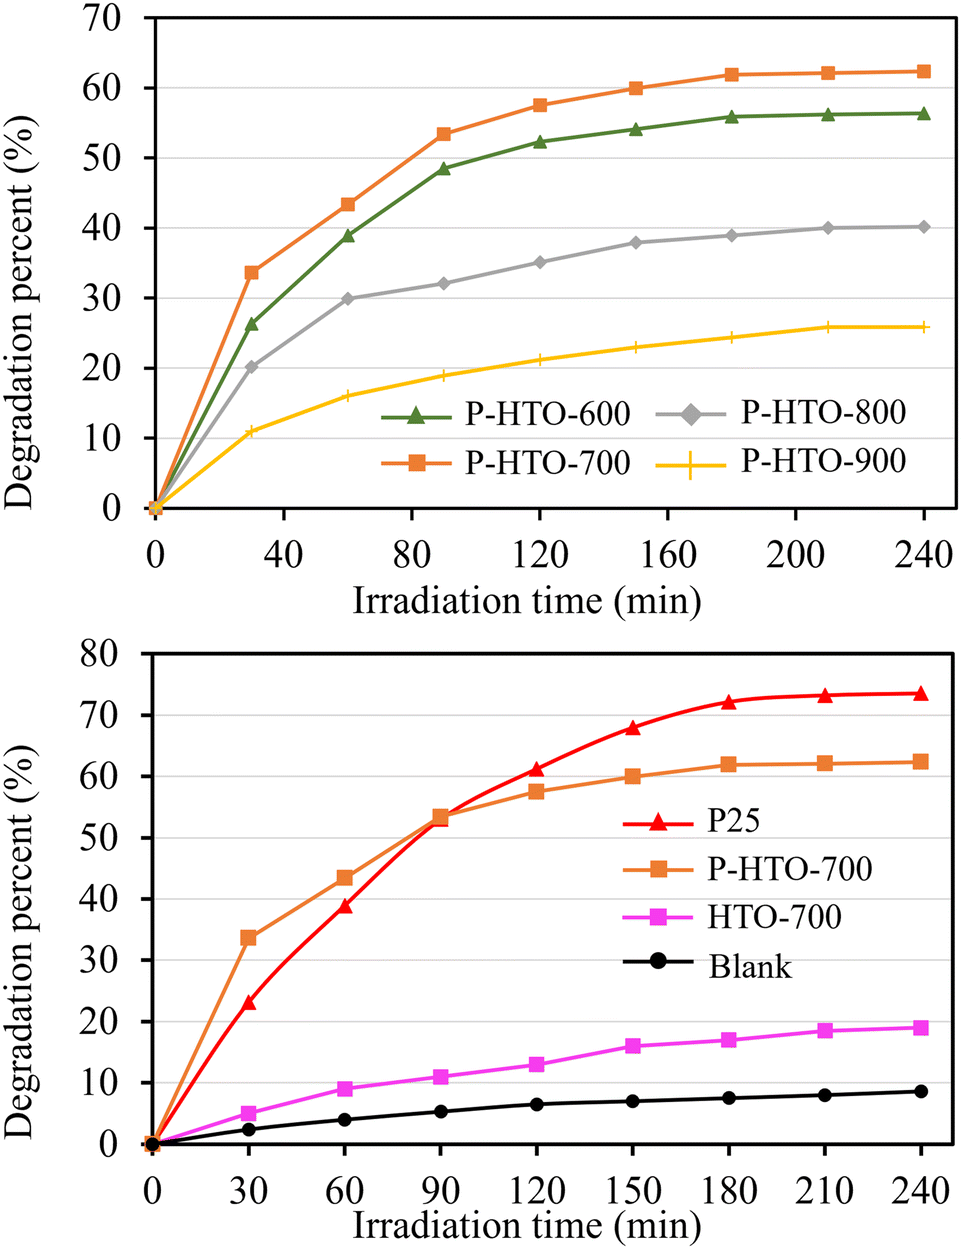 | ||
| Fig. 6 Variations of degradation percent of MB with irradiation time under UV light irradiating conditions for various TiO2 samples. | ||
| Samples | Surface area (m2 g−1) | Pore size (nm) | Pore volume (cm3 g−1) |
|---|---|---|---|
| P-HTO-600 | 38.6 | 6.5 | 0.166 |
| P-HTO-700 | 33.3 | 4.5 | 0.134 |
| P-HTO-800 | 14.9 | 3.5 | 0.106 |
| P-HTO-900 | 10.1 | 3.4 | 0.074 |
| HTO-700 | 5.8 | — | — |
| P25 | 63 | — | — |
Fig. 6b compares the photocatalytic activity of the commercial P25 sample with that of P-HTO-700 and HTO-700. The P25 sample, with a specific surface area of 63 m2 g−1, exhibited higher photocatalytic activity than P-HTO-700. This suggests that the superior performance of P25 is primarily due to its larger surface area, as a higher surface area is correlated to a higher photocatalytic activity. Nevertheless, P25 degraded MB is 1.12 times more effectively than P-HTO-700 at 240 minutes, yet its surface area was 1.89 times larger, implying that P-HTO-700 has a higher surface-specific photocatalytic activity than that of P25. Additionally, P-HTO-700 outperformed P25 in the first 30 minutes, likely due to the porosity of mesocrystals. High internal porosity and surface area in TiO2 mesocrystals enhance reagent adsorption and provide more active sites for photocatalytic reactions. In contrast, the HTO-700 mesocrystal exhibited the lowest photocatalytic activity, which can be attributed to its low surface area and non-porous structure. These findings indicate that introducing porosity to platelike mesocrystals not only increases surface area but also enhances reaction kinetics during photocatalysis. Achieving such porous TiO2 structures is challenging through conventional topochemical methods.
In addition to this improved photocatalytic performance, the mesoporous anatase TiO2 (P-HTO-700) exhibits excellent electrochemical properties. Given its superior photocatalytic activity, P-HTO-700 was selected for comparison with its non-porous counterpart: HTO-700. Fig. 7a and b present the charge/discharge profiles of the P-HTO-700 and HTO-700 electrodes at a current rate of 100 mA g−1 (0.59 C), respectively. The first discharge curves demonstrate a single plateau located at approximately 1.72 V, indicating the conversion of TiO2 into Li0.5TiO2. The subsequent charge plateau at around 2.25 V represents the extraction of Li+, consistent with the reversible intercalation mechanism.39 Typically, anatase TiO2 forms only orthorhombic Li0.5TiO2, limiting its theoretical capacity to 168.0 mA h g−1. However, in nanostructured TiO2, the quantum-size confinement effect can lead to the formation of cubic LiTiO2, which has a higher lithium storage capacity.40,41 For P-HTO-700 electrode, the first discharge capacity reaches 667.5 mA h g−1 (Fig. 7a), surpassing the reported 3D TiO2/carbon material (648.7 mA h g−1).42 This anomalously high capacity can be attributed to irreversible solid-state-interface formation, partial conversion reactions, and lithium trapping in mesoporous channels at low potentials.11 Meanwhile, the slope below 1.72 V suggests additional capacitive contributions from surface-driven lithium storage. In contrast, the HTO-700 electrode exhibits a lower first discharge capacity of 396.5 mA h g−1 (Fig. 7b), likely due to structural defects and cracks in the non-porous mesocrystals that hinder lithium diffusion.20 Over multiple cycles, the capacity of P-HTO-700 stabilizes at ∼243.1 mA h g−1 after 100 cycles, indicating that while the initial capacity overshoot is largely due to irreversible lithium consumption, a combination of intercalation and reversible pseudocapacitive lithium storage contributes to long-term cycling performance. These findings highlight the advantages of the mesoporous structure in facilitating efficient Li-ion transport and reversible storage.
 | ||
| Fig. 7 Charge/discharge profiles at a current density of 100 mA g−1 for (a) P-HTO-700 and (b) HTO-700 samples for various cycles. (c) Rate capability from 100 to 5000 mA h g−1 for P-HTO-700 and (b) HTO-700 samples. (d) Cycling performance at current density of 100 mA g−1 for P-HTO-700 and HTO-700 samples. All measurements were conducted within a voltage window of 0.01–3 V. | ||
Fig. 7c shows the rate performance of the P-HTO-700 and HTO-700 electrodes. After 10 cycles at 100 mA g−1, the P-HTO-700 delivers a discharge capacity of 257.5 mA h g−1, significantly higher than the 156.8 mA h g−1 observed for HTO-700. Remarkably, the P-HTO-700 mesocrystal maintains a reversible capacity of 81.8 mA h g−1 at an exceptionally high rate of 5000 mA g−1, which is three times higher than the 27.7 mA h g−1 delivered by the HTO-700 mesocrystal. Additional measurements at various current densities (Fig. S7a†) confirm that P-HTO-700 consistently exhibits the highest specific capacity, whereas P-HTO-900 shows the lowest capacity, likely due to excessive densification at high temperatures that restricts lithium-ion diffusion and reduces the number of accessible electrochemical sites. The P-HTO-600 and P-HTO-800 samples display intermediate performance, supporting a strong correlation between the structural features governed by the heat treatment temperature and the electrochemical behavior. Fig. 7d displays the cycling performance of P-HTO-700 and HTO-700 electrodes at constant current densities of 100 mA g−1. The P-HTO-700 electrode exhibits much higher and more stable capacity retention, maintaining 243.1 mA h g−1 after 100 cycles. Long-term cycling data for all heated P-HTO samples (Fig. S7b†) further demonstrate that P-HTO-700 retains the highest specific capacity over 100 cycles. In contrast, P-HTO-900 experiences a marked reduction in capacity to 130.3 mA h g−1, likely due to particle coarsening that impedes lithium-ion diffusion, while P-HTO-600 shows lower retention, possibly owing to insufficient crystallization and resultant structural instability. These results confirm that heat treatment at 700 °C yields the optimal balance between structural integrity and ion transport efficiency. In comparison, the non-porous HTO-700 electrode shows a lower capacity of 104.6 mA h g−1 after 100 cycles, underscoring the advantages of the mesoporous structure for efficient electron transfer and Li-ion storage. Moreover, after high current density testing (Fig. 7c), the capacity of the P-HTO-700 electrode recovers to 253.6 mA h g−1 at 100 mA g−1, demonstrating excellent reversibility. We attribute the improved lithium insertion behavior to the well-connected, highly crystalline anatase nanocrystals with minimal grain boundaries, which facilitate efficient electronic conduction and rapid Li-ion transport between the electrolyte and the mesocrystal electrode.
Conclusions
We have successfully synthesized mesoporous anatase TiO2 mesocrystals via a topochemical conversion of BT/HTO nanocomposites, followed by selective acid leaching and heat treatments. The mesocrystals achieved through this method demonstrated superior structural and functional properties, including highly ordered nanocrystals and mesoporosity. The photocatalytic activity of the mesoporous TiO2 mesocrystals, especially P-HTO-700, surpassed that of commercial P25 when evaluated on a surface-specific basis. This enhanced photocatalytic efficiency is attributed to the optimized mesoporosity, specific surface area, and crystallinity of the anatase TiO2 phase. Furthermore, as an anode material for lithium-ion batteries, P-HTO-700 delivered an impressive initial discharge capacity of 667.5 mA h g−1, excellent rate capability, and stable cycling performance, maintaining a reversible capacity of 243.1 mA h g−1 after 100 cycles at 100 mA g−1. The mesoporous structure facilitated efficient Li-ion diffusion, electron transport, and excellent reversibility during lithium insertion/extraction. These findings highlight the transformative potential of mesoporous anatase TiO2 mesocrystals in photocatalytic and electrochemical applications. The study also demonstrates a straightforward and scalable synthesis approach, paving the way for further development of energy conversion and storage technologies.Author contributions
All authors discussed the results and wrote the manuscript. Fangyi Yao contributed equally to this manuscript.Data availability
The data supporting this article have been included as part of the ESI.†Conflicts of interest
We declare no conflicts of interest.Acknowledgements
This work was supported by The Grants-in-Aid for Scientific Research (B) (no. 22H01869) from the Japan Society for the Promotion of Science.References
- P. Zhang, T. Tachikawa, M. Fujitsuka and T. Majima, Chem. – Eur. J., 2018, 24, 6295–6307 CrossRef CAS PubMed.
- C. Shao, Y. Zhao and L. Qu, SusMat, 2022, 2, 142–160 CrossRef CAS.
- H. Cölfen and M. Antonietti, Angew. Chem., Int. Ed., 2005, 44, 5576–5591 CrossRef PubMed.
- L. Zhou and P. O'Brien, J. Phys. Chem. Lett., 2012, 3, 620–628 CrossRef CAS PubMed.
- L. Zhou and P. O'Brien, Small, 2008, 4, 1566–1574 CrossRef CAS PubMed.
- R. M. Ahmed and I. Hasan, Mater. Today: Proc., 2023, 81, 1073–1078 Search PubMed.
- A. M. Pillai, A. Harisankar, P. S. Salini, B. John, S. SarojiniAmma and M. T. Devassy, Ionics, 2024, 30, 4257–4270 CrossRef CAS.
- H. Tang, K. Prasad, R. Sanjines, P. Schmid and F. Levy, J. Appl. Phys., 1994, 75, 2042–2047 CrossRef CAS.
- M. Xu, Y. Gao, E. M. Moreno, M. Kunst, M. Muhler, Y. Wang, H. Idriss and C. Wöll, Phys. Rev. Lett., 2011, 106, 138302 CrossRef PubMed.
- T. Luttrell, S. Halpegamage, J. Tao, A. Kramer, E. Sutter and M. Batzill, Sci. Rep., 2014, 4, 4043 CrossRef PubMed.
- B. Qiu, M. Xing and J. Zhang, J. Am. Chem. Soc., 2014, 136, 5852–5855 CrossRef CAS PubMed.
- Z. Hong, M. Wei, T. Lan and G. Cao, Nano Energy, 2012, 1, 466–471 CrossRef CAS.
- Z. Wang, X. Li, H. Xu, Y. Yang, Y. Cui, H. Pan, Z. Wang, B. Chen and G. Qian, J. Mater. Chem. A, 2014, 2, 12571–12575 RSC.
- A. M. Pillai, P. S. Salini, G. R. Krishnan, A. Chithra, B. John, S. Pillai, S. SarojiniAmma and M. T. Devassy, J. Alloys Compd., 2024, 976, 173064 CrossRef CAS.
- M.-G. Ma and H. Cölfen, Curr. Opin. Colloid Interface Sci., 2014, 19, 56–65 CrossRef CAS.
- B. Tian, X. Liu, B. Tu, C. Yu, J. Fan, L. Wang, S. Xie, G. D. Stucky and D. Zhao, Nat. Mater., 2003, 2, 159–163 CrossRef CAS PubMed.
- A. Testino, I. R. Bellobono, V. Buscaglia, C. Canevali, M. D'Arienzo, S. Polizzi, R. Scotti and F. Morazzoni, J. Am. Chem. Soc., 2007, 129, 3564–3575 CrossRef CAS PubMed.
- Z. Hong, H. Dai, Z. Huang and M. Wei, Phys. Chem. Chem. Phys., 2014, 16, 7441–7447 RSC.
- L. Zhou, D. Smyth-Boyle and P. O'Brien, J. Am. Chem. Soc., 2008, 130, 1309–1320 CrossRef CAS PubMed.
- D. Hu, W. Zhang, Y. Tanaka, N. Kusunose, Y. Peng and Q. Feng, Cryst. Growth Des., 2015, 15, 1214–1225 CrossRef CAS.
- D. Hu, X. Niu, H. Ma, W. Zhang, G. A. Sewvandi, D. Yang, X. Wang, H. Wang, X. Kong and Q. Feng, RSC Adv., 2017, 7, 30807–30814 RSC.
- D. Hu, W. Zhang, F. Yao, F. Kang, H. Cheng, Y. Wang, X. Kong, P. Wen and Q. Feng, CrystEngComm, 2018, 20, 728–737 RSC.
- W. Zhang, H. Ma, S. Li, D. Hu, X. Kong, S. Uemura, T. Kusunose and Q. Feng, Nanoscale, 2018, 10, 8196–8206 RSC.
- W. Zhang, S. Li, H. Ma, D. Hu, X. Kong, S. Uemura, T. Kusunose and Q. Feng, Nanoscale, 2019, 11, 3837–3846 RSC.
- D. Hu, L. Miao, Z. Zhang, L. Li, Y. Wang, H. Cheng, G. A. Sewvandi, Q. Feng, M. Fan and L. Zhao, Cryst. Growth Des., 2018, 18, 7264–7274 CAS.
- T. Wu, G. Deng and C. Zhen, J. Mater. Sci. Technol., 2021, 73, 9–22 CrossRef CAS.
- J. Ye, W. Liu, J. Cai, S. Chen, X. Zhao, H. Zhou and L. Qi, J. Am. Chem. Soc., 2011, 133, 933–940 CAS.
- S. Sun, X. Yu, Q. Yang, Z. Yang and S. Liang, Nanoscale Adv., 2019, 1, 34–63 CAS.
- E. Uchaker and G. Cao, Nano Today, 2014, 9, 499–524 CrossRef CAS.
- D. Hu, H. Ma, Y. Tanaka, L. Zhao and Q. Feng, Chem. Mater., 2015, 27, 4983–4994 CAS.
- W. Zhao, W. Zhang, Y. Wang, D. Hu, X. Kong, S. Uemura, T. Kusunose and Q. Feng, CrystEngComm, 2019, 21, 3854–3862 CAS.
- J. S. Chen, Y. L. Tan, C. M. Li, Y. L. Cheah, D. Luan, S. Madhavi, F. Y. C. Boey, L. A. Archer and X. W. Lou, J. Am. Chem. Soc., 2010, 132, 6124–6130 CAS.
- F. Yao, W. Zhang, D. Hu, S. Li, X. Kong, S. Uemura, T. Kusunose and Q. Feng, Desalination, 2022, 544, 116144 CAS.
- S. Pavasupree, Y. Suzuki, S. Yoshikawa and R. Kawahata, J. Solid State Chem., 2005, 178, 3110–3116 CrossRef CAS.
- L. Zhang, H. Lin, N. Wang, C. Lin and J. Li, J. Alloys Compd., 2007, 431, 230–235 CrossRef CAS.
- D. O. Scanlon, C. W. Dunnill, J. Buckeridge, S. A. Shevlin, A. J. Logsdail, S. M. Woodley, C. R. A. Catlow, M. J. Powell, R. G. Palgrave and I. P. Parkin, Nat. Mater., 2013, 12, 798–801 CrossRef CAS PubMed.
- L. Liu, M. Eriksson, J. Zou, Y. Zhong, Q. Liu, Z. Liu, Y.-L. Chiu and Z. Shen, J. Materiomics, 2019, 5, 350–356 CrossRef.
- Y. Li, S. Wang, D. Lei, Y.-B. He, B. Li and F. Kang, J. Mater. Chem. A, 2017, 5, 12236–12242 RSC.
- W. Li, F. Wang, S. Feng, J. Wang, Z. Sun, B. Li, Y. Li, J. Yang, A. A. Elzatahry and Y. Xia, J. Am. Chem. Soc., 2013, 135, 18300–18303 CrossRef CAS PubMed.
- R. Mo, Z. Lei, K. Sun and D. Rooney, Adv. Mater., 2014, 26, 2084–2088 CrossRef CAS PubMed.
- L. Kavan, M. Kalbác, M. Zukalová, I. Exnar, V. Lorenzen, R. Nesper and M. Graetzel, Chem. Mater., 2004, 16, 477–485 CrossRef CAS.
- S. Yang, Y. Cai, Y. Cheng, C. Varanasi and J. Liu, J. Power Sources, 2012, 218, 140–147 CrossRef CAS.
Footnote |
| † Electronic supplementary information (ESI) available. See DOI: https://doi.org/10.1039/d5nr00259a |
| This journal is © The Royal Society of Chemistry 2025 |