Selective highly sensitive gas sensing by using the BeP2C monolayer: a theoretical study†
Xiaobo
Yuan
a,
Weiyu
Xie
 *a,
Yongliang
Yong
 b,
Lu
Xu
a and
Daoxiong
Wu
 *a
*a
aSchool of Physics and Optoelectronic Engineering, School of Marine Science and Engineering, Hainan University, Haikou, 570228, China. E-mail: wyxie@hainanu.edu.cn; daoxiong@hainanu.edu.cn
bSchool of Physics and Engineering, Henan University of Science and Technology, Luoyang 471023, China
First published on 21st November 2024
Abstract
Identifying high-performance materials is essential for developing new gas sensors capable of detecting harmful gases. In this study, density functional theory (DFT) and the non-equilibrium Green's function (NEGF) method were employed to investigate the gas-sensitive properties of BeP2C monolayer films. The structural, electronic, transport and gas sensitivity characteristics of the BeP2C monolayer were examined for various adsorbed gases, including CO, CO2, NH3, NO, NO2, H2S, SO2, H2O and O2. Except for CO2 and O2, all other gases are bound to the substrate via ionic bonds, with SO2 additionally forming covalent bonds. Notably, NO, NO2 and SO2 have suitable adsorption energy on the BeP2C monolayer and can change the electronic properties of the material. Current–voltage (I–V) characteristics and transport functions reveal that the BeP2C monolayer exhibits high sensitivity and selectivity towards NO, NO2 and SO2 gases. The relative change in the work function for NO adsorbed on the BeP2C monolayer is 10.14%, indicating its promising potential as a work-function type gas sensor for detecting NO. The BeP2C monolayer is a high-performance, reusable gas sensor that can detect NO (2.61 ms) at room temperature and NO2 (3.83 s) at 400 K. Furthermore, due to its high adsorption energy, the BeP2C monolayer is also capable of capturing SO2. This study provides a theoretical foundation for the application of BeP2C in gas sensor technology.
1. Introduction
Air quality is intimately connected to human health, with industrial emissions and vehicle exhaust gases posing significant environmental and health risks.1 Pollutants such as NO2 and SO2 contribute to acid rain and can damage the human respiratory system.1,2 To address these challenges, a variety of gas sensors have been developed to detect harmful gases,3,4 with semiconductor gas sensors being particularly favored for their low cost and ease of fabrication. These sensors operate by measuring changes in the semiconductor resistance upon exposure to different gases5,6 and are typically composed of metal oxide materials like NiO and ZnO.7–11 However, traditional gas-sensitive materials have notable limitations, including high operating temperatures and low sensitivity. Researchers enhance the performance of existing gas sensors through various methods, such as doping and constructing heterostructures.12–15 In addition, researchers are exploring new materials with superior properties, particularly two-dimensional (2D) materials, which have garnered significant attention for their unique physical and chemical characteristics. These materials are being investigated for a range of applications, including high-performance catalysis, batteries, and gas sensors.2D materials have been extensively studied due to their unique physical and chemical properties, which have found diverse applications in fields such as high-performance catalysis, batteries, and gas sensors.16–21 In the field of gas sensors, a variety of 2D materials have the potential to develop into high-performance sensors,22–26 because 2D materials have considerable prospects due to their large specific surface area, high carrier mobility and large number of adsorption sites.27–29 For example, the sandwich structure of the MoS2 monolayer,30,31 monolayers of metallic stanene,32,33 and various carbon-based 2D materials have been studied.34–43 The gas-sensitive properties of various 2D materials, such as CxNy,34–37 BxCy,38 CxPy,39,40 and BxCyPz,41 have been extensively studied. Recently, Azarmi et al. discovered a novel carbon-based 2D material, the BeP2C monolayer, which demonstrates sensitivity to visible light.42 With a structure and band-gap similar to that of the B3C2P3 monolayer,41,43 the BeP2C monolayer emerges as a promising candidate for gas sensor applications. However, research into its gas-sensitive properties is still in the early stages. Therefore, it is crucial to investigate the adsorption properties and underlying physicochemical mechanisms of the BeP2C monolayer to fully realize its potential as a high-performance gas sensor material.
In this study, the gas-sensitive properties of the BeP2C monolayer were investigated using first-principles calculations. The BeP2C monolayer was modeled, and its interactions with eight common gas molecules were examined. We analyzed energy band diagrams, density of states diagrams, and electron local density distributions to assess the effects of gas adsorption on the material's structure and electronic properties. Additionally, we calculated the I–V characteristic curves and transmission spectra of the gas-adsorbed monolayer using the non-equilibrium Green's function method to further validate our findings. The results show that the BeP2C monolayer functions as a work function sensor for NO, effectively detects NO at room temperature and NO2 at 400 K, and is suitable for SO2 capture, providing a preliminary theoretical basis for future research and applications.
2. Computational details and models
In this paper, the Vienna ab initio simulation package (VASP) code was used for first-principles calculations, employing the projector-augmented wave (PAW) method.44,45 The visualization software VESTA was used to construct the model.46 The truncation energy of the material was set to 500 eV. We tested the structural energy at various cutoff energies and determined that 500 eV was appropriate, as shown in Fig. S1 of the ESI.† The long-range dispersion forces were factored by using the D4-Grimme correction (DFT-D4) scheme.47,48 The electron exchange energy and correlation energy are calculated using the Perdew–Burke–Ernzerhof (PBE) functional in generalized gradient approximation (GGA).49–51 For sampled Brillouin zone (BZ) calculations, the 5 × 5 × 1 k-point grids were used for geometry optimization and the 10 × 10 × 1 k-points grids were used for electronic structure calculations by the means of Monkhorst–Pack (MP) methods.52 To test k-point convergence, we calculated the total energy of the BeP2C monolayer with different k-point meshes and found that 5 × 5 × 1 and 10 × 10 × 1 meshes are sufficient to ensure calculation accuracy, as shown in Fig. S1 of the ESI.† The vacuum region of 20 Å was added to the structure to prevent interlayer interactions. The corresponding threshold values of 10−6 eV, 10−2 eV Å−1 and 5 × 10⁻³ Å were chosen for convergence tolerance of energy, maximum force and maximum system. The HSE06 hybrid functional with norm-conserving pseudopotentials was used to calculate the material's band gap.53 In addition, we calculated the electron localization function (ELF) to analyze the adsorption type and used the climbing image nudged elastic band (CINEB) method54,55 to calculate the diffusion barrier of the gases, with a convergence criterion of 0.02 eV Å−1, as implemented in the VASP procedure. The non-equilibrium Green's function (NEGF) method was employed to compute the transmission characteristics using the Nanodcal code.56–58 The behavior of all elements was described using double-zeta polarized atomic orbital basis sets (DZP), with the PBE functional employed. For self-consistency and transmission coefficient calculations, a k-point grid of 1 × 1 × 1 was used. The electron transmission spectrum at zero bias voltage, the transmission spectra at 0–1 V bias, and the I–V curve were calculated.The adsorption energy (Eads) that describes the adsorption stability of molecule on the BeP2C monolayer was defined as follows:
| Eads = ET − EP − EG | (1) |
 | (2) |
| T(E) = Tr[ΓR(E,V)GR(E,V)ΓL(E,V)GA(E,V)] | (3) |
3. Results and discussion
3.1 Structural and electronic properties of gases on the BeP2C monolayer
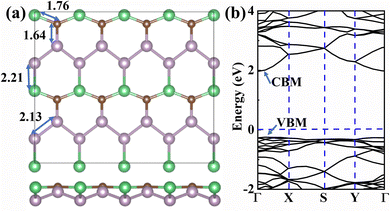
The BeP2C monolayer, composed of beryllium, phosphorus, and carbon, is a two-dimensional graphene-like material. Its 4 × 2 × 1 supercell structure is illustrated in Fig. 1a. The lattice parameters of the BeP2C monolayer are a = 3.25 Å and b = 5.50 Å, with bond lengths of 1.76 Å (Be–C), 1.64 Å (C–P), 2.21 Å (Be–P), and 2.13 Å (P–P). These results are consistent with previous data, confirming the accuracy of our structure.42 In the work of Azarmi et al.,42 the phonon spectrum of the BeP2C monolayer was calculated. Additionally, we conducted ab initio molecular dynamics (AIMD) simulations of the BeP2C monolayer, as shown in Fig. S2 of the ESI.† The NVT ensemble was adopted, and the system temperature was set to 300 K and 400 K. The molecular dynamics simulations were performed at the Gamma point and lasted for 10.0 ps, with a time step of 1 fs. These results indicate that the BeP2C monolayer exhibits excellent stability at 400 K, with even better stability at 300 K.We further calculated the band structure and density of states (DOS) to determine the fundamental properties, as shown in Fig. 1b. The band-gap calculated using the PBE method is 1.462 eV, while the HSE06 method yields a band-gap of 2.217 eV, both of which are in general agreement with previous studies.42 The energy band structure obtained using the PBE method is presented in Fig. S3 of the ESI.†Fig. 1b shows that the conduction band minimum (CBM) and valence band maximum (VBM) are both located between the Γ and X points, with a difference of 0.06 eV. This indicates that the BeP2C monolayer is an indirect band-gap semiconductor.
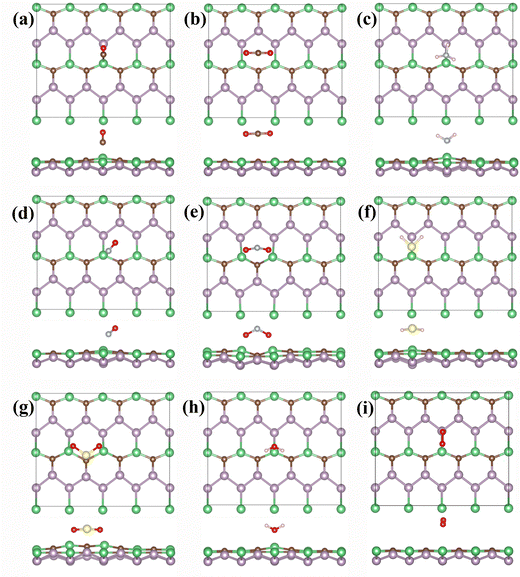
To investigate the gas-sensitive properties of the BeP2C monolayer, we adsorbed eight common gas molecules (CO, CO2, NH3, NO, NO2, H2S, SO2, H2O and O2) onto its surface. The BeP2C monolayer offers numerous adsorption sites, including four top sites (Be, P, and C atoms), four bridge sites (Be–C, C–P, P–P, and Be–P bonds), and two hollow sites. Additionally, the orientation of gas molecule adsorption can vary. Considering these factors, we constructed various adsorption configurations for each gas. After structural optimization, we identified the most stable adsorption configuration for each gas molecule on the monolayer, as depicted in Fig. 2.
Our results indicate that the optimal adsorption sites for most gas molecules are near the Be atom, except CO2, which adsorbs on a hollow site. Except for CO2 and O2, the adsorption of other gases slightly deforms the BeP2C monolayer. Moreover, the adsorption distances are relatively short; except CO2 and H2S, the distances between the gases and the BeP2C monolayer range from 1.65 to 1.79 Å. The adsorption energies vary among the gases, reflecting differences in adsorption distances. Notably, NH3, NO2, and SO2 exhibit the largest adsorption energies, with values of −1.083 eV, −1.079 eV, and −1.494 eV, respectively. The adsorption energies of CO2 and O2 on the BeP2C monolayer are −0.198 eV and −0.114 eV, respectively. The adsorption energies of the other gases range from −0.504 eV to −0.721 eV. Detailed data are presented in Table 1. In addition, we calculated the diffusion barriers of nine gases on the BeP2C monolayer, as shown in Fig. S4 (ESI†). The largest diffusion barrier is for CO (1.309 eV), while NH3 (0.975 eV), NO2 (0.864 eV), and SO2 (1.270 eV) also have relatively high barriers. The smallest barrier is for O2 (0.027 eV). This indicates that the diffusion of CO, NH3, NO2, and SO2 on the BeP2C monolayer is more difficult, while O2 diffusion encounters minimal hindrance.
| System | E ads (eV) | E g (eV)a | Q (eV) | τ (s) (300 K) | τ (s) (400 K) |
|---|---|---|---|---|---|
| a The values of band gaps obtained using the PBE method (out of parentheses) and the HSE06 method (in parentheses). | |||||
| CO | −0.583 | 1.324 (2.073) | −0.203 | 6.10 × 10⁻³ | 2.18 × 10⁻⁵ |
| CO2 | −0.198 | 1.456 (2.210) | −0.030 | 2.11 × 10⁻⁹ | 3.11 × 10⁻¹⁰ |
| NH3 | −1.083 | 1.351 (2.086) | −0.439 | 1.5 × 10⁶ | 4.30 |
| NO | −0.561 | 0.745 (1.900) | −0.314 | 2.61 × 10⁻³ | 1.15 × 10⁻⁵ |
| NO2 | −1.079 | 0.104 (0.513) | −0.852 | 1.29 × 10⁶ | 3.83 |
| H2S | −0.504 | 1.335 (2.075) | 0.004 | 2.88 × 10⁻⁴ | 2.21 × 10⁻⁶ |
| SO2 | −1.494 | 1.104 (1.730) | −0.850 | 1.19 × 10¹³ | 6.41 × 10⁶ |
| H2O | −0.721 | 1.398 (2.142) | −0.019 | 1.26 | 1.19 × 10⁻³ |
| O2 | −0.114 | 0.835 (2.214) | −0.046 | 8.19 × 10⁻¹¹ | 2.72 × 10⁻¹¹ |
Based on adsorption distances and energies, we can infer that CO, NH3, NO, NO2, SO2, and H2O are not physically adsorbed on the BeP2C monolayer. To more accurately determine the type of adsorption, we calculated the electron localization function (ELF) diagrams, as shown in Fig. 3. The ELF analysis reveals that, with the exception of CO2 and O2, all gases are ionically bonded to the Be atom of the BeP2C monolayer. For NO2 and SO2, the two oxygen atoms are ionically bonded to Be, while the sulfur atom in SO2 is covalently bonded to the carbon atom of the substrate, which accounts for the high adsorption energy of SO2 on the BeP2C monolayer.
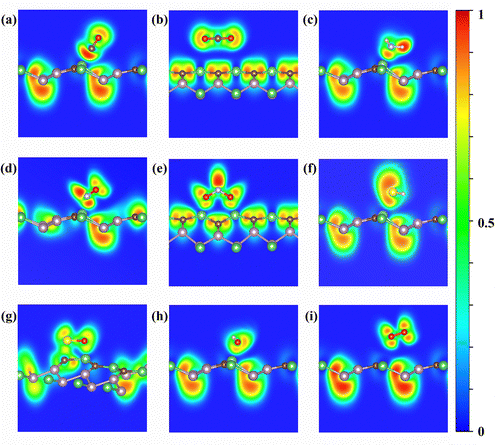 | ||
| Fig. 3 ELF plots of (a) CO, (b) CO2, (c) NH3, (d) NO, (e) NO2, (f) H2S, (g) SO2, (h) H2O, and (i) O2 adsorbed on the BeP2C monolayer. | ||
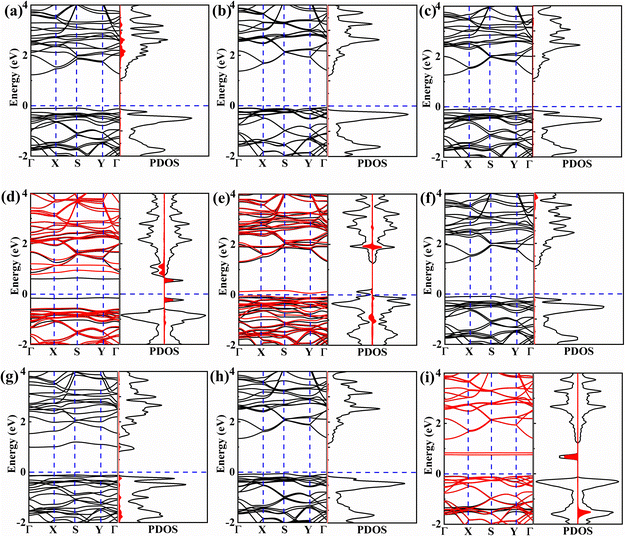
We further calculated the energy band structure and density of states (DOS) diagrams for the gas-adsorbed configurations, as shown in Fig. 4. The variation in the band gap due to gas adsorption can be determined using the following equation:
 | (4) |
However, after NO adsorption, selective spin splitting occurs, resulting in a spin-up band gap of 1.340 eV and a spin-down band gap of 0.745 eV. This phenomenon arises because spin-down NO introduces impurity states both above and below the Fermi level, thereby reducing the band gap, as depicted in Fig. 4d. Similarly, NO2 adsorption induces spin polarization in the BeP2C monolayer, producing a band gap of 0.104 eV for spin-down electrons and 1.380 eV for spin-up electrons (Fig. 4e). The PDOS analysis reveals that the spin-down peak near the Fermi energy level is not due to NO2, which might be attributed to the deformation of the BeP2C monolayer caused by NO2 adsorption. Additionally, since O2 is a polar molecule, spin polarization occurs in the system, resulting in the generation of spin-down impurity states below the conduction band, which reduces the band gap of the BeP2C monolayer to 0.835 eV, as depicted in Fig. 4i.
The extent of charge transfer can indicate the degree to which the gas alters the properties of the BeP2C monolayer. As shown in Table 1, the maximum charges obtained by NO2 and SO2 from the BeP2C monolayer are 0.852 e and 0.850 e respectively, which may be due to the strong interaction between the two gases and the BeP2C monolayer, which changes the structure of the substrate and accumulates electrons, while only H2S loses 0.04 e. These gases almost all gain electrons from the BeP2C monolayer. We believe this is simply because the material is more prone to losing electrons due to the presence of the element beryllium. To further visualize charge transfer, we plotted the charge differential density (CDD), as shown in Fig. 5. The analysis reveals that, for most gases, the yellow regions (indicating electron gain) are larger than the blue regions, except in the cases of CO2 and H2S. This suggests that these gases generally gain electrons, which aligns with the results of the Bader charge analysis. Additionally, a yellow charge region appears between the gases and the Be atoms of the BeP2C monolayer, except for CO2 and O2, confirming that these gases form ionic bonds with Be atoms. Notably, NO2 and SO2 exhibit the highest levels of electron gain. This could be attributed to the fact that two oxygen atoms of NO2 and all three atoms of SO2 are adsorbed on the BeP2C monolayer. In contrast, for other gases such as NO, only interaction with the Be atoms of the substrate occurs, resulting in weaker interactions, as shown in Fig. 5. The stronger interactions of NO2 and SO2 with the substrate lead to higher adsorption energies and greater charge transfer.
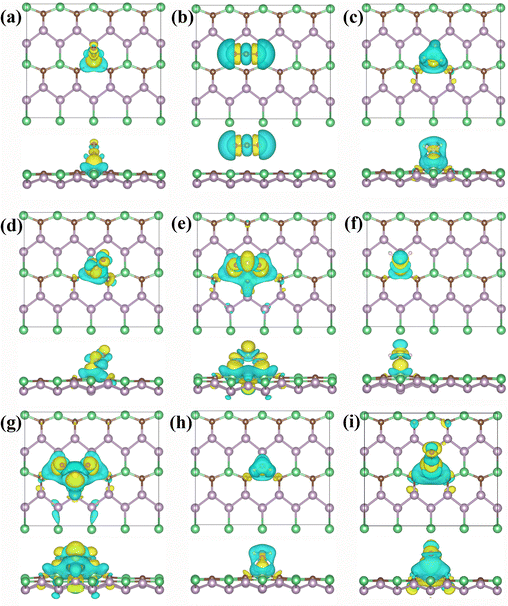 | ||
| Fig. 5 CDD plots of (a) CO, (b) CO2, (c) NH3, (d) NO, (e) NO2, (f) H2S, (g) SO2, (h) H2O, and (i) O2 adsorbed on the BeP2C monolayer. | ||
We also calculated the work functions of the BeP2C monolayer and the adsorption system; detailed data are shown in Fig. 6. The work function is a measurable quantity that indicates the energy required to move an electron from the Fermi level to the vacuum level, and a work function-based gas sensor can be developed based on changes in the surface work function.61,62 The work function of a pure BeP2C monolayer is 5.591 eV. The adsorption of SO2 and O2 has a minimal effect on the work function of the material. Only the adsorption of NO2 increased the work function of the BeP2C monolayer, increasing it to 5.778 eV. In contrast, the adsorption of other gases reduces the work function of the material to varying degrees. The most significant reduction occurs with the adsorption of NO, which lowers the work function of the BeP2C monolayer to 5.024 eV, resulting in a change rate of 10.14%, while the changes in the work function for other gases are less than 4.50%. Therefore, the BeP2C monolayer shows promise as a work function-based gas sensor for NO.
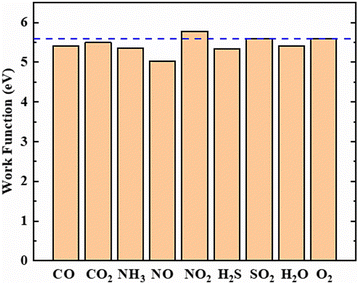 | ||
| Fig. 6 The work function of the BeP2C monolayer adsorbed with nine gases. The dashed blue line represents the work function of the pure BeP2C monolayer. | ||
For gas sensors, the most critical performance metrics are sensitivity and recovery time. Experimentally, sensitivity is measured by observing changes in a material's resistance before and after gas adsorption. Theoretically, sensitivity can be approximated by evaluating the change in the material's band gap, as a larger band gap shift generally corresponds to a more significant change in resistance or conductivity, thereby indicating higher sensitivity. In the following section, we will calculate the transport properties of the material to provide a more precise assessment of its sensitivity. The band gap value calculated by the HSE06 method is more accurate than that by the PBE method, so we use the band-gap value obtained by this method to calculate ΔEg. The ΔEg of BeP2C monolayer to NO, NO2, SO2 and O2 is 14.30%, 76.85%, 21.97% and 42.90%, respectively, while ΔEg < 7% of other gases, indicating that BeP2C single-layer film is sensitive to these three gases. The recovery time is determined using the following equation:
 | (5) |
3.2 Transport properties of the BeP2C monolayer with gas adsorption
Additionally, we investigated the transport properties of the BeP2C monolayer. The device model used for this study is depicted in Fig. 7 and consists of two electrode regions, two screening regions, and a central scattering region. For 2D materials, it is standard practice to use the electrodes themselves, and we introduced a substantial number of electrons to enhance electrode conductivity, thereby achieving more accurate results.40 To mitigate the adverse effects of the electrodes, we incorporated a 19.5 Å electrode extension area, which is adequate for such 2D materials. To assess the impact of gas adsorption on the transport properties of the BeP2C monolayer, we analyzed the transmission spectra and current–voltage characteristic curves for both the pure monolayer and those adsorbed with NO, NO2, H2S, and SO2 gases. | ||
| Fig. 7 The front view and side views of the two-probe system with the left and right electrode regions (in shade) and the central scattering region for detection gas molecules. | ||
The transmission spectrum at zero bias voltage is illustrated in Fig. 8. The pure BeP2C monolayer exhibits two peaks near the Fermi level. After gas adsorption, these peaks decrease to varying extents. Specifically, the adsorption of NO induces spin polarization in the BeP2C monolayer and significantly diminishes the peak on the left side of the Fermi level. Similarly, NO2 adsorption also causes spin polarization, which reduces the left-side peak and shifts the downward spin component towards the right side of the peak near the Fermi level. The adsorption of H2S has a minimal effect on the transmission spectrum of the BeP2C monolayer, whereas SO2 adsorption slightly reduces the peak on the right side of the Fermi level. Overall, the reduction in electron transmittance after gas adsorption is attributed to changes in the material's charge distribution, which impedes electron transmission. Additionally, the spin polarization effects of NO and NO2 further influence electron transport.
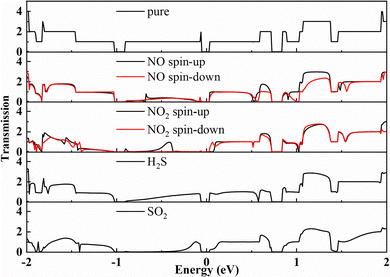 | ||
| Fig. 8 Transmission spectra of pure BeP2C monolayer and BeP2C monolayer adsorbed with NO, NO2, H2S, and SO2 under zero bias voltage. | ||
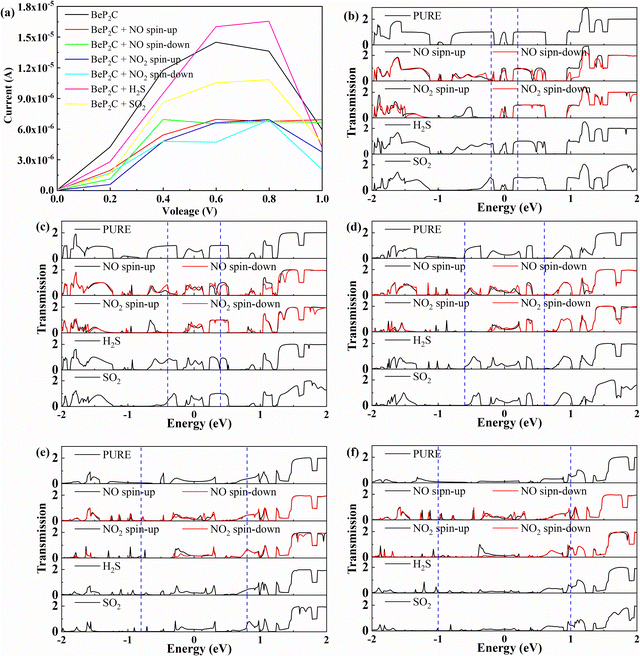
We investigated the current–voltage (I–V) characteristics of various gases adsorbed on the BeP2C monolayer, as depicted in Fig. 9a. We observed a negative differential resistance (NDR)64–66 effect at a bias voltage of 0.6 to 1 V, which also occurs when adsorbing NO2, H2S and SO2. However, the NDR of the BeP2C monolayer was inhibited following NO adsorption, indicating that NO can be detected through this phenomenon. Furthermore, gas adsorption typically reduces the current of the BeP2C monolayer, except in cases where the monolayer adsorbs H2S (between 0.6 and 0.8 V) and NO (at 1 V), which results in increased current.
To elucidate the voltammetry characteristic curve, we plotted the transmission spectra at various bias voltages, as shown in Fig. 9b to f. The bias window is represented by the area within the blue dashed lines in the figure, indicating the range that contributes to the current. Each transmission peak within these windows contributes to the current. We observed that the integral area of electron transmission increased from 0 V to 0.6 V, signifying a rise in electron transmission channels and, consequently, an increase in current. However, between 0.8 V and 1 V, the transmission peak decreases for all gases adsorbed on the BeP2C monolayer, except for NO. This results in a reduction in current, leading to a negative differential resistance phenomenon. Second, we observe that the charge transfer is inconsistent with the current change. For example, H2S shows yellow regions (indicating electron gain) that are not larger than those of SO2, yet the current change with voltage is more pronounced, as shown in in Fig. 5. We believe that this is due to the fact that CDD can clearly capture the charge movement and the polarization direction of the bonding electrons during the coupling process, while the current is related to the electron transmission spectrum. Therefore, the current of the BeP2C monolayer with adsorbed H2S molecules is higher than that with adsorbed SO2 molecules, possibly due to the increased current density within the bias window caused by the presence of H2S molecules.
4. Conclusions
In conclusion, we systematically investigated the gas-sensitive properties of the BeP2C monolayer by examining its adsorption, structural changes, and electronic and transport properties in response to various gas molecules (CO, CO2, NH3, NO, NO2, H2S, SO2, H2O and O2) using a combination of density functional theory (DFT) and the non-equilibrium Green's function (NEGF) method. Analysis of adsorption energy, charge transfer, adsorption distance, electron localization function (ELF), and charge density difference (CDD) revealed that, except for CO2, the other molecules form ionic bonds with the Be atoms of the substrate, while SO2 also exhibits chemical adsorption. The ΔEg value of the BeP2C monolayer to NO, NO2 and SO2 is 14.30%, 76.85% and 21.97%, respectively, indicating that these gases have a significant effect on the electronic properties of BeP2C monolayers. In addition, the adsorption of NO changes the work function of the material by 10.14%. These findings demonstrate the high sensitivity and selectivity of the BeP2C monolayer for these gases, further supported by electron transport properties such as current–voltage (I–V) characteristics and transmission spectra. At room temperature, the recovery time for NO is moderate (2.61 ms), while at 400 K, the recovery time for NO2 is 3.83 s. However, the recovery time for SO2 is excessively long, limiting its use for SO2 detection. These results highlight the potential of the BeP2C monolayer as a high-performance gas sensor capable of detecting NO at room temperature and functioning as a work-function-based sensor. The BeP2C monolayer can also detect NO2 at 400 K and serves as a candidate for SO2 capture. Our research provides a theoretical basis for the development of high-performance gas sensors, contributing to the sustainable development of society and the improvement of human health.Data availability
The data that support the findings of this study are available from the authors upon request.Conflicts of interest
The authors declare that there are no competing interests.Acknowledgements
This work was supported by the National Natural Science Foundation of China (No. 12204134), the Hainan Provincial Natural Science Foundation of China (123RC397 and 121QN167) and the Start-up Research Foundation of Hainan University (KYQD(ZR)-20093). We thank HZWTECH company for help and discussions regarding this study.References
- H. Y. Li, S. N. Zhao, S. Q. Zang and J. Li, Chem. Soc. Rev., 2020, 49, 6364–6401 RSC.
- R. Atkinson, Atmos. Environ., 2000, 34, 2063–2101 CrossRef CAS.
- H. Nazemi, A. Joseph, J. Park and A. Emadi, Sensors, 2019, 19, 1285 CrossRef CAS.
- N. Yamazoe, Sens. Actuators, B, 2005, 108, 2–14 CrossRef CAS.
- P. Raju and Q. Li, J. Electrochem. Soc., 2022, 169, 057518 CrossRef CAS.
- M. V. Nikolic, V. Milovanovic, Z. Z. Vasiljevic and Z. Stamenkovic, Sensors, 2020, 20, 6694 CrossRef CAS.
- G. F. Fine, L. M. Cavanagh, A. Afonja and R. Binions, Sensors, 2010, 10, 5469–5502 CrossRef CAS PubMed.
- N. Yamazoe, G. Sakai and K. Shimanoe, Catal. Surv. Asia, 2003, 7, 63–75 CrossRef CAS.
- A. Dey, Mat. Sci. Eng., B, 2018, 229, 206–217 CrossRef CAS.
- H. Chai, Z. Zheng, K. Liu, J. Xu, K. Wu, Y. Luo, H. Liao, M. Debliquy and C. Zhang, IEEE Sens. J., 2022, 22, 5470–5481 CAS.
- A. Singh, S. Sikarwar, A. Verma and B. Chandra Yadav, Sens. Actuators, A, 2021, 332, 113127 CrossRef CAS.
- A. Abbasi and J. J. Sardroodi, Surf. Sci., 2018, 668, 150–163 CrossRef CAS.
- A. Abbasi and J. J. Sardroodi, Appl. Surf. Sci., 2018, 442, 368–381 CrossRef CAS.
- A. Abbasi and J. J. Sardroodi, J. Inorg. Organomet. Polym., 2018, 28, 1901–1913 CrossRef CAS.
- A. Abbasi and J. J. Sardroodi, New J. Chem., 2017, 41, 12569–12580 RSC.
- X. Cai, Y. Luo, B. Liu and H.-M. Cheng, Chem. Soc. Rev., 2018, 47, 6224–6266 RSC.
- K. Khan, A. K. Tareen, M. Aslam, R. Wang, Y. Zhang, A. Mahmood, Z. Ouyang, H. Zhang and Z. Guo, J. Mater. Chem. C, 2020, 8, 387–440 RSC.
- V. Shanmugam, R. A. Mensah, K. Babu, S. Gawusu, A. Chanda, Y. Tu, R. E. Neisiany, M. Försth, G. Sas and O. Das, Part. Part. Syst. Charact., 2022, 39, 2200031 CrossRef.
- N. R. Glavin, R. Rao, V. Varshney, E. Bianco, A. Apte, A. Roy, E. Ringe and P. M. Ajayan, Adv. Mater., 2020, 32, 1904302 CrossRef CAS.
- H. Cui, Y. Guo, W. Ma and Z. Zhou, ChemSusChem, 2020, 13, 1155–1171 CrossRef CAS.
- V. Galstyan, A. Moumen, G. W. C. Kumarage and E. Comini, Sens. Actuators, B, 2022, 357, 131466 CrossRef CAS.
- J. Zhang, X. Liu, G. Neri and N. Pinna, Adv. Mater., 2016, 28, 795–831 CrossRef CAS PubMed.
- S.-J. Choi and I.-D. Kim, Electron. Mater. Lett., 2018, 14, 221–260 CrossRef CAS.
- L. Ge, X. Mu, G. Tian, Q. Huang, J. Ahmed and Z. Hu, Front. Chem., 2019, 7, 839 CrossRef.
- D. J. Buckley, N. C. G. Black, E. G. Castanon, C. Melios, M. Hardman and O. Kazakova, 2D Mater., 2020, 7, 032002 CrossRef CAS.
- Q. Li, Y. Li and W. Zeng, Chemosensors, 2021, 9, 225 CrossRef CAS.
- Z. Xiao, L. B. Kong, S. Ruan, X. Li, S. Yu, X. Li, Y. Jiang, Z. Yao, S. Ye, C. Wang, T. Zhang, K. Zhou and S. Li, Sens. Actuators, B, 2018, 274, 235–267 CrossRef CAS.
- S. W. Lee, W. Lee, Y. Hong, G. Lee and D. S. Yoon, Sens. Actuators, B, 2018, 255, 1788–1804 CrossRef CAS.
- S. Yuan and S. Zhang, J. Semicond., 2019, 40, 111608 CrossRef CAS.
- A. Abbasi and J. J. Sardroodi, Appl. Surf. Sci., 2019, 469, 781–791 CrossRef CAS.
- A. Abbasi, A. Abdelrasoul and J. J. Sardroodi, Adsorption, 2019, 25, 1001–1017 CrossRef CAS.
- A. Abbasi and J. J. Sardroodi, Physica E, 2019, 108, 382–390 CrossRef CAS.
- A. Abbasi, RSC Adv., 2019, 9, 16069 RSC.
- M. Chen, H. Zhang, H. Li, Z. Zhao, K. Wang, Y. Zhou, X. Zhao and D. P. Dubal, Coord. Chem. Rev., 2024, 503, 215653 CrossRef CAS.
- N. Kumar, M. Kumari, M. Ismael, M. Tahir, R. K. Sharma, K. Kumari, J. R. Koduru and P. Singh, Environ. Res., 2023, 231, 116149 CrossRef CAS.
- Z. Wang, R. Zhang, Z. Liu, X. Wei, M. Zhao, X. Zhang, Y. Yong, H. Cui and X. Li, Surf. Interfaces, 2023, 39, 102971 CrossRef CAS.
- Y. Yong, R. Gao, X. Yuan, Z. Zhao, S. Hu and Y. Kuang, Appl. Surf. Sci., 2022, 591, 153129 CrossRef CAS.
- S. R. Naqvi, T. Hussain, S. R. Gollu, W. Luo and R. Ahuja, Appl. Surf. Sci., 2020, 512, 145637 CrossRef CAS.
- K. Rajput, J. He, T. Frauenheim and D. R. Roy, J. Hazard. Mater., 2022, 422, 126761 CrossRef CAS.
- X. Fu, X. Cheng, W. Liao, J. Guo and L. Li, Chem. Phys. Lett., 2022, 806, 140041 CrossRef CAS.
- A. A. Kistanov, S. A. Shcherbinin, S. V. Ustiuzhanina, M. Huttula, W. Cao, V. R. Nikitenko and O. V. Prezhdo, J. Phys. Chem. Lett., 2021, 12, 3436–3442 CrossRef CAS PubMed.
- Z. Azarmi, M. Naseri and S. Parsamehr, Chem. Phys. Lett., 2019, 728, 14–18 CrossRef CAS.
- X. Yuan, Y. Yong, Q. Hou, H. Cui, K. Tian, W. Ju, X. Li and X. Li, Vacuum, 2024, 220, 112874 CrossRef CAS.
- G. Kresse and J. Furthmüller, Phys. Rev. B:Condens. Matter Mater. Phys., 1996, 54, 11169 CrossRef CAS PubMed.
- G. Kresse and D. Joubert, Phys. Rev. B:Condens. Matter Mater. Phys., 1999, 59, 1758 CrossRef CAS.
- K. Momma and F. Izumi, J. Appl. Crystallogr., 2011, 44, 1272–1276 CrossRef CAS.
- S. Grimme, J. Antony, S. Ehrlich and H. Krieg, J. Chem. Phys., 2010, 132, 154104 CrossRef.
- E. Caldeweyher, J.-M. Mewes, S. Ehlert and S. Grimme, Phys. Chem. Chem. Phys., 2020, 22, 8499 RSC.
- J. Perdew, K. Burke and M. Ernzerhof, Phys. Rev. Lett., 1996, 77, 3865 CrossRef CAS PubMed.
- M. Ernzerhof and G. E. Scuseria, J. Chem. Phys., 1999, 110, 5029–5036 CrossRef CAS.
- J. P. Perdew and W. Yue, Phys. Rev. B:Condens. Matter Mater. Phys., 1986, 33, 8800–8802 CrossRef PubMed.
- H. J. Monkhorst and J. D. Pack, Phys. Rev. B, 1976, 13, 5188–5192 CrossRef.
- J. Heyd, G. E. Scuseria and M. Ernzerhof, J. Chem. Phys., 2003, 118, 8207 CrossRef CAS.
- D. Sheppard, R. Terrell and G. Henkelman, J. Chem. Phys., 2008, 128, 134106 CrossRef.
- D. Sheppard, P. Xiao, W. Chemelewski, D. D. Johnson and G. Henkelman, J. Chem. Phys., 2012, 136, 074103 CrossRef PubMed.
- J. Taylor, H. Guo and J. Wang, Phys. Rev. B:Condens. Matter Mater. Phys., 2001, 63, 245407 CrossRef.
- A. P. Jauho, N. S. Wingreen and Y. Meir, Phys. Rev. B:Condens. Matter Mater. Phys., 1994, 50, 5528–5544 CrossRef CAS PubMed.
- D. Waldron, P. Haney, B. Larade, A. MacDonald and H. Guo, Phys. Rev. Lett., 2006, 96, 166804 CrossRef PubMed.
- S. Datta, Phys. Rev. B:Condens. Matter Mater. Phys., 1992, 45, 1347 CrossRef PubMed.
- H. H. B. Sørensen, P. C. Hansen, D. E. Petersen, S. Skelboe and K. Stokbro, Phys. Rev. B:Condens. Matter Mater. Phys., 2009, 79, 205322 CrossRef.
- M. W. K. Nomani, V. Shields, G. Tompa, N. Sbrockey, M. G. Spencer, R. A. Webb and G. Koley, Appl. Phys. Lett., 2012, 100, 092113 CrossRef.
- B. Roondhe, K. Patel and P. K. Jha, Appl. Surf. Sci., 2019, 496, 143685 CrossRef CAS.
- S. Peng, K. Cho, P. Qi and H. Dai, Chem. Phys. Lett., 2004, 387, 271–276 CrossRef CAS.
- J. Shim, S. Oh, D. H. Kang, S. H. Jo, M. H. Ali, W. Y. Choi, K. Heo, J. Jeon, S. Lee, M. Kim, Y. J. Song and J. H. Park, Nat. Commun., 2016, 7, 13413 CrossRef CAS.
- K. S. Jung, K. Heo, M. J. Kim, M. Andreev, S. Seo, J. O. Kim, J. H. Lim, K. H. Kim, S. Kim, K. S. Kim, G. Y. Yeom, J. H. Cho and J. H. Park, Adv. Sci., 2020, 7, 2000991 CrossRef CAS.
- W. Choi, S. Hong, Y. Jeong, Y. Cho, H. G. Shin, J. H. Park, Y. Yi and S. Im, Adv. Funct. Mater., 2021, 31, 2009436 CrossRef CAS.
Footnote |
| † Electronic supplementary information (ESI) available. See DOI: https://doi.org/10.1039/d4nj03925d |
| This journal is © The Royal Society of Chemistry and the Centre National de la Recherche Scientifique 2025 |

