
 Open Access Article
 This Open Access Article is licensed under a
 Creative Commons Attribution 3.0 Unported Licence
Co0.6Fe0.4O–Co1.4Fe1.6O4 core–shell nanoparticles with colossal exchange bias†
Samyog Adhikariab,
Roger D. Johnsonc,
Pascal Manueld,
Leonardo Lari ef,
Le Duc Tungab,
Vlado K. Lazarovef and
Nguyen Thi Kim Thanh*ab
ef,
Le Duc Tungab,
Vlado K. Lazarovef and
Nguyen Thi Kim Thanh*ab
aBiophysics Group, Department of Physics and Astronomy, University College London, Gower Street, London, WC1E 6BT, UK. E-mail: ntk.thanh@ucl.ac.uk
bUCL Healthcare Biomagnetics and Nanomaterials Laboratories, The Royal Institution, 21 Albemarle Street, London, W1S 4BS, UK
cCondensed Matter and Materials Physics, Department of Physics and Astronomy, University College London, Gower Street, London, WC1E 6BT, UK
dISIS Neutron and Muon Source, STFC Rutherford Appleton Laboratory, Chilton, Oxfordshire OX11 0QX, UK
eSchool of Physics, Engineering and Technology, University of York, Heslington, York, YO10 5DD, UK
fThe York-JEOL Nanocentre, York Science Park, Heslington, York YO10 5BR, UK
First published on 13th June 2025
Abstract
The exchange bias (EB) effect is widely utilized in spintronics with 2D materials like thin films. Exploring the EB effect in nanoparticles opens up tremendous opportunities, such as miniaturization of devices, enhanced efficiency, and tunable properties, all of which are size-dependent. Due to the increased surface area to volume ratio, magnetic nanoparticles display unique characteristics, allowing for the manipulation of their magnetic properties, such as the EB effect commonly observed between antiferromagnetic (AFM) and ferro-/ferrimagnetic (FM/FiM) materials. This work employs a simple and highly reproducible one-step thermal decomposition method to fabricate colloidally stable Co0.6Fe0.4O–Co1.4Fe1.6O4 core–shell (CS) nanoparticles with a lattice-matched interface and strong exchange coupling. We investigate their temperature and field-dependent magnetic properties using time-of-flight neutron diffraction and magnetometry. These nanoparticles exhibit the highest reported EB values among core–shell nanoparticles, reaching a maximum of 10.34 kOe. Additionally, the core exhibits antiferromagnetism above room temperature, with a Néel temperature of approximately 397 K, making it more suitable for high-temperature applications. This study paves the way for designing core–shell biphasic nanoparticles to enhance the EB effect and tune the effective magnetic anisotropy, offering potential future applications in nanospintronics and nanomedicine.
New conceptsThe exchange bias effect is vital in modern magnetic storage, sensors, and information processing technologies. While state-of-the-art devices utilize this effect using layered antiferro-ferro/ferrimagnet thin films, synthesizing colloidally stable biphasic nanoparticles remains challenging due to complex multi-step processes. We have achieved a major advancement in obtaining record colossal exchange bias by synthesizing high-quality core–shell Co0.6Fe0.4O–Co1.4Fe1.6O4 colloidal nanoparticles using thermal decomposition. Using double aberration-corrected atomic resolution transmission electron microscopy, we confirm the epitaxial relation between the antiferromagnet and ferrimagnet layer. Additionally, the core exhibits a Néel temperature of 397 K, as determined using time-of-flight neutron diffraction and magnetometry. This provides insightful knowledge on the magnetic phase transition of antiferromagnetic system at the nanoscale. The conceptual novelty lies in the straightforward and highly reproducible fabrication process, record colossal exchange bias, and a redefined phase stability limit for cobalt-iron oxide antiferromagnetic nanoparticles. Exchange bias in nanoparticle systems opens tremendous technological opportunities, such as the miniaturization of devices, enhanced efficiency and reactivity, better dispersibility for flexible applications, and tunable magnetic, electronic, and optical properties, all of which are size-dependent. Furthermore, the observed Néel temperature in the antiferromagnet core enhances its potential for high-temperature applications. |
Introduction
Magnetic nanoparticles have garnered significant attention in recent years due to their potential applications across various fields, such as biomedicine, catalysis, data storage, high-performance permanent magnets, and spintronic devices.1–5 Due to a high surface-area-to-volume ratio, these nanoparticles exhibit unique size-dependent properties. One such property is the exchange bias (EB) effect, an interfacial phenomenon where an antiferromagnetic (AFM) material couples with a ferro-/ferrimagentic (FM/FiM) material (Fig. 1), resulting in unidirectional anisotropy. The anisotropy is due to the “pinning” of the FM/FiM spins by the spins of the AFM material at the interface, which results in the shift of the magnetic hysteresis loop.6 The EB effect is widely utilized in the spintronic sector for data storage and information processing applications using thin films and single-phase materials.7–17 This can be attributed to well-established fabrication protocols and a deep understanding of the interfaces between the two phases. However, practical applications of the EB effect using nanoparticles are virtually non-existent. As a result, the advantages of nanoparticles, such as device miniaturization, enhanced efficiency, and tunability of properties due to their size dependence, have not been fully realized. A significant challenge in nanoparticle-based systems is the superparamagnetic limit, which results in low or insignificant anisotropy.18 Engineering a core–shell system with lattice-matched interfaces offers a potential solution, as it can help enhance and tune the magnetic anisotropy of nanoparticles.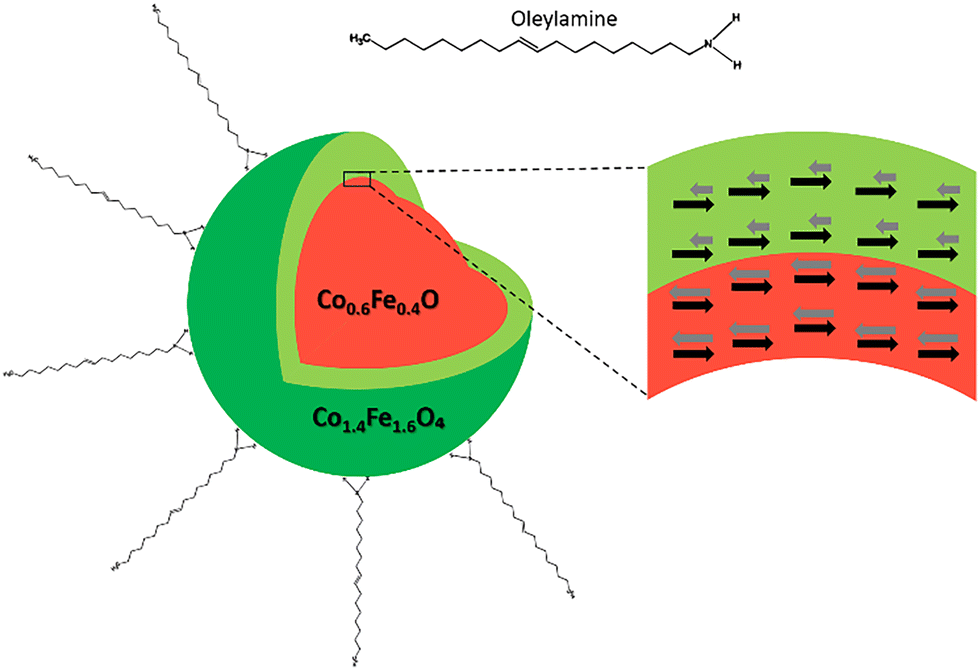 | ||
| Fig. 1 Schematic illustration of the colloidally stable AFM-FiM core–shell nanoparticle. | ||
In general, the EB effect is influenced by several factors, such as the formation of defects, the thickness of the AFM and FM/FiM layers, the interface's roughness, the material's crystallinity, and the interface's crystallographic orientation.19–25 In the case of nanoparticles, it is more complex as additional factors such as disordered surface spins and interparticle (dipolar) interactions can also affect the observed shift in the hysteresis loop. In ultrasmall nanoparticles (typically <3 nm), disordered surface spins can couple with the ordered core spins, and the differences in the magnetic anisotropies can lead to the EB effect.26–29 The choice of core and shell materials has been shown to affect dipolar interactions, which can influence the EB effect. For example, in nanoparticles with magnetically soft core and shell materials, the EB effect is significantly influenced by dipolar interactions. In contrast, in systems containing magnetically hard and soft materials, EB primarily originates from interfacial exchange interactions.30 Studies reporting giant EB generally employ a two-step synthesis process. First, core materials like Fe are synthesized using a wet chemical or gas-phase method, followed by the growth of a shell material like Fe2O3 through an oxidation process.31 A wide variety of core–shell systems, such as FeO–Fe3O4, Fe–Fe3O4, CoO–CoFe2O4, Co–CoO, MnO–Mn3O4, have shown varying EB due to differences in composition, size, interface quality, and material selection.32–36 Recent work demonstrated a 9 kOe EB in Co0.3Fe0.7O–Co0.6Fe2.4O4 core–shell nanoparticles at 10 K under a 50 kOe cooling field, though lower than our system’s value.37 Core–shell morphologies using transition metal oxides offer a promising approach for tuning nanoparticles' effective magnetic anisotropy (Keff). A comparison between the current work and other core–shell systems is presented in Table 1.
| Composition (core–shell) | EB (kOe) | Size (nm) | Cooling field (kOe) | Synthesis method | Ref. |
|---|---|---|---|---|---|
| a TD = Thermal decomposition. | |||||
| Co0.6Fe0.4O–Co1.4Fe1.6O4 | 10.3 | 8.6 | 40 | TDa | This work |
| Fe5C2–Fe3O4 | 0.5 | 18.0 | 50 | TD | 38 |
| Co–CoO | 0.8 | 17.5 | 10 | Sol–gel | 39 |
| Co–CoO | 3.6 | 12.0 | 50 | TD + oxidation | 35 |
| CoFe2O4–CoO | 3.7 | 12.4 | 70 | Seed-mediated polyol | 34 |
| CoO–CoFe2O4 | 5.6 | 14.9 | 70 | Seed mediated TD | 18 |
| Co0.3Fe0.7O–Co0.6Fe2.4O4 | 9.0 | 9.0 | 50 | TD | 37 |
Here, we employ a one-step thermal decomposition technique to synthesize Co0.6Fe0.4O–Co1.4Fe1.6O4 core–shell (CS) biphasic nanoparticles, which exhibit a remarkably high EB of 10.34 kOe. For comparison, we have also synthesized pure cobalt monoxide (CO) and cobalt ferrite (CFO) nanoparticles in similar conditions. Here, the spinel phase has a general formula AB2O4, where A and B represent the cations in the tetrahedral and octahedral sites, respectively. Ligands attach to the nanoparticles’ surface during synthesis, enhancing their colloidal stability and achieving a narrow size distribution. This method not only improves the nanoparticles’ homogeneity but also enhances the reproducibility of the synthesis process.40 These factors are crucial in nanoparticle synthesis, as even slight variations in size or interface area can lead to significant differences in the nanoparticles' properties and behavior. To our knowledge, 10.34 kOe is the highest reported EB in core–shell nanoparticles. The AFM core in the CS system and the pure CO nanoparticles also display Néel temperature (TN) at around 397 K, which is higher than the reported bulk value of CoO at around 293 K.41 This is attributed to Fe substitution in the CoO lattice and/or nanoscale effects, supported by neutron diffraction refinement and magnetometry results. The atomic-resolution transmission electron microscope (TEM) image shows a smooth lattice-matched interface between the core and the shell. The CS system has a significantly higher Keff value than the pure CO nanoparticles. This is attributed to (1) the strong exchange coupling between the AFM and FiM spins, (2) the high crystallinity of the Co0.6Fe0.4O core, and (3) its higher phase fraction in the CS system.16
Results and discussion
The X-ray diffraction (XRD) pattern of synthesized samples shows no impurities. The pure CO peaks match with hexagonal close-packed (P63mc, a = 3.21 Å, and c = 5.24 Å) and face-centered cubic (Fm![[3 with combining macron]](https://www.rsc.org/images/entities/char_0033_0304.gif) m, a = 4.26 Å) JCPSD reference pattern (Fig. 2f) where the most intense lines are that of hexagonal crystal plane (101). The CFO matches with the cubic (Fdm, a = 8.40 Å) crystal structure as expected, whereas the CS nanoparticle is a mixture of cubic CO and CFO. The strongest peak in the CS nanoparticles corresponds to the cubic CO (200) and CFO (400) planes. Hence, we assume that the AFM core in CS nanoparticles has a face-centered cubic structure (Fmm). This is confirmed by atomic resolution TEM (Fig. 2d).
m, a = 4.26 Å) JCPSD reference pattern (Fig. 2f) where the most intense lines are that of hexagonal crystal plane (101). The CFO matches with the cubic (Fdm, a = 8.40 Å) crystal structure as expected, whereas the CS nanoparticle is a mixture of cubic CO and CFO. The strongest peak in the CS nanoparticles corresponds to the cubic CO (200) and CFO (400) planes. Hence, we assume that the AFM core in CS nanoparticles has a face-centered cubic structure (Fmm). This is confirmed by atomic resolution TEM (Fig. 2d).
 | ||
| Fig. 2 TEM image of (a) pure CO, (b) pure CFO, and (c) biphasic CS nanoparticles with their particle size distribution (n = 300). (d) Double aberration corrected atomic-resolution STEM image of a CS nanoparticle with magnified core and shell section. CO(111) plane separates the core and the shell phases. (e) SAED pattern showing diffraction rings corresponding to the CO (orange) and CFO (light blue) phases. (f) XRD of all samples with hexagonal CO (reference code: 01-089-2803), cubic CO (reference code: 01-071-1178), and cubic CFO (reference code: 01-088-2152) reference patterns. | ||
Pure CO and CFO nanoparticles exhibit well-resolved peaks that were fitted in OriginPro software. A rough estimate of the crystallite size was performed using the Scherrer equation for comparison with TEM and dynamic light scattering (DLS) measurements. The crystallite size of pure CFO obtained using the (311) peak is 7.08 nm. The crystallite size of cubic CO obtained using (200) is 6.87 nm, whereas the hexagonal CO obtained using (220) is 6.85 nm in the pure CO sample. The phase fraction is estimated using the third most intense (220) cubic and (002) hexagonal peaks (eqn (S1), ESI†). Cubic CO accounts for 24.11% of the sample, whereas the rest contain the hexagonal crystal structure. For the CS sample, only the 32°–42° peaks could be deconvoluted due to significant peak overlap in others (Fig. S2, ESI†). The crystallite size of the AFM and FiM phases in the CS sample is 3.95 nm and 2.57 nm, respectively (Table 2). All fittings achieved an adjusted R2 value greater than 0.99. The TEM images display the spherical morphology of all synthesized nanoparticles with a narrow particle size distribution (Fig. 2a–c). The mean sizes of CO, CFO, and CS are 8.55 nm, 9.79 nm, and 8.64 nm, respectively, which are similar to the sizes obtained using the Scherrer equation (Table 2). Since nanoparticles smaller than ∼80 nm are typically single-domain,42 the synthesized nanoparticles are expected to be single-domain. Low magnification TEM images of all three nanoparticles are shown in Fig. S1a–c in the ESI.† Further investigation of the CS nanoparticles using atomic resolution Scanning TEM (STEM) reveals a well-matched lattice interface between the core AFM and the shell FiM phase, with the CO(111) crystal plane separating the spinel (outer) and rock-salt (inner) structures. The differences in the core and shell lattice can be observed in the magnified image (Fig. 2d). The epitaxial relation between the AFM and the FiM phases is further supported by the overlapping XRD peaks in the CS sample, such as the cubic CO (200) and CFO (400) planes, as well as the cubic CO (220) and CFO (440) planes (Fig. 2f). Selected area electron diffraction (SAED) clearly shows the presence of two structural phases: a rock salt structure associated with the AFM core and a spinel structure corresponding to the FiM shell (Fig. 2e). DLS is used to measure the solvodynamic size, i.e., the size of colloidal nanoparticles in a solvent. The DLS size-distribution of the synthesized nanoparticles functionalized with ligands and dispersed in n-hexane is shown in Fig. S1d, ESI.† CO, CFO, and CS are 11.74 nm, 13.52 nm, and 10.16 nm, respectively, which agrees with the size determined by TEM and XRD (Table 2).
| Sample | Crystal phase | Magnetic behavior | DXRD (nm) | DTEM (nm) | DDLS (nm) |
|---|---|---|---|---|---|
| Pure CO | Cubic | AFM | 6.87 ± 0.12 | 8.55 ± 1.46 | 11.74 ± 4.89 |
| Hexagonal | AFM | 6.85 ± 0.03 | |||
| Pure CFO | Cubic | FiM | 7.08 ± 0.02 | 9.79 ± 1.13 | 13.53 ± 5.54 |
| Biphasic CS | Cubic | AFM | 3.95 ± 0.15 | 8.64 ± 1.61 | 10.16 ± 5.22 |
| Cubic | FiM | 2.57 ± 0.18 |
Neutron diffraction measurements were conducted on the biphasic CS powder sample over a temperature range of 2 K to 813 K using the WISH diffractometer at ISIS, the UK Neutron and Muon source.43 Multi-phase Rietveld refinement was performed against the variable temperature data using FullProf,44 with representative data and fits shown in Fig. 3a–c. The temperature dependences of other key parameters extracted from Rietveld refinement are summarized in Fig. 3d–k. We note that on modelling the diffraction data, it was necessary to include a degree of preferential orientation of the nanoparticles along the [110] axis. While pure CO exhibits distinct peaks characterized mostly by the hexagonal crystal structure according to XRD results (Fig. 3f), the neutron diffraction and XRD data for the core AFM phase within the CS system are consistent with the cubic crystal structure (Fig. 1f and 2a). Furthermore, the magnetic propagation vector of the core's long-range antiferromagnetic order was found to be k = (1/2, 1/2, 1/2), consistent with previous reports of the bulk cubic CoO magnetic structure.45 The lattice parameter and composition of the FiM shell, expressed in terms of the percentage of Co on the A and B sites, are shown in Fig. 2g and h. The lattice parameter varies smoothly with temperature, exhibiting a gradual expansion as the temperature increases. The composition is relatively constant, up to around 480 K, beyond which the iron-rich spinel phase transforms towards Fe3O4 (we label this temperature point TB). We hypothesize that the cobalt ions start diffusing out of the nanoparticle beyond this point; however, the fate of diffused Co remains uncertain, as neutron diffraction only provides information from well-ordered structures. The lattice parameter of the core AFM component is shown in Fig. 3i and displays some anomalous behavior at high temperatures prior to its decomposition above ∼760 K (TD), at which point the CS nanoparticles recrystallize. Pre-empting recrystallization, a new crystalline phase appears above ∼700 K (TC), which we tentatively assign to a high-temperature spinel phase (Fig. 3j). The figure also illustrates the lattice parameter of this high-temperature spinel phase, which likely corresponds to Co3O4. The relative change in the background due to the hydrogen-containing material (ligands) being burnt off is shown in Fig. 3k. This occurs at a temperature above TA, which closely agrees with the thermogravimetric analysis (TGA) data (Fig. S5a, ESI†). The reduction of hydrogen-containing material from TA to ∼TB is attributed to the desorption of moisture, while the reduction observed beyond ∼TB is likely due to the burning of surface ligands from the nanoparticles. The refinement data reveal a mixed cobalt/iron composition in both the AFM core and the FiM shell. At room temperature, the composition of the cations in AFM core is (Co0.6Fe0.4)O, while the FiM shell has a composition of (Co0.6Fe0.4) for the A sites and (Fe1.2Co0.8) for the B sites.
 | ||
| Fig. 3 (a)–(c) Representative Rietveld refinements of neutron powder diffraction data of the AFM-FiM Co0.6Fe0.4O–Co1.4Fe1.6O4 core–shell measured at 453, 300, and 10 K. The black points and the red line represent the observed and calculated patterns, respectively. The black vertical tick marks indicate the positions of the nuclear CFO (first/top), magnetic CFO (second), nuclear CO (third), and magnetic CO (fourth/bottom) diffraction peaks. The blue line represents the difference between the observed and calculated plots. (d)–(f) Temperature dependence of the FiM-A site, FiM-B site, and AFM's magnetic moments, respectively. (g) and (h) The temperature dependence of the FiM lattice parameter, and composition plotted in terms of % cobalt on the A and B sites, respectively. Note that the difference in A and B site % cobalt values was constrained to be constant. (i) The temperature dependence of the lattice parameter of the AFM core. This phase decomposes above ∼760 K, at which point the whole sample undergoes recrystallization. (j) The lattice parameter of a new spinel phase that appears at high temperature prior to recrystallization. (k) The relative change in background is due to hydrogen-containing material being burnt off on heating. | ||
Bulk elemental analyses of the CS sample indicate excess Fe compared to the ordered Fe stoichiometry derived from neutron diffraction (Section S6, ESI†). This discrepancy arises because bulk methods detect both ordered and disordered Fe-rich phases, while neutron diffraction selectively probes the crystalline AFM-FiM CS structure. Complementary, the Fe2p spectrum (Fig. S7, ESI†) obtained using X-ray photoelectron spectroscopy (XPS) indicates the presence of Fe2O3/Fe(OH)3, which likely exists as the disordered phase, since we do not observe it in our neutron diffraction experiments.
Fig. 3d shows the refined magnetic moment at the A-site of the FiM shell, which was found to decrease gradually with temperature, reaching zero at T2 (∼770 K). This indicates the Curie transition temperature, which agrees with the TGA results (Fig. S5b, ESI†). The FiM B-site moment also tends to zero at T2, having undergone a slight increase observed at around 600 K (Fig. 3e), consistent with the thermally induced change in composition towards Fe3O4.
The temperature-dependent magnetic moment of the AFM Co0.6Fe0.4O core is presented in Fig. 3f. The moment vanishes at T1 (∼397 K), representing its TN. Additionally, the zero-field cooled-field cooled (ZFC–FC) graph of the pure CO nanoparticles shown in Fig. 4b shows two distinct points of divergence: the first at 7 K, supposedly the blocking temperature (Tb), and the second around 397 K, the TN of the material, which aligns well with the neutron diffraction data. The observed TN in the AFM nanoparticles may originate from nanoscale effects or Fe substitution. To our knowledge, such a high TN in similar AFM nanoparticles has not been previously reported.
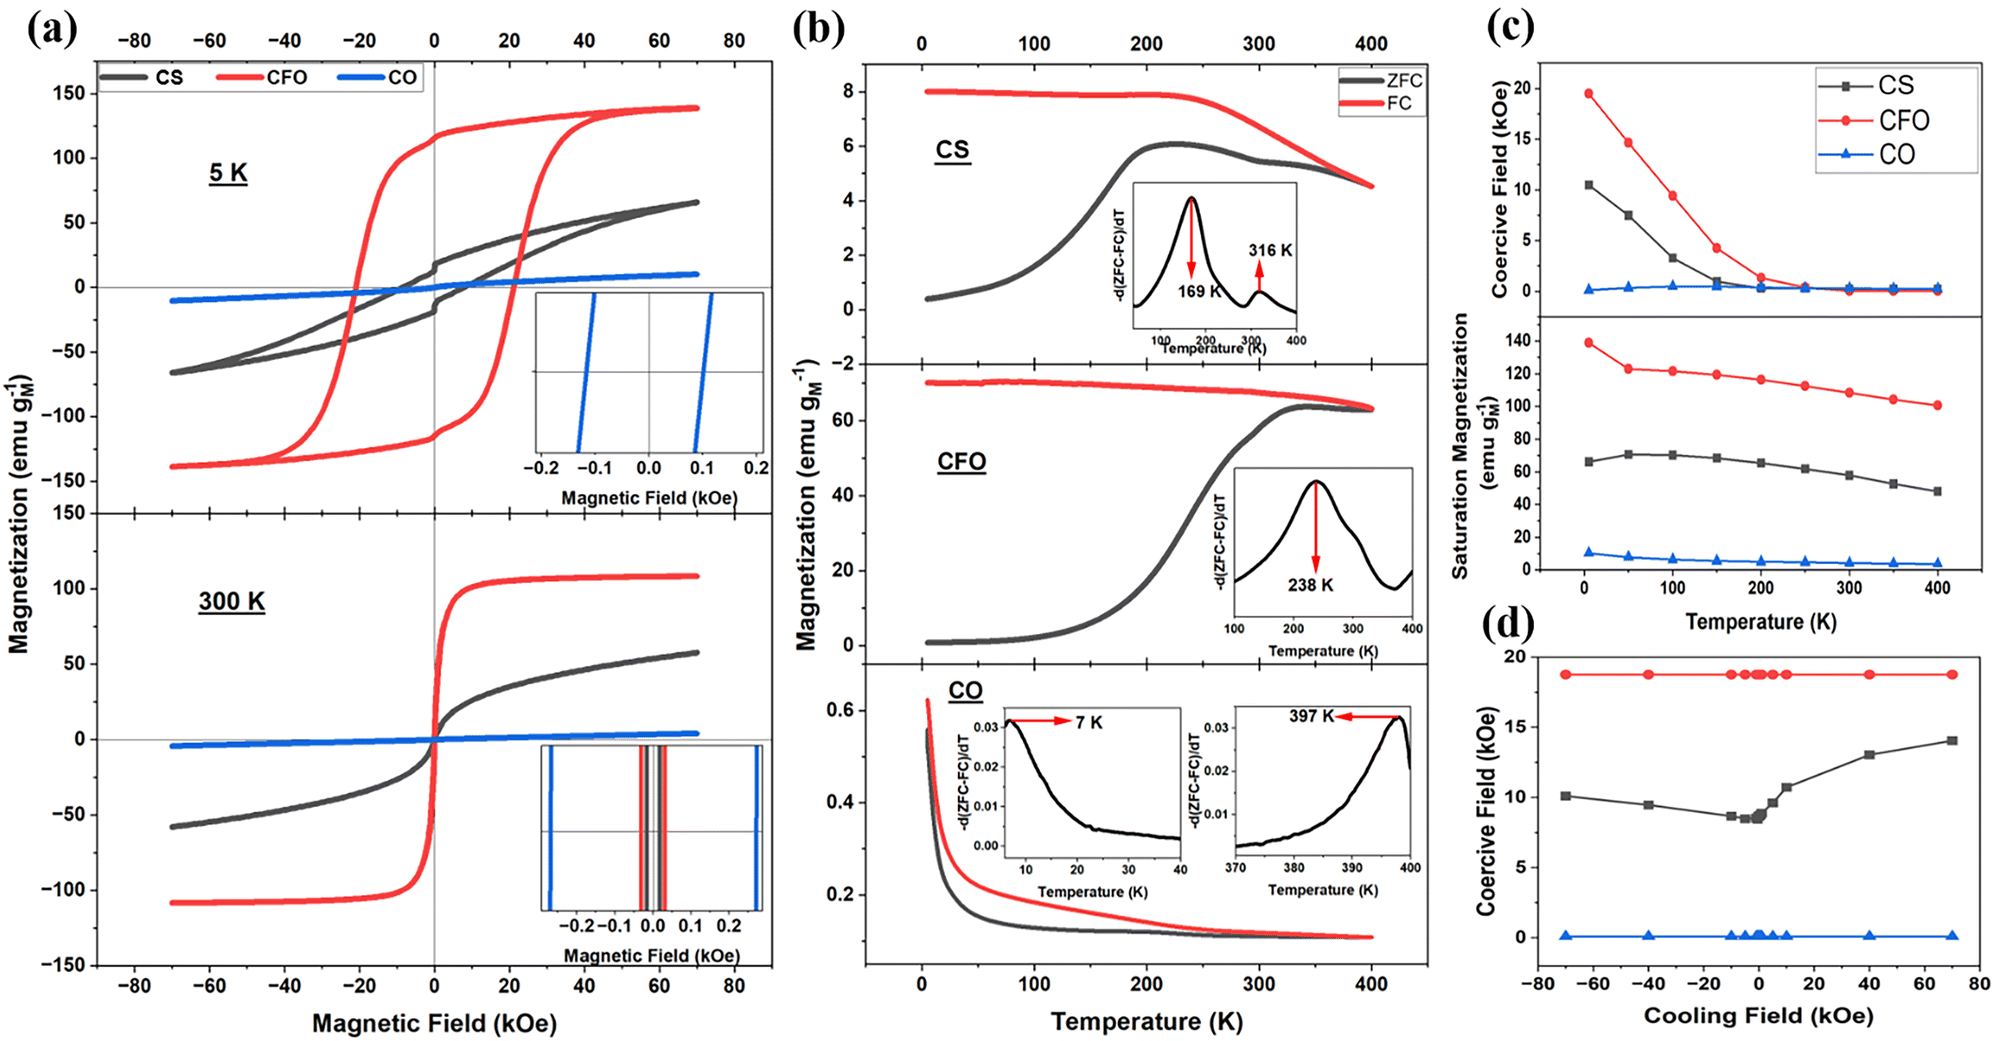 | ||
| Fig. 4 (a) Magnetic hysteresis loop of CO, CFO, and CS nanoparticles at 5 K and 300 K. (b) ZFC–FC curves and their derivative plots (inset) depicting points of divergence between ZFC and FC curves. (c) The coercive field (top pane) and maximum magnetization (bottom pane) obtained at 70 kOe as a function of temperature. (d) Coercive field as a function of cooling field strength measured at 5 K. | ||
The magnetic hysteresis loops of all three samples were measured at different temperatures from 5 K to 400 K (step size 50 K) to the magnetic field of ±70 kOe (Fig. S4a, d, e, ESI†). CFO and CS display FM/FiM characteristics at 5 K and superparamagnetic behavior at 300 K (Fig. 4a). Pure CO, in general, displays a linear hysteresis at all temperatures, characteristic of an AFM material. However, the presence of weak ferromagnetism is seen as a non-linear S-shaped curve at a lower field, particularly at 5 K (Fig. S4d, ESI†). This is attributed to the disordered spins on the surface of the CO nanoparticles, which can act as a weak ferromagnet and couple to the primary AFM phase. Consequently, the pure CO nanoparticles display a weak EB effect (Fig. S4e, ESI†). Repeated hysteresis loop measurements on this sample reflect the random nature of disordered surface spins, where the magnetization and coercive field differ slightly. Interestingly, when a cooling field of 10 kOe was applied, the overall magnetization of the sample decreased (Fig. S4b, ESI†), suggesting that the cooling field aligns the surface spins antiparallel to the neighboring spins, thereby reducing the total magnetization.
The magnetic hysteresis loops for all samples also exhibit kinks at zero applied magnetic field, as shown in Fig. 4a (top pane), characteristic of so-called exchange spring behavior. In both pure CFO and the CS, the non-uniform distribution of cobalt ions (with large anisotropy energy) and iron ions (with relatively small anisotropy energy) within the lattice can lead to such behavior. These loops generally result from the superposition of individual hard and soft hysteresis loops.46 For the CS nanoparticles, the interdiffusion of ions at the interface further contributes to variations in anisotropy energy across the system, resulting in pronounced exchange spring behavior.47–49 The relatively weaker kink observed in the pure CO sample (Fig. S4e, ESI†) is attributed to anisotropy energy differences between disordered surface and ordered core spins.
Temperature-dependent magnetization is studied by measuring ZFC–FC curves (Fig. 4b), where the point of divergence of the ZFC and FC curves is estimated using a derivative method, as outlined in the literature.50 For nanoparticles, this divergence typically represents the Tb, below which the magnetic moments of a given nanoparticle are ‘frozen’. Above the Tb, thermal energy is sufficient to cause the magnetic moments of individual nanoparticles to flip randomly, resulting in superparamagnetism. Pure CFO nanoparticles exhibit a Tb at 238 K, while biphasic CS exhibits a major peak at 169 K and a minor peak at 316 K (Fig. 4b). Such a bimodal distribution is observed in exchange-coupled biphasic nanoparticles and can be attributed to the competing magnetic anisotropies between the distinct phases within the CS structure.51,52 We also observe two divergence points for pure CO nanoparticles (Fig. 4b, bottom panel). The first is at 7 K, which most likely represents the Tb, as AFM metal oxides are known to exhibit relatively weak magnetic anisotropy energy.53,54 The divergence at 397 K and the neutron diffraction data (Fig. 3f) suggest elevated TN of CO nanoparticles, higher than the bulk value of ∼293 K. Using Tb values of 7 K, 238 K, and 169 K for CO, CFO, and CS nanoparticles, respectively, the Keff is calculated (eqn (S2) and Table S1, ESI†). The Keff value represents the energy required per unit volume to reorient the magnetization of a nanoparticle from the easy axis. It is affected by a combination of crystalline, shape, surface, and exchange anisotropy.55,56 The CS nanoparticles exhibit the highest Keff of 17.83 × 10⁴ Jm−3, while pure CO shows the lowest at 0.71 × 10⁴ Jm−3, and pure CFO has a similar value to the CS system (16.72 × 10⁴ Jm−3). The comparable Keff values of the CS and pure CFO nanoparticles suggests that the CS architectures retains the intrinsic high anisotropy of the FiM shell while enabling additional stabilization mechanisms, such as the exchange coupling with the AFM core. This synergy could help overcome the superparamagnetic limit in FiM nanoparticles by leveraging both enhanced anisotropy and interfacial effects.
At lower temperatures, the CS's coercivity is smaller than pure CFO's, consistent with their respective blocking temperatures. The differences are attributed to the CO phase, which has a weaker Keff (Table S1, ESI†). The coercivity of CFO and CS approaches zero near their respective blocking temperatures, indicating the switch to superparamagnetism (Fig. 4c, top pane). Additionally, the coercivity of CS is influenced by both the type (positive or negative) and the strength of the applied cooling field, as shown in the figure (Fig. 4d). The maximum magnetization of all samples generally decreases with increasing temperature as the thermal fluctuations destabilize the alignment of the dipoles (Fig. 4c, bottom pane).
Fig. 5a shows the EB effect in the CS nanoparticles as positive and negative fields are applied while cooling to 5 K. The cooling field aligns the FiM spins relative to the AFM spins. When a positive magnetic field is applied, the hysteresis loop shifts to the negative (x-axis) direction and vice-versa. This is because, in the core–shell system, the AFM spins exert a unidirectional force on the FiM spins due to exchange interaction. This leads the FiM spins to experience an extra energy barrier when trying to flip its magnetization, causing a shift in the hysteresis loop.55 The maximum EB observed is −10.34 kOe at 5 K when applying a 40 kOe cooling field (Fig. 5b). The EB in the CS is highest at 5 K, gradually decreasing with increased temperature and disappearing at temperatures above 150 K (Fig. 5c). This is close to the primary derivative ZFC–FC peak observed at 169 K for the CS sample (Fig. 4b, inset of top pane graph). We attribute this peak to the CS system's primary Tb. As the temperature reaches Tb, thermal energy is large enough to flip the magnetization of the FiM spins randomly, and the sample as a whole no longer displays EB. Nevertheless, the EB may still be present above Tb, but magnetometry might not capture its subtle effects due to increased thermal fluctuations at high temperatures. Since EB allows precise control over the magnetic switching behavior of nanoparticles, it can enhance their responsiveness to external magnetic fields, making it particularly useful for applications like magnetic hyperthermia in nanomedicine.
 | ||
| Fig. 5 (a) Shift in magnetic hysteresis loop at 5 K observed upon cooling biphasic CS sample with +10 kOe and −10 kOe. EB effect as a function of (b) cooling field strength at 5 K and (c) temperature for the CS nanoparticles. (d) Henkel plots of pure CFO and biphasic CS measured at 5 K. | ||
Interparticle (dipolar) interactions in pure CFO and the CS nanoparticles are studied at 5 K using Henkel plots, which are generated from a series of isothermal remanent magnetization (IRM) and direct current demagnetization (DCD) measurements (Fig. 5d). These measurements are based on the Stoner-Wohlfarth model, which describes a system of non-interacting, single-domain particles.57 Henkel plots are obtained by comparing the IRM curve Mr(H) with the DCD curve Md(H), as outlined in the literature.58,59 For a system of non-interacting magnetic particles, the reduced IRM and DCD curve is a straight line with a slope of −0.5, following the Wohlfarth relationship:
| md(H) = 1 − 2mr(H) |
 and
and 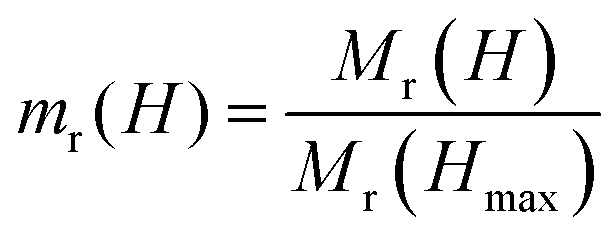 .
.
In systems with interacting magnetic nanoparticles, the Henkel plot departs from the linear graph in ΔM vs. H plot. The ΔM of the system is calculated using the following formula:57–59
| ΔM(H) = md(H)−[1−2mr(H)] |
Conclusion
We have synthesized colloidally stable CS Co0.6Fe0.4O–Co1.4Fe1.6O4 nanoparticles with a remarkable EB of 10.34 kOe. The synthesis was performed using a one-step thermal decomposition of metal complexes. We also synthesized pure CFO and CO nanoparticles for comparison. The colossal EB observed in the CS nanoparticles is attributed to the highly crystalline AFM core and a lattice-matched interface observed using atomic resolution STEM. Neutron diffraction reveals structural changes of the AFM core in the CS at high temperatures, leading to its recrystallization into a new phase, most likely Co3O4. Additionally, because of its core–shell structure, we observe the interdiffusion of iron ions into the AFM lattice. The Keff of the CS system is significantly larger than pure CO nanoparticles. As a result, the EB is observed from 5–150 K, close to the blocking temperature of the CS nanoparticles. Above 150 K, superparamagnetic behavior dominates, with vanishing hysteresis. ZFC–FC measurement of the pure CO nanoparticles reveals a divergence at ∼397 K, which we attribute to its TN. This is supported by neutron diffraction measurements conducted on the CS system, where its AFM core (Co0.6Fe0.4O) also exhibits TN at ∼397 K. The robust AFM stability at such elevated temperatures could hold significant promise for high-temperature applications. We also observed stronger demagnetizing (inhibiting) dipolar interactions in the CS than in pure CFO nanoparticles, which may affect the observed EB. We envision that this study will pave the way for engineering biphasic CS nanoparticles to overcome the superparamagnetic limit for smaller particle sizes and obtain room-temperature EB by tuning the magnetic anisotropy energy and controlling the magnetic switching behavior. Such systems could advance applications in nanospintronics (e.g., high-density storage) and nanomedicine (e.g., magnetic hyperthermia), while motivating further exploration of doped AFM nanoparticles and their interplay with magnetic properties.Experimental
Materials
Cobalt(II) acetylacetonate, ≥99%; iron(III) acetylacetonate, ≥99%; 1,2-hexadecandiol, 90%; dioctyl ether, 99%; oleylamine, 70%; oleic acid, 90%; octadecene, 99%; n-hexane, ≥99% and ethanol absolute, ≥99%, were purchased from Sigma-Aldrich and VWR. All chemicals were used without further purification.Synthesis of pure CO nanoparticles
The synthesis of all nanoparticles is conducted in a Schlenk line under a nitrogen atmosphere. In short, cobalt(II) acetylacetonate (0.324 g, 1.26 mmol), oleylamine (1.714 ml, 5.20 mmol), 1,2-hexadecandiol (0.388 g, 1.5 mmol), and octadecene (10 ml) are added to a 100 ml three-neck round bottom flask. The flask is then placed in the Schlenk setup and degassed for 30 min at room temperature while stirring with a magnetic stir bar. Nitrogen is purged at a flow rate of 300 ml min−1, and the speed of the magnet bar is maintained at 1000 rpm.Following the initial degassing step, the temperature is raised from room temperature with a ramping rate of 6 °C min−1 to 100 °C and then held for 30 min under continued degassing. The temperature is further increased to 200 °C with the same ramping rate and then held for 30 min. Finally, the temperature is ramped to 295 °C, and the reaction was carried out for another 60 min.
At the end of the reaction, the heating mantle is removed, and the solution is cooled naturally to room temperature, which takes approximately 15 min. The resulting product is a black solution divided equally into two 50 ml centrifuge tubes. To each tube, 10 ml of absolute ethanol is added, and the mixture is centrifuged at 9500 rpm for 20 min. The supernatant is discarded, and 5 ml of n-hexane is added to each centrifuge tube. The precipitate is quickly redispersed by sonication for 1 min. Subsequently, 10 mL of absolute ethanol is added, and the mixture is vortexed and centrifuged under the same conditions. This washing procedure is repeated once more, after which the precipitate is dried overnight at room temperature for further characterization.
Synthesis of pure CFO nanoparticles
For the synthesis of pure CFO nanoparticles, cobalt(II) acetylacetonate (0.108 g, 0.42 mmol), iron(III) acetylacetonate (0.297 g, 0.84 mmol), 1,2-hexadecandiol (0.388 g, 1.5 mmol), oleic acid (0.866 ml, 2.6 mmol), oleylamine (0.816 ml, 2.6 mmol) and octadecene (10 ml) is added to a 100 ml three-neck round bottom flask. The reaction and washing processes are carried out following the same protocol as described in the previous section.Synthesis of biphasic CS nanoparticles
For the synthesis of core–shell (CS) nanoparticles cobalt(II) acetylacetonate (0.108 g, 0.42 mmol), iron(III) acetylacetonate (0.297 g, 0.84 mmol), 1,2-hexadecandiol (0.388 g, 1.50 mmol), oleylamine (1.714 ml, 5.20 mmol) and dioctyl ether (10 ml) are added to a 100 ml three-neck round bottom flask. The reaction and washing steps follow the protocol described in the previous section.Characterization
Characterizations are performed in powder or liquid form, where the nanoparticles are dispersed in n-hexane. For characterizations requiring liquid samples, the solution was mixed vigorously with a vortexer for 1 min and sonicated in an ultrasonicator for 5 min.The sample's morphology is characterized using a TEM (JOEL EM- BEI10). For this, the liquid is drop-cast onto a carbon-coated copper grid and dried for 3 h to allow the evaporation of n-hexane. Double aberration corrected atomic resolution TEM/STEM (JEOL NeoArm 200F) is used for atomic columns imaging and SAED of the core–shell structure. JEOL 2100F was used for energy-dispersive X-ray Spectroscopy (EDX). The solvodynamic size of the nanoparticles is measured using DLS (Malvern Instruments Zetasizer Nano). The optical properties are characterized using UV-VIS (Molecular Devices Max Pro 5). The liquid sample was placed in a quartz cuvette for DLS and UV-VIS measurements. Powder samples for inductively coupled plasma optical emission spectroscopy (ICP-OES) were dissolved in 70% nitric acid and diluted to 5% for measurement (Varian 720).
Structural characterization is performed on the powder sample using XRD (PANalytical X’Pert Pro), with cobalt radiation at a wavelength of 1.79 Å. XPS measurements were collected using a thermo Fischer scientific K-Alpha+ photoelectron spectrometer. Thermal analysis is conducted using TGA (TA Instruments Discovery Series). Surface functional groups are characterized using FTIR (Perkin Elmer Spectrum 65). The atomic and magnetic structure of the nanoparticles is studied using time-of-flight neutron diffraction (ISIS Neutron and Muon Source). Finally, DC magnetic measurements are performed with a superconducting quantum interference device-vibrating sample magnetometer, SQUID-VSM (Quantum Design MPMS 3).
Author contributions
S. A., R. D. J., and N. T. K. T. conceived and designed the study. S. A. conducted the experiments, including nanoparticle synthesis, XRD, TEM, EDX, UV-Vis, DLS, FTIR, ICP-OES, SQUID measurements, and data analysis. L. D. T. and S. A. performed TGA. P. M., R. D. J., and S. A. conducted neutron powder diffraction. L. L. and V. K. L. carried out SAED and atomic-resolution STEM. R. D. J. analyzed the neutron powder diffraction data. S. A. wrote the manuscript with input from R. D. J., V. K. L. and N. T. K. T. All authors reviewed the manuscript, provided critical feedback, and approved the final version.Conflicts of interest
There are no conflicts to declare.Data availability
The data supporting the findings of this study are available within the article and ESI.†Acknowledgements
We gratefully acknowledge the Science and Technology Facilities Council (STFC) for access to neutron beamtime at ISIS, UK Neutron and Muon source. We acknowledge Dr Gwilherm Kerherve (Imperial College London) for performing the XPS measurement. S. A. acknowledges the EPSRC Centre for Doctoral Training in the Advanced Characterisation of Materials (EP/S023259/1) for funding a PhD studentship. V. K. L and L. L gratefully acknowledge EPSRC (UK) capital infrastructure grant EP/S033394/1.Notes and references
- A. Ali, T. Shah, R. Ullah, P. Zhou, M. Guo, M. Ovais, Z. Tan and Y. Rui, Front. Chem., 2021, 9, 629054 CrossRef CAS PubMed.
- Z. Ma, J. Mohapatra, K. Wei, J. P. Liu and S. Sun, Chem. Rev., 2023, 123, 3904–3943 CrossRef CAS PubMed.
- C. Wang, J. Meyer, N. Teichert, A. Auge, E. Rausch, B. Balke, A. Hütten, G. H. Fecher and C. Felser, J. Vacuum Sci. Technol. B, 2014, 32, 020802 CrossRef.
- A. Hirohata, K. Yamada, Y. Nakatani, I.-L. Prejbeanu, B. Diény, P. Pirro and B. Hillebrands, J. Magn. Magn. Mater., 2020, 509, 166711 CrossRef CAS.
- R. Khan, S. A. Otaibi, A. J. Babqi, N. Rahman, M. Sohail, R. M. Yusupov, S. S. Abdullaev, A. Khan, S. Iqbal, T. D. Rosso, T. Tahir, Q. Zaman and A. Khan, J. Mater. Sci.: Mater. Electron., 2023, 34, 169 CrossRef CAS.
- W. H. Meiklejohn and C. P. Bean, Phys. Rev., 1956, 102, 1413–1414 CrossRef.
- E. Elahi, G. Dastgeer, P. R. Sharma, S. Nisar, M. Suleman, M. W. Iqbal, M. Imran, M. Aslam and A. Imran, J. Phys. D: Appl. Phys., 2022, 55, 423001 CrossRef CAS.
- X. Huang, L. Zhang, L. Tong, Z. Li, Z. Peng, R. Lin, W. Shi, K.-H. Xue, H. Dai, H. Cheng, D. de Camargo Branco, J. Xu, J. Han, G. J. Cheng, X. Miao and L. Ye, Nat. Commun., 2023, 14, 2190 CrossRef CAS PubMed.
- Y. N. Dong, X. N. Zhao, W. Wang, Y. X. Chen, L. H. Bai, S. S. Yan and Y. F. Tian, J. Magn. Magn. Mater., 2022, 559, 169546 CrossRef CAS.
- E. Grimaldi, V. Krizakova, G. Sala, F. Yasin, S. Couet, G. Sankar Kar, K. Garello and P. Gambardella, Nat. Nanotechnol., 2020, 15, 111–117 CrossRef CAS PubMed.
- Z. Wei, A. Sharma, A. S. Nunez, P. M. Haney, R. A. Duine, J. Bass, A. H. MacDonald and M. Tsoi, Phys. Rev. Lett., 2007, 98, 116603 CrossRef CAS PubMed.
- H. Matsumoto, S. Ota, A. Ando and D. Chiba, Appl. Phys. Lett., 2019, 114, 132401 CrossRef.
- E. Goyat, N. Behera, V. Barwal, R. Siwach, G. Goyat, N. Kumar Gupta, L. Pandey, N. Kumar, S. Hait and S. Chaudhary, Appl. Surf. Sci., 2022, 588, 152914 CrossRef CAS.
- M. Xu, M. Li, P. Khanal, A. Habiboglu, B. Insana, Y. Xiong, T. Peterson, J. C. Myers, D. Ortega, H. Qu, C. L. Chien, W. Zhang, J.-P. Wang and W. G. Wang, Phys. Rev. Lett., 2020, 124, 187701 CrossRef CAS PubMed.
- B. Fang, L. Sánchez-Tejerina San José, A. Chen, Y. Li, D. Zheng, Y. Ma, H. Algaidi, K. Liu, G. Finocchio and X. Zhang, Adv. Funct. Mater., 2022, 32, 2112406 CrossRef CAS.
- S. Peng, D. Zhu, W. Li, H. Wu, A. J. Grutter, D. A. Gilbert, J. Lu, D. Xiong, W. Cai, P. Shafer, K. L. Wang and W. Zhao, Nat. Electron., 2020, 3, 757–764 CrossRef CAS.
- G. Wang, Z. Chen, H. He, D. Meng, H. Yang, X. Mao, Q. Pan, B. Chu, M. Zuo, Z. Sun, R. Peng, Z. Fu, X. Zhai and Y. Lu, Chem. Mater., 2018, 30, 6156–6163 CrossRef CAS.
- A. Saha, S. Sohoni and R. Viswanatha, J. Phys. Chem. C, 2019, 123, 2421–2427 CrossRef CAS.
- T. Ambrose and C. L. Chien, J. Appl. Phys., 1998, 83, 7222–7224 CrossRef CAS.
- D. G. Hwang, S. S. Lee and C. M. Park, Appl. Phys. Lett., 1998, 72, 2162–2164 CrossRef CAS.
- A. L. Dantas, G. O. G. Rebouças, A. S. W. T. Silva and A. S. Carriço, J. Appl. Phys., 2005, 97, 10K105 CrossRef.
- T. J. Moran, J. M. Gallego and I. K. Schuller, J. Appl. Phys., 1995, 78, 1887–1891 CrossRef CAS.
- T. Blachowicz and A. Ehrmann, Coatings, 2021, 11, 122 CrossRef CAS.
- J. Nogués, J. Sort, V. Langlais, V. Skumryev, S. Suriñach, J. S. Muñoz and M. D. Baró, Phys. Rep., 2005, 422, 65–117 CrossRef.
- A. C. Basaran, C. Monton, J. Trastoy, R. Bernard, K. Bouzehouane, J. E. Villegas and I. K. Schuller, J. Magn. Magn. Mater., 2022, 550, 169077 CrossRef CAS.
- D. Peddis, C. Cannas, G. Piccaluga, E. Agostinelli and D. Fiorani, Nanotechnology, 2010, 21, 125705 CrossRef CAS PubMed.
- J. Mazo-Zuluaga, J. Restrepo, F. Muñoz and J. Mejía-López, J. Appl. Phys., 2009, 105, 123907 CrossRef.
- M.-H. Phan, J. Alonso, H. Khurshid, P. Lampen-Kelley, S. Chandra, K. Stojak Repa, Z. Nemati, R. Das, Ó. Iglesias and H. Srikanth, Nanomaterials, 2016, 6, 221 CrossRef PubMed.
- N. Pizúrová, J. Buršík, T. Sojková, P. Roupcová and O. Schneeweiss, J. Phys.: Conf. Ser., 2022, 2315, 012023 CrossRef.
- F. G. da Silva, M. Vasilakaki, R. C. Gomes, R. Aquino, A. F. Cortez Campos, E. Dubois, R. Perzynski, J. Depeyrot and K. Trohidou, Nanoscale Adv., 2022, 4, 3777–3785 RSC.
- R. K. Zheng, G. H. Wen, K. K. Fung and X. X. Zhang, J. Appl. Phys., 2004, 95, 5244–5246 CrossRef CAS.
- X. Sun, N. Frey Huls, A. Sigdel and S. Sun, Nano Lett., 2012, 12, 246–251 CrossRef CAS PubMed.
- Q. K. Ong, A. Wei and X.-M. Lin, Phys. Rev. B: Condens. Matter Mater. Phys., 2009, 80, 134418 CrossRef.
- N. Flores-Martinez, G. Franceschin, T. Gaudisson, P. Beaunier, N. Yaacoub, J.-M. Grenèche, R. Valenzuela and S. Ammar, Part. Part. Syst. Charact., 2018, 35, 1800290 CrossRef.
- J. Mohapatra, M. Xing, R. Wu, J. Yang and J. P. Liu, Scr. Mater., 2023, 230, 115400 CrossRef CAS.
- G. Salazar-Alvarez, J. Sort, S. Suriñach, M. D. Baró and J. Nogués, J. Am. Chem. Soc., 2007, 129, 9102–9108 CrossRef CAS PubMed.
- A. López-Ortega, B. Muzzi, C. de Julián Fernández and C. Sangregorio, ACS Appl. Nano Mater., 2024, 7, 27489–27497 CrossRef.
- M. Xing, J. Mohapatra, J. Elkins, D. Guragain, S. R. Mishra and J. P. Liu, Nanoscale, 2021, 13, 15837–15843 RSC.
- S. Goswami, P. Gupta, S. Nayak, S. Bedanta, Ò. Iglesias, M. Chakraborty and D. De, Nanomaterials, 2022, 12, 3159 CrossRef CAS PubMed.
- Y. Chai, F. Feng, Q. Li, C. Yu, X. Feng, P. Lu, X. Yu, M. Ge, X. Wang and L. Yao, J. Am. Chem. Soc., 2019, 141, 3366–3370 CrossRef CAS PubMed.
- A. Mandziak, G. D. Soria, J. E. Prieto, P. Prieto, C. Granados-Miralles, A. Quesada, M. Foerster, L. Aballe and J. de la Figuera, Sci. Rep., 2019, 9, 13584 CrossRef PubMed.
- V. Reichel, A. Kovács, M. Kumari, É. Bereczk-Tompa, E. Schneck, P. Diehle, M. Pósfai, A. M. Hirt, M. Duchamp, R. E. Dunin-Borkowski and D. Faivre, Sci. Rep., 2017, 7, 45484 CrossRef CAS PubMed.
- L. C. Chapon, P. Manuel, P. G. Radaelli, C. Benson, L. Perrott, S. Ansell, N. J. Rhodes, D. Raspino, D. Duxbury, E. Spill and J. Norris, Neutron News, 2011, 22, 22–25 CrossRef.
- J. Rodríguez-Carvajal, Phys. B, 1993, 192, 55–69 CrossRef.
- E. Ressouche, N. Kernavanois, L.-P. Regnault and J.-Y. Henry, Phys. B, 2006, 385–386, 394–397 CrossRef CAS.
- P. Maltoni, R. López-Martín, E. H. Sánchez, P. S. Normile, M. Vasilakaki, S. S. Lee, B. S. Burgos, E. A. L. del Castillo, D. Peddis, C. Binns, K. Trohidou, R. Mathieu, J. Nogués and J. A. De Toro, Adv. Compos. Hybrid Mater., 2024, 7, 182 CrossRef CAS.
- J. S. Jiang, J. E. Pearson, Z. Y. Liu, B. Kabius, S. Trasobares, D. J. Miller, S. D. Bader, D. R. Lee, D. Haskel, G. Srajer and J. P. Liu, J. Appl. Phys., 2005, 97, 10K311 CrossRef.
- Y. Choi, J. S. Jiang, J. E. Pearson, S. D. Bader and J. P. Liu, Appl. Phys. Lett., 2007, 91, 022502 CrossRef.
- E. E. Fullerton, J. S. Jiang and S. D. Bader, J. Magn. Magn. Mater., 1999, 200, 392–404 CrossRef CAS.
- I. J. Bruvera, P. Mendoza Zélis, M. Pilar Calatayud, G. F. Goya and F. H. Sánchez, J. Appl. Phys., 2015, 118, 184304 CrossRef.
- S. Thomas, K. Reethu, T. Thanveer, M. T. Z. Myint and S. H. Al-Harthi, J. Appl. Phys., 2017, 122, 063902 CrossRef.
- S. Chandra, H. Khurshid, W. Li, G. C. Hadjipanayis, M. H. Phan and H. Srikanth, Phys. Rev. B: Condens. Matter Mater. Phys., 2012, 86, 014426 CrossRef.
- K. O’Grady, J. Sinclair, K. Elphick, R. Carpenter, G. Vallejo-Fernandez, M. I. J. Probert and A. Hirohata, J. Appl. Phys., 2020, 128, 040901 CrossRef.
- M. Ghosh, E. V. Sampathkumaran and C. N. R. Rao, Chem. Mater., 2005, 17, 2348–2352 CrossRef CAS.
- J. Nogués and I. K. Schuller, J. Magn. Magn. Mater., 1999, 192, 203–232 CrossRef.
- E. C. Stoner and E. P. Wohlfarth, Philos. Trans. R. Soc., A, 1997, 240, 599–642 Search PubMed.
- E. P. Wohlfarth, J. Appl. Phys., 1958, 29, 595–596 CrossRef.
- C. Blanco-Andujar, D. Ortega, P. Southern, Q. A. Pankhurst and N. T. K. Thanh, Nanoscale, 2015, 7, 1768–1775 RSC.
- M. Kaur, Q. Dai, M. Bowden, M. H. Engelhard, Y. Wu, J. Tang and Y. Qiang, Nanoscale, 2013, 5, 7872–7881 RSC.
- D. Fiorani, A. M. Testa, F. Lucari, F. D’Orazio and H. Romero, Phys. B, 2002, 320, 122–126 CrossRef CAS.
- F. C. M. Filho, L. L. Oliveira, S. S. Pedrosa, G. O. G. Rebouças, A. S. Carriço and A. L. Dantas, Phys. Rev. B: Condens. Matter Mater. Phys., 2015, 92, 064422 CrossRef.
Footnote |
| † Electronic supplementary information (ESI) available. See DOI: https://doi.org/10.1039/d5nh00118h |
| This journal is © The Royal Society of Chemistry 2025 |