DOI:
10.1039/D5NA00211G
(Paper)
Nanoscale Adv., 2025,
7, 3514-3527
Antibacterial and photocatalytic activities of fruit-extract-mediated synthesized ZnO nanoparticles†
Received
1st March 2025
, Accepted 13th April 2025
First published on 30th April 2025
Abstract
ZnO nanoparticles were produced using Morinda citrifolia fruit extract and evaluated for their performance in the removal of Congo red (CR) dye under visible light, as well as their antibacterial activity against different pathogenic strains. The ZnO photocatalyst was characterized according to crystallinity, surface elements and morphology. Various factors related to photocatalytic activity, namely contact time, photocatalyst dosage, initial CR concentration, and pH, were investigated. Under optimal conditions, a moderate ZnO loading achieved a high CR degradation efficiency of 95.23% within 60 min of light irradiation, as determined using response surface methodology (RSM) coupled with face-centered design (CCF). Additionally, a scavenger study confirmed that superoxide radicals (˙O2−) and holes (h+) were major reactive species in the photodegradation of CR. Furthermore, the antibacterial activity was remarkable, with the highest inhibition zone measuring 20.7 mm against Salmonella typhimurium. This study provides a promising approach for developing highly efficient photocatalysts with strong adsorption capabilities whilst also broadening their application as antibacterial agents.
1. Introduction
Clean and safe water management is currently a critical challenge due to the improper discharge of organic pollutants into water bodies from various sources. Many of these pollutants are released into ecosystems and are highly toxic, causing significant potential risk to both human health and the environment.1 Industries such as textiles, pharmaceuticals, cosmetics, and plastics make extensive use of organic dyes, with Congo red (CR) being one of the most common.2 The complex and stable molecular structure of CR dye is resistant to degradation. CR has negative effect on respiratory, skin, eye, and gastrointestinal system.3 Therefore, the presence of CR in wastewater poses an alarming threat to human health and ecology, requiring proper treatment before discharge. However, conventional wastewater treatment methods have often proven ineffective in the removal of organic pollutants. This limitation makes it difficult to meet increasing water quality standards.4 In addition to dyes, the presence of pathogens and microbial contaminants in water has prompted researchers to improve innovative technologies against infections and communicable diseases caused by harmful bacteria. These efforts have led to the introduction of effective strategies to inhibit the propagation and growth of pathogenic bacteria.
To address water pollution, semiconductor-based photocatalytic processes using visible light have been developed. Photocatalysis is one of the most effective and practical techniques for organic pollutant degradation, as it has high degradation efficiency and minimal formation of secondary pollutants.5,6 With such advantages, explorations in photocatalytic applications are essential for the effective photo-degradation of organic pollutants from water, helping to improve water quality. The main key to this method is the utilization of semiconductor materials as photocatalysts to enable the efficient breakdown of organic contaminants under visible light irradiation. Among potential photocatalysts, ZnO nanocatalysts have attracted considerable attention due to their remarkable photocatalytic properties, cost-effectiveness, and non-toxicity.7 ZnO exhibits strong photocatalytic activity under ultraviolet (UV) irradiation with a wide band gap (∼3.37 eV), suitable for the photo-degradation of synthetic dyes.8,9 Therefore, ZnO has been widely explored for wastewater treatment, e.g., for the degradation of persistent organic pollutants such as CR dye.
The green synthesis of ZnO nanoparticles is considered an effective approach to minimize the harmful effects associated with conventional methods.10,11 In this method, the use of reducing and environmentally friendly agents during synthesis is essential.12,13 Meanwhile, phytochemicals such as flavonoids, polyphenol, and alkaloids act as reducing, capping and stabilizing agents in the synthesis of ZnO nanoparticles.14,15 Therefore, plant resources are considered ideal raw materials for the bio-mediated synthesis of ZnO nanoparticles, thanks to their abundant and environmentally friendly properties. Among potential plants, Morinda citrifolia, commonly known as noni, has high medicinal value in its fruit.16 Noni fruit has antibacterial properties and can also be used to treat bone and joint diseases, especially osteoarthritis.17 In biological applications, several studies took advantage of this fruit to prepare products such as drugs to treat many diseases.18,19 Moreover, this type of plant is also used to successfully synthesize semiconductor materials such as ZnO.20,21
Recent studies have demonstrated the potential of plant-based ZnO nanoparticles for photocatalytic applications. For instance, ZnO nanoparticles synthesized using Bryophyllum pinnatum extract exhibited effective photocatalytic degradation of methylene blue dye due to their high charge carrier separation ability.22 Similarly, ZnO spherical nanoparticles prepared from Acalypha indica leaf extract showed promising degradation efficiency for methylene blue dye under irradiation by sunlight.23 Additionally, ZnO nanoparticles were successfully synthesized from Ceratophyllum demersum leaf extract, which showed strong photocatalytic properties for Rhodamine B.24 To our knowledge, no studies have been conducted on the photocatalytic performance and antibacterial activity of ZnO nanoparticles mediated from Morinda citrifolia fruit (MCF) extract. In this study, a statistical modeling approach based on CCF design was employed to analyze and optimize the independent factors influencing the photocatalytic degradation process. Additionally, the prepared ZnO nanoparticles were studied on Gram-negative and Gram-positive bacteria to comprehensively evaluate their potential for bacterial removal. These findings promote the development of green ZnO nanoparticles for efficient CR dye photodegradation and antibacterial applications.
2. Experimental
2.1. Materials
The Morinda citrifolia fruit (MCF) was collected from a garden in Long An, Vietnam. Several chemicals such as zinc nitrate hexahydrate [(Zn(CH3COO)2·6H2O, reagent grade, purity ≥98%)], sodium hydroxide (NaOH) and Congo red (C32H22N6Na2O6S2) were commercially purchased from Sigma-Aldrich.
2.2. Green synthesis of ZnO using MCF extract
ZnO nanoparticles were synthesized using a low-cost MCF extract, as illustrated in Fig. 1. Typically, MCF was collected and washed to remove low-quality fruit and dust. Afterward, these fruits were ground into small pieces using a blender before the extraction process. A mixture of 25 g of tiny pieces of noni fruit in 100 mL of distilled water was heated at 80 °C for 1 h to obtain a brown extract. Next, 2.5 g of zinc acetate was gradually added into 30 mL of prepared extract under magnetic stirring at 75 °C for 1 h. Then, the mixture was adjusted to pH 8 by dropping in 0.1 M NaOH solution before stirring for a further 1 h. At the end of the process, the obtained particles were repeatedly cleaned with DI water before drying at 80 °C. Then, they were calcined for 6 h at 500 °C.
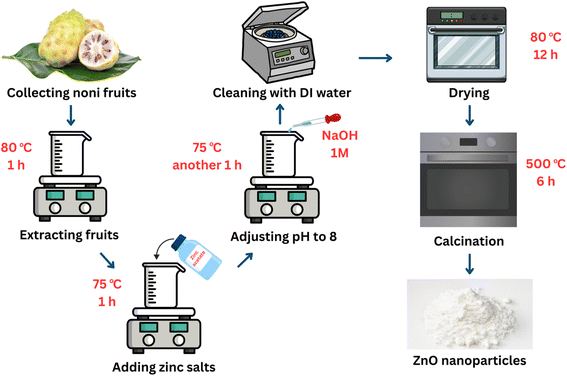 |
| | Fig. 1 The process of producing ZnO nanoparticles using MCF extract. | |
2.3. Photocatalytic experiments
The photocatalytic experiment was conducted using a batch system. Initially, the CR dye solution was prepared at a predefined concentration, transferred into the reactor, and placed within a cooling system. The required mass of ZnO sample was then measured and added to the reactor. To achieve adsorption equilibrium, the experiment was first conducted in darkness for 30 min before exposure to 40 W LED lights. Samples were collected at 30 min intervals, and their absorbance was analyzed using a UV-vis spectrophotometer.
2.4. Face-centered design (CCF)
A CCF design was chosen for the experiment to assess the combined impact of four independent variables: irradiation time (A), ZnO mass (B), CR concentration (C), and pH (D). By default, the components were coded +1 for high and −1 for low, as shown in Table S2.† The 30 randomized trials generated through the RSM–CCF designed experiments are presented in Table S3,† including both predicted values and experimental data obtained using Design-Expert software. As a result, the actual and anticipated results are nearly identical, indicating that the model can be utilized to navigate the chosen experimental space.
2.5. Antibacterial activity
The inhibition zone method was employed as a semi-quantitative assay to assess the antibacterial properties of ZnO materials and amoxicillin antibiotic as a positive reference standard. Bacterial colonies were suspended in a 0.85% w/v sterile saline solution and distributed on Mueller–Hinton agar (MHA) plates. Wells, 8 mm in diameter, were created in the agar medium and filled with 50 μL of the test compound. Following 24 h of incubation at 37 °C, bacterial inhibition zones were visualized using a digital camera and precisely measured with a millimeter ruler.
3. Results and discussion
3.1. Effect of pH and Zn2+ concentration
The effect of Zn2+ concentration on the particle size and formation of ZnO nanoparticles was assessed through investigations at different concentrations, as depicted in Fig. 2a. In detail, the synthesis process was conducted by adding four concentration levels of Zn2+ (0.05 M, 0.10 M, 0.15 M, 0.20 M) into the prepared extract. The following steps were similar to those of the above-mentioned process. Then, the solution obtained after the end of the process was collected, and the UV-vis spectrum was measured to confirm the intensity and wavelength position of the peak. According to the results, the synthesized samples recorded a strong absorption peak at a wavelength of 368 nm, showing the successful formation of ZnO nanoparticles. An increasing trend was observed with increasing Zn2+ concentration. Furthermore, at a concentration of 0.05 M, the absorption peak was observed at 368 nm, which shifted to higher absorption bands at 368, 368.5, 369, and 369.8 nm as the preparation concentration increased to 0.1 M, 0.15 M, and 0.20 M, respectively. This red shift may be due to aggregation in the ZnO samples under the effect of higher concentrations of zinc ions. Specifically, at higher concentrations of Zn2+ in the reaction mixture, a deficiency of functional groups for complex formation occurs to enhance the aggregation of growing nanoparticles, resulting in larger sized nanoparticles.25 Moreover, the intensity of peaks witnessed a significant decline from 0.92 to 0.58, which indicated the decrease in the formation of ZnO nanoparticles with increasing concentration of zinc ions.
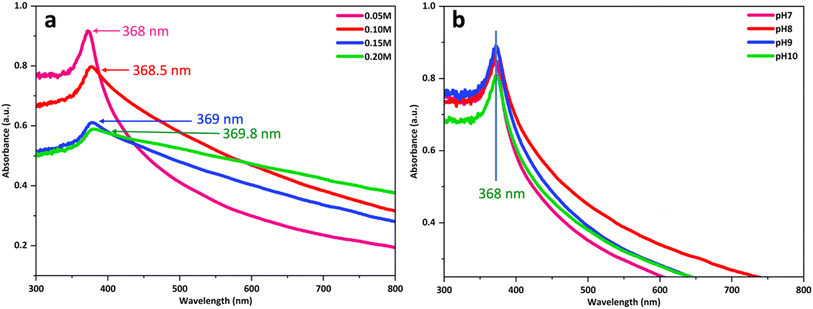 |
| | Fig. 2 The UV-vis absorbance of ZnO nanoparticles produced using MCF extract at different Zn2+ concentrations (a) and pH of extract (b). | |
The pH of the extract is an aspect that influences both the textural qualities and the size of the produced particles. Fig. 2b shows UV-vis spectra of the ZnO nanoparticles synthesized using noni fruit extract at various pH values: 7, 8, 9, and 10. There was a slight growth in the intensity of the characteristic peak of ZnO from pH 7 to 9 (between 0.85 and 0.9). The formation of ZnO is a favourable process at high pH due to the abundant OH− ions in the solution facilitate the formation of Zn(OH)2 nuclei and crystal growth. Nevertheless, a further decrease in intensity was observed to 0.81 when the pH reached 10. Excess NaOH dissolves the zinc hydroxide precipitate by generating bulky zincate ion complexes (Zn(OH)42−), resulting in decreased production of ZnO. The results also showed that there is a slight shift in the peak toward higher wavelength with increasing pH, suggesting that the particle sizes of ZnO gradually increased with an increase in pH. The rise in particle size with rising pH is due to the Ostwald ripening effect, in which small ZnO particles dissolve and are deposited on larger growing particles.26 This phenomenon occurs because larger particles are energetically preferred to smaller particles.
3.2. Characterization
3.2.1. DRS.
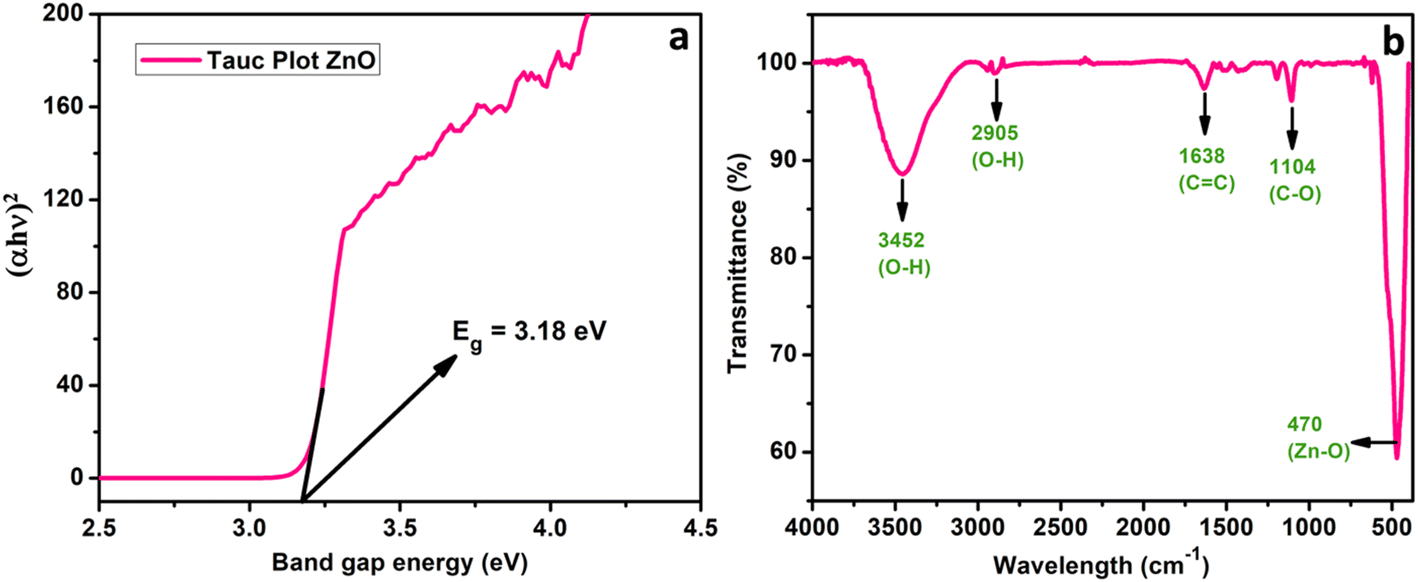
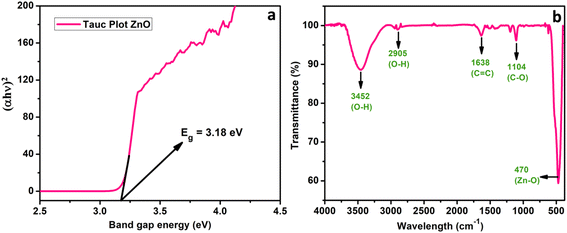
The optical properties of the green ZnO nanocatalysts were assessed through the DRS technique. Fig. 3a presents the Tauc plot for the prepared ZnO nanoparticles, shown as (ahν)2versus hν. Accordingly, the direct band gap (Eg) of the ZnO materials was calculated to be 3.18 eV. Typically, the band gap value is an important factor in determining the photocatalytic performance of materials. Due to the high band gap energy of ZnO nanoparticles, they exhibit increased absorption efficiency in the UV range, with potential extension into the visible-light region, thereby improving their photocatalytic activity within these spectral regions. The band gap value in this study is also in accordance with that of ZnO nanoparticles synthesized from both green and chemical approaches in previous studies.27,28
 |
| | Fig. 3 DRS (a) and FTIR (b) spectra of ZnO nanoparticles synthesized using MCF extract. | |
3.2.2. FTIR.
In synthesized ZnO nanoparticles, the main absorption bands are 3452, 2905, 1638, 1140, and 470 cm−1, as shown in Fig. 3b. The wide peak at 3452 cm−1 corresponds to O–H stretching vibrations found in flavonoids and phenolic compounds from the leaf extract.29 The peak at 1140 cm−1 is due to the C–O stretching of groups of alcohols in plants.30 In this study, ZnO nanoparticles exhibit a significantly strong absorption band at 470 cm−1.31 This indicates that phytochemicals contribute to the biotransformation of zinc acetate to oxides. Obviously, plant phytochemicals play a reducing and stabilizing role for Zn2+ from a salt precursor, contributing to the formation of ZnO nanoparticles. In general, the biosynthesized ZnO nanoparticles in this study showed many characteristic peaks related to biomolecules, suggesting the existence of phytochemicals on ZnO nanoparticles. Studies by Kamarajan et al. and Ahmad et al. also showed similar results.23,32
3.2.3. XRD.
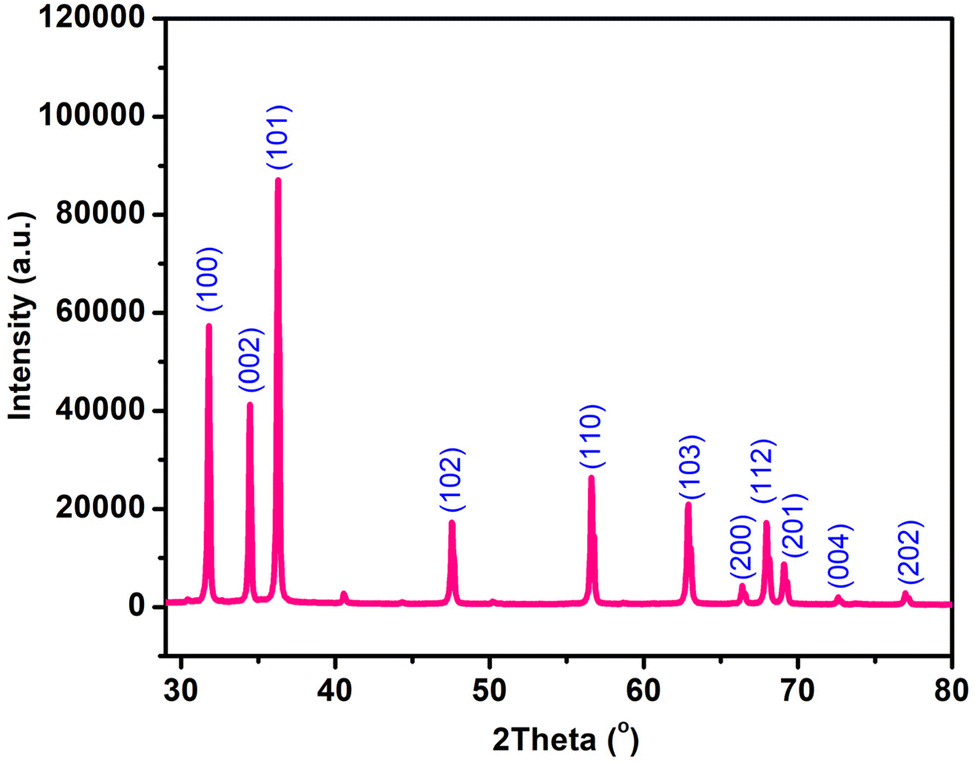
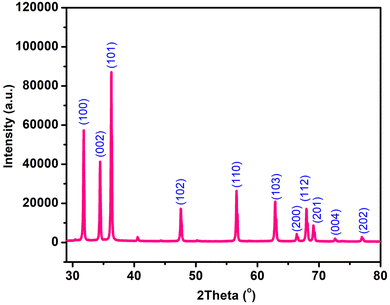
The crystalline characteristics of ZnO nanoparticles were analyzed using the XRD pattern. Fig. 4 shows sharp peaks at 2θ = 31.82°, 34.43°, 36.22°, 47.53°, 56.67°, 62.93°, 66.48°, 68.12°, 69.14°, 72.73°, and 76.97° corresponding to the (100), (002), (101), (102), (110), (103), (200), (112), (201), (004), and (202) lattice planes of hexagonal wurtzite ZnO crystals (JCPDS No. 5-0664).33 Moreover, a, b, c, and cell volume are similar to those of standard ZnO JCPDS 5-0664 (Table S1†). The low dislocation density and microstrain also indicate the low distortion in the ZnO matrix, highlighting the structural stability and high quality of the materials. The average crystallite size of ZnO was determined to be 37.6 nm based on the Debye–Scherrer formula, as shown in eqn S1.†
 |
| | Fig. 4 XRD spectra of ZnO nanoparticles synthesized using MCF extract. | |
3.2.4. DLS and zeta potential.
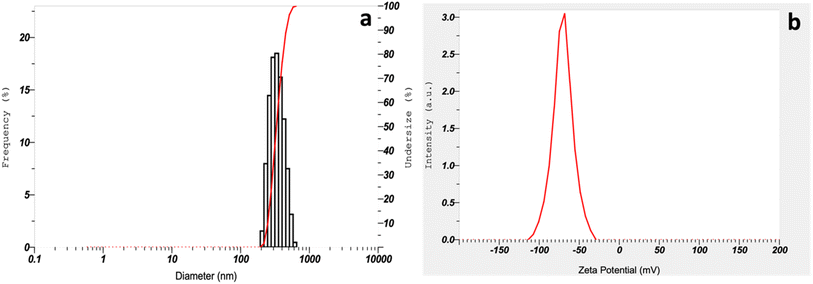
DLS was employed to confirm the particle size distribution of ZnO in colloidal solution, as illustrated in Fig. 5a. The size distribution of synthesized materials in a colloidal state is observed to exceed 100 nm. Furthermore, zeta potential measurement is a key technique for assessing the stability of nanoparticles, with values indicating the surface charge. The zeta potential of ZnO nanoparticles using noni fruit extract is shown in Fig. 5b. According to the results, the zeta potential is −70.4 mV, confirming the high stabilization of the prepared nanoparticles. In fact, nanoparticles with zeta potentials above ±30 mV are generally considered stable; the significantly negative value recorded in this study suggests strong electrostatic repulsion, minimizing aggregation and ensuring long-term colloidal stability.34 Additionally, the high negative zeta potential correlates with the presence of negatively charged functional groups on the nanoparticle surface, which means the role of phytochemicals directly affects both nanoparticle formation and stability.
 |
| | Fig. 5 DLS analysis (a) and zeta potential (b) of ZnO nanoparticles synthesized using MCF extract. | |
3.2.5. SEM and TEM.
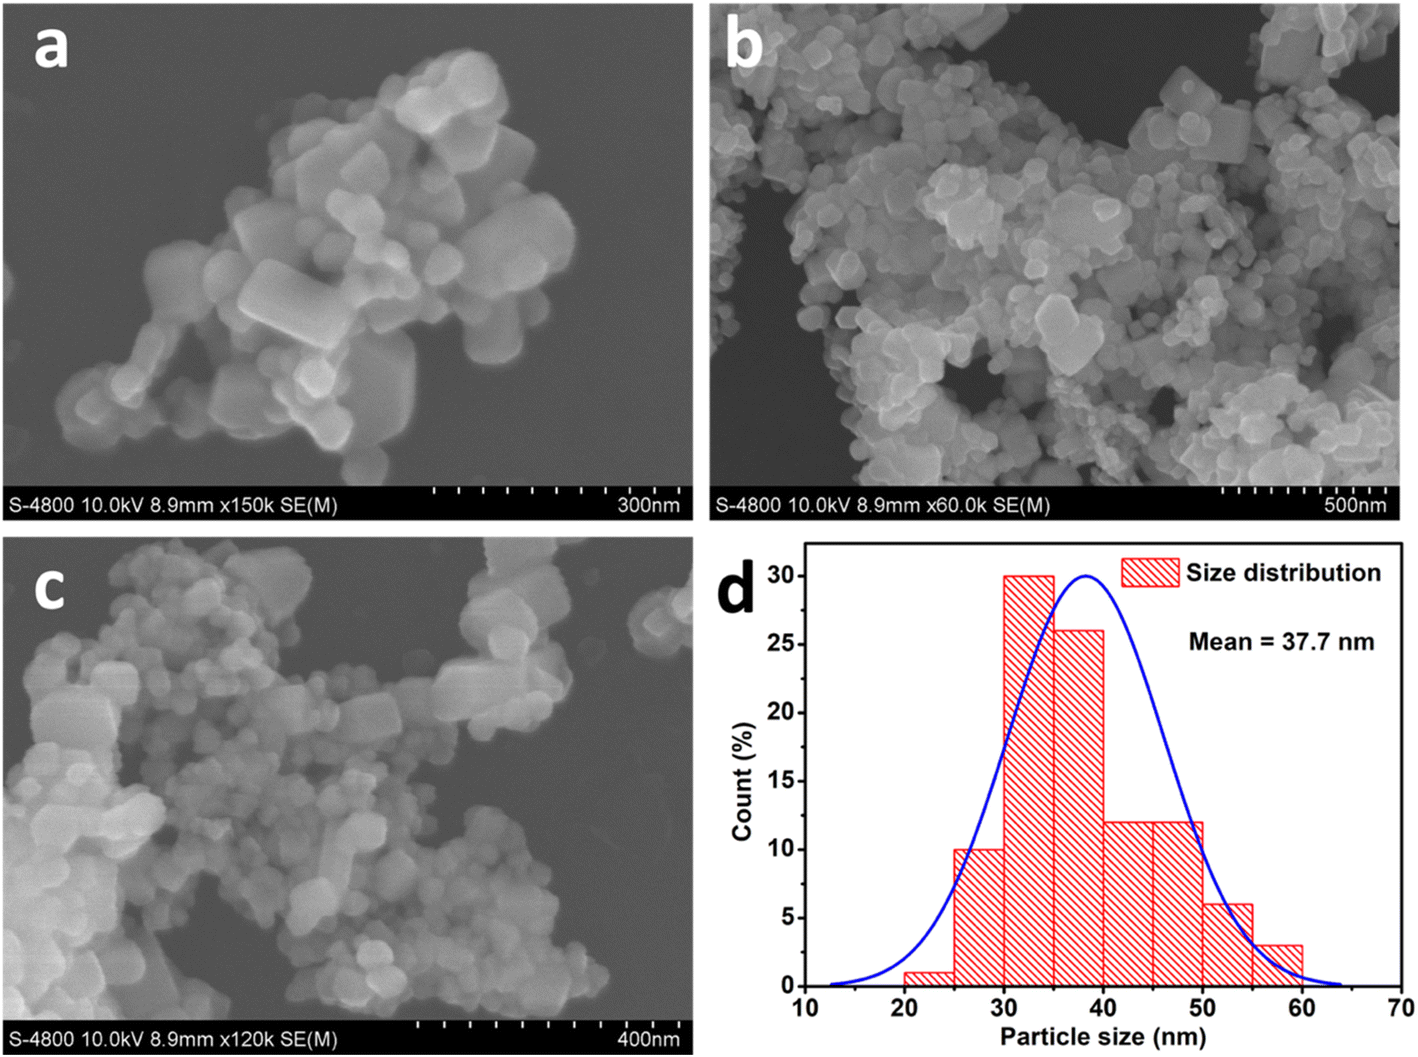
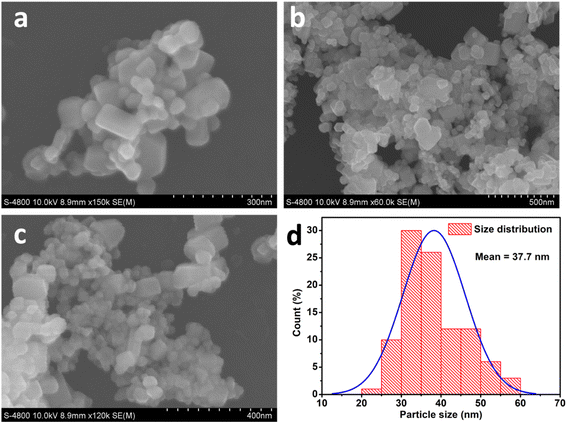
SEM is the technique mainly used for examining the morphology and size of materials. The SEM images of ZnO nanoparticles biosynthesized from MCF extract are exhibited in Fig. 6a–c. According to the results, ZnO nanoparticles exhibit a homogeneously spherical shape with some individual crystals clearly visible. Moreover, several particles are agglomerated, resulting in larger particle size. Fig. 6d demonstrates the particle size distribution histogram, showing that the average diameter of ZnO is 37.7 nm. This result further confirmed the above-mentioned XRD results for average crystallized particle size. As shown in Fig. 7, the particle size of ZnO nanoparticles is determined to be in the range of 27.97–46.96 nm via the TEM method. TEM images also show the formation of low-clustering ZnO nanoparticles with uniform spherical shape and high porosity, which enhances the high adsorption capacity for dye molecules.
 |
| | Fig. 6 SEM images (a–c) and histogram (d) of the particle size distribution for the corresponding SEM images of ZnO nanoparticles synthesized using MCF extract. | |
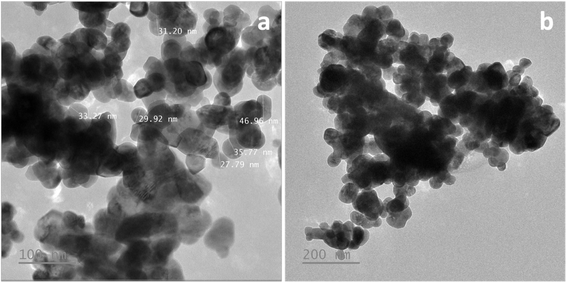 |
| | Fig. 7 TEM images of ZnO nanoparticles synthesized using MCF extract. | |
3.3. Antibacterial activity
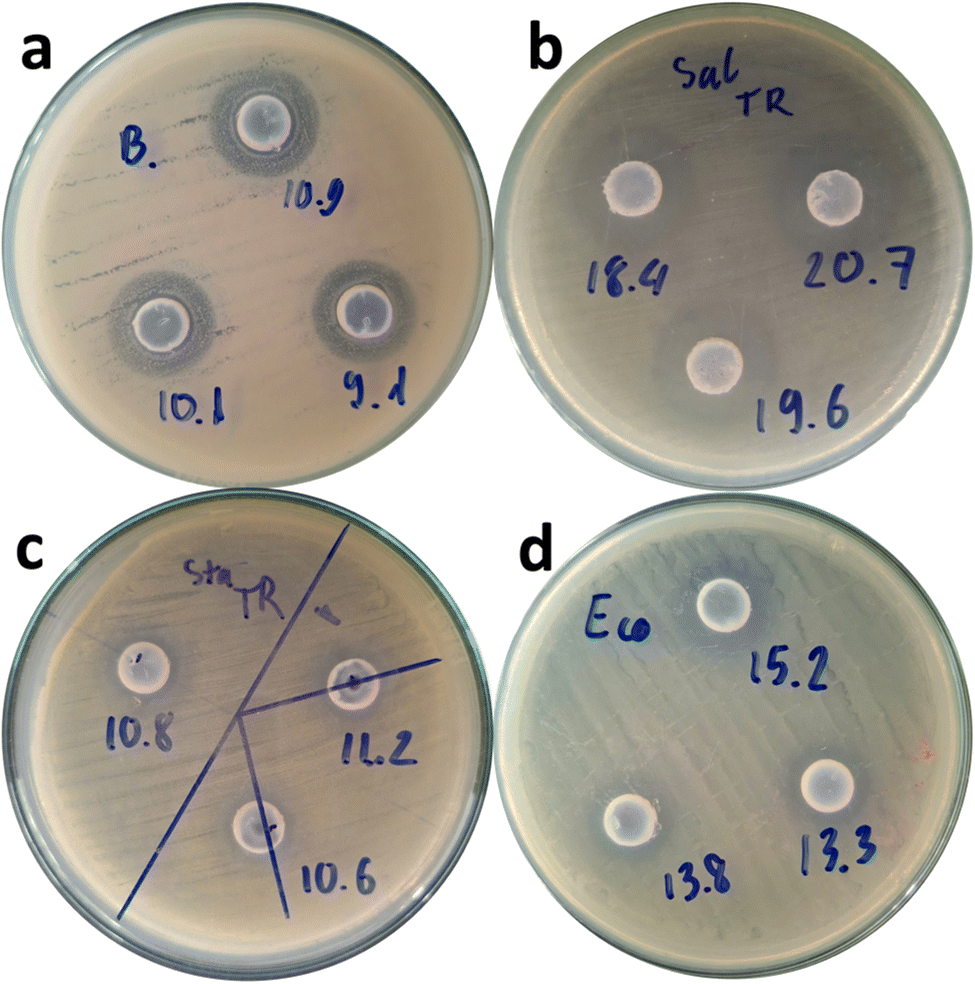
The antibacterial activity of bio-mediated ZnO was evaluated on four bacterial pathogens, representing two groups: a Gram-positive group (Bacillus cereus and Staphylococcus aureus) and a Gram-negative group (Escherichia coli and Salmonella typhimurim). Fig. 8 depicts the inhibition zones of ZnO nanoparticles for these bacterial strains. The results demonstrated the antibacterial potential of ZnO materials, with maximum inhibition zones of 10 ± 0.90 mm for B. cereus, 10.9 ± 0.31 mm for S. aureus, 19.6 ± 1.15 mm for S. typhimurim, and 14.1 ± 0.98 mm for E. coli. These results were considered highly effective and competitive with the amoxicillin-treated control samples (Fig. S1†). Accordingly, ZnO nanoparticles from noni fruit extract demonstrated stronger antibacterial activity against Gram-negative bacteria than against Gram-positive bacteria. This phenomenon might be due to the structural difference in bacterial cell walls. In fact, gram-(+) bacteria have a thicker peptidoglycan layer, while gram-(–) ones have a thinner cell wall, making them more vulnerable to ZnO nanoparticles.35 Furthermore, strong electrostatic interactions between Zn2+ ions and Gram-negative bacteria enhance their antibacterial effectiveness. These results were in accordance with those of previous studies.27,36
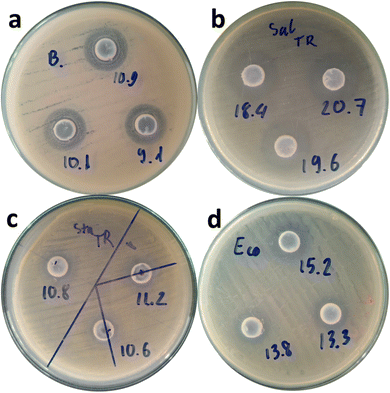 |
| | Fig. 8 The inhibition zone of bio-mediated ZnO nanoparticles for B. cereus (a), S. typhimurim (b), S. aureus (c), and E. coli (d). | |
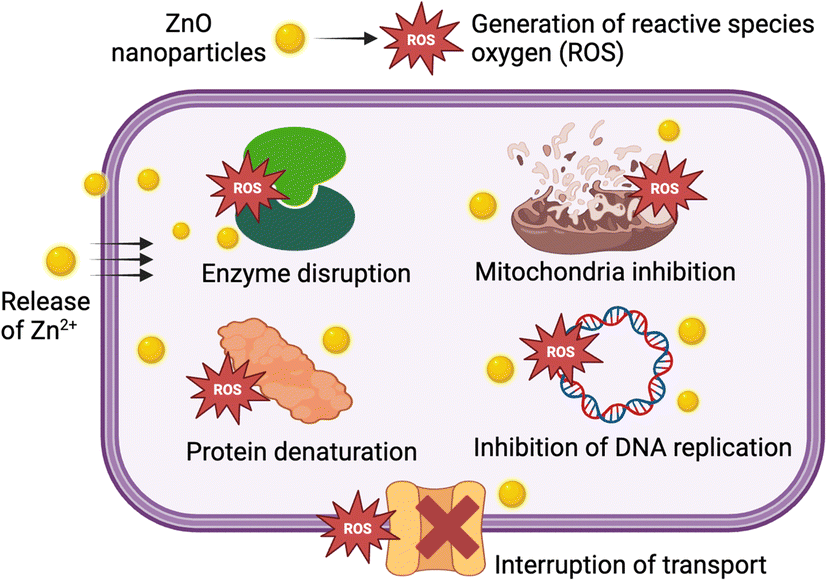
3.4. Antibacterial mechanism
The antibacterial activity of ZnO nanoparticles is mainly due to their characteristic properties, including high surface area and ease of inducing oxidative stress.37 Accordingly, ZnO nanoparticles can release Zn2+ and interact with the bacterial cell membrane, leading to cell membrane disruption and penetration into bacterial cells.38 Additionally, ZnO might generate reactive oxygen species (ROS), including O2−˙, OH˙, and H2O2. Both the generated ROS and Zn2+ cause a series of types damage to intracellular components: (i) enzyme disruption, (ii) mitochondrial inhibition, (iii) protein denaturation, and (iv) inhibition of DNA replication.39 These comprehensive attacks ultimately result in bacterial cell death, as shown in Fig. 9.
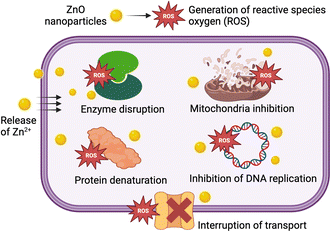 |
| | Fig. 9 Antibacterial mechanism of ZnO nanoparticles synthesized using MCF extract. | |
3.5. Photocatalysis
3.5.1. Effect of time.
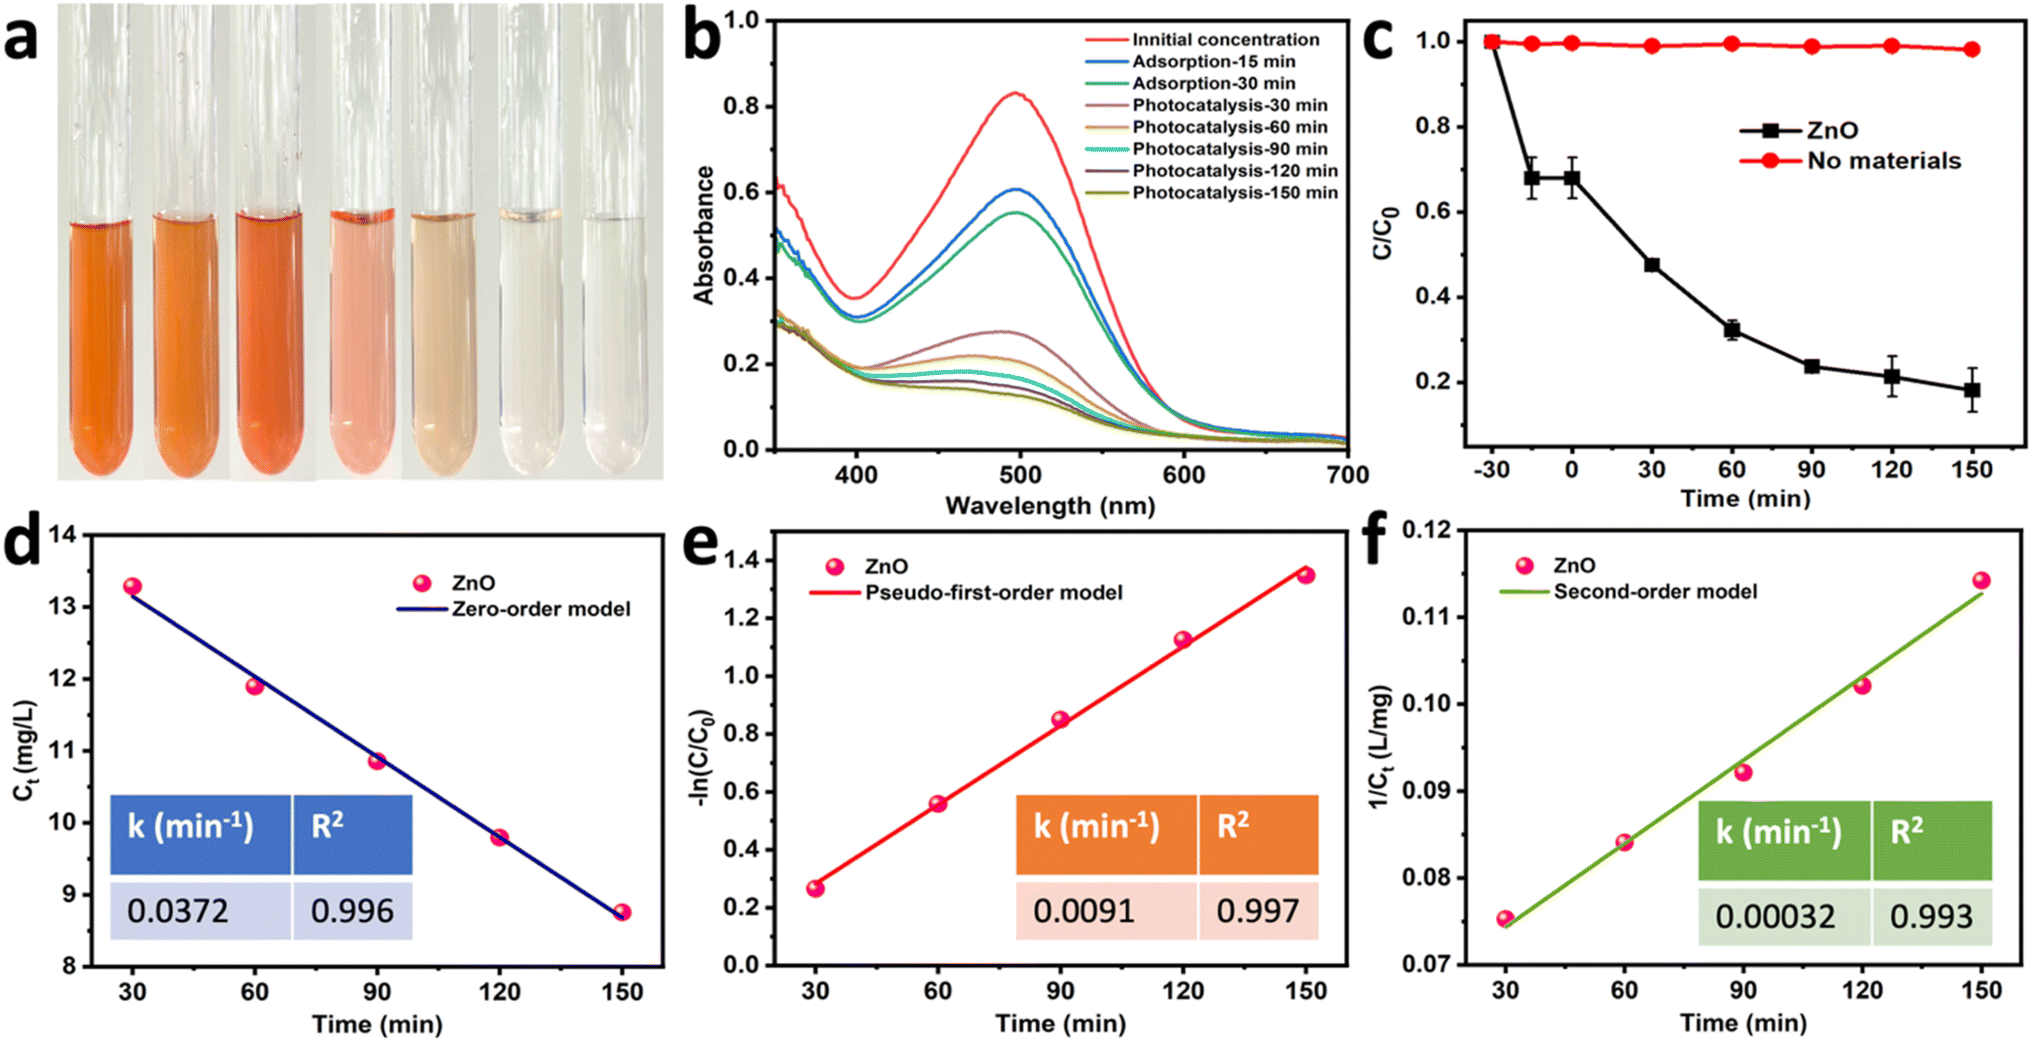
Experiments were conducted to evaluate the effect of light and materials on the CR degradation process, as shown in Fig. 10. Accordingly, photocatalytic degradation experiments were performed under controlled conditions, including a pH of 7, an initial CR concentration of 20 ppm, a ZnO dosage of 0.2 g L−1, and a distance of 10 cm between the catalyst-dye solution and the light source. As a result, the findings reveal that both light and catalytic materials enhance the CR degradation process (Fig. 10a and b). Additionally, Fig. 10c illustrates that minimal degradation occurred when catalytic materials were absent.
 |
| | Fig. 10 (a) The change in dye solution at each interval. (b) The absorbance spectra used to assess CR removal efficiency on ZnO. (c) The CR degradation under visible light with ZnO and without ZnO. (d) The zero-order model. (e) The pseudo-first-order model. (f) The second-order model. | |
For kinetic models, the photodegradation kinetics of the reaction are described by zero-order model, pseudo-first-order model, and second-order model, according to eqn S2–S4.† The obtained results show that the first-order model is the best fitting model with a k value of 0.009 (min−1) and a R2 of 0.997, as shown in Fig. 10d. According to Fig. 10e and f, the k values of the zero-order and second-order models ranged from 0.0372 to 0.00032 min−1, while the R2 values were 0.996 to 0.993, respectively. The good fitness of the first-order model was also reported in the previous studies.40–42
The effectiveness of ZnO using MCF extract is expressed by calculation of turnover number (TON) and turnover frequency (TOF). Accordingly, TON indicates how many reaction cycles each photocatalyst site undergoes before deactivation, while TOF represents the reaction rate per catalyst site over time.43 We calculated TON and TOF using the definitions:
| | | TON = moles of degraded pollutant/moles of catalyst | (1) |
| | | TOF = TON/reaction time | (2) |
According to the results, the obtained TON value was 16.003, which mean that each Zn atom in the ZnO catalyst facilitates the decomposition of approximately 16 molecules of CR before losing its catalytic activity. The reaction rate per active site was 0.106 min−1 based on the TON value.
3.5.2. Effect of dosage.
The dosage of the ZnO photocatalyst is also an important factor in the degradation process that needs to be surveyed. Quantities of ZnO nanoparticles of 0.1, 0.15, 0.2, and 0.25 g L−1 were used to degrade a 20 ppm CR dye solution, at pH 7 over 150 min, as shown in Fig. 11a and b. The efficiency of photocatalytic degradation increased gradually as the dosage varied from 0.1 to 0.2 g L−1. Corresponding to the enhancement in dosage, more active sites were available for a photon adsorbtion process from visible light, resulting in a growth in photocatalytic degradation from 58% to 82%. Afterward, the process plateaued at equilibrium for a further enhancement in dosage, i.e., 0.25 g L−1 with a degradation rate of approximately 70%. The main reason is that the interactions between CR molecules and ZnO enable an increase in the surface coverage of materials, shielding light from interacting with the active surface of the photocatalyst. Moreover, after the optimum dose is achieved, an excessive amount of photocatalyst can cause ZnO clusters, which means 0.2 g L−1 was the dosage chosen for further experiments. This finding was in agreement with previous studies.44,45
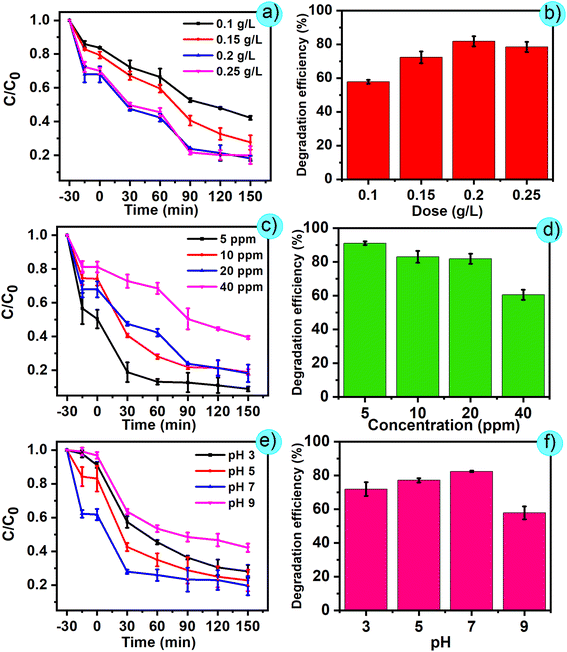 |
| | Fig. 11 The effect of dosage (a and b), initial concentration (c and d), and pH (e and f) on the degradation efficiency for CR dye. | |
3.5.3. Effect of concentration.
The initial concentration of CR was also examined to determine the extent to which the ZnO nanocatalyst degrades CR dye in wastewater. In this survey, the concentration of CR was investigated from 5 to 40 ppm, while maintaining pH, dosage, and exposure time (Fig. 11c and d). Obviously, as the initial concentration increases from 5 to 40 ppm, the degradation efficiency witnesses a significant decline. The reduction in degradation efficiency may result from the blockage of incident light by the higher dye concentration, limiting its penetration to the catalyst surface. Furthermore, the adsorption of CR molecules onto the catalyst surface inhibited the formation of reactive species, causing a subsequent drop in degradation efficiency.46
3.5.4. Effect of pH.
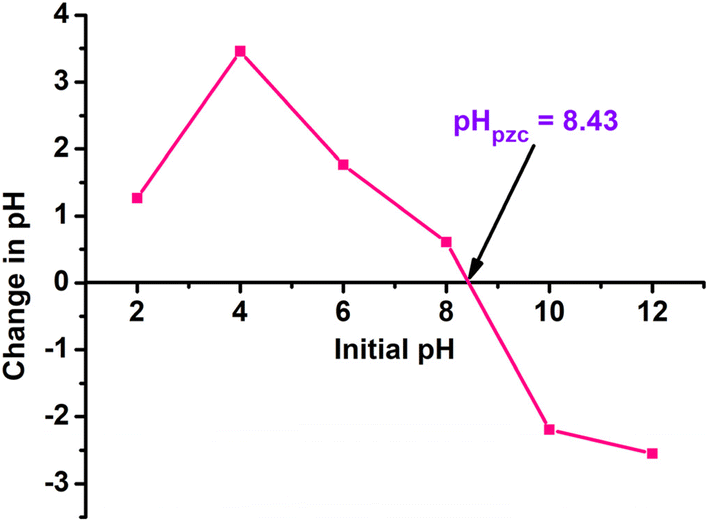
The pH value is one of the most important factors to evaluate whether the degradation performance of a ZnO catalyst for CR aligns with the pH environment. Accordingly, the pH value of CR solution at different levels of 3, 5, 7, and 9 was examined with a fixed condition of dye concentration (20 ppm) and dosage (0.2 g L−1), as shown in Fig. 11e and f. The results obtained showed that pH ranging from acidic to basic conditions enhances the photodegradation performance of ZnO for CR. It is evident that the degradation efficiency was 71% at pH 3, then rose to nearly 82% corresponding to an increase in pH to 7. However, at pH 9, the performance decreased markedly to 57%. This is explained by the fact that the point of zero charge (pHpzc) of ZnO materials was determined to be 8.43 (Fig. 12). At pH below 8.43, the ZnO surface acquires a positive charge, which enhances the generation of ROS that effectively degrade the anionic dye.47 In contrast, at higher alkaline pH values (pH > 8.43), there were no significant electrostatic attractions between the negatively charged ZnO and CR dye molecules.48 Therefore, the photocatalytic degradation of CR dye was found to be more effective under acidic conditions. To sum up, at neutral pH, ZnO nanoparticles still demonstrated high degradation efficiency, and hence, they may have suitability for real wastewater.
 |
| | Fig. 12 pH point of zero charge (pHpzc) of ZnO nanoparticles synthesized using MCF extract. | |
3.6. RSM for optimization
3.6.1. Quadratic equation.
A quadratic polynomial model was used to illustrate the relationship between the selected variables and the predicted response (eqn (3)). Specifically, this equation expresses the dye removal performance (%) of CR as a function of the independent variables. These coded equations are crucial for comparing factor coefficients and assessing the relative significance of the components.| | | CR removal (%) = 57.84 + 4.48A − 36.02B + 5.44C − 2.36D + 3.22AB – 0.63AC − 0.018AD − 0.65BC + 1.40BD + 1.15CD + 0.75A2 + 4.16B2 − 8.31C2 − 3.99D2 | (3) |
3.6.2. ANOVA data.
To evaluate the adequacy of the model, ANOVA was applied (Table 1). The significance threshold of the model was indicated by the probability p-values below the 5% and 1% significance levels (meaning the confidence intervals were 95% and 99%, respectively).49 The p-value of the regression model was very low (<0.0001). Therefore, this model was proved to be statistically significant at both the 5% and 1% significance levels. The results indicated that the first-order univariate analysis of contact time (A), initial concentration (B), dose of ZnO (C), pH (D), and the multivariate analysis between time (A) and CR concentration (B) had reasonable effects on the CR degradation process, because the p-values were less than 0.05. In addition, the second-order univariate analysis of ZnO dosage (C2) exhibited a significant influence on the CR photocatalytic degradation process. The obtained values demonstrated that all four independent parameters had a direct impact on the photocatalytic removal of CR catalyzed by ZnO mediated by the noni fruit extract. Furthermore, the linear regression coefficient (R2) for CR (0.9912), the adjusted R2 (0.9830), the predicted R2 (0.9538), and the adeq precision (36.2935) all had high values, indicating strong agreement between the expected and observed responses. Finally, the F-value of LOF (lack of fit) was 1.35, which is related to the pure error. A non-significant LOF is required for a good model.50
Table 1 ANOVA data for the proposed model
| Source |
Sum of squares |
Degree of freedom |
Mean square |
F-value |
p-value |
Remark |
| Model |
25![[thin space (1/6-em)]](https://www.rsc.org/images/entities/char_2009.gif) 069.11 069.11 |
14 |
1790.65 |
120.81 |
<0.0001 |
Significant |
|
A-Time |
361.36 |
1 |
361.36 |
24.38 |
0.0002 |
Significant |
|
B-Concentration |
23351.77 |
1 |
23351.77 |
1575.43 |
<0.0001 |
Significant |
|
C-Dose |
533.88 |
1 |
533.88 |
36.02 |
<0.0001 |
Significant |
|
D-pH |
100.25 |
1 |
100.25 |
6.76 |
0.0201 |
Significant |
|
AB
|
165.96 |
1 |
165.96 |
11.20 |
0.0044 |
Significant |
|
AC
|
6.29 |
1 |
6.29 |
4.242 |
0.5247 |
Not significant |
|
AD
|
53 |
1 |
53 |
4 |
0.9852 |
Not significant |
|
BC
|
6.80 |
1 |
6.80 |
4.587 |
0.5085 |
Not significant |
|
BD
|
31.56 |
1 |
31.56 |
2.13 |
0.1652 |
Not significant |
|
CD
|
21.32 |
1 |
21.32 |
1.44 |
0.2490 |
Not significant |
|
A
2
|
1.46 |
1 |
1.46 |
985 |
0.7580 |
Not significant |
|
B
2
|
44.85 |
1 |
44.85 |
03.03 |
0.1024 |
Not significant |
|
C
2
|
178.89 |
1 |
178.89 |
12.07 |
0.0034 |
Significant |
|
D
2
|
41.34 |
1 |
41.34 |
2.79 |
0.1156 |
Not significant |
| Residual |
222.34 |
15 |
14.82 |
|
|
|
| Lack of fit |
162.11 |
10 |
16.21 |
1.35 |
0.3912 |
Not significant |
| Pure error |
60.23 |
5 |
12.05 |
|
|
|
| Cor total |
25291.45 |
29 |
|
|
|
|
3.6.3. Three-dimensional response surfaces.
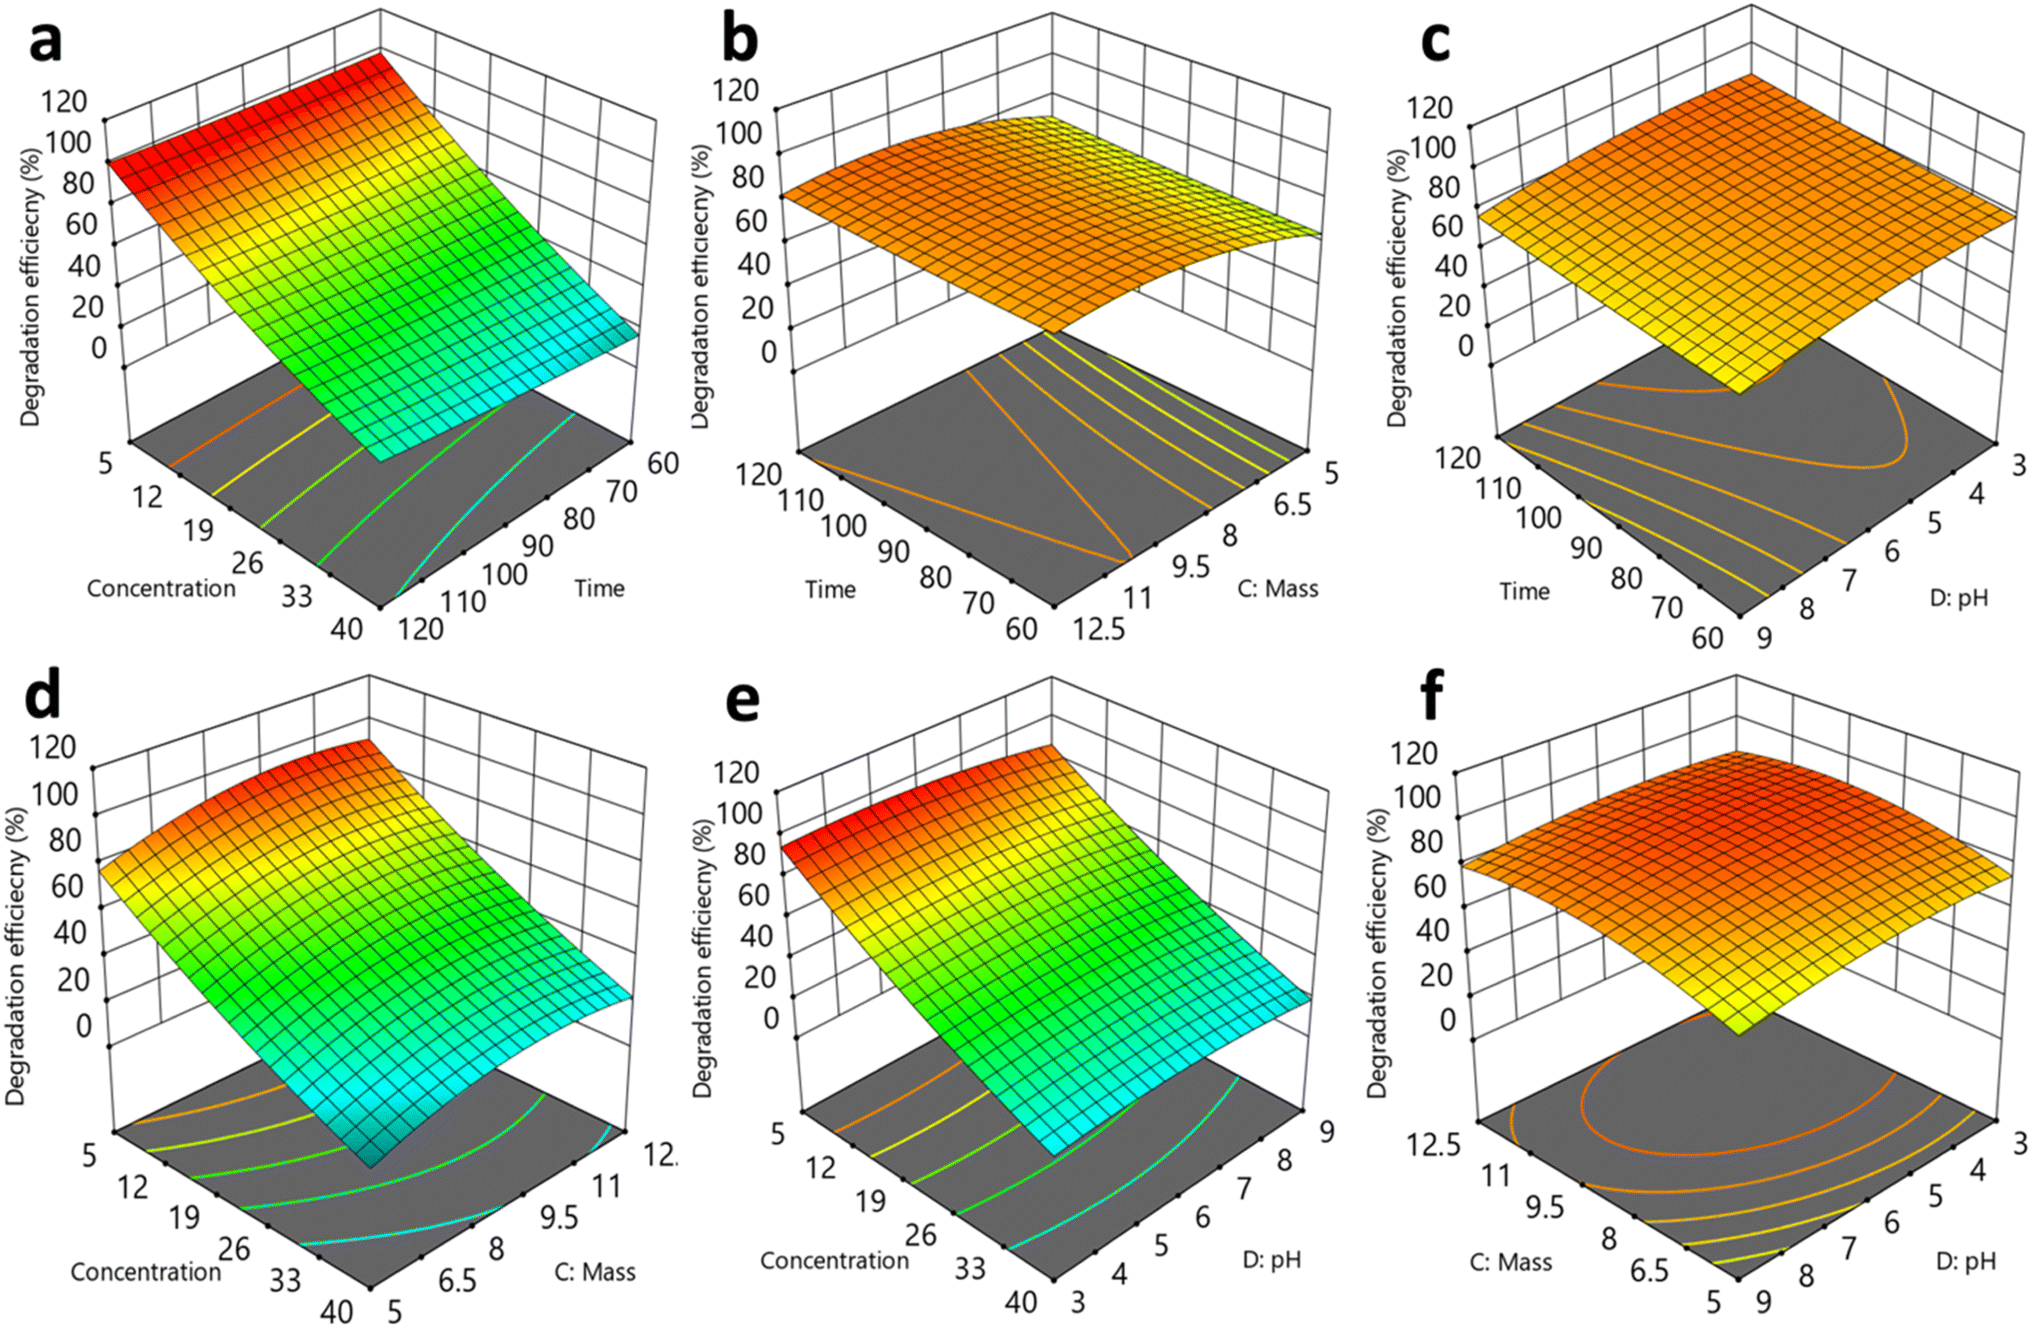
To gain a comprehensive understanding of the response relationship between the independent variables and CR removal efficiency, three-dimensional (3D) response surfaces were constructed for CR removal (%) using a quadratic model.51 The interaction relationship between the four variables is shown in the 3D plot of the CR dye removal process in Fig. 13. The CR degradation performance increases significantly at lower dye concentration and at higher adsorbent dosage, while time and pH do not have significant effects. In these cases, the photodegradation efficiency increases to 95.23%. The results in Fig. 13 show that increasing the ZnO dosage improved the degradation percentage. Higher ZnO particle dosage provides more accessible active sites.52 These plots show that concentration is the most significant factor compared to the remaining factors. The dye concentration plays an important role as a driving force to overcome the resistance caused by mass transfer between the liquid and solid phases.53 The dye removal efficiency decreases with increasing concentration of each dye, possibly due to saturation of the active sites on the adsorbent surface.
 |
| | Fig. 13 3D plots for response surfaces: interactions between (a) concentration and reaction time, (b) reaction time and ZnO mass, (c) reaction time and pH, (d) concentration and ZnO mass, (e) concentration and pH, (f) ZnO mass and pH. | |
3.6.4. Diagnostics and influencing factors.
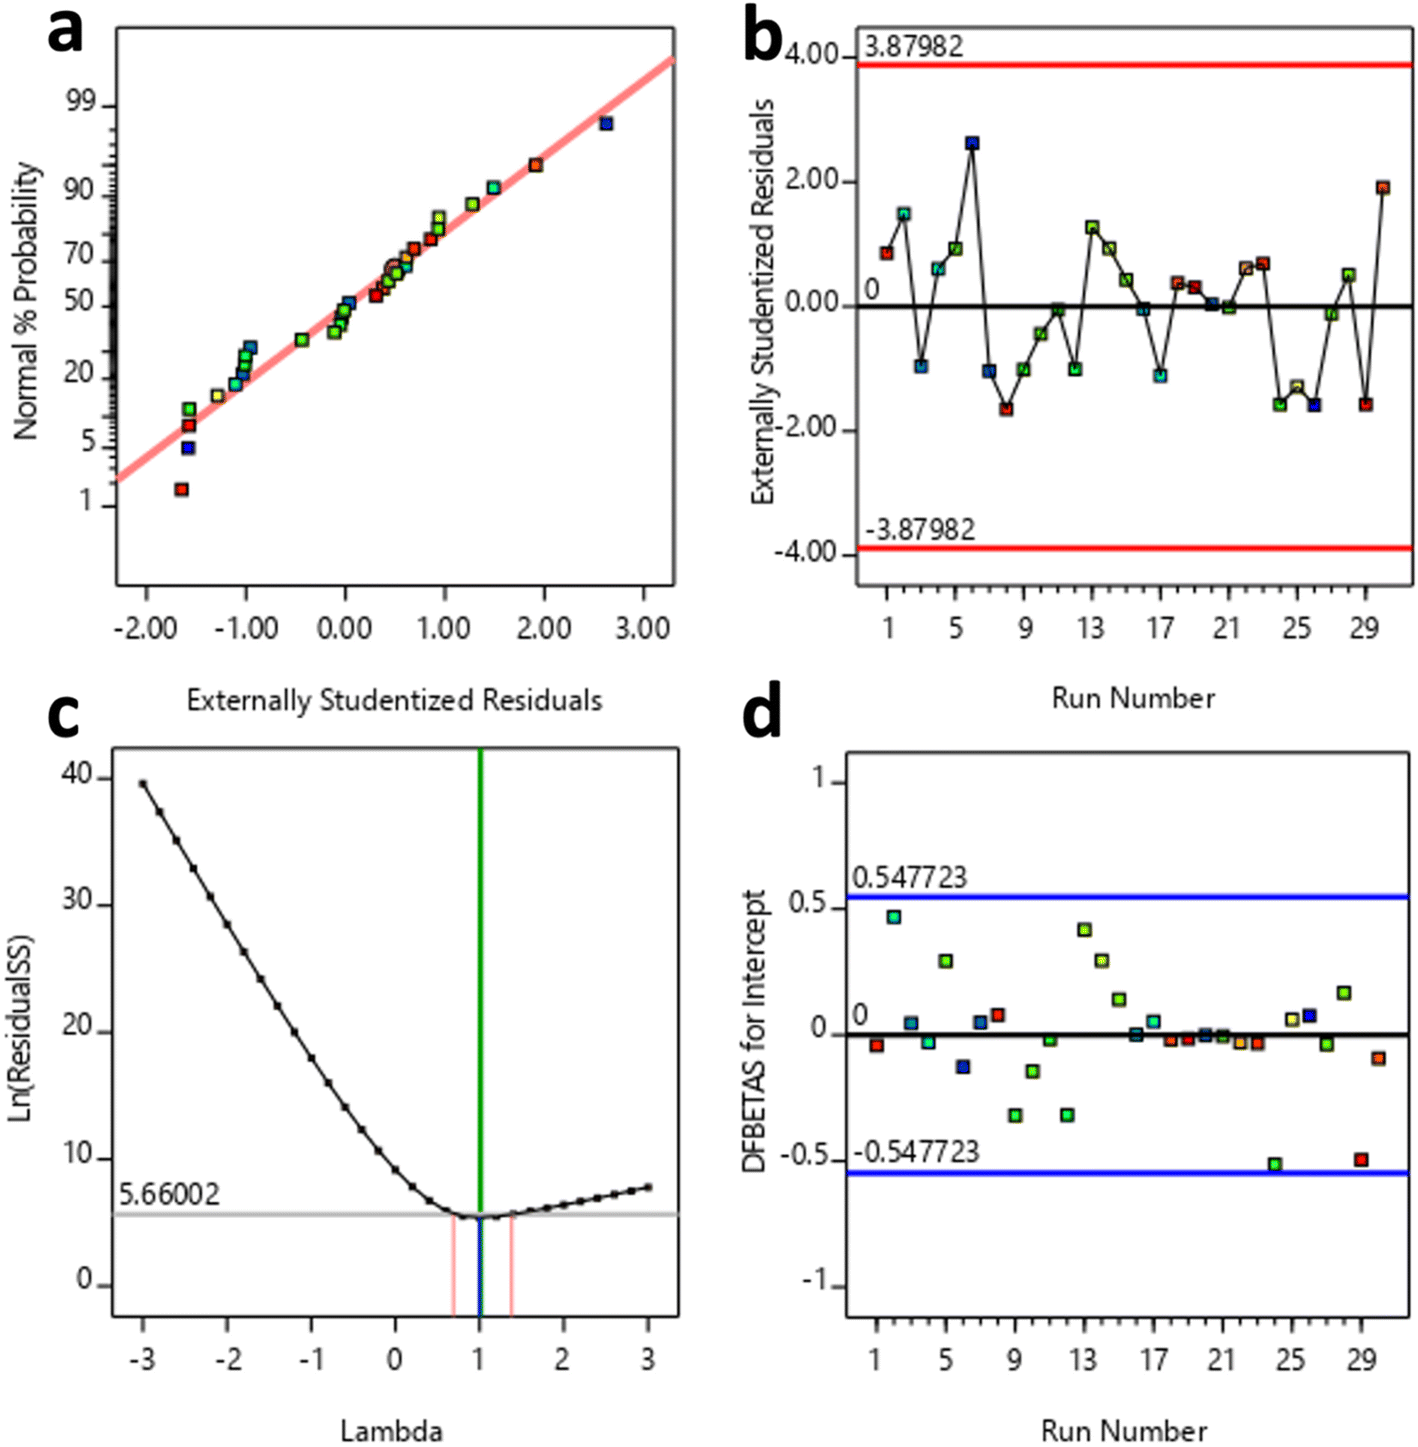
Influence plots are used to evaluate the relative impact of each run and determine whether certain cases stand out more than others. In the normal plot of residuals shown in Fig. 14a, the residuals align along a straight line, suggesting that the errors follow a normal distribution, validating the assumptions of the empirical model.54 As shown in Fig. 14b, the residual data are evenly distributed above and below the x-axis, with no points falling outside the red boundary lines, indicating that the proposed model fits well.55Fig. 14c illustrates the Box–Cox plot showing the transformation of the residuals with respect to lambda.56 The optimal lambda value in the specified range of 0.69 to 1.38 was determined to be 1.01. Accordingly, the lambda value for the current models is equal to 1. The findings indicate that there is no need to power transform the data. Fig. 14d shows the DFBETAS as a measure of the effect of observations on each regression coefficient.57 No parameter has a significant effect on the regression coefficient, confirming there are no data outliers.
 |
| | Fig. 14 (a) Normal plot of residuals. (b) Residuals versus run. (c) Box–Cox plot for power transforms. (d) DFBETAS of intercept versus run. | |
3.7. Photocatalytic mechanism
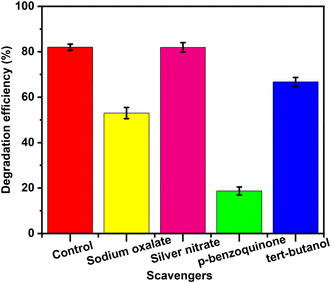
Scavenger experiments were carried out to explore the main free radicals in the process of degradation of CR dye. Here, p-benzoquinone, NaC2O4, tert-butanol, and AgNO3 were used as scavengers for ˙O2−, h+, ˙OH, and e−, respectively. As illustrated in Fig. 15a, AgNO3 and tert-butanol had minimal impact on inhibiting the degradation efficiency, suggesting that e− and ˙OH played a negligible role in pollutant degradation. Conversely, p-benzoquinone and NaC2O4 significantly suppressed photocatalytic degradation, indicating that ˙O2− and h+ were the primary active species. Given the crucial roles of these radicals, the proposed CR degradation mechanism of ZnO materials derived from noni fruit extract is proposed. Upon photon absorption, photoinduced electrons are excited from the valence band (VB) to the conduction band (CB) of ZnO, where they react with O2 to generate superoxide radicals.58 Meanwhile, the holes in the VB can directly oxidize pollutants. Ultimately, these reactive species attack pollutant molecules, breaking them down into intermediates or converting them into CO2 and H2O.
 |
| | Fig. 15 Scavenger study of the CR degradation process using ZnO nanoparticles. | |
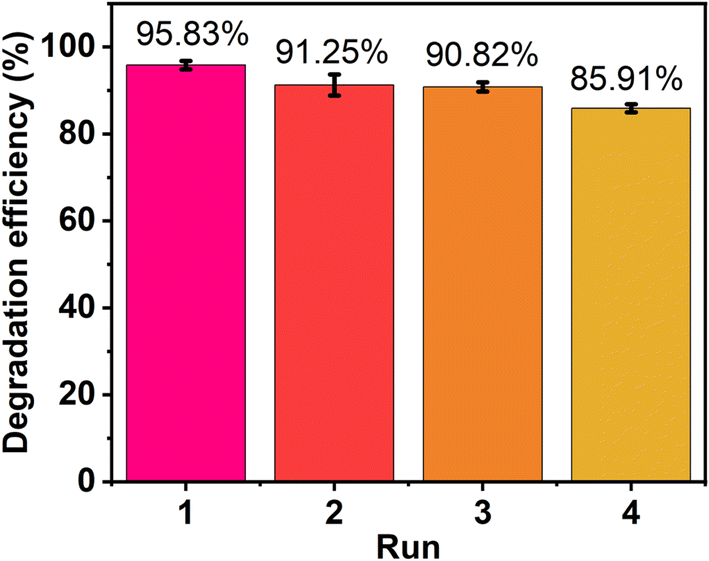
3.8. Reusability of ZnO nanoparticles
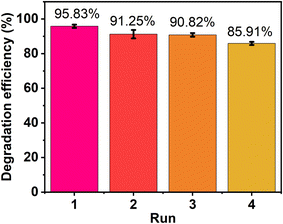
The reusability of ZnO nanoparticles using plant extract was investigated to explore their stability over extended periods. After performing photocatalytic degradation, the materials were collected by centrifugation, then cleaned with ethanol and deionized water several times to remove dye molecules from their surface. This sample was then dried in a drying oven at 100 °C before conducting the next cycle. As a result, high degradation efficiency was obtained, about 85% at the 4th recycle, as shown in Fig. 16. The decrease in performance might be partly due to the loss of photocatalyst after several periods of recovery. Moreover, the main reason was that during the photocatalytic process, intermediate products were generated that occupy the active sites of the ZnO photocatalyst, decreasing the degradation efficiency after each period.59 In general, the obtained ZnO showed excellent stability after several runs, and hence, the catalyst can hold promise in practical environmental applications.
 |
| | Fig. 16 The recyclability of ZnO synthesized using MCF extract. | |
3.9. Comparison study
Table 2 lists photocatalytic results of recent studies (published from 2021 to 2025) on ZnO synthesized using different plant extract sources for the photocatalytic degradation of dyes. Accordingly, the experimental condition and degradation efficiency of photocatalysts were compared. This work was conducted under mild conditions with a small dosage of 0.2 g L−1 and a short period of 60 min under visible light, achieving a high degradation percentage of 95.23%. Meanwhile, most of the listed studies showed a higher dose and longer period with harsh light sources. The outcomes of degradation efficiency and photocatalytic conditions are relatively competitive with previous studies. These results show the promising potential of ZnO synthesized using MCF extract for the degradation of organic dyes under visible light.
Table 2 A comparison of dye removal by ZnO from different plant extract sources and experimental conditions
| No. |
Materials |
Plant sources |
Target dye |
Conditions (time, dosage, light source) |
Degradation percentage (%) |
Ref. |
| 1 |
ZnO |
Morinda citrifolia
|
Congo red |
60 min, 0.2 g L−1, visible light |
95.23 |
This work |
| 2 |
ZnO |
Chrysanthemum
|
Congo red |
180 min, 0.33 g L−1, sunlight |
44 |
60
|
| 3 |
ZnO |
Cannabis sativa
|
Congo red |
80 min, solar light |
38 |
61
|
| 4 |
ZnO |
Syzygium cumini
|
Methylene blue |
180 min, 0.4 g L−1, sunlight |
91.4 |
62
|
| 5 |
ZnO |
Carica papaya
|
Congo red |
80 min, 0.12 g L−1, UV light |
99.9 |
63
|
| 6 |
ZnO |
Ananas comosus
|
Congo red |
300 min, 3 g L−1, UV-visible light |
90 |
64
|
| 7 |
ZnO |
Epipremnum aureum
|
Congo red |
100 min, 0.4 g L−1, visible light |
97 |
65
|
| 8 |
ZnO |
Rosmarinus officinalis
|
Methylene blue |
60 min, 1 g L−1, sun light |
98.82 |
66
|
| 9 |
ZnO |
Ficus carica
|
Methylene blue |
70 min, 0.6 g L−1, sunlight |
95.34 |
67
|
| 10 |
ZnO |
Brassica oleracea
|
Methylene blue |
75 min, 1 g L−1, solar light |
80 |
68
|
4. Conclusion
ZnO nanomaterials were successfully synthesized using a green approach using MCF extract, and showed excellent photocatalytic performance. The Congo red dye degradation efficiency was obtained at 95.23% within 120 min. In addition to dye degradation, the ZnO nanoparticles effectively inhibited the growth of both Gram-positive and Gram-negative pathogenic bacteria, with a stronger effect on Gram-negative strains. Therefore, the ZnO nanoparticles can be a promising photocatalyst for the degradation of hazardous dyes and the elimination of pathogenic bacteria.
Data availability
The data supporting this article have been included as part of the ESI.†
Code availability
The authors declare that software application or custom code supports their published claims and comply with field standards.
Ethical statement
The authors declare that the manuscript has not been published anywhere nor submitted to another journal. The manuscript is not currently being considered for publication in any another journal. All authors have been personally and actively involved in substantive work leading to the manuscript, and will hold themselves jointly and individually responsible for its content. Research does not involve any human participants and/or animals.
Author contributions
Ngoan Thi Thao Nguyen: conceptualisation; investigation; methodology; writing – original draft. Anh Nguyen Quynh Phan: visualization; resources; supervision. Thuan Van Tran: validation; data curation; supervision; writing – review & editing. Thuy Thi Thanh Nguyen: visualization; supervision; project administration. All authors read and approved the final manuscript.
Conflicts of interest
The authors declare that there are no conflicts of interest.
Acknowledgements
This research was funded by Ministry of Education and Training (MOET), Vietnam under Grant Code: B2024-NLS-02.
References
- P. K. Singh, U. Kumar, I. Kumar, A. Dwivedi, P. Singh, S. Mishra, C. S. Seth and R. K. Sharma, Environ. Sci. Pollut. Res., 2024, 31, 56428–56462 CrossRef CAS PubMed.
- M. A. Fawzy and M. Gomaa, J. Appl. Phycol., 2021, 33, 675–691 CrossRef CAS.
- R. Al-Tohamy, S. S. Ali, F. Li, K. M. Okasha, Y. A. G. Mahmoud, T. Elsamahy, H. Jiao, Y. Fu and J. Sun, Ecotoxicol. Environ. Saf., 2022, 231, 113160 CrossRef CAS.
- S. F. Ahmed, M. Mofijur, S. Nuzhat, A. T. Chowdhury, N. Rafa, M. A. Uddin, A. Inayat, T. M. I. Mahlia, H. C. Ong, W. Y. Chia and P. L. Show, J. Hazard. Mater., 2021, 416, 125912 CrossRef CAS PubMed.
- N. Madkhali, C. Prasad, K. Malkappa, H. Y. Choi, V. Govinda, I. Bahadur and R. A. Abumousa, Results Eng., 2023, 17, 100920 CAS.
- A. Pattnaik, J. N. Sahu, A. K. Poonia and P. Ghosh, Chem. Eng. Res. Des., 2023, 190, 667–686 CrossRef CAS.
- P. Dhiman, G. Rana, A. Kumar, G. Sharma, D. V. N. Vo and M. Naushad, Environ. Chem. Lett., 2022, 20, 1047–1081 CAS.
- A. R. Bhapkar and S. Bhame, J. Environ. Chem. Eng., 2024, 12, 112553 CrossRef CAS.
- Y. Y. Chan, Y. L. Pang, S. Lim and W. C. Chong, J. Environ. Chem. Eng., 2021, 9, 105417 CAS.
- A. Abbas, S. Mansoor, M. H. Nawaz, A. A. Chaudhry, K. Ijaz, S. Riaz and A. Hayat, RSC Adv., 2023, 13, 11537–11545 RSC.
- N. Assad, A. Abbas, M. Fayyaz ur Rehman and M. Naeem-ul-Hassan, RSC Adv., 2024, 14, 22344–22358 RSC.
- S. Zeghoud, H. Hemmami, B. Ben Seghir, I. Ben Amor, I. Kouadri, A. Rebiai, M. Messaoudi, S. Ahmed, P. Pohl and J. Simal-Gandara, Mater. Today Commun., 2022, 33, 104747 CrossRef CAS.
- S. Ghaffar, A. Abbas, M. Naeem-ul-Hassan, N. Assad, M. Sher, S. Ullah, H. A. Alhazmi, A. Najmi, K. Zoghebi, M. Al Bratty, A. Hanbashi, H. A. Makeen and H. M. A. Amin, Antioxidants, 2023, 12, 1201 CrossRef CAS.
- I. S. Saputra, E. Nurfani, A. G. Fahmi, A. H. Saputro, D. O. B. Apriandanu, D. Annas and Y. Yulizar, Vacuum, 2024, 227, 113434 CrossRef CAS.
- S. Ullah, M. Shaban, A. B. Siddique, A. Zulfiqar, N. S. Lali, M. Naeem-ul-Hassan, M. I. Irfan, M. Sher, M. Fayyaz ur Rehman, A. Hanbashi, F. Y. Sabei, H. M. A. Amin and A. Abbas, J. Environ. Chem. Eng., 2024, 12, 113350 CrossRef CAS.
- B. Sarkar, P. Bhattacharya, C. Yen Chen, J. P. Maity and T. Biswas, Int. J. Exp. Res. Rev., 2022, 29, 10–32 CrossRef.
- B. West, S. Deng, F. Isami, A. Uwaya and C. Jensen, Foods, 2018, 7, 58 CrossRef PubMed.
- R. Abou Assi, Y. Darwis, I. M. Abdulbaqi, A. A. Khan, L. Vuanghao and M. H. Laghari, Arab. J. Chem., 2017, 10, 691–707 CrossRef CAS.
- R. T. Dewi, G. Primahana, A. W. Septama, M. Angelina, L. Meilawati, S. Fajriah and G. F. Swandiny, Pharmacia, 2022, 69, 709–717 CrossRef CAS.
- A. Sudha, I. Manimehan, R. Shalini, M. Varshini, K. Ravichandran, M. Ayyanar, P. K. Praseetha and D. Saravanakkumar, Mater. Sci. Semicond. Process., 2024, 178, 108437 CrossRef CAS.
- K. P. Greeshma and R. Thamizselvi, J. Mol. Liq., 2022, 351, 118636 CrossRef CAS.
- V. Dhiman, N. Kondal and P. Choudhary, Environ. Res., 2022, 114751 Search PubMed.
- G. Kamarajan, D. B. Anburaj, V. Porkalai, A. Muthuvel and G. Nedunchezhian, J. Indian Chem. Soc., 2022, 99, 100695 CrossRef CAS.
- A. A. kadhem and H. A. Alshamsi, Biomass Convers. Biorefin., 2024, 14, 24655–24669 CrossRef CAS.
- X. T. Tran, T. T. L. Bien, T. Van Tran and T. T. T. Nguyen, Nanoscale Adv., 2024, 6, 4885–4899 RSC.
- T. Hassanein, A. Mohammed, W. Mohamed, R. Sobh and M. Zahran, Egypt. J. Chem., 2021, 64, 3767–3790 Search PubMed.
- T. S. Aldeen, H. E. Ahmed Mohamed and M. Maaza, J. Phys. Chem. Solids, 2022, 160, 110313 CrossRef CAS.
- J. Sahu, S. Kumar, V. S. Vats, P. A. Alvi, B. Dalela, S. Kumar and S. Dalela, J. Lumin., 2022, 243, 118673 CrossRef CAS.
- K. Subramani and A. Incharoensakdi, Int. J. Biol. Macromol., 2024, 263, 130391 CrossRef CAS PubMed.
- Z. Shaghaghi, S. Mollaei, A. R. Amani-Ghadim and Z. Abedini, Mater. Chem. Phys., 2023, 305, 127900 CrossRef CAS.
- Q. P. Pham, Q. N. Le Nguyen, N. H. Nguyen, U. T. T. Doan, T. D. T. Ung, V. C. Tran, T. B. Phan, A. T. T. Pham and N. K. Pham, Ceram. Int., 2023, 49, 20742–20755 CrossRef CAS.
- M. Ahmad, W. Rehman, M. M. Khan, M. T. Qureshi, A. Gul, S. Haq, R. Ullah, A. Rab and F. Menaa, J. Environ. Chem. Eng., 2021, 9, 104725 CAS.
- D. Sudha, E. R. Kumar, S. Shanjitha, A. M. Munshi, G. A. A. Al-Hazmi, N. M. El-Metwaly and S. J. Kirubavathy, Ceram. Int., 2023, 49, 7284–7288 CAS.
- B. Javadi, A. Farahmand, S. Soltani-Gorde-Faramarzi and M. A. Hesarinejad, Int. J. Biol. Macromol., 2024, 275, 133469 CAS.
- P. Nikolic and P. Mudgil, Microorganisms, 2023, 11, 259 CrossRef CAS PubMed.
- R. Fouladi-Fard, R. Aali, S. Mohammadi-Aghdam and S. Mortazavi-derazkola, Arab. J. Chem., 2022, 15, 103658 CrossRef CAS.
- J. Du, A. AL-Huqail, Y. Cao, H. Yao, Y. Sun, M. Garaleh, E. El Sayed Massoud, E. Ali, H. Assilzadeh and J. Escorcia-Gutierrez, Environ. Res., 2024, 258, 119204 CrossRef CAS.
- R. M. Thangavelu, W. L. da Silva, N. Zuverza-Mena, C. O. Dimkpa and J. C. White, Nanoscale, 2024, 16, 19998–20026 RSC.
- S. Sasi, P. H. Fathima Fasna, T. K. Bindu Sharmila, C. S. Julie Chandra, J. V. Antony, V. Raman, A. B. Nair and H. N. Ramanathan, J. Alloys Compd., 2022, 924, 166431 CrossRef CAS.
- A. B. Siddique, M. A. Shaheen, A. Abbas, Y. Zaman, A. Ali, M. Naeem-ul-Hassan and J. Iqbal, J. Environ. Chem. Eng., 2024, 12, 112725 CrossRef CAS.
- A. W. Khan, N. S. Lali, F. Y. Sabei, M. I. Irfan, M. Naeem-ul-Hassan, M. Sher, A. Y. Safhi, A. Alsalhi, A. H. Albariqi, F. Kamli, H. M. A. Amin and A. Abbas, J. Environ. Chem. Eng., 2024, 12, 112576 CrossRef CAS.
- J. Zambrano, P. A. García-Encina, J. J. Jiménez, R. López-Serna and R. Irusta-Mata, J. Water Process Eng., 2022, 48, 102841 CrossRef.
- S. M. Abdel-Moniem, M. A. El-Liethy, H. S. Ibrahim and M. E. M. Ali, Ecotoxicol. Environ. Saf., 2021, 226, 112808 CrossRef CAS.
- T. A. Kurniawan, Z. Mengting, D. Fu, S. K. Yeap, M. H. D. Othman, R. Avtar and T. Ouyang, J. Environ. Manage., 2020, 270, 110871 CrossRef CAS.
- S. S. Sambaza, A. Maity and K. Pillay, ACS Omega, 2020, 5, 29642–29656 CrossRef CAS.
- S. Nouren, I. Bibi, A. Kausar, M. Sultan, H. Nawaz Bhatti, Y. Safa, S. Sadaf, N. Alwadai and M. Iqbal, J. King Saud Univ., Sci., 2024, 36, 103089 CrossRef.
- M. Sadoq, H. Atlas, S. Imame, A. Kali, A. Amar, I. Loulidi, M. Jabri, B.-E. Sadoq, M. Ouchabi, P. S. Abdullah and F. Boukhlifi, Arab. J. Chem., 2024, 17, 105453 CrossRef CAS.
- H. Lee, S. Fiore and F. Berruti, Biomass Bioenergy, 2024, 191, 107446 CrossRef CAS.
- H. Kermet-Said and N. Moulai-Mostefa, Biomass Convers. Biorefin., 2024, 14, 8419–8431 CrossRef CAS.
- A. Dargahi, M. R. Samarghandi, A. Shabanloo, M. M. Mahmoudi and H. Z. Nasab, Biomass Convers. Biorefin., 2023, 13, 7859–7873 CrossRef CAS.
- M. S. Manzar, G. Khan, P. V. dos Santos Lins, M. Zubair, S. U. Khan, R. Selvasembian, L. Meili, N. I. Blaisi, M. Nawaz, H. Abdul Aziz and T. S. Kayed, J. Mol. Liq., 2021, 339, 116714 CAS.
- S. Shojaei, A. Nouri, L. Baharinikoo, M. Davoodabadi Farahani and S. Shojaei, Polyhedron, 2021, 196, 114995 CAS.
- E. Rápó and S. Tonk, Molecules, 2021, 26, 5419 Search PubMed.
- I. C. Nwuzor, B. J. Adinoyi, C. F. Okey-Onyesolu and H. C. Oyeoka, Sustain. Chem. Environ., 2023, 2, 100008 CrossRef.
- S. Sharafinia and A. Rashidi, Arab. J. Chem., 2023, 16, 105288 CrossRef CAS.
- H. M. Abumelha, Int. J. Biol. Macromol., 2024, 264, 130635 CrossRef CAS.
- P. Ghahremani, A. Nezamzadeh-Ejhieh and M. H. Vakili, Int. J. Biol. Macromol., 2023, 253, 127115 CrossRef CAS PubMed.
- Z. Wang, L. Jiang, K. Wang, Y. Li and G. Zhang, J. Hazard. Mater., 2021, 410, 124948 CrossRef CAS PubMed.
- R. Yuan, J. Qiu, C. Yue, C. Shen, D. Li, C. Zhu, F. Liu and A. Li, Chem. Eng. J., 2020, 401, 126020 CrossRef CAS.
- N. T. T. Nguyen, L. M. Nguyen, T. T. T. Nguyen, N. H. Nguyen, D. H. Nguyen, D. T. C. Nguyen and T. Van Tran, J. Environ. Manage., 2023, 326, 116746 CrossRef CAS PubMed.
- A. Chauhan, R. Verma, S. Kumari, A. Sharma, P. Shandilya, X. Li, K. M. Batoo, A. Imran, S. Kulshrestha and R. Kumar, Sci. Rep., 2020, 10, 7881 CrossRef CAS PubMed.
- H. Sadiq, F. Sher, S. Sehar, E. C. Lima, S. Zhang, H. M. N. Iqbal, F. Zafar and M. Nuhanović, J. Mol. Liq., 2021, 335, 116567 CrossRef CAS.
- J. Gaur, K. Vikrant, K. H. Kim, S. Kumar, M. Pal, R. Badru, S. Masand and J. Momoh, Mater. Today Sustain., 2023, 22, 100339 Search PubMed.
- S. Deebansok, T. Amornsakchai, P. Sae-ear, P. Siriphannon and S. M. Smith, J. Environ. Chem. Eng., 2021, 9, 104746 CrossRef CAS.
- R. S. Brishti, M. Ahsan Habib, M. H. Ara, K. M. Rezaul Karim, M. Khairul Islam, J. Naime, M. M. Hasan Rumon and M. A. Rayhan Khan, Results Chem., 2024, 7, 101441 CrossRef CAS.
- T. Saad Algarni, N. A. Y. Abduh, A. Al Kahtani and A. Aouissi, Green Chem. Lett. Rev., 2022, 15, 460–473 CrossRef CAS.
- J. Arumugam, S. Thambidurai, S. Suresh, M. Selvapandiyan, M. Kandasamy, N. Pugazhenthiran, S. Karthick Kumar, T. Muneeswaran and F. Quero, Chem. Phys. Lett., 2021, 783, 139040 CrossRef CAS.
- U. Manojkumar, D. Kaliannan, V. Srinivasan, B. Balasubramanian, H. Kamyab, Z. H. Mussa, J. Palaniyappan, M. Mesbah, S. Chelliapan and S. Palaninaicker, Chemosphere, 2023, 323, 138263 CrossRef CAS PubMed.
|
| This journal is © The Royal Society of Chemistry 2025 |
Click here to see how this site uses Cookies. View our privacy policy here. 
 Open Access Article
 This Open Access Article is licensed under a Creative Commons Attribution-Non Commercial 3.0 Unported Licence
 *d and
Thuy Thi Thanh
Nguyen
*c
*d and
Thuy Thi Thanh
Nguyen
*c