
 Open Access Article
 This Open Access Article is licensed under a
 Creative Commons Attribution 3.0 Unported Licence
Surfactant-based interface capture towards the development of 2D-printed photonic structures†
Appurva
Tiwari
 a,
Seong Jae
Lee
b and
Ashish Kumar
Thokchom
*a
a,
Seong Jae
Lee
b and
Ashish Kumar
Thokchom
*a
aSoft Matter Lab, Department of Chemical Engineering, Shiv Nadar Institution of Eminence Deemed to be University, Greater Noida, 201314, India. E-mail: ashish.thokhcom@snu.edu.in
bDepartment of Polymer Engineering, The University of Suwon, Hwaseong, Gyeonggi 18323, South Korea
First published on 20th January 2025
Abstract
This study focuses on fabricating photonic crystals (PCs) by surfactant-based particle capture at the gas–liquid interface of evaporating sessile droplets. The captured particles form interfacial films, resulting in ordered monolayer depositions manifesting iridescent structural colors. The particle dynamics behind the ordered arrangement is delineated. This arrangement is influenced by the alteration in particles' hydrophobicity, charge, and internal flow introduced by the surfactant addition. The influence of surfactant and particle concentrations on the phenomenon is also investigated. The work demonstrates a drop-by-drop technique to scale up the formation of PCs. Furthermore, the work is extended towards demonstrating the utilization of this mechanism to fabricate arbitrary PCs efficiently by direct writing technique. The particle coverage in directly written patterns is influenced by printing speed and particle concentration, which are adjusted to achieve covert photonic patterns. Finally, the replication of colloidal PC onto a flexible polymer with minimal colloid transfer is demonstrated using soft lithography.
New conceptsThis research introduces a novel approach for creating iridescent photonic crystals (PCs) through surfactant-based particle interface capture in evaporating sessile droplets. Initially, the study examines this process in a single droplet, wherein the particles are captured at the droplet interface to form a film that, upon deposition, creates ordered iridescent structures. Detailed insights are provided into particle dynamics and the mechanism behind particle film formation. Scaling up, the photonic structure is extended using a drop-by-drop printing method. Additionally, this work presents another unexplored concept: interface capture-based direct writing of large-scale, customized photonic patterns. This approach can overcome the limitations of existing convective assembly-based direct writing techniques. It can potentially decouple the assembly of the particles from the substrate and eliminate the dependency of the writing speed on the crystal growth rate at the trailing meniscus. Thus, allowing for much faster writing speeds and flexibility in the fabrication process. By adjusting direct writing parameters, sub-monolayer photonic structures can be achieved, imparting covert characteristics while maintaining the intrinsic photonic properties. Furthermore, this research demonstrates the transfer of colloidal photonic structures onto flexible substrates via soft lithography, achieving replication with minimal particle transfer. |
Introduction
Photonic structures, with their intricate nano- and microscale morphologies, interact with visible light to produce structural colors. This optical phenomenon, resulting from the interference of light waves within these structures, has opened a wide range of applications in analysis, sensing, security, electronics, cosmetics, etc.1–11 Considering their diverse applications, different techniques have been investigated to form photonics structures.12–20 The conventional techniques face several challenges, including confined areas of formation, complex operating requirements, low control over the operation, and low flexibility. Recent studies highlight the effectiveness of inkjet printing in overcoming these challenges. This versatile method offers high-precision, low-cost, and mask-free patterning with the capability of arbitrary area production.4,6,21–24Inkjet printing allows selective dispensing of the colloidal droplet onto the substrate. Upon evaporation of the droplet, a pattern of the deposited colloids is left behind on the substrate.25 The formation of deposition patterns is complex as it involves a synergistic contribution of various factors, which have been detailed in recent reviews on droplet evaporation.26–28 Notably, an ordered deposition of the particles is desirable to fabricate efficient photonic structures.29 However, the formation of such structures by droplet printing is significantly challenged by the deposition non-uniformity led by the well-known coffee ring effect (CRE). Suppression of the CRE is among the most investigated topics in studies on sessile droplet evaporation. Several strategies have been suggested to control droplet deposition, such as modification of the substrate wettability, addition of solutes, modification of particle characteristics, changing the solvent properties, and so on.30 However, these strategies are primarily focused on achieving an even distribution of the particles over the droplet contact area, while the microscale particle ordering remains less understood.
It has been well-reported that the addition of a surfactant can suppress the formation of a coffee ring, resulting in a uniform-like deposition.31–33 The surfactant-induced Marangoni flow can mitigate the accumulation of the particles at the droplet contact line (CL) due to CRE. This flow arises due to a surface tension gradient induced by the non-uniform distribution of the surfactant along the gas–liquid (G–L) interface of the droplet. It acts from the droplet edge towards the center, counteracting capillary flow and leading to a more uniform particle distribution. Thus, allowing improved deposition uniformity.34,35 Interestingly, the addition of an oppositely charged surfactant (opposite to particle charge) induces another effect of particle interface capture. The oppositely charged surfactant adsorbs on the particle surface owing to their electrostatic interaction. Thus, altering the particle surface charge and hydrophobicity.36,37 This leads to the capture of particles preventing their outward flow and formation of their aggregates at the interface, resulting in a uniform deposition.38,39 Nevertheless, the submicrometer-scale particle arrangement resulting from the evaporation of surfactant-laden droplets has not been thoroughly explored. A surfactant-based development of ordered monolayer deposition can potentially allow a facile development of photonic structures. However, investigating the fabrication of photonic crystals (PCs) by simple dissolution of a surfactant to a colloidal sessile droplet is limited.40
This work demonstrates an easy method of fabricating photonic structures by adding an oppositely charged surfactant to the colloidal droplet. While the particles are transported to the droplet CL in the absence of the surfactant. The addition of the surfactant leads to the formation of a highly ordered film of particles captured at the G–L interface. The particle dynamics behind the formation of ordered interfacial film is detailed. This is understood as the effect of particle neutralization and hydrophobization upon the addition of oppositely charged surfactant. Hydrophophization results in the tendency of the particles towards the G–L interface, where they are captured to form an interfacial film. While the interparticle capillary meniscus forces primarily control the interfacial particle clustering into a film, the neutralization of particle charge suppressing the interparticle repulsion would simultaneously favor the film formation. Interestingly, the final dried structure shows iridescent photonic characteristics under white LED illumination. The scanning electron microscopy (SEM) analysis of the deposition structure is performed to understand the particle ordering contributing to photonic characteristics. Furthermore, the iridescence nature of the surfactant-based photonic structure is demonstrated and characterized. The effect of the surfactant and particle concentration on the film formation and deposition structure is also investigated. Moreover, the practical applications require large-scale and customized photonic patterns rather than a single droplet. We demonstrate a low-cost and flexible method to customize the printing of the optimized colloidal solution using both drop-by-drop and direct write modes. Since the assembly of particles is facilitated by interface capture rather than the convective flow41 led by evaporation, the colloidal solution is printed at fast direct write speeds. Initially, the fabrication of an arbitrary photonic pattern with monolayer particle coverage is demonstrated by controlling the direct writing speed. The particle concentration and writing speed are further manipulated to create a covert sub-monolayer photonic pattern, which can be potentially used for anti-counterfeit applications. Lastly, the replication of the colloidal photonic pattern is demonstrated using the soft lithography technique.
Results and discussion
Particle deposition and arrangement
This section reports the effect of the surfactant addition on the particle deposition structure and the corresponding structural color. Droplets of 1.5 μl containing a fixed concentration of anionic polystyrene (PS) particles (1.5 wt%) are dried on a glass substrate with and without a cationic surfactant, Cetyltrimethylammonium bromide (CTAB). The obtained deposition structures and their structural color are shown in Fig. 1. The colloidal droplet evaporates to form the typically observed ring-like deposition with a depleted central region without CTAB as shown in Fig. 1a, whereas a significantly altered uniform deposition of particles in the region inside the ring is observed with 0.05 wt% CTAB (Fig. 1d). For further insight, the profilometry analysis of the deposition structures is provided in ESI† (Fig. S1). When observed under collimated white light illumination, the ring-like deposition shows imperceptible structural coloration (Fig. 1b). However, the deposition structure of CTAB-containing droplet manifests vivid structural colors, as shown in Fig. 1e. The colors are found to vary with the viewing angle, which is demonstrated later. | ||
| Fig. 1 The photonic structures resulting from the particle arrangement after complete evaporation of the 1.5 μL droplets with and without CTAB at fixed 1.5 wt% particle concentration placed on the glass substrate. (a)–(c) The ring-like deposition and its structural colors due to the random particle arrangement at the ring obtained from SEM analysis. (d)–(f) The deposition structure of the droplet containing 0.05 wt% CTAB, and its structural color resulting from the well-ordered arrangement of the particles. | ||
The phenomenon responsible for the structural colors in PCs significantly depends on the structural periodicity at the submicron level.29 Thus, the particle arrangement in the depositions is investigated using SEM analysis. The observations reveal a disordered multilayer particle arrangement in the ring-like structure formed without CTAB, as shown in Fig. 1c. Notably, the region inside the ring consists of a depleted staggered particle deposition evident in Fig. 1a. Contrastingly, a well-ordered, closely packed monolayer arrangement of the particles is seen in the deposition of CTAB containing droplet (Fig. 1f and Fig. S2, ESI†). This ordered particle arrangement correlates with the vibrant structural colors exhibited by the CTAB-laden deposition. A further investigation of the particle dynamics can comprehend the mechanisms underlying the significant change in the particle deposition structure and particle arrangement with CTAB. The experimental findings reveal that the alteration in the deposition is attributed to the CTAB-induced capture of the PS particles at the droplet interface, detailed in the subsequent section.
Particle dynamics contributing to deposition structures
The particle dynamics inside the evaporating droplet is investigated using optical microscopy. The evaporation of both the droplets, with and without surfactant, progresses with a pinned CL. In the case of a surfactant-free droplet, the particles remain dispersed inside the droplet. The dispersed particles are gradually transferred to the droplet periphery by the radially outward evaporative flow, forming a dense ring with a depleted inner region. The particles concentrated in the ring are assembled in a multilayered random arrangement. The particle dynamics contributing to such arrangement in the ring has been discussed in the existing literature.40 Interestingly, adding 0.05 wt% CTAB to the colloidal droplet significantly alters the particle dynamics. The radially outward flow (shown by the dashed red lines in Fig. 2a) carries the particles in the bulk of the droplet to the wedge region near the CL. The particles flowing in this region are trapped at the G–L interface and do not flow further to the CL. The outward flow velocity of particles to the wedge region is estimated to be > 4 μm s−1. However, the particle capturing at the G–L interface can be influenced by receding of the interface due to evaporation and diffusion of the particles during the process.42,43 The interface velocity is 0.5 μm s−1. This is calculated as the rate of change of droplet height. Moreover, the particle diffusion velocity is 0.035 μm s−1. The particle diffusion is estimated as the diffuse distance per unit time. The diffuse distance is determined as , where kB is Boltzmann's constant, T the temperature, η is the viscosity of liquid, and r is the radius of the particles.43 The obtained values clearly suggest that the particle exposure to the interface is primarily driven by the outward particle flow causing them to be predominantly captured at the interface in the wedge region.
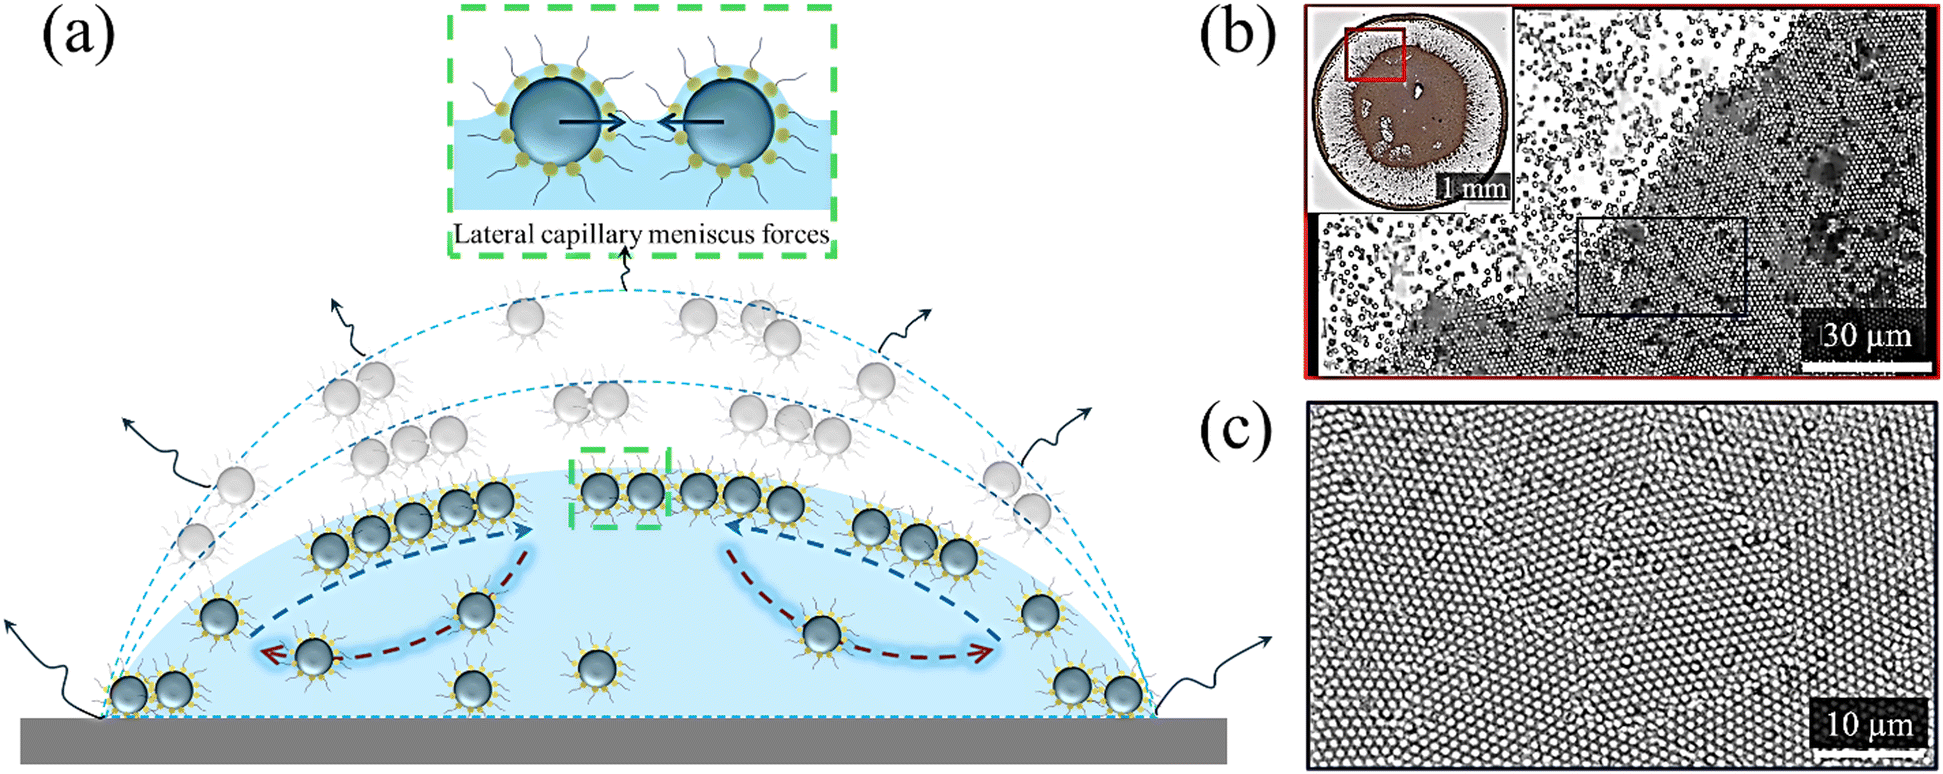 | ||
| Fig. 2 Particle dynamics inside evaporating surfactant-laden sessile droplet. (a) The phenomenon of particle film of particles formation at the droplet interface during evaporation process. The inset Figure demonstrates the interfacial capillary meniscus forces between the particles (b) The captured image of the particles at the G–L interface of droplet. (c) The closer view of the ordered particle film at the G–L interface. | ||
The particle trapping at the G–L interface after the addition of surfactant is ascribed to the increased particle surface hydrophobicity due to the adsorption of surfactant at the particle surface, which is well reported in the existing literature.38,39,42 The influence of particle hydrophobicity on their tendency to be captured at an interface can be explained using the equation:44E = πR2γLG(1 − cos![[thin space (1/6-em)]](https://www.rsc.org/images/entities/char_2009.gif) θ)2. Here E represents the energy required to pull the particle exposed to the G–L interface back into the bulk liquid. R is particle radius, γLG denotes the liquid–gas surface tension, and θ is the contact angle between the liquid and the particle. The change in particle wettability is approximated by estimating the contact angle of water on deposited films of bare and 0.05 wt% CTAB-laden PS particles. The finding suggests an increase in water contact angle by 36° corresponding to an increase in E by a magnitude of ∼4.63 × 10⁶ kT upon addition of CTAB. The details are reported in ESI.† A similar alteration in the wettability of negatively charged particles upon addition of CTAB is reported in the existing literature.45
θ)2. Here E represents the energy required to pull the particle exposed to the G–L interface back into the bulk liquid. R is particle radius, γLG denotes the liquid–gas surface tension, and θ is the contact angle between the liquid and the particle. The change in particle wettability is approximated by estimating the contact angle of water on deposited films of bare and 0.05 wt% CTAB-laden PS particles. The finding suggests an increase in water contact angle by 36° corresponding to an increase in E by a magnitude of ∼4.63 × 10⁶ kT upon addition of CTAB. The details are reported in ESI.† A similar alteration in the wettability of negatively charged particles upon addition of CTAB is reported in the existing literature.45
The particles situated at the G–L interface tend to disrupt the equilibrium surface tension resulting in interface deformation and formation of meniscus around the particle. The extent of the deformation and the shape of meniscus (convex or concave) depends on the particle properties. The overlapping of meniscus of two adjacent particles gives rise to capillary meniscus force between the particles. This interaction can either be attractive (similar shaped meniscus) or repulsive (oppositely shaped meniscus).46 However, in identical particle systems as used in present study, the interparticle capillary meniscus force is always attractive, causing their aggregation into planar interfacial structures, as shown in inset Fig. 2a.42 Moreover, stronger interface deformation allows the particles to interact over a longer range. Relevantly, the increase in particle contact angle due to the addition of 0.05 wt% CTAB would induce increased interface deformation favoring stronger capillary meniscus force between the particles.47 The capillary meniscus force between the particles at the interface is estimated to be six times higher in presence of 0.05 wt% CTAB compared to without CTAB. The details are provided in the ESI.†
With progress in time, the captured particles in the wedge region at the interface tend to aggregate due to the interparticle capillary meniscus force, resulting in well-ordered 2-D-like planar assemblies shown in Fig. S3 (ESI†). The small assemblies further merge to form a large, close-packed colloidal film at the interface, as shown in Fig. 2b. The particle arrangement in the interfacial colloidal film is significantly ordered (Fig. 2c). A clear visualization of the phenomenon is provided in the ESI† as Video S1.
Notably, alongside the radial outward flow (towards CL) in the bulk, an inward Marangoni flow (from CL towards the droplet center) is observed along the interface, as shown by the dashed blue lines in Fig. 2a. The Marangoni flow arising due to temperature gradients is expected to be very weak in a droplet containing dissolved surfactant. Moreover, temperature-driven Marangoni flow is also not observed in CTAB-free droplets. Hence, the generated Marangoni flow is ascribed to the surface tension gradient (lower at CL compared to apex) induced by a non-uniform surfactant distribution along the G–L interface. This is confirmed by measuring the local CTAB concentration profile in an evaporating droplet using fluorescence laser scanning microscopy, following an established experimental method.48 Additional details about the methodology and observations are provided in the ESI.† This non-uniformity in the distribution of surfactant along the interface (higher concentration at droplet CL than apex) in surfactant-laden droplets is caused by the transport of surfactant from the bulk to the CL due to the CRE causing radially outward flow, which can be further visualized in Video S2 (ESI†). Similar observations of Marangoni flow in CTAB-laden sessile droplets is reported in the existing literature.49 Interestingly, the particles and aggregated particles trapped at the interface near the CL are transported toward the droplet center by the interfacial Marangoni flow with a velocity of ∼9 μm s−1 (at t/tf = 0.4). For clarity, Video S3 is provided in the ESI.† Thus, the formation of interfacial film is enhanced by the Marangoni flow. During the final stage of the droplet evaporation, the CL of the droplet de-pins, and the interfacial film deposits to form a monolayer particle deposition encircled by a ring. Evidently, the above observations indicate that the formation of monolayer film at the interface of CTAB-laden droplet involves a simultaneous contribution of particle–interface, particle–particle, and particle–flow interactions.
The iridescence nature of the particle deposition
The structural coloration of the ordered monolayer deposition obtained after evaporation of CTAB-laden colloidal droplet is investigated by capturing the images of the normally illuminated (incident light angle = 0°) deposition at different viewing angles. Fig. 3a shows the setup used, which is detailed in the materials and methods section. Interestingly, the deposition shows an iridescence nature, manifesting vivid structural colors depending on the viewing angle, as illustrated in Fig. 3b and Video S4 (ESI†). Evident from Fig. 3b, the colors corresponding to shorter wavelength are observed at smaller wavelengths. Such angle-dependence of wavelength can be ascribed to the diffraction grating behavior of the ordered monolayer deposition.15,41 This can be understood from the grating equation: mλ = d(sinαi + sinαr),41 where d is the grating spacing, m is the diffraction order, αi and αr are the angles formed by the incident and diffracted rays relative to the normal of the deposition sample. For a fixed αi value of 0, a smaller value of αr would correspond to a shorter diffracted wavelength. Furthermore, the theoretical particle diameter is estimated from the grating equation using the experimentally evaluated diffraction angles. The findings reveal a significantly close theoretical particle diameter to actual particle diameter (1 μm). The experimental estimation of diffraction angles is done by employing a previously reported technique, which involves the projection of the reflected light from a normally illuminated sample onto the inside of a hemispherical translucent ping-pong ball.40,41,50 This straightforward approach allows the correlation of the colors with the viewing angle through a single image. The detailed analysis is reported in the ESI† (Fig. S9).
 | ||
| Fig. 3 The iridescent nature of the deposition pattern obtained with surfactant-laden colloidal droplets. (a) Schematic illustration of experimental setup used to capture the images of structural color at different viewing angles using iPhone. (b) The captured images of structural color of deposition pattern at different viewing angle with fixed angle of illumination. | ||
Notably, spectral broadening or non-uniformity typically occurs in the case of a high density of defects, such as large clusters of disordered particles or significant irregularities in particle size or spacing.51 However, such high defect densities are not observed in the present work. The SEM image of the particle arrangement (Fig. 1d) confirms a close-packed hexagonal structure and an ordered monolayer of particles within the deposition. This ordered arrangement ensures that the constructive interference of light remains coherent. Minor defects, including slight particle misalignments or small variations in inter-particle spacing, are minimal and appear to be localized rather than propagating extensively across the monolayer. This localization significantly limits their influence on the overall structural color. Consequently, the structural color retains its vividness, with no discernible spectral broadening or color non-uniformity. To further support the clear angle-dependent separation of structural color, a digital image illustrating the observed color separation on the hemispherical dome is provided as an inset in Fig. S9b (ESI†).
Surfactant and particle concentration
Since the main objective of the work is to develop surfactant-based photonic structures, it is essential to determine a surfactant concentration that facilitates the formation of an ordered monolayer deposition. The effect of surfactant concentration on the formation of particle deposition is investigated using a dispersed particle concentration of 1.5 wt% inside a 1.5 μl sessile droplet. As shown in Fig. S10 (ESI†), the formation of the interfacial film depends on the CTAB concentration. The corresponding deposition structures and their structural color are shown in Fig. 4(a–e). The dependence of interfacial particle film formation on the surfactant concentration is attributed to the varying extent of CTAB adsorption, affecting the particle hydrophobicity.52 The explanation of the adsorption of CTAB on oppositely charged PS is provided in the ESI.† To provide further insight into the adsorption of CTAB on PS particles, we determined the zeta potential (ζ) of PS particle colloidal solution at different CTAB concentrations (Fig. 4f). The zeta potential values clearly demonstrate an increase in CTAB adsorption with an increase in its concentration. A gradual neutralization (−35 mV to ∼0 mV) of colloids with an increase in CTAB to 0.015 wt%. This can be attributed to the adsorption of CTAB primarily resulting in hemimicelle formation i.e. the first layer of CTAB driven by surfactant-particle electrostatic interaction. While the head of the hemimicelles neutralizes the particles, the tails contribute to the particle hydrophobicity. Notably, a further increase in CTAB results in a positive increase in the zeta potential (surface charge reversal; negative to positive) which flattens at surfactant concentration > 0.05 wt%. This can be explained as the successive second layer adsorption due to surfactant-hemimicelle hydrophobic interactions, forming admicelles.38,39 The admicelles with charged hydrophilic heads of second surfactant layer exposed to liquid contribute to surface charge and hydrophobicity reversal. | ||
| Fig. 4 Effect of CTAB and particle concentration. The gray images and corresponding structural color resulting from deposition structures of sessile droplets containing 1.5 wt% PS particles at different CTAB concentrations (a) 0.0015 wt%, (b) 0.0075 wt%, (c) 0.025 wt%, (d) 0.05 wt%, (e) 0.15 wt%. (f) The ζ plot of particle at different CTAB concentrations. The deposition structures droplet containing fixed dissolved CTAB concentration of 0.05 wt% with varying dispersed particle concentration (g) 0.75wt%, (h) 1 wt% and (i) 1.5 wt% respectively. | ||
At a significantly low CTAB concentration of 0.0015 wt%, no formation of the interfacial film is observed (Fig. S10, ESI†). This is attributed to a marginal single-layer adsorption of the surfactant rendering a significantly small number of hemi micelle hydrophobic tails on the particle surface. This is confirmed by the significantly small change in zeta potential (ζ), shown in Fig. 4f. Thus, the particles remain dispersed in the droplet. The droplet evaporates, forming a coffee ring-like deposition with suppressed structural color. The capturing of the particles at the droplet interface and the formation of the interfacial film is experimentally observed at CTAB concentration values between 0.0075 to 0.05 wt%. This is attributed to the increased adsorption of the CTAB on the particle with a sufficient number of hemimicelles on the particle surface, as confirmed by the corresponding significant increase in zeta potential. At 0.0075 wt% CTAB, a circular rim-like interfacial film is formed while the interface near the droplet center remains depleted, resulting in a concentrated rim-like deposition inscribed in an outer ring. Since most of the particles are concentrated in the rim, the structural color in the corresponding region is improved. The interfacial rim formation and corresponding deposition gradually shift to the droplet center with an increase in the CTAB concentration to 0.025 wt%. At CTAB concentration 0.05 wt%, the circular interfacial film formed at the droplet center, which finally deposits to form a monolayered central deposition. This shift in the formation of the interfacial film from a rim to a circular disc at the droplet center can be attributed to the Marangoni flow apparently seen at CTAB ≥ 0.025 wt%. This led to the transport of the particles and aggregates trapped at the interface near the CL towards the droplet center. Thus, improving the particle distribution along the interface. As a result, the structural color of the deposition structure at CTAB concentrations of 0.025 and 0.05 wt% is significantly enhanced. Importantly, apart from the hydrophobization, the neutralization of particle charge in the surfactant range of 0.0075–0.05 wt% would also contribute to the increased interaction between the particles adsorbed at the G–L interface, favoring the formation of the particle film.38,39
Notably, interfacial film formation is suppressed with a further increase in CTAB concentration (>0.05 wt%). The suppression of film formation can be explained as a significant increase in the admicelles, causing increased surface charge and hydrophobicity reversal. The flattening of the zeta potential at CTAB > 0.05 wt% signifies the near saturation of particle surface with admicelles. This would simultaneously result in a decreased tendency of the particle to be captured and weaker particle interactions. The hydrophobicity reversal is further supplemented by the decrease in contact angle, particle adsorption energy, and interparticle capillary meniscus force values at CTAB > 0.05 wt%, provided in the ESI.† The corresponding deposition consists of a central dot inscribed in a concentrated ring (Fig. 4e). The concentration of the particle in the central dot can be attributed to the typically observed increase in the strength of the Marangoni flow with an increase in the surfactant concentration.34,49
The formation of the monolayer deposit at a surfactant concentration of 0.05 wt% is further investigated at different particle concentrations. Notably, no significant alteration in the particle flow and film formation is observed upon changing the particle concentration. Fig. 4(g–i) clearly shows that a low particle concentration of 0.75 wt% results in the formation of large voids between the monolayer deposition, i.e., a sub-monolayer formation. The increase in particle concentration to 1 wt% led to a more even particle coverage of the deposition area with smaller voids. Moreover, the voids are significantly small at a particle concentration of 1.5 wt%, resulting in a monolayer-like particle coverage. However, a further increase in particle concentration led to multi-layer deposition of the particles. Thus, the deposition coverage can be controlled by particle concentration.
Printing of colloidal solution
The investigation on individual droplets is further extended to the printing of surfactant-laden colloidal droplet solution using a low-cost printing setup shown in Fig. 5a. The details of the printing setup are provided in the materials and methods section. The typical challenges faced in conventional inkjet printing devices, such as clogging, particle size limitations, liquid selectivity, expensive maintenance/replacements, and limited volume dispense, can be overcome using the demonstrated method. The colloidal solution containing 1.5 wt% PS particles and 0.05 wt% dissolved CTAB is dispensed on the glass substrate using drop-by-drop and direct writing methods. In drop-by-drop method (shown in Fig. 5b), an array of the colloidal solution droplets separated by 1.25 mm is formed. For evidence, the captured Video S5 (ESI†) is provided in the ESI.† The droplets are dispensed at a rate of ∼2 droplets per s such that a droplet volume of ∼21 nL is achieved using a dispense rate of 2.50 μL min−1. Fig. 5c shows that the printed array of nanoliter droplets pattern manifests bright structural colors. This is attributed to the well-ordered and monolayer deposition structure of the printed droplets, like single droplet observations, as shown in inset Fig. 5c.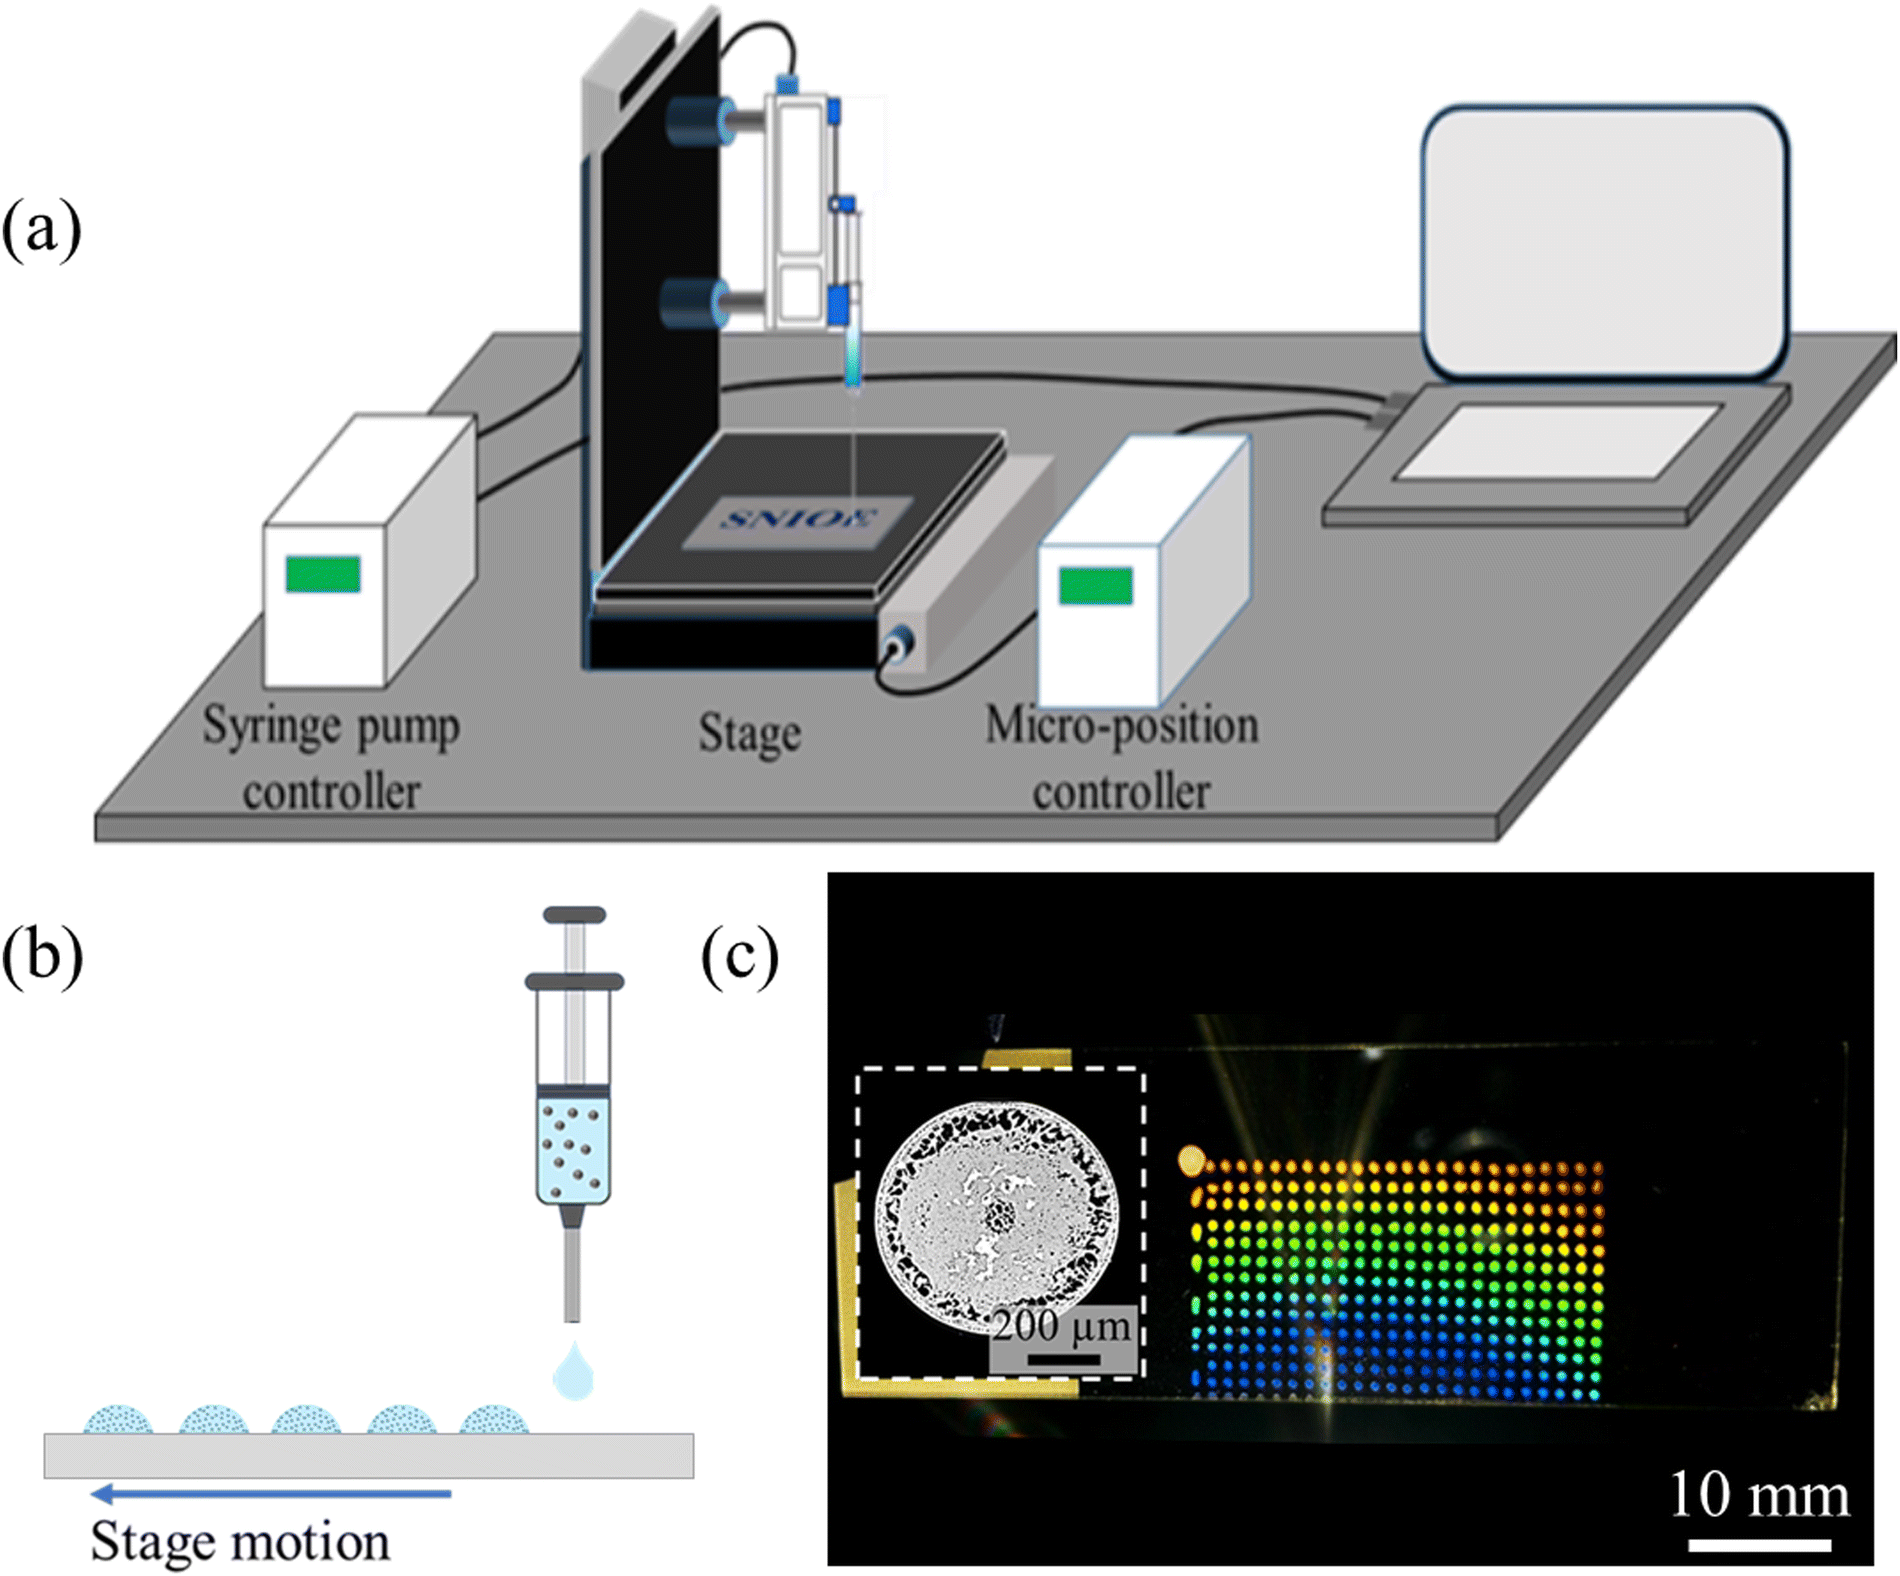 | ||
| Fig. 5 Drop-by-drop printing method of the colloidal solution of particles. (a) Schematic representation of printing setup. (b) Illustration of drop-by-drop printing method. (c) The images of deposition structure of the single droplet and the corresponding photonic structures of the constituent droplets. | ||
In the next step, the direct writing of the colloidal solution is investigated. The existing approach to direct writing of ordered colloidal crystals is based on the convective assembly of the particles.41 Wherein, the rate of monolayer growth occurring at the trailing meniscus determines the printing speed. Notably, a slight localized variation in the evaporation flux can lead to mismatches between the monolayer growth and the printing speed resulting in deposition defects. The overall process is inherently slow. A monolayer photonic crystal using convective assembly-based is typically achieved at a direct writing speed of <1000 μm s−1.41 However, a higher printing speed is desirable for large-scale applications of photonic crystals. An alternative interface capture-based direct writing approach involving interfacial particle aggregation into monolayer film, which deposits into ordered photonic structures, can potentially decouple the printing speed from the meniscus motion. Thus, enabling colloidal structure fabrication at a much faster speed. Hence, the direct writing of the colloidal solution containing the same CTAB (0.05 wt%) and particle concentration (1.5 wt%) as that used for drop-by-drop printing is investigated (shown in Fig. 6a). The dispense rate is fixed at 25 μL min−1, and the printing speed is varied. The particle dynamics during the direct writing is observed using an integrated camera setup. Similar to single droplet observations, the particles are captured at the interface of the directly printed colloidal solution. The inset Fig. 6a shows the real image of interface particle capture, and the corresponding Video S6 is provided in the ESI.† With progress in evaporation, the captured particles deposit onto the substrate. The final deposited structure is significantly dependent on the printing speed. The observed deposition at different speeds is shown in Fig. 6b.
 | ||
| Fig. 6 The colloidal solution printed on the glass substrate using direct writing method. (a) Schematic of direct writing method. The inset image shows the interface particle capture observed in the printed colloidal solution. (b) The images of deposition structures obtained at different speeds of the stage keeping fixed particle concentration (1.50 wt%), surfactant concentration (0.05 wt%), and dispense rate of 25 μL s−1. (c) The captured image of photonic pattern resulting from the well-ordered particle arrangement (inset SEM image) printed at a speed of 5500 μm s−1. (d) The covert–overt characteristic of photonic structure printed at particle concentration of 0.75 wt% and a writing speed of 6500 μm s−1 while keeping fixed 0.05 wt% of surfactant concentration and 25 μL s−1 of dispense rate. | ||
While an intermittent second layer of particles forms at a printing speed of 3500 μm s−1, a monolayer deposition of the particles is formed at the printing speed of 5500 μm s−1. The visualization of the monolayer deposition is shown in Video S7 (ESI†). Evidently, interface capture-based ordered monolayer photonic structure is printed at a significantly faster speed compared to convection-based printing.41 However, a higher printing speed of 6500 μm s−1 results in a decrease in particle coverage, forming a sub-monolayer. Notably, denser particle depositions are observed at the edges of printed crystals at all printing speeds. This is attributed to the outward flow of the particles along the bulk liquid to the periphery without being exposed to the interface. Notably, no clogging of the needle is observed for the printing conditions used in the present study. The above-mentioned settings used to achieve monolayer coverage are further employed to create a random pattern shown in Fig. 6c. The resulting structure exhibits bright iridescent structural colors, indicative of its photonic properties. Moreover, SEM analysis of the particle coverage, as shown in the inset Fig. 6c, confirmed a highly ordered monolayer arrangement of particles within the printed structure. This emphasizes the precision and effectiveness of the interface capture-based printing method, demonstrating its potential for efficiently fabricating customized ordered photonic patterns without compromising optical characteristics.
Furthermore, manipulating the particle coverage in the printed structure can allow the fabrication of transparent photonic structures with covert characteristics. Hence, the printing of photonic structure with decreased particle coverage is further investigated by directly writing a colloidal solution containing lower particle concentration (0.75 wt%; keeping CTAB fixed at 0.05 wt%) at a printing speed of 6500 μm s−1. Specifically, by decreasing the particle concentration, the printed colloidal solution forms a sub-monolayer with larger voids (Video S8, ESI†). Interestingly, reduced particle coverage results in a transparent printed structure, as shown in Fig. 6d (left). However, it becomes visible at certain viewing angles at which the deposited particle manifests structural colors (Fig. 6d, right). Thus, the photonic characteristic is found to be preserved even when the particles are sparsely distributed. For evidence, the visualization of the covert-overt nature of the corresponding structures is demonstrated in Video S9 (ESI†).
Flexible photonic structures
In this section, the printed colloidal pattern is used as a template to generate negative structures onto polydimethylsiloxane (PDMS) and form flexible photonic structures. This involves micropatterning printed PCs onto PDMS using soft lithography, as shown in Fig. 7a. Initially, a silicon elastomer and curing agent are mixed in a 10:1 ratio. This mixture is then degassed to eliminate trapped air bubbles. A glass slide, previously printed with the desired monolayer photonic structure (shown in Fig. 6c), is placed in a Petri dish. The PDMS mortar is poured over the printed pattern on a glass slide and subsequently cured for 2 hours at 75 °C in a vacuum oven. After curing, the PDMS is carefully peeled away from the glass substrate. Interestingly, the colloidal PC printed on glass continues to show iridescence after the patterning process, signifying no or minimal particle transfer from the glass to the PDMS. Meanwhile, the micropatterned PDMS also shows an iridescent nature. The obtained photonic nature of both glass and PDMS after 10 times of replication process remains preserved, as shown in Fig. 7b and c. Fig. 7(d–g) shows the atomic force microscopy (AFM) and SEM analyses of the corresponding structures, confirming no evident particle transfer from the glass substrate. This highlights the consistency of the micropatterning process and the integrity of the printed structures on the glass substrate. These analyses also reveal the formation of microwells on the PDMS surface causing the photonic characteristics.50 Moreover, the pattern on the PDMS is normally transparent and becomes visible only at certain viewing angles, both in white and daylight conditions, as shown in Fig. S12 (ESI†).
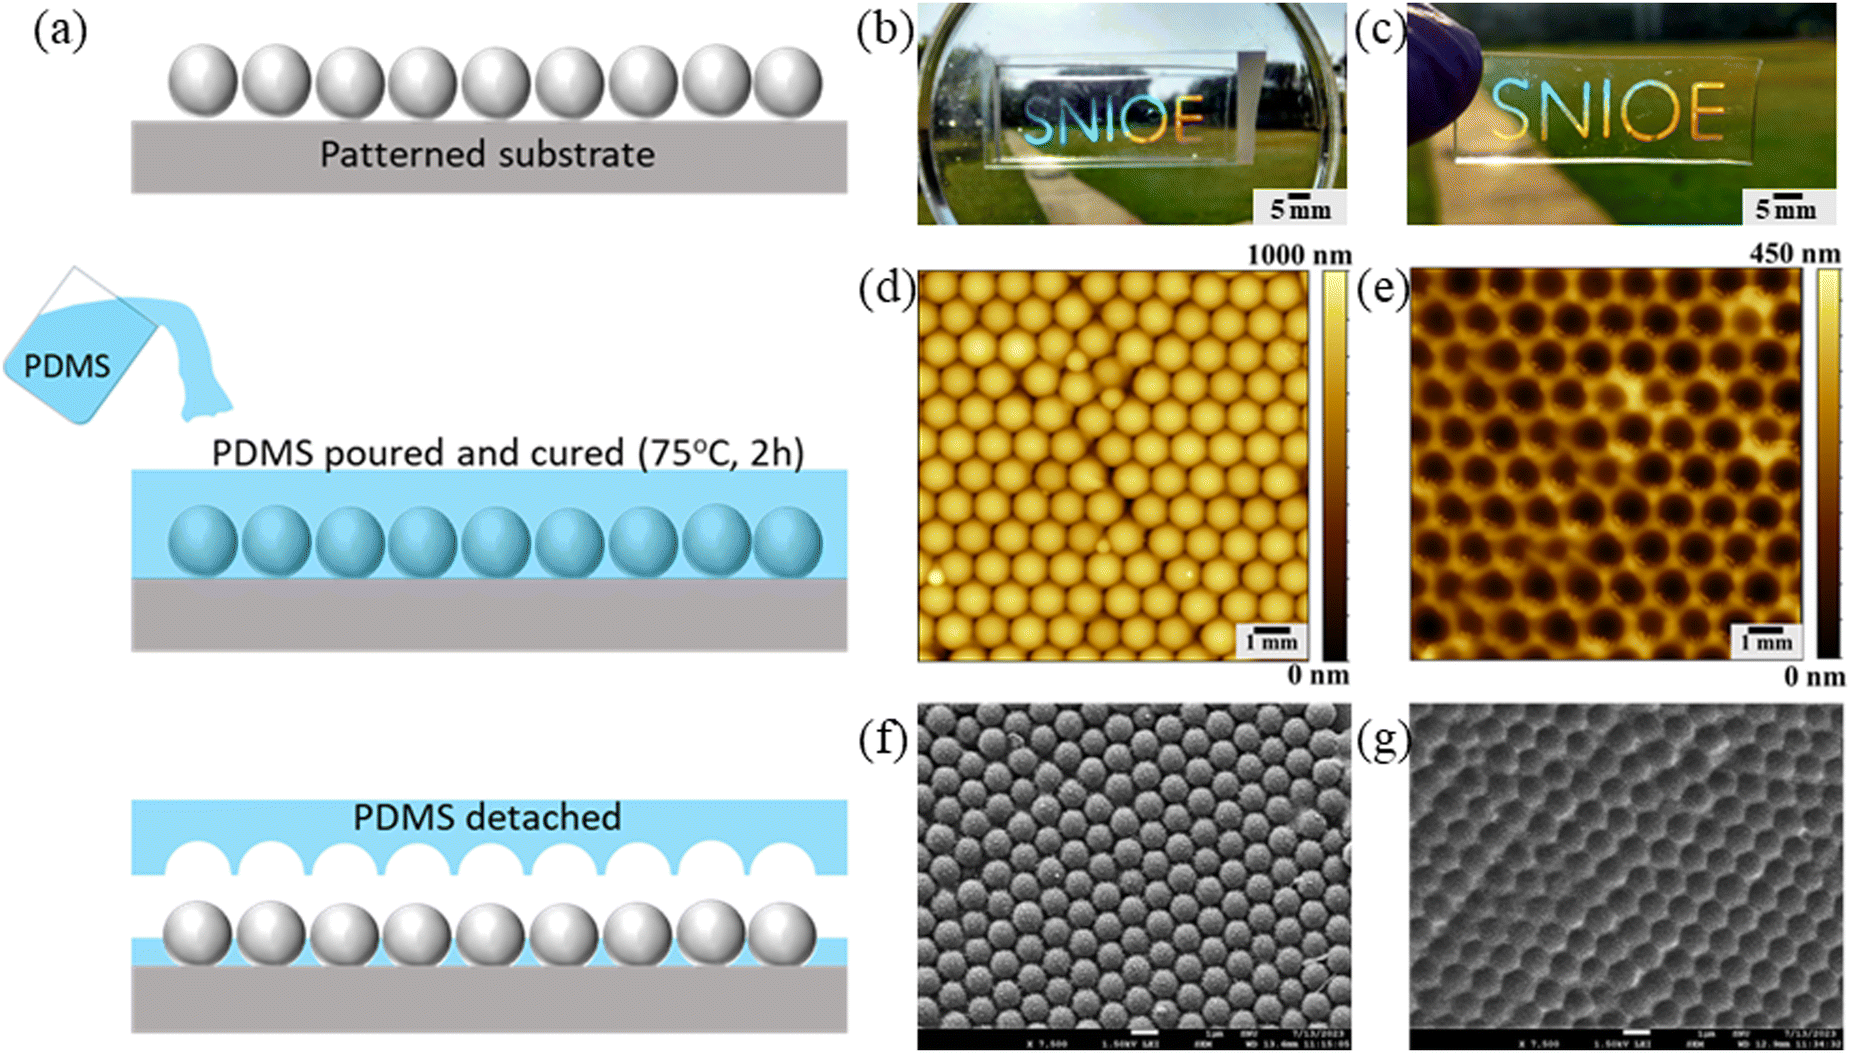 | ||
| Fig. 7 Development of flexible photonic structures. (a) Schematic of soft lithography technique used to replicate the printed colloidal structure. (b) The captured image of photonic pattern printed on the glass substrate. (c) The corresponding replicated patterns obtained on PDMS matrix after 10 replication steps. (d–g) The images of the structures captured by AFM and SEM (d) and (f) Glass substrate and (e) and (g) PDMS matrix. | ||
Conclusions
The study demonstrates an interface capture-based fabrication of PCs introduced by the dissolution of a cationic surfactant to the colloidal solution. The particle arrangement in the fabricated crystals is significantly ordered, giving rise to structural colors. The structural color is dependent on the viewing angle, i.e., iridescent in nature. The investigations on the formation of ordered structures reveal altered particle dynamics significantly contributed by the change in particle hydrophobicity and internal flow upon the addition of surfactant. These are dependent on the dissolved surfactant concentration in the droplet. Moreover, particle concentration can manipulate the monolayer coverage of the deposited droplet. The colloidal solution is used to print on the glass substrate using a low-cost printing setup by drop-by-drop and direct writing techniques. It is shown that arbitrary patterns can be printed using both techniques. Interestingly, the interface capture of the particles is observed in colloidal solution printed by direct-write technique. Similar to a single droplet, an ordered arrangement of the particles is observed in the printed structures. Hence, the printed structures also demonstrate bright structural colors. Notably, in the direct writing method, the particle coverage is significantly dependent on the printing speed. The particle concentration and printing speed can be manipulated to form transparent photonic patterns. Furthermore, the replication of the printed structures into flexible photonic structures can be easily performed using the soft lithography technique. The study paves the way for facile but efficient photonic crystal fabrication by simple surfactant dissolution. The ease of adapting this technique for fast direct writing of patterns further emphasizes its practical implications for scalable and customized photonic applications. Overall, the research offers significant advancements simultaneously in the field of colloidal assembly and photonics, combining innovation with practical usability.Experimental section
Materials
Deionized (DI) water is used as the solvent. CTAB (M.W. = 288.38; Sigma-Aldrich, India) is used as an amphiphilic cationic surfactant. Spherical anionic PS with a diameter of 1 μm are used as colloids. The measured coefficient of variation of particle size is very small (0.015). Glass slides (Marienfeld, Germany) are used as the substrates.Methodology
Aqueous solutions containing different surfactant concentrations are prepared by mixing CTAB and DI water in a beaker placed on a magnetic stirring hot plate and stored separately. The colloidal particles are suspended in the prepared aqueous solutions in small 1.5 mL vials. The surfactant-laden colloidal solutions contained in vials are mixed using a vortex shaker.Analysis of particle dynamics
A 1.5 μL colloidal droplet of the mixed solution is placed on a glass substrate using a micropipette and observed under an inverted optical microscope (CKX53, Olympus Co., Japan). The particle dynamics inside the evaporating colloidal sessile droplet on the glass substrate is observed at different magnifications via CMOS camera (EP50, Olympus Co., Japan). The images and videos (at 60 fps) of the particle motion are captured using EP view software (Olympus Co., Japan). The evolution of the entire droplet with time is captured using an iPhone. The grayscale images of deposition structures are captured using a monochrome camera fitted with a microscope lens (Chronos 1.4 monochrome, Kron Technologies, Canada). The arrangement of particles within the deposition structure is observed using FESEM (field emission scanning electron microscopy). Moreover, the topology of the formed microstructures is assessed using a profilometer (Bruker DektakXT) and AFM (Park NX7, Park Systems). The structural color of the deposition at different viewing angles is captured using an iPhone. The sample against a black background is illuminated with an 80 W collimated white light, and the iPhone camera is positioned 4 cm away from the sample to capture the structural color images as shown in Fig. 3a. The experiments are conducted in a controlled environment with a maintained temperature of 23 ± 1 °C and humidity of 35 ± 3% RH. The experiments are repeated 10–15 times, demonstrating consistent dependency on the reported variables.Printing of colloidal solution
As demonstrated in Fig. 5a, the printing set-up mainly consists of a syringe pump mounted on a Z axis of a 3–axis high-precision motorized stage (Holmarc). The glass substrate is placed in the XY plane of the stage. The motion speed range of the stage is 0–8000 μm s−1. The colloidal solution is filled in a 1 mL syringe with a 32-gauge needle and fixed on the syringe pump (Holmarc). The syringe pump controls liquid dispensing in the volumetric flow range of 4.35 nL s−1 to 0.60 mL s−1. The (XY) stage motion determining the position of colloidal solution dispensation onto a glass substrate and the vertical motion of the syringe pump along the Z-axis is controlled based on a CNC code run on a software interface (Mach 3, Holmarc).Author contributions
Ashish Kumar Thokchom and Appurva Tiwari conceived the idea of the self-assembly of particles on the glass substrate and the replication of the printed structures into flexible photonic structures using the soft lithography technique. Appurva Tiwari performed all experiments and analyzed the results. Seong Jae Lee fabricated the PS particles used in the experiments. All the authors have reviewed and approved the manuscript.Data availability
The data supporting this article have been included as part of the ESI.†Conflicts of interest
There are no conflicts to declare.Acknowledgements
The authors are grateful for the financial support and the research facility provided by the Shiv Nadar Institution of Eminence Deemed to be University, Greater Noida, India, to accomplish this work. SJL acknowledges the support by the National Research Foundation of Korea (NRF-2018R1A5A1024127). This research work was carried out in part at the DST-FIST Confocal Microscope Facility (R-250), which is a part of the Core Imaging Facility (CIF) of the Department of Life Sciences, SNS, which is managed by the Shiv Nadar IoE and is funded by the Department of Science and Technology (Grant No. SR/FST/LS-1/2017/59(c)).References
- K. Li, C. Li, H. Li, M. Li and Y. Song, iScience, 2021, 24, 102121 CrossRef CAS PubMed.
- Y. Deng, Q. Wang, Y. Yuan and J. Huang, Mater. Horiz., 2015, 2, 578–583 RSC.
- A. K. Yetisen, H. Butt, L. R. Volpatti, I. Pavlichenko, M. Humar, S. J. Kwok, H. Koo, K. S. Kim, I. Naydenova, A. Khademhosseini, S. K. Hahn and S. H. Yun, Biotechnol. Adv., 2016, 34, 250–271 CrossRef CAS PubMed.
- G. Hu, T. Albrow-Owen, X. Jin, A. Ali, Y. Hu, R. C. T. Howe, K. Shehzad, Z. Yang, X. Zhu, R. I. Woodward, T. C. Wu, H. Jussila, J. B. Wu, P. Peng, P. H. Tan, Z. Sun, E. J. R. Kelleher, M. Zhang, Y. Xu and T. Hasan, Nat. Commun., 2017, 8, 278 CrossRef PubMed.
- M. Xiao, Z. Hu, Z. Wang, Y. Li, A. D. Tormo, N. Le Thomas, B. Wang, N. C. Gianneschi, M. D. Shawkey and A. Dhinojwala, Sci. Adv., 2017, 3, e1701151 CrossRef PubMed.
- G. Liu, L. Zhou, G. Zhang, Y. Li, L. Chai, Q. Fan and J. Shao, Mater. Des., 2017, 114, 10–17 CrossRef CAS.
- R. Xiong, J. Luan, S. Kang, C. Ye, S. Singamaneni and V. V. Tsukruk, Chem. Soc. Rev., 2020, 49, 983–1031 RSC.
- R. Shanker, S. Sardar, S. Chen, S. Gamage, S. Rossi and M. P. Jonsson, Nano Lett., 2020, 20, 7243–7250 CrossRef CAS PubMed.
- F. Qi, Z. Meng, M. Xue and L. Qiu, Anal. Chim. Acta, 2020, 1123, 91–112 CrossRef CAS PubMed.
- G. Liu, P. Han, L. Chai, Z. Li and L. Zhou, Colloids Surf., A, 2020, 600, 124991 CrossRef CAS.
- A. K. Thokchom, Q. Zhou, D.-J. Kim, D. Ha and T. Kim, Sens. Actuators, B, 2017, 252, 1063–1070 CrossRef CAS.
- S. Lochmann, J. Grothe, K. Eckhardt, D. Leistenschneider, L. Borchardt and S. Kaskel, Nanoscale, 2018, 10, 10109–10115 RSC.
- J. Borowiec, J. Hampl, S. Singh, S. Haefner, K. Friedel, P. Mai, D. Brauer, F. Ruther, L. Liverani, A. R. Boccaccini and A. Schober, ACS Appl. Mater. Interfaces, 2018, 10, 22857–22865 CrossRef CAS PubMed.
- Y. Chen, K. Bi, Q. Wang, M. Zheng, Q. Liu, Y. Han, J. Yang, S. Chang, G. Zhang and H. Duan, ACS Nano, 2016, 10, 11228–11236 CrossRef CAS PubMed.
- C. Park, K. Koh and U. Jeong, Sci. Rep., 2015, 5, 8340 CrossRef CAS PubMed.
- Y. Huang, Q. Zhao, L. Kamyab, A. Rostami, F. Capolino and O. Boyraz, Opt. Express, 2015, 23, 6780–6786 CrossRef CAS PubMed.
- C. A. Gunawan, M. Ge and C. Zhao, Nat. Commun., 2014, 5, 3744 CrossRef PubMed.
- A. M. Hung, C. M. Micheel, L. D. Bozano, L. W. Osterbur, G. M. Wallraff and J. N. Cha, Nat. Nanotechnol., 2010, 5, 121–126 CrossRef CAS PubMed.
- Z. Xu, L. Huang, X. Li, C. Tang, Q. Wei and Y. Wang, Adv. Opt. Mater., 2020, 8, 1901169 CrossRef CAS.
- S. Y. Chou, C. Keimel and J. Gu, Nature, 2002, 417, 835–837 CrossRef CAS PubMed.
- M. Kuang, L. Wang and Y. Song, Adv. Mater., 2014, 26, 6950–6958 CrossRef CAS PubMed.
- L. Bai, Z. Xie, W. Wang, C. Yuan, Y. Zhao, Z. Mu, Q. Zhong and Z. Gu, ACS Nano, 2014, 8, 11094–11100 CrossRef CAS PubMed.
- Z. Xing, J. Zhuang, C. Wei, D. Zhang, Z. Xie, X. Xu, S. Ji, J. Tang, W. Su and Z. Cui, ACS Appl. Mater. Interfaces, 2017, 9, 16351–16359 CrossRef CAS PubMed.
- X. Chen, S. Nie, W. Guo, F. Fei, W. Su, W. Gu and Z. Cui, Adv. Electron. Mater., 2019, 5, 1800991 CrossRef.
- M. Parsa, S. Harmand and K. Sefiane, Adv. Colloid Interface Sci., 2018, 254, 22–47 CrossRef CAS PubMed.
- H. Gelderblom, C. Diddens and A. Marin, Soft Matter, 2022, 18, 8535–8553 RSC.
- S. K. Wilson and H.-M. D'Ambrosio, Annu. Rev. Fluid Mech., 2023, 55, 481–509 CrossRef.
- D. Brutin and V. Starov, Chem. Soc. Rev., 2018, 47, 558–585 RSC.
- N. Vogel, S. Utech, G. T. England, T. Shirman, K. R. Phillips, N. Koay, I. B. Burgess, M. Kolle, D. A. Weitz and J. Aizenberg, Proc. Natl. Acad. Sci. U. S. A., 2015, 112, 10845–10850 CrossRef CAS PubMed.
- D. Mampallil and H. B. Eral, Adv. Colloid Interface Sci., 2018, 252, 38–54 CrossRef CAS PubMed.
- T. Still, P. J. Yunker and A. G. Yodh, Langmuir, 2012, 28, 4984–4988 CrossRef CAS PubMed.
- M. J. Inanlu, B. Shojaan, J. Farhadi and V. Bazargan, Langmuir, 2021, 37, 2658–2666 CrossRef CAS PubMed.
- C. Seo, D. Jang, J. Chae and S. Shin, Sci. Rep., 2017, 7, 500 CrossRef PubMed.
- A. Marin, R. Liepelt, M. Rossi and C. J. Kähler, Soft Matter, 2016, 12, 1593–1600 RSC.
- R. Van Gaalen, C. Diddens, H. Wijshoff and J. Kuerten, J. Colloid Interface Sci., 2021, 584, 622–633 CrossRef CAS PubMed.
- M. Khademi, W. Wang, W. Reitinger and D. P. J. Barz, Langmuir, 2017, 33, 10473–10482 CrossRef CAS PubMed.
- Y. Liu, M. Tourbin, S. Lachaize and P. Guiraud, Chemosphere, 2013, 92, 681–687 CrossRef CAS PubMed.
- M. Anyfantakis, Z. Geng, M. Morel, S. Rudiuk and D. Baigl, Langmuir, 2015, 31, 4113–4120 CrossRef CAS PubMed.
- M. Anyfantakis and D. Baigl, ChemPhysChem, 2015, 16, 2726–2734 CrossRef CAS PubMed.
- A. Tiwari, S. J. Lee, D. K. Garg, S. Shin and A. K. Thokchom, Langmuir, 2024, 40, 8711–8720 CrossRef CAS PubMed.
- A. T. L. Tan, S. Nagelberg, E. Chang-Davidson, J. Tan, J. K. W. Yang, M. Kolle and A. J. Hart, Small, 2020, 16, e1905519 CrossRef PubMed.
- K. N. Al-Milaji and H. Zhao, J. Phys. Chem. C, 2019, 123, 12029–12041 CrossRef CAS.
- T. P. Bigioni, X. M. Lin, T. T. Nguyen, E. I. Corwin, T. A. Witten and H. M. Jaeger, Nat. Mater., 2006, 5, 265–270 CrossRef CAS PubMed.
- V. Lotito and T. Zambelli, Adv. Colloid Interface Sci., 2017, 246, 217–274 CrossRef CAS PubMed.
- S. Zhang, Q. Lan, Q. Liu, J. Xu and D. Sun, Colloids Surf., A, 2008, 317, 406–413 CrossRef CAS.
- P. A. Kralchevsky and K. Nagayama, Adv. Colloid Interface Sci., 2000, 85, 145–192 CrossRef CAS PubMed.
- X. Ma, N. N. Nguyen and A. V. Nguyen, Adv. Colloid Interface Sci., 2022, 307, 102731 CrossRef CAS PubMed.
- T. Kajiya, D. Kaneko and M. Doi, Langmuir, 2008, 24, 12369–12374 CrossRef CAS PubMed.
- X.-Y. Yang, G.-H. Li, X. Huang and Y.-S. Yu, Langmuir, 2022, 38, 11666–11674 CrossRef CAS PubMed.
- A. E. Goodling, S. Nagelberg, M. Kolle and L. D. Zarzar, ACS Mater. Lett., 2020, 2, 754–763 CrossRef CAS.
- Z. Xuan, J. Li, Q. Liu, F. Yi, S. Wang and W. Lu, Innovation, 2021, 2, 100081 CAS.
- R. Deleurence, C. Parneix and C. Monteux, Soft Matter, 2014, 10, 7088–7095 RSC.
Footnote |
| † Electronic supplementary information (ESI) available. See DOI: https://doi.org/10.1039/d4mh01560f |
| This journal is © The Royal Society of Chemistry 2025 |