
 Open Access Article
 This Open Access Article is licensed under a
 Creative Commons Attribution 3.0 Unported Licence
Investigating structural biophysical features for antigen-binding fragment crystallization via machine learning†
Krishna Gopal
Chattaraj
 ,
Joana
Ferreira
,
Allan S.
Myerson
and
Bernhardt L.
Trout
*
,
Joana
Ferreira
,
Allan S.
Myerson
and
Bernhardt L.
Trout
*
Department of Chemical Engineering, Massachusetts Institute of Technology, Cambridge, MA 02139, USA. E-mail: trout@mit.edu; Tel: +1 617 258 5021
First published on 4th March 2025
Abstract
Antibody-based therapeutics continue to be an important pharmaceutical development modality. Crystallization of antibodies is important for structural characterization, but in addition has the potential for use as a separation method and for use as a dosage form. Nevertheless, bringing about controlled crystallization of an antibody remains a challenging task due to its large size, high degree of segmental flexibility, and the intricacy of all the occurring interactions (e.g., protein–protein interactions, protein–solvent interactions, etc.). Methods to predict important contact sites could help to develop such crystallization methods. However, limited data and understanding have hitherto not allowed the development of such robust methods. This study employs machine learning combined with in silico modelling of crystal structures using available experimental structures to identify the crucial physicochemical features necessary for successful antibody crystallization in an attempt to remedy that gap. The developed method can with good accuracy distinguish crystal-site residues from non-crystal-site residues. A set of 510 descriptors is utilized to characterize each residue, which is treated as a distinct data point. Moreover, new algorithms have been developed to design novel descriptors that improve the model's predictive capabilities. Fragment antigen-binding (Fab) regions are investigated due to the scarcity of full-length monoclonal antibodies (mAbs) crystal structures. The current findings show that the extreme gradient boosting (XGBoost) algorithm effectively identifies crystal site residues, as evidenced by an AUPRC value that is more than 3-fold higher than that of the baseline model. The top-ranked descriptors indicate that crystal-site residues are primarily characterized by solvent-exposed residues with high spatial aggregation propensity (SAP), signifying hydrophobic patches, and their immediate surface-exposed neighbors. Moreover, these high SAP residues are often surrounded by other solvent-exposed residues that are either polar, charged, or both. In contrast, residues not involved in crystal interfaces generally lack these essential features, though some might be excluded due to specific crystal lattice arrangements. Additionally, reducing the feature set from 510 to the top 15% in the XGBoost model yields similar performance while significantly simplifying the model.
Design, System, ApplicationMonoclonal antibodies (mAbs) are pivotal therapeutic agents; however, their inherent structural complexity and instability pose significant challenges for crystallization, purification, and formulation. Effective prediction of critical contact sites is therefore crucial for advancing crystallization techniques. Despite this need, the development of robust, universally applicable methods has been limited by insufficient data and an incomplete understanding of the underlying molecular mechanisms. This study addresses these challenges by introducing a machine learning-based classification framework designed to identify structural features that differentiate crystal-site residues from non-crystal-site residues. Using in silico crystal modeling of experimentally available Fab fragments, this approach systematically analyzes residue-level properties to predict crystallization-prone regions. The study emphasizes structure-based descriptors over sequence-based features, providing deeper insights into the spatial and physicochemical characteristics influencing crystallization. Antigen-binding fragments (Fabs) are employed as a proof-of-concept due to their structural simplicity and availability, laying the groundwork for extending this methodology to full-length mAbs. Immediate applications include guiding site-directed mutagenesis to enhance crystallization propensity and optimizing antibody engineering for structural studies. In the future, these insights can be integrated into predictive tools for large-scale mAb development, facilitating progress in drug discovery, structural biology, and biopharmaceutical formulation. This framework bridges computational and experimental approaches, offering a streamlined strategy to advance mAb research and applications. |
1 Introduction
Monoclonal antibodies (mAbs) are top-selling biopharmaceutical products due to their high specificity, minimal side effects, and ability to target a wide range of diseases, making them highly effective therapeutic agents.1–19 For instance, Jay et al. recently reported that ten top-selling drugs are protein biologics, whereas five are monoclonal antibodies, representing at least 40% of the drugs in development today.9 As invaluable research tools, mAbs aid in understanding complex biological processes and are at the forefront of personalized medicine, enabling treatments tailored to individual patient profiles.5 Furthermore, innovations such as bispecific antibodies and antibody–drug conjugates continue expanding their therapeutic applications, underscoring their crucial role in therapeutic and diagnostic fields.6,7However, mAbs are inherently unstable due to both physical and chemical degradation, especially since mAbs solutions often need to be formulated as concentrations greater than 100 mg mL−1, which can also cause viscosity issues.20 Moreover, mAbs' structural complexity leads to challenges with production,21 including purification. Investigating mAb structure is therefore important. Advanced techniques such as X-ray crystallography (XRD), nuclear magnetic resonance (NMR) spectroscopy, and cryo-electron microscopy (cryo-EM) are critical for determining the three-dimensional structures of mAbs at atomic resolution. These methodologies provide insights into the conformational dynamics, binding interactions, and functional mechanisms of mAbs. Crystallization stands out as a crucial technique, not only in structural biology (determination of 3D structures of proteins) but also in replacing the traditional downstream processing for mAbs, in addition to potential formulation as crystals.8–25
Despite its potential use in processing and product development, mAb crystallization faces several challenges.18 The variability in mAb sequence and structure requires ad hoc development of crystallization protocols mostly relying on trial-and-error approaches, which leads to limited predictability and lack of universality. Additionally, the large molecular weight of mAbs (approximately 150 kDa) complicates their organization into a crystalline lattice, while flexible regions often result in inconsistent and irreproducible outcomes.8–19 Identifying properties that facilitate mAb crystallization would be important for creating predictive models to streamline the process, saving time and resources.
In the present work, a novel classification scheme is introduced to identify key features that influence antigen-binding fragments (Fab) crystallization through the application of computational modeling and machine learning. The method can also be used to differentiate between crystal site residues and non-crystal site residues by pinpointing critical structural features and predicting distinct elements that characterize each residue type. Understanding these differences provides valuable insights into the processes involved in antibody crystallization. Antibody fragments were investigated as a proof-of-concept due to the abundance of their structures in the Protein Data Bank: only four full-length structures of monoclonal antibodies have been determined and deposited in the PDB: 1IGT (1997, mouse IgG2), 1IGY (1998, mouse IgG1), 1HZH (2001, human IgG1), and 5DK3 (2015, human IgG4).9 In addition, antibody fragments can offer valuable scaffolding for proteins in the early stages of drug discovery.26 The principles derived from studying Fab fragments can be used to investigate the crystallization behavior of full-length mAbs as similar structural features are involved. Previous scientific investigations have proposed binary classification approaches to determine the critical properties necessary for protein crystallization, typically based on sequence data.27–33 These classification models were designed to distinguish crystallizable proteins from non-crystallizable ones, thereby identifying key features for crystallization derived from protein sequence information. In contrast, in the present study, the proposed approach emphasizes key structure-based features and developing a predictive model to find crystal-prone regions, thus uncovering essential structural attributes. Successful crystallization sometimes depends on protein engineering as a final option to create variants when wild-type proteins fail to crystallize. However, even when wild-type proteins do form crystals, engineering may be required to modify crystal contacts and generate new crystal forms, especially for high-resolution structures needed in drug design to assess interactions between lead compounds and the target protein.34 This study can also be applied to site-directed mutagenesis to increase or decrease the crystallization propensity.
To the best of our knowledge, this is the first work applying a classification strategy for crystal site residues versus non-crystal site residues using machine-learning. The employed methodology is used for all site residues from the experimentally available Fabs through in silico crystal structure modeling.
The manuscript is divided into the following sections: section 2 (Results and discussion) explains the process of generating the dataset for machine learning, the design of the feature set, the key observations, the performance of different machine learning algorithms, top-ranked features, and inferences drawn from the obtained results. Section 3 (Summary and conclusions) summarizes the main results and proposes a crystallization mechanism. Additionally, future applications and perspectives for the current research are also addressed. Lastly, section 4 presents a detailed overview of all the methods and materials used during the computational modeling and application of the machine learning algorithms.
2 Results and discussions
1. Classification scheme and machine learning dataset generation
To identify accurately the physicochemical features essential for Fab crystallization through machine learning, a robust dataset derived from experimental observations is crucial. Currently, there is no experimental classification of Fabs into definitive categories such as crystallizable versus non-crystallizable or easy-to-crystallize versus hard-to-crystallize. To address this, we devised a strategy to create a tailored dataset for Fab crystallization studies.We classified each amino acid residue into two distinct classes: crystal-site versus non-crystal-site. Residues located in the crystal interfaces within the crystal lattice were classified by their reduced solvent accessibility upon interaction, as indicated by a non-zero buried surface area (BSA) and a solvent-accessible surface area (SASA) of 50 Å2 or more. To ascertain the appropriateness of the selected SASA cut-off, the SASA values of fully exposed residues (X) within an alanine-X-alanine (ALA-X-ALA) tri-peptide configurations were developed. In Fig. 1(a), the SASA values of fully exposed residues (X) within an alanine-X-alanine (ALA-X-ALA) tri-peptide residue values is shown. Based on this, for the residues in the Fab's, we set an SASA threshold of 50 Å2, which is also consistent with the literature that shows that solvent exposure of a residue was indicative of its likelihood being within the protein–protein interface.35–39 Mishra et al., suggested that residues were considered surface-exposed if more than 50% of the solvent-accessible surface area of their side-chains was exposed.39 Thus, the more solvent exposure of a residue present in the protein–protein interface, the greater the probability of its involvement in the formation and stabilization of crystalline interfaces (Fig. 1(b)). Also, see Fig. 2 for comprehensive classification scheme implemented in the present study. The residues within 12 Å of the Fab's center of mass, despite having higher SASA values, were excluded from the machine learning (ML) model to avoid false positives due to their low likelihood of appearing at crystal sites, as these residues were typically located deep within the core of the Fab region (Fig. 2).
 | ||
| Fig. 1 (a) The SASA values of fully exposed amino acid residues (X) within an alanine-X-alanine (ALA-X-ALA) tri-peptide configuration. It is assumed that “X” is fully exposed due to the minimal side-chain bulk of alanine residues flanking it, allowing for an unobstructed exposure of the central residue. A bold black line at 50 Å2 serves as a reference threshold, highlighting that all amino acids, including the smallest one, glycine (GLY), exceed this threshold. This setup underscores the significance of the 50 Å2 threshold in evaluating protein–protein interactions and provides insights into the structural determinants of protein crystallization, (b) a schematic depicting the interactions among the residues in Fab–Fab crystal interface. Residues highlighted in sky-blue are less exposed, whereas those in red have higher solvent exposure. Notably, in the Fab–Fab crystal interface, the more exposed residues interact with other with a higher probability than the less solvent-exposed residues, enhancing interface stability. Further, the size of a residue significantly influences its SASA. Residues with extensive side chains (highlighted in violet) tend to have higher SASA values, increasing their surface area for solvent interactions. This increased SASA enhances their likelihood of being present at the interacting interface, as they occupy more space. | ||
 | ||
| Fig. 2 The schematic overview of the classification approach is presented. The process begins with the creation of a repeating unit cell of Fab fragment in silico using unit cell parameters and crystal symmetry operations found in crystallographic information files of Protein Data Bank. Subsequently, unique interfaces (represented by red area) are identified by selecting interfacial residues (within red area) present in crystal interfaces. Those residues are classified as crystal site amino acids (class 1) if they have a buried surface area (BSA) greater than 0 Å2 and a solvent accessible surface area (SASA) is greater or equal to 50 Å2. Otherwise, they are categorized as non-crystal site amino acids (class 0). BSA refers to the total surface area that becomes inaccessible to solvent in the interface during complexation. Residues within the black sphere (marked in red in one of the Fab structures for enhanced visual clarity), surrounding the center-of-mass (COM) within a 12 Å radius, are shown to be excluded from the classification due to their low likelihood of appearing at the crystal interface despite their high surface exposure. The 12 Å distance is specifically chosen to ensure a symmetric selection of residues around the COM, thereby focusing on those with a higher probability of contributing to the crystal lattice. | ||
The structures of Fabs were obtained from the Protein Data Bank (PDB)40 and were selected through the structural antibody database (SAbDab).41 Fabs deposited as monomers were specifically utilized, excluding those complexed as dimers, trimers, tetramers, or other higher-order oligomers, or with other antigens as asymmetric unit. Such choice was driven by our intention to ensure that no potential surfaces were obscured due to complexation or the formation of interfaces. Then, the crystalline symmetric structures of these Fabs were constructed in silico using online available software PDBePISA (Fig. 2).42 Subsequently, crystal and non-crystal site residues were identified.
This led to a dataset of 15![[thin space (1/6-em)]](https://www.rsc.org/images/entities/char_2009.gif) 744 amino acids (Table S1, ESI†). The classification resulted in 3719 amino acids belonging to the crystal-site category (Fig. 2), the rest are in other classes not (i.e., non-crystal-site category). Despite the imbalance, the size is large enough for our purposes.
744 amino acids (Table S1, ESI†). The classification resulted in 3719 amino acids belonging to the crystal-site category (Fig. 2), the rest are in other classes not (i.e., non-crystal-site category). Despite the imbalance, the size is large enough for our purposes.
To construct the machine learning model, a set of features was developed for each residue, taking into consideration both the residue itself and its neighboring residues, to represent them numerically, as depicted in Fig. 3. The overall approach of this work is illustrated in Fig. 4.
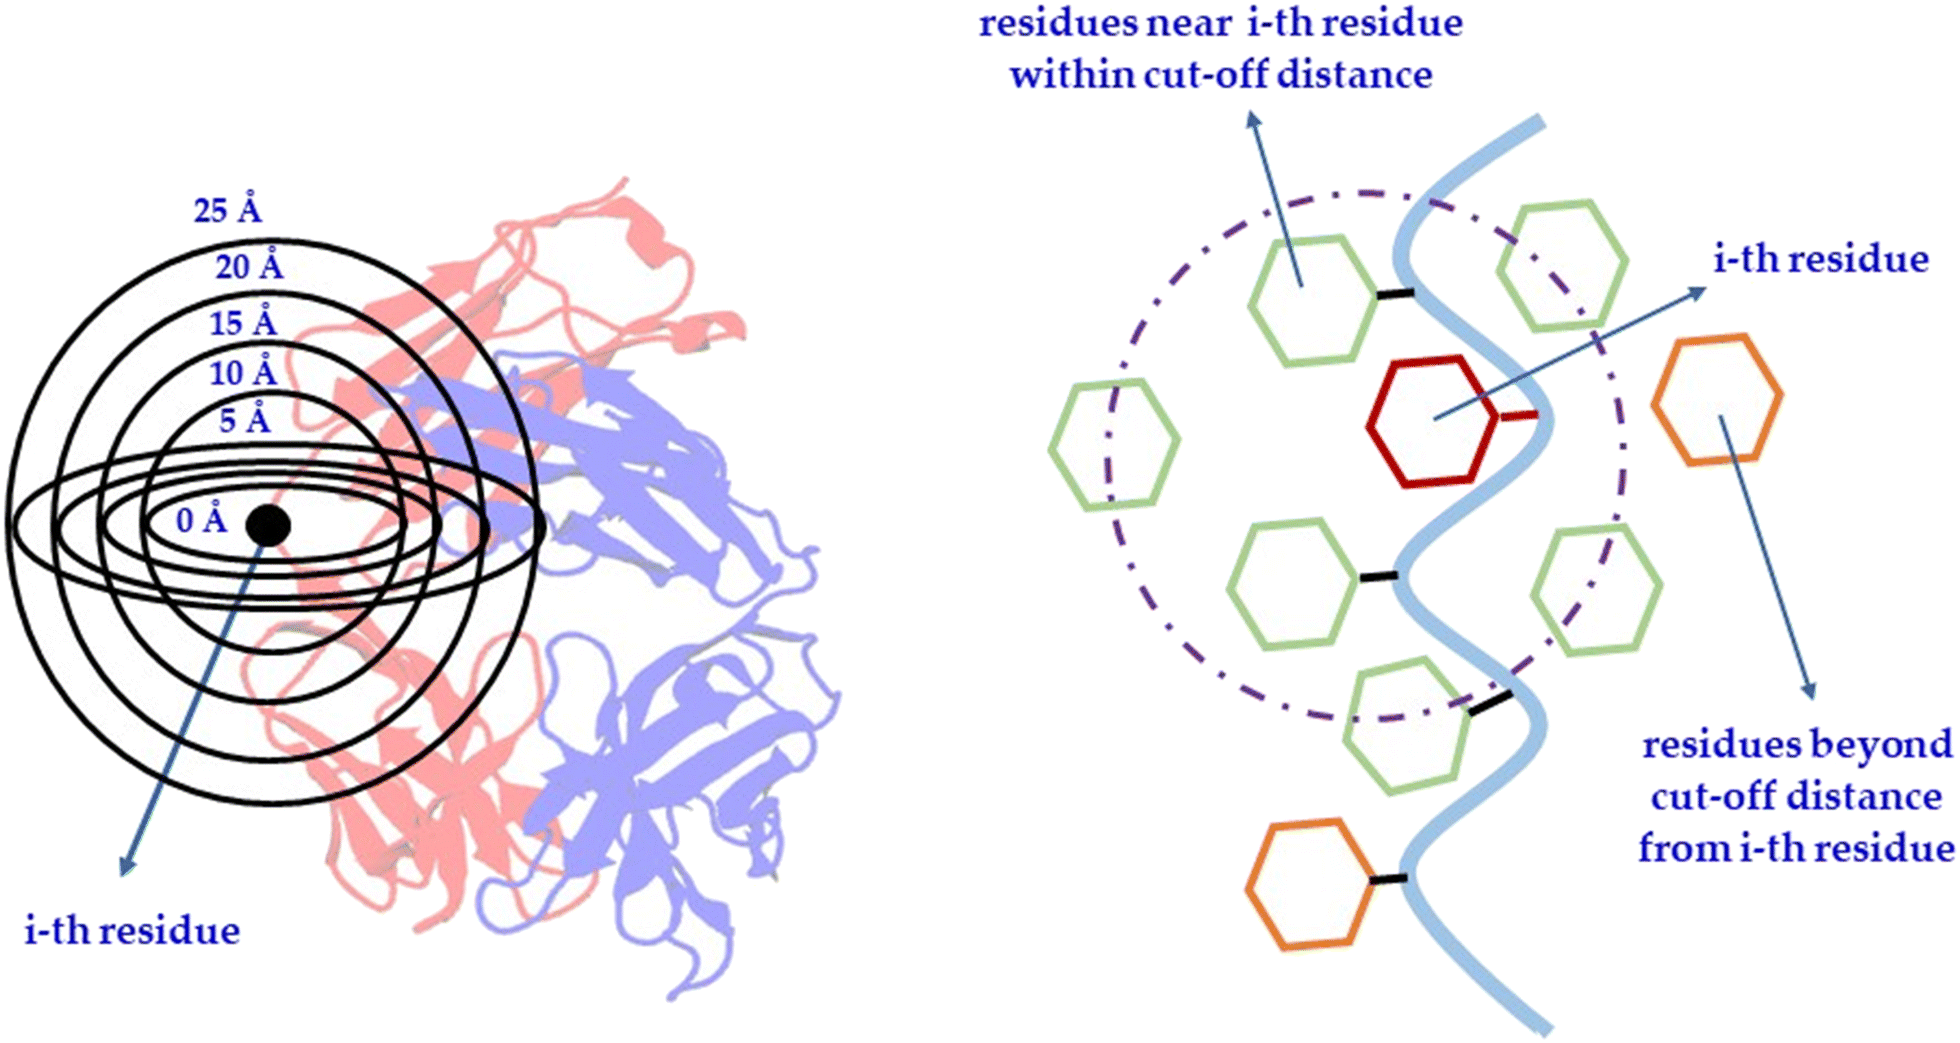 | ||
| Fig. 3 Schematic depiction of an amino acid residue, termed the ‘i-th residue’, and its surrounding environment within designated cutoff distances. Features are computed for the i-th residue in isolation (at 0 Å radius) as well as in the context of neighboring residues encompassed within specified radial cutoffs from 5 to 25 Å. For instance, as illustrated in the second part of the figure, the solvent-accessible surface area (SASA) is calculated for a particular residue, indicated here as the i-th residue, marked in red. Alongside this, another feature is conceptualized by computing the combined SASA of the i-th residue and all nearby residues, marked in green, that fall within a defined cut-off radius. Residues colored in orange are excluded as they lie beyond the specified cutoff distance. | ||
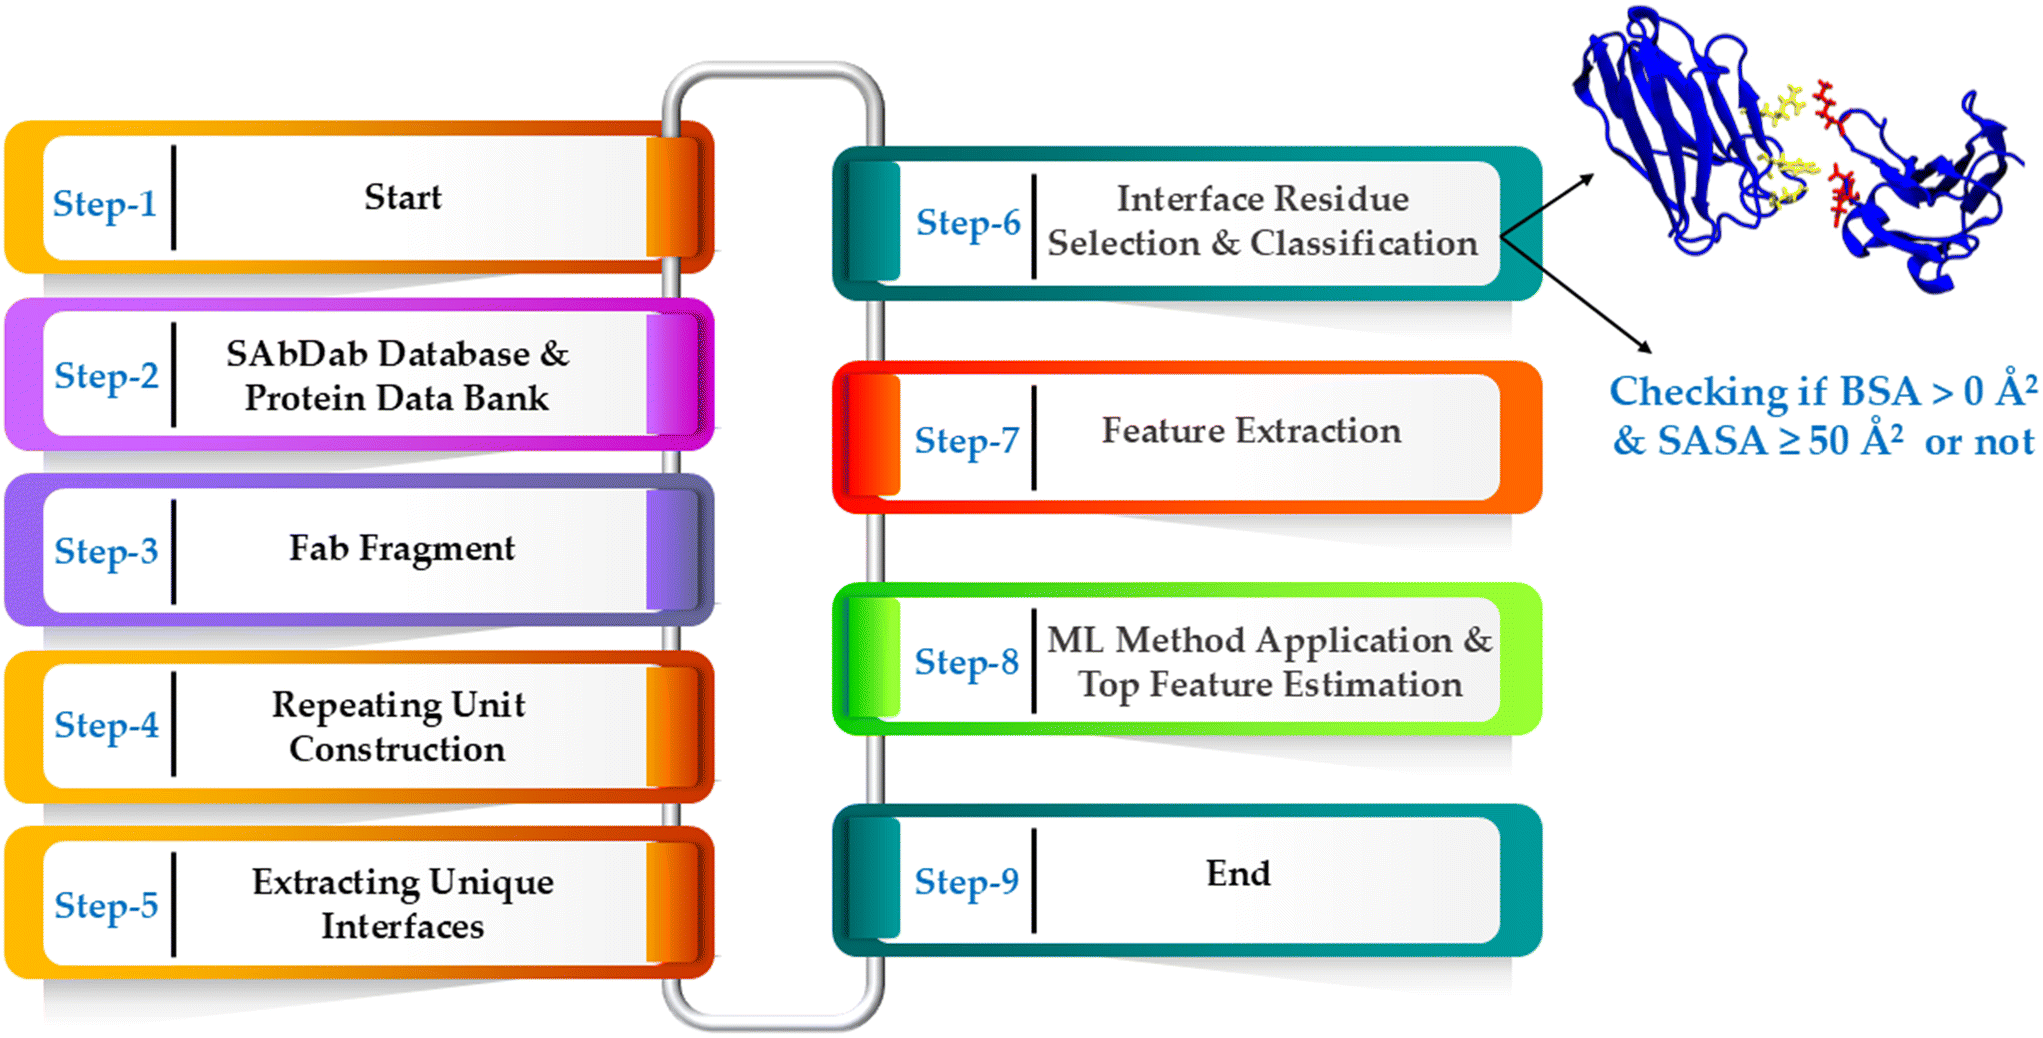 | ||
| Fig. 4 The workflow diagram illustrating the step-by-step process adopted for the analysis of Fab fragments, prediction interface residues and application of ML methodologies. The process starts with the retrieval of Fab structures from SAbDab: the structural antibody database and Protein Data Bank (PDB), followed by building the repeating unit cell, extracting unique interfaces, and identifying residues involved in crystal site interactions. To ensure accurate classification, residues favorably and prevalently involved in crystallization interfaces are identified based on buried surface area (BSA) and solvent-accessible surface area (SASA). BSA must be greater than 0 Å2, while SASA should be at least 50 Å2. Interestingly, residues within 12 Å of the Fab's center of mass, despite higher SASA values, are omitted from the ML model to minimize false positives, given their low probability of being at crystal sites and typical location deep in the Fab core. This classification is crucial for the application of machine learning methods. The diagram then showcases the sequence of operations leading up to the extraction of structural features of Fab, the application of ML methods, and the subsequent estimation of top features. In step-6 (interface residue selection & classification), protein–protein interface residues are represented. The blue color represents protein chains, while the yellow and red colors denote interface residues. | ||
2. Feature engineering
To build an ML model capable of detecting crystal-site residues versus non-crystal-site residues, we considered both the properties of each residue itself and the surrounding physicochemical environment. This was achieved by calculating feature values not only for the residue in question but also for residues within a certain distance from it (Fig. 3). Features included aspects like hydrophobicity, hydrophilicity, charge, solvent accessibility, hydrophobic patches, charge patches, protrusion index, depth index, nature of amino acids, etc.The structure-based features also include spatial aggregation propensity (SAP)43–45 and spatial charge map (SCM)43,45,46 to quantify the surface properties of antibodies. SAP quantifies the surface-exposed hydrophobicity of patches, while SCM assesses the exposed charge of patches. Both these properties play a significant role in facilitating antibody interactions.43–48 This led to a set of 510 features, as summarized in Table 1 and detailed in Tables S2–S10, ESI.†
| Residue hydrophobicity (using BM scale) |
| Protrusion index49 (protrusion from Fab surface) |
| Depth index50 (distance from the closest point on the Fab surface) |
| Fractional exposure ‘or’ relative exposure (ratio of the sidechain SASA of residues to the standard side-chain exposure of the residue in Ala-X-Ala) |
| Net charge (residue net charge) |
| Charge of exposed residues (sum of partial charges of atoms with SASA > 0) |
| SAP43–45,48 (measure of surface-exposed hydrophobicity of atoms) |
| SCM43,45,46,48 (measure of exposed charge patch) |
| SASA and side-chain SASA of various types of amino acids |
| Number of various types of amino acids |
| Various scales related to protein structural properties involved in protein–protein interaction51 |
| SAP_adjacent (pertaining to residues adjacent to hydrophobic patches) |
Other structure-based features were also developed to include neighboring residues that were adjacent to those with higher SAP values, contingent upon certain conditions. Residues exhibiting high SAP values were typically found to be encircled by hydrophobic residues and were predisposed to engage in hydrophobic–hydrophobic interactions. Consequently, it has been demonstrated that when residues with elevated SAP values approach each other within the FAB interface, their immediate neighbors are also likely to be implicated in the interface (Fig. 5(a)). Hence, the identification of residues adjacent to those with high SAP values were crucial. These features were termed as SAP-adjacent (see Tables S8–S10, ESI†). More specifically, the residues that met various SAP cut-off values, along with their adjacent residues, were systematically identified. For example, assuming the i-th residue maintains the SAP value, the neighboring residues of the i-th residue were then selected; specifically, the i + 1 and i − 1 residues, termed as ‘nb’ residues. Additionally, residues within a certain distance from the i-th residue, termed ‘nbh’, were also chosen. Features were then established based on surface exposure for both individual residues and pairs of residues—such as (i and i + 1), (i and i − 1), and (i and inbh). These were defined using the sidechain SASA values, the overall SASA calculated for each residue, and the fractional exposure (i.e., the ratio of each residue's sidechain SASA to the standard sidechain exposure of that residue in a fully exposed Ala-X-Ala tripeptide, as shown in Fig. S1 in the ESI†). If the residues satisfied the specified conditions (see Materials and methods section and Tables S8–S10, ESI†), their corresponding feature values were designated as ‘1’; otherwise, their feature values were set to ‘0’. Consequently, the SAP-adjacent features (see Materials and methods section and Tables S8–S10, ESI†), being binary in nature, could only assume two values, 0 or 1, indicative of the absence or presence of a particular attribute, respectively. More specifically, as per the SAP-adjacent feature, 1 represents residues that were highly likely to be present in crystal sites, while 0 indicates those that were not. The summary of steps followed is provided below:
(a) The i-th residue was selected based on its spatial aggregation propensity (SAP),
(b) Neighbors of the i-th residue (both adjacent (nb) and within a specified radius (nbh)) were identified,
(c) Surface exposure conditions were checked for each pair: (i and i + 1), (i and i − 1), and (i and inbh), along with their individual solvent accessible surface areas,
(d) Feature values for each residue were set to ‘1’ if they met the conditions, and ‘0’ if they did not.
 | ||
| Fig. 5 (a) Schematic depiction of the i-th residue characterized by a high SAP (representing hydrophobic patches) value (≥0.15 ‘or’ 0.20) and its immediate neighboring residues, (i + 1)-th, (i − 1)-th and inbh. The term inbh denotes residues surrounding the i-th residue within radial distances of 5, 7, or 10 Å depending on the residue type. Consequently, a cluster is crafted around the i-th residue, epitomizing a hydrophobic patch, seamlessly enveloped by its adjacent residues: (i + 1), (i − 1), and inbh. It is important to note that the residues with elevated SAP values are commonly surrounded by hydrophobic residues, suggesting a tendency to participate in hydrophobic–hydrophobic interactions in Fab interfaces. Thus, it is evident that when such residues with high SAP values converge within the Fab interface, the neighboring residues are also inclined to be involved in the interface, as depicted in the bottom part of the figure. Here, for instance, the interactions between any two residues with higher SAP values (colored red) are referred to as i-th to ‘i-th residue’ interactions. The neighboring (i + 1)/(i − 1) and inbh residues are represented in blue and black, respectively, in the protein chain. Thus, during these ‘i-th residue’ to ‘i-th residue’ interactions, the neighboring residues of the protein chain also come closer to each other in the interface to interact among themselves, (b) the “QGTTS” loop of L (light)-chain, colored in blue, possesses hydrophobic patches characterized by high SAP value (white) exceeding 0.20. Additionally, it is encompassed by surface exposed polar (green) and charged (yellow) residues. | ||
In the engineering of SAP-adjacent features, the combinations of diverse conditions (see Materials and methods section and Tables S8–S10, ESI†) relating to sidechain SASA, fractional exposure, and overall SASA were employed to produce same kind of feature but with different binary values for each residue. Furthermore, the amino acid types of the neighbouring ‘inbh’ residues at different distances from the i-th residue were also varied to assess the impact of specific amino acid characteristics in proximity to residues with elevated SAP values (see Materials and methods section and Tables S8–S10, ESI†).
3. Performance of ML models and feature importance
Different machine learning (ML) models were used for classification, random forest (RF), extreme gradient boosting (XGBoost), k-nearest neighbors (KNN), multi-layer perceptron (MLP), and support vector machine (SVM). Balanced accuracy, accuracy, and area under the precision-recall curve (AUPRC) were employed as evaluation metrics. AUPRC measures the trade-off between precision (accuracy of positive predictions) and recall (ability of the model to find all relevant positive instances) across different threshold settings. Precision is the ratio between true positive predictions and the total predicted positives, while recall is the ratio between true positive predictions and the total actual positives. AUPRC is particularly beneficial for imbalanced datasets, thus thoroughly evaluating the model's capacity to address class imbalance. It remains sensitive to class imbalance by ensuring the model's ability to identify and evaluate positive instances. For this reason, AUPRC is a meaningful metric for comparing models, particularly in applications where accurately identifying the positive class is crucial.43,45 All the tested ML models (RF, XGBoost, KNN, MLP, and SVM) demonstrated significant improvements compared to the baseline metrics of balanced accuracy (0.50), accuracy (0.76), and AUPRC (0.24) values (Table 2), which highlights their effectiveness in identifying crystal site residues. The baseline AUPRC was equal to the number of positive examples P over the total number of training data N [i.e., the proportion of positive examples in data (P/N)]. The XGBoost model surpassed all the other ones with an AUPRC of 0.77 (Table 2). This more than 3-fold increase in AUPRC showcased the exceptional ability of XGBoost to handle the complexities of our data.| Model | Accuracy (balanced accuracy) | AUPRC |
|---|---|---|
| RF | 0.84 (0.80) | 0.72 |
| XGBoost | 0.86 (0.84) | 0.77 |
| SVM | 0.85 (0.80) | 0.72 |
| KNN | 0.83 (0.76) | 0.69 |
| MLP | 0.84 (0.79) | 0.70 |
| Baseline | 0.76 (0.50) | 0.24 |
A built-in “Gini” importance was applied to the random forest (RF) model as feature importance52 to interpret the models better and identify the top-ranked features (Table 3). This methodology probed Fab crystallization patterns based on the top-most features and led to several notable observations:
• (a) The surface-exposed residues were identified as particularly important. The residues exposed on the surface i.e., mainly those adjacent to hydrophobic residues and possessing a high SAP, were frequently observed at crystal sites.
• (b) The surface-exposed residues situated next to those with a high SAP value also played an important role in the formation of crystalline structures. Moreover, including the properties of the surrounding surface-exposed residues, whether polar, charged, or both, to those with a high SAP, were deemed essential for the integrity of the crystal sites.
• (c) Some residues, including those with crystal-site properties, were still excluded due to the growth of the crystal-lattice with specific symmetry and arrangements.
| RF | |
|---|---|
| Feature names | Importance |
| SASA_all_0 Å | 0.033 |
| SAP-adjacent-SC_0.15_10–10_10–10_10–10_7_polar-charged | 0.025 |
| SAP-adjacent-FE_0.15_5–5%_5–5%_5–30%_5_any-type | 0.017 |
| SAP-adjacent-FE_0.15_5–5%_5–5%_5–5%_7_polar-charged | 0.016 |
| SAP-adjacent-SC_0.20_10–10_10–10_10–10_7_polar-charged | 0.015 |
| SAP-adjacent-FE_0.15_5–5%_5–5%_5–10%_5-hydrophobic-charged-polar | 0.014 |
| XGBoost | |
|---|---|
| Feature names | Importance |
| SAP-adjacent-FE_0.15_5–5%_5–5%_5–5%_7_polar-charged | 0.479 |
| SASA_all_0 Å | 0.077 |
| SASA_gly_0 Å | 0.012 |
| SASA_hydrophilic_20 Å | 0.006 |
| SAP-adjacent-SC_0.15_10–10_10–10_10–10_7_polar-charged | 0.004 |
| Fractional exposure | 0.003 |
“Gain” importance of features (Table 3) was also calculated for the XGBoost model.53 In addition to the conclusions similar to those drawn from the RF model, the XGBoost models' feature ranking analysis also emphasized the importance of surface-exposed glycine residues at the crystal sites as one of the top-most features. Glycine, being the smallest amino acid, is commonly present in the flexible regions of proteins, particularly within the loop regions, as indicated by a previous study.54 It was also discovered that the partially exposed glycine residues on the protein surface in loop regions promoted the formation of crystal-packing contacts.55 Thus, the underscored significance of glycine might suggest that these flexible regions were actively involved in the nucleation process.
In the study reported by Hasegawa et al.,56 the essential role of a specific cluster in influencing the crystallization propensity of certain structures was proposed. This cluster, distinguished by five externally exposed negatively charged residues situated on the complementarity determining region (CDR), was identified as being crucial in steering the self-assembly processes, resulting in augmented crystallization tendencies. Their findings were suggestive of the idea that the juxtaposition of a distinct negative electrostatic patch with neighbouring exposed hydrophobic residues within the fragment variable (Fv) domain might have been recognized as a distinguishing feature for identifying IgG1 isotopes with a heightened probability of crystallization. Similarly, Smejkal et al.,57 proposed that hydrophobic patches, when surrounded by charged residues, might have been instrumental for the crystallization propensities of the Fabs. Furthermore, it was posited by Jean-Philippe Julien et al.58 that the role of surface-exposed hydrophobic patches was not merely peripheral but central to the antibody crystallization mechanism. Electrostatic interactions also played an important role. Additionally, hydrophobic patches on an antibody's surface were frequently cited as significant contributors to the propensity for Fab–Fab interactions.59–62 Other studies also indicated the importance of hydrophobicity in crystallization.57,63–67 Hydrophobic interactions were recognized to effect aqueous assemblies, resulting in protein interactions.68–70 A contemporary study concluded that the most hydrophobic protein patches comprised a notable fraction of polar/charged atoms.68 Protein hot-spots were identified in several previous studies as regions marked by a combination of hydrophobic and polar residues.71–73
Our findings were consistent with the conclusions of R. Lieu et al.74 which showed that the replacement of the human kappa constant domain FG loop with a truncated rabbit loop markedly enhanced the crystallization propensity of Fab: 6WGJ. This loop was found to facilitate the crystallization process through its β-sheet structured interactions.74 In line with these observations, our molecular modelling analysis indicated that the loop “QGTTS” exhibited hydrophobic patches with elevated SAP values (Fig. 5(b)). These patches were enveloped by surface exposed polar and charged residues (Fig. 5(b)), a pattern consistent with our model's feature significance results and other studies.56–76 Thus, our model, trained on the dataset, learns and captures the key features of crystallization at the Fab interface.
Additional feature importance metrics were further examined (Table S11, ESI†) for the XGBoost model, such as “cover”53 and “total gain”,53 to robustly validate the conclusions. Despite slight variations observed across different metrics the main conclusions remained consistent. Notably, the top features identified by these techniques were similar to those of “gain” feature importances (Tables 3 and S11, ESI†). Additionally, SHAP77 feature importance were calculated for both XGBoost and RF models, reinforcing our initial findings with consistent results (Fig. S2, ESI†). In summary, all types of feature importance analyses yielded similar and, consistent conclusions for both the XGBoost and RF models, enhancing the robustness of the conclusions drawn from these models.
It is important to emphasize that the performance of machine learning models is inherently dependent on the hyperparameters chosen during the training and testing phases. These hyperparameters of each model play a critical role in shaping the model's ability to generalize and accurately predict outcomes. In the present study, hyperparameter tuning was conducted for all the tested ML models using “GridSearchCV”52 with details provided in Table S12 of the ESI.† The dataset was divided into two segments by stratified splitting to preserve the class distribution: 90% for hyperparameter tuning and 10% for validation. The 90% hyperparameter tuning portion underwent a stratified 10-fold cross-validation, using the AUPRC score as the evaluation metric to determine the optimal hyperparameters. As we conducted hyperparameter tuning exclusively on the 90% data, carefully ensuring that the validation set remained completely unseen during this process, thus preventing any data leakage. These best-performing parameters were then applied to the previously unseen 10% validation set to assess the model's performance. The AUPRC scores of the optimal model using the cross-validation closely matched those of the validation set (Table 4), demonstrating consistent performance and reducing the risk of overfitting, underscoring the reliability of our conclusions.
| Method | Cross-validation set | Validation set |
|---|---|---|
| XGBoost | 0.76 | 0.77 |
| RF | 0.72 | 0.70 |
| SVM | 0.71 | 0.74 |
| KNN | 0.69 | 0.66 |
| MLP | 0.70 | 0.73 |
Henceforth, the validated best-hyperparameters as described in the “Materials and methods” section were utilized to freshly retrain the model from scratch on the entire dataset, employing a 10-fold stratified cross-validation repeated 10 times on the full dataset to ensure the model's robustness and generalizability. The comprehensive performance metrics for various models obtained through this methodology are detailed in Table 2. This approach confirms good utilization of the dataset, thereby enhancing the overall performance and reliability of the model, especially given the imbalanced nature of the data.
4. Feature reduction and model performance
The ranking of “gain” feature importance of the XGBoost model was calculated for the complete set of 510 features, and only the top 6 ranked features are presented in Table 3 to explain the physical insights related to Fab crystallization based on these most important features. However, to reduce model complexity and improve interpretability, subsets of the most important features were selected based on their “gain” importance rankings. The top 1, 2, 4, 6, 10, 25, 50, 75, and 100 features were extracted incrementally, and the model's performance was assessed for each subset using the area under the precision-recall curve (AUPRC). It is important to note that the XGBoost model was chosen because it demonstrated the highest performance in predicting crystallization sites.The AUPRC values were analyzed for each subset, and it was observed that the model's performance steadily improved as more features were included. Notably, when the top 75 features (i.e., approximately the 15% of complete features) were utilized, the AUPRC reached a value near 0.77, which closely approximated the performance of the full 510-feature model (AUPRC = 0.77, Table 2). This result indicated that features beyond the top 75 contributed minimally to the model's predictive power. The top 75 features are provided in Table S13 of the ESI.†
The analysis demonstrated that a substantial reduction in the feature set could be achieved without a significant loss in performance. Using only the top 75 features (Table S13 in the ESI†) provided several advantages, including reduced model complexity, improved computational efficiency, and increased interpretability. Moreover, by limiting the feature set, the risk of overfitting to noise or irrelevant patterns was minimized. The relationship between the number of top-ranked features and the corresponding AUPRC values is depicted in Fig. 6. Upon examining the top 75 features (Table S13 in the ESI† including the top six features detailed in Table 3), we observed that SAP-adjacent features consistently appeared within this subset. Fractional exposure of amino acids made a significant contribution to the model. Additionally, the solvent-accessible surface area (SASA) of amino acids—including both backbone and side chain components—played a crucial role. Specifically, the SASA of glycine, hydrophobic, non-polar-sulfur-containing, aliphatic, hydrophilic, aromatic, polar uncharged with amide, uncharged polar with hydroxyl group, small, long, and negative amino acids were important in building the classification model (Table S13 in the ESI†). Furthermore, the number of specific amino acids was also a significant factor. Counts of long, proline, hydrophilic, polar, very small, negative, non-polar-sulfur-containing, glycine, aliphatic, aromatic, small, and positive amino acids were influential features. Additionally, the protrusion index and depth index played important roles, along with exposed charge, hydrophobic patches and charged patches, which were crucial to the model's performance (Table S13 in the ESI†). Overall, these findings highlight that both the local structural environment and the specific properties of amino acids—including their spatial arrangement, exposure, and type—are key determinants in the model's predictive ability.
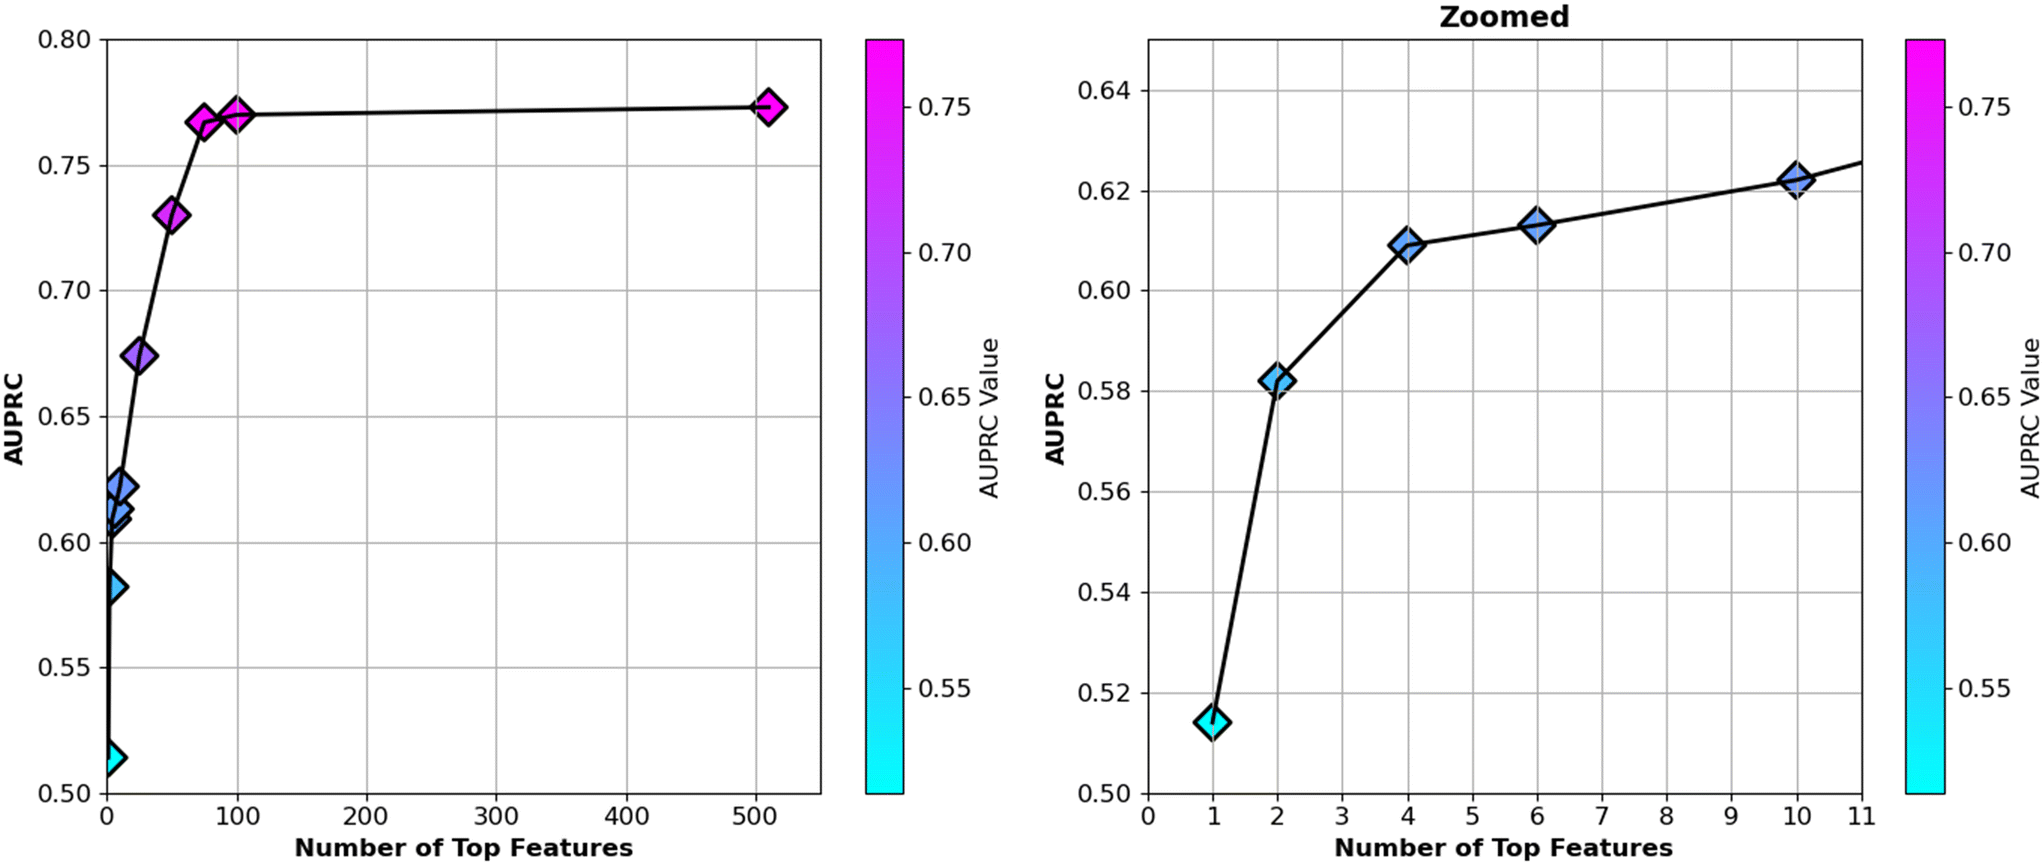 | ||
| Fig. 6 The left panel shows the AUPRC values for models trained with varying numbers of top features ranked by “gain” importance, ranging from 1 to complete 510 features. As the number of features increases, the AUPRC improves, reaching a plateau near 75 features, after which additional features contribute minimally to model performance. The right panel zooms in on the range of 1 to 10 features, illustrating the sharp increase in AUPRC between the top 1 to 6 features, highlighting the significance of early feature inclusion. The colour bars on each panel reflect the corresponding AUPRC values for each model. In all cases, the repeated stratified K-fold cross-validation was employed, dividing the data into 10 folds and repeating the process 10 times. | ||
3 Summary and conclusions
In this work, a large set of collective features was developed, which included hydrophobicity, hydrophilicity, charge, solvent accessibility, hydrophobic and charged patches, etc. Machine learning was used to identify the most relevant physicochemical properties that impact the crystallization of Fab regions and can be computed for the energy-minimized Fab structures. A novel two-step data-driven model was constructed to identify crystal site residues. In the first step, each Fab residue was categorized either as a crystal-site or a non-crystal-site residue based on its surface accessibility by using experimentally available Fabs. This classification was achieved by constructing repeating unit cells using in silico modelling to identify the crystal interfaces and separating interface residues from non-interface residues. In the next step, machine learning algorithms were used to analyse classified Fab residues and, consequently, to identify the physicochemical properties that differentiate crystal-site residues from non-crystal-site residues during crystal lattice formation. Ultimately, the most relevant factors in Fab crystallization were determined based on these properties. We applied machine learning to a substantial dataset and found that the XGBoost algorithm achieved an AUPRC more than three times higher than the baseline. We retained similar performance by reducing the feature set to 15% of the original size, demonstrating the model's efficiency. Analysis of the top-ranked features revealed that surface-exposed hydrophobic residues with higher SAP scores—often adjacent to polar, charged, or both residues and captured through binary SAP-adjacent features—are the most critical factors for predicting crystallization sites. These features collectively represent essential structural attributes like hydrophobicity, accessible surface area, charge, and polarity. Additional influential factors included solvent-accessible surface area (SASA) metrics, amino acid counts, and other structural indices such as the protrusion index, depth indices, hydrophobic patches, and charged patches. Overall, our findings show that the model's predictive power is strongly shaped by both the surrounding structural environment and the distinct characteristics of amino acids, specifically their spatial positioning, surface exposure, and chemical nature. Thus, the present ML model can potentially be extended to predict crystallization behaviours in larger proteins, such as full-length monoclonal antibodies. Moreover, this framework holds promise for further refinement through alternative classification strategies, fine-tuned feature sets, model simplification, and the incorporation of additional data points, enhancing its applicability to broader macromolecular crystallization studies. By complementing traditional experimental methods, it can accelerate the crystallization process for protein engineering efforts. Crystallization propensity in macromolecules can also be modulated via sequence modifications at crystal or non-crystal sites, and such modifications based on crystallization site detection may also impact antibody aggregation and viscosity. The current ML model suggests that the physicochemical properties influencing Fab crystallization, such as solvent accessibility, SAP, charged residues, hydrophobicity, charge patches, also play a critical role in antibody aggregation45 and viscosity.43,45 Since these properties collectively regulate protein–protein interactions, our model may serve as a complementary framework for studying these interconnected phenomena. Establishing these interdependencies necessitates a well-structured experimental approach, incorporating systematic mutational analyses, biophysical characterization, and high-throughput screening to validate predictive models and derive definitive correlations.4 Materials and methods
1. Antibody structure modelling
A dataset comprising 40 Fab structures (previously crystallized and deposited in the Protein Data Bank (PDB)40) was used. The structural antibody database (SAbDab)41 was used to identify relevant Fab entries in the PDB. Fabs listed as monomers, excluding those in complexes like dimers, trimers, tetramers, or antigens were specifically chosen. This ensured that no crystallization sites were overlooked due to complex formation. The missing residues within each Fab structure were modelled or filled using a modelling approach implemented through the MODELLER software.78 Subsequent to the modelling phase, we generated the coordinates of hydrogen atoms and disulfide bridges for each structure. This was performed using the PSFGEN plugin of the visual molecular dynamics (VMD)79 tool. The partial charges on each atom were calculated employing the CHARMM36m80,81 force field. The protonation states of the histidine amino acids were calculated using the PROPKA3 tool82 on the PDB2PQR83 server. The resulting Fab structures were then energy minimized, ensuring no unrealistic overlaps or clashes between atoms in protein structures using NAMD.842. Classification of fab residues
After constructing the Fab minimized structure, the repeating unit cell for each fragment was generated using unit cell parameters and crystal symmetry operations. This process was guided by detailed unit cell parameters available in the crystallographic information files (CIF files) and was executed using the PDBePISA online software.42 Unique interfaces were then identified by isolating interfacial residues present in crystal interfaces. These residues were categorized based on their solvent accessibility characteristics: residues with a buried surface area (BSA) greater than 0 Å2 and a solvent-accessible surface area (SASA) of at least 50 Å2 were classified as crystal-site amino acids (class 1). In contrast, residues not meeting these criteria were designated non-crystal-site amino acids (class 0). We analysed the SASA values of fully exposed residues within alanine-X-alanine (ALA-X-ALA) tri-peptide configurations to validate the selected SASA cut-off. We found that a SASA threshold of 50 Å2 was suitable, as it allowed all amino acids, including the smallest one, glycine (GLY), to partake in protein–protein interfaces. The BSA values, representing the solvent-accessible surface area buried upon interface formation, were sourced from PDBePISA.42 In contrast, SASA values were computed utilizing a custom tcl script via the VMD79 interface.3. Machine learning methods
Five machine learning classification methods were employed: support vector machine (SVM), random forest (RF), K-nearest neighbours (KNN), multilayer perceptron (MLP), and extreme gradient boosting (XGBoost).52,53,85,86 The optimized hyperparameters for these methods were as follows:(a) RF was configured with n_estimators = 300, min_samples_split = 5, class_weight = {0:1, 1:1}, max_depth = none, criterion = ‘entropy’,
(b) XGBoost was tuned eval_metric = ‘logloss’, colsample_bytree = 0.8, learning_rate = 0.1, max_depth = 10, n_estimators = 500, subsample = 1, scale_pos_weight = (number of neg)/2 × (number of pos), reg_alpha = 0, reg_lambda = 10, gamma = 0.1,
(c) SVM was implemented using an ‘rbf’ kernel with parameters C = 40.0 and gamma = 0.001, class_weight = none,
(d) KNN was implemented using algorithm = ‘auto’, metric = ‘manhattan’, n_neighbors = 41, p = 1, weights = ‘distance’,
(e) MLP was implemented using max_iter = 5000, activation = ‘relu’, alpha = 0.01, early_stopping = false, hidden_layer_sizes = (200), learning_rate_init = 0.001, solver = ‘adam’.
Given the significant class imbalance in the dataset, the repeated stratified K-fold cross-validation was employed, dividing the data into 10 folds and repeating the process 10 times to ensure robustness in our model evaluations. As evaluation metric, the average AUPRC (area under the precision-recall curve), average balanced accuracy, and average accuracy values were employed, which were averaged across all folds and repetitions. The AUPRC is especially advantageous for imbalanced datasets, providing a comprehensive assessment of the model's ability to handle class imbalance. In our study, we aim to identify the key features that predict crystal site residues, distinguishing them from non-crystal site residues. Therefore, AUPRC is an essential metric for our research. A higher AUPRC value signifies superior performance, particularly in imbalanced datasets where traditional metrics like accuracy may be misleading. AUPRC is notably valuable for the positive class because it emphasizes precision and recall, metrics that are directly pertinent to positive predictions. It remains sensitive to class imbalance, ensuring that the model's capability to correctly identify positive instances is accurately assessed. This makes AUPRC an important metric for comparing models, especially in scenarios where accurately identifying the positive class is critical.43,45 The baseline evaluation metric AUPRC was 0.24, while the model demonstrated a baseline accuracy and balanced accuracy of 0.76 and 0.50, respectively. Prior to training the machine learning models, features were rescaled and normalized to have a mean of 0 and a standard deviation of 1.
To search through the predefined hyperparameter space systematically and identify the most optimal set for all five ML methods, the “GridSearchCV” method was utilized.52 The evaluation metric for best hyperparameter employed here was the AUPRC score, indicating the relevancy of model. During this grid search, 10% of the whole data was reserved for the validation set (using stratified splitting). The remaining 90% of the whole data was subjected to stratified 10-fold cross-validation for hyperparameter tuning. In this cross-validation process, the training data was divided into ten parts or folds. In each iteration, nine folds were used as training data, while the remaining fold was used for testing. This process ensured that each fold served as the test set at least once. The “stratified” approach was employed to ensure that each fold retained the same class proportion observed in the original training dataset, an essential consideration for imbalanced datasets. Once this iterative process was concluded, the hyperparameter combination that produced the highest AUPRC across all iterations was identified as the best. The model, fitted with these optimal hyperparameters, was subsequently tested on the 10% validation set, which had been set aside and not involved in the hyperparameter tunning using cross-validation to assess the model's performance. In this phase, the efficacy of the model was evaluated on previously unseen validation data. It was observed that the AUPRC value for the best hyperparameter set of a particular method was notably close to the AUPRC value of the validation set, signalling consistent performance between the training, testing, and validation stages, and the minimization of the potential risk of overfitting. After identifying the best hyperparameters, the model was retrained freshly from scratch on the entire dataset using the stratified 10-fold cross-validation technique with 10-time repetitions to ensure its robustness, generalizability, and to validate our conclusions. This approach maximizes dataset utilization, considering the imbalance nature, thereby improving the overall performance and reliability of the model.
To determine the importance of each feature, we used several metrics for our models. For the RF model, we used its built-in feature importance metric. For the XGBoost model, we evaluated feature importance using metrics such as gain, cover, and total gain. The precision of the results was ensured by avoiding features with high cardinality (i.e., those with a large number of unique values) that might have yielded biased outcomes in gain, cover, or total gain-based feature importance calculations. Since such features were absent from our dataset, thus allowing to avoid any potential bias in the results. Furthermore, the SHAP77 (SHapley Additive exPlanations) feature importance was calculated from the test data for both models to validate our model. Note that feature importance was not evaluated for SVM (with “rbf” kernel), because it does not readily offer such interpretable measures. Additionally, feature importance was not evaluated for the KNN and MLP models due to its inferior performance compared to the other models. Model training and analysis were conducted using Scikit-learn.52
4. Antibody surface analysis (calculation of SAP and SCM)
The spatial aggregation propensity (SAP), which quantifies the degree of surface-exposed hydrophobicity, along with the spatial charge map (SCM), that calculates the charge distribution in consideration of surface exposure. Fundamental equations for the calculation of SAP and SCM can be found elsewhere, where SAP and SCM values were calculated for each atom, i, for each residue.43–48 The features used in the present study for spatial aggregation propensity and spatial charge map were determined using the following equations:

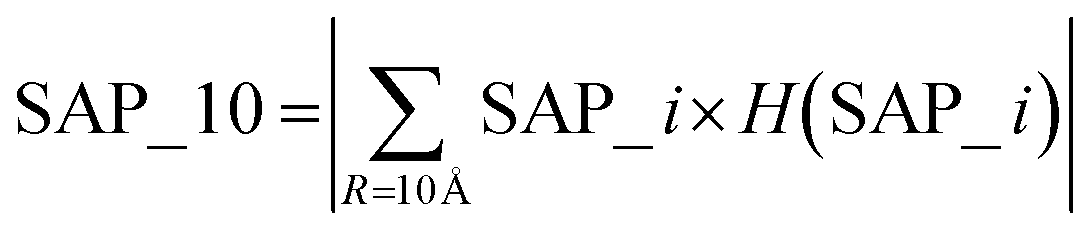


The parameter ‘R’, representing the distance cutoff, is defined in the fundamental equations used for calculating SAP and SCM. An elaborate definition and explanation can be found in these foundational equations.43–48
5. SAP-adjacent feature analysis
If the i-th residue retains a specific SAP value, then its immediate neighbouring residues—the i + 1 and i − 1, referred to as ‘inb’ residues—were systematically selected. Moreover, residues located within a predefined proximity to the i-th residue, known as ‘inbh’, were also identified. A set of conditional terms, predicated on the degree of surface exposure as indicated by the sidechain SASA values and fractional exposure (ratio of the residue's sidechain SASA to the standard sidechain exposure of the residue in Ala-X-Ala), were applied to each pair: (i and i + 1), (i and i − 1), and each (i and inbh). The overall solvent accessible surface area of individual residues was also examined. Feature values were set to ‘1’ for residues satisfying the given conditions, and to ‘0’ for those that did not. The details of steps are provided below:1. Residue selection:

2. Initialization of variable i: i = residueselected.
3. Setting variables inb: inb = {i + 1, i − 1}.
4. Setting variables inbh: inbh = {residue|distance (i, residue ≤ d)}.
5. Checking conditions for (i and i + 1), (i and i − 1) and each (i and inbh) pairs:
(a) Conditions for (i and i + 1) pair: SC SASA of i ≥ cut-off2 and SC SASA of i + 1 ≥ cut-off2.
(b) Conditions for (i and i − 1) pair: SC SASA of i ≥ cut-off2 and SC SASA of i − 1 ≥ cut-off2.
(c) Conditions for each (i and inbh) pair: SC SASA of i ≥ cut-off2 and SC SASA of inbh ≥ cut-off3.
6. Collection of pairs that met criteria set in step 5.
7. Check SASA (≥50 Å2) for each residues collected in step 6.
8. Set feature value (FV):

Steps 1 to 8 were sequentially executed, where “FV” represents the “feature value” of the respective residues. Here surface exposure of residues is calculated based on SC SASA (which represents sidechain solvent accessible surface area). Cut-off1 was varied from 0.15 to 0.20. The distance “d” was varied from 5 to 10 Å, cut-off2 was varied from 5 to 10 Å2 and cut-off3 was varied from 10 to 75 Å2 to generate different binary value SAP-adjacent (specifically termed SAP-adjacent-SC) features for each residue of FAB. Additionally, the types of amino acids constituting the ‘inbh’ neighbouring residues were altered to evaluate the influence of distinct amino acid properties near residues with high SAP values. The various types of ‘inbh’ (neighbouring) residues are considered as “any type residues”, “hydrophobic-polar-charged”, “polar-charged”, “hydrophobic-charged”, “specific hydrophobic (ILE, LEU, TRP, ALA, VAL, and PRO)-polar-charged”, and “charged”.
Furthermore, the surface exposure of residues was determined by calculating their fractional exposure (FE), defined as the ratio of a residue's solvent accessible surface area (SASA) of side-chain to the standard side-chain exposure of the residue in an Ala-X-Ala tri-peptide. This calculation contributed to the generation of a distinct set of SAP-adjacent (specifically termed SAP-adjacent-FE) binary features. The details of steps are provided below:
1. Residue selection:

2. Initialization of variable i: i = residueselected.
3. Setting variables inb: inb = {i + 1, i − 1}.
4. Setting variables inbh: inbh = {residue|distance (i, residue ≤ d)}.
5. Checking conditions for (i and i + 1), (i and i − 1) and each (i and inbh) pairs:
(a) Conditions for (i and i + 1) pair: FE of i ≥ cut-off2 and FE of i + 1 ≥ cut-off2.
(b) Conditions for (i and i − 1) pair: FE of i ≥ cut-off2 and FE of i − 1 ≥ cut-off2.
(c) Conditions for each (i and inbh) pair: FE of i ≥ cut-off2 and FE of inbh ≥ cut-off3.
6. Collection of pairs that met criteria set in step 5.
7. Check SASA (≥50 Å2) for each residues collected in step 6.
8. Set feature value (FV):
It should be noted that the algorithm steps for SAP-adjacent-FE were executed similarly to those for SAP-adjacent-SC. The cut-off1 was set at 0.15. The distance parameter “d” ranged from 5 to 7 Å, cut-off2 was consistently set at 5%, and cut-off3 varied from 5% to 40%. This approach was employed to generate a similar, yet distinct, set of binary value features for each residue of FAB. Furthermore, the amino acid types of the ‘inbh’ neighbouring residues were varied as before, enabling the assessment of the impact of unique amino acid characteristics in proximity to residues with elevated SAP values.
Moreover, our investigation extended to further refinement in residue selection. In the initial stages, along with parameters such as SAP and side chain (SC) SASA, the overall solvent accessible surface area (SASA) of residues (≥50 Å2) was also considered to generate a specific set of binary features (specifically termed SAP-adjacent-overall). The details of steps are provided as follows:
1. Residue selection:

2. Initialization of variable i: i = residueselected.
3. Setting variables inb: inb = {i + 1, i − 1}.
4. Setting variables inbh: inbh = {residue|distance (i, residue ≤ d)}.
5. Checking conditions for (i and i + 1), (i and i − 1) and each (i and inbh) pairs:
(a) Conditions for (i and i + 1) pair: SC SASA of i and i + 1 ≥ 10 Å2 and SASA of i and i + 1 ≥ 50 Å2.
(b) Conditions for (i and i − 1) pair: SC SASA of i and i − 1 ≥ 10 Å2 and SASA of i and i − 1 ≥ 50 Å2.
(c) Conditions for each (i and inbh) pair: SC SASA of i and inbh ≥ 10 Å2 and SASA of i and inbh ≥ 50 Å2.
6. Collection of pairs that met criteria set in step 5.
7. Set feature value (FV):

The distance parameter “d” was set at 5 Å. Also, the types of amino acids constituting the ‘inbh’ neighbouring residues were diversified, as previously done, to facilitate the evaluation of how distinct amino acid properties affect nearby residues with high spatial aggregation propensity (SAP) values.
6. List of software
The missing residues within each Fab structure were filled by MODELLER.75 NAMD software was used to minimize the initial Fab structures.84 Charges were calculated by charmm36m forcefield.80,81 The features were calculated using Python and a custom TCL script using the VMD interface. The BSA (buried surface area) was taken from the PDBePISA.42 Machine learning was performed by the Scikit-learn library in Python.52,87 Visualization of Fabs was done using UCSF ChimeraX,88 VMD,79 and Pymol.89–91 Figures and snapshots were prepared by Matplotlib, VMD79 and Xmgrace.92Abbreviations
| AUPRC | Area under the precision-recall curve |
| BSA | Buried surface area |
| CDR | Complementarity-determining region |
| CIF | Crystallographic information files |
| EM | Electron microscopy |
| F v | Variable fragment |
| FV | Feature value |
| FE | Fractional exposure |
| FAB/Fab | Fragment antigen biding region |
| IgG1 | Immunoglobulin G1 |
| IgG4 | Immunoglobulin G4 |
| KNN | k-Nearest neighbours |
| mAbs | Monoclonal antibodies |
| MLP | Multi-layer perceptron |
| ML | Machine learning |
| NMR | Nuclear magnetic resonance |
| PDB | Protein Data Bank |
| RF | Random forest |
| SAbDab | Structural antibody database |
| SAP | Spatial aggregation propensity |
| SASA | Solvent-accessible surface area |
| SCM | Spatial charge map |
| SVM | Support vector machine |
| SC SASA | Sidechain solvent-accessible surface area |
| SHAP | SHapley Additive exPlanations |
| VMD | Visual molecular dynamics |
| XGBoost | Extreme gradient boosting |
| XRD | X-ray crystallography |
Data availability
The data supporting this article have been included as part of the ESI.†Conflicts of interest
There are no conflicts to declare.Acknowledgements
We would like to thank FDA for funding this study. The work was funded by FDA under contract number 75F40121C00111.References
- P. Carter, Improving the Efficacy of Antibody-Based Cancer Therapies, Nat. Rev. Cancer, 2001, 1, 118 CrossRef CAS PubMed.
- P. J. Carter, Potent Antibody Therapeutics by Design, Nat. Rev. Immunol., 2006, 6, 343 CrossRef CAS PubMed.
- P. J. Carter and G. A. Lazar, Next Generation Antibody Drugs: Pursuit of the “High-Hanging Fruit”, Nat. Rev. Drug Discovery, 2018, 17, 197 CrossRef CAS.
- G. Köhler and C. Milstein, Continuous Cultures of Fused Cells Secreting Antibody of Predefined Specificity, Nature, 1975, 256, 495 CrossRef.
- A. Mullard, FDA Approves First CAR T Therapy, Nat. Rev. Drug Discovery, 2017, 16, 669 Search PubMed.
- A. F. Labrijn, M. L. Janmaat, J. M. Reichert and P. W. H. I. Parren, Bispecific Antibodies: A Mechanistic Review of the Pipeline, Nat. Rev. Drug Discovery, 2019, 18, 585 CrossRef CAS.
- J. M. Lambert and C. Q. Morris, Antibody–Drug Conjugates (ADCs) for Personalized Treatment of Solid Tumors: A Review, Adv. Ther., 2017, 34, 1015 CrossRef CAS PubMed.
- H. Kaplon, S. Crescioli, A. Chenoweth, J. Visweswaraiah and J. M. Reichert, Antibodies to Watch in 2023, mAbs, 2023, 15, 2153410 CrossRef PubMed.
- J. Jay, B. Bray, Y. Qi, E. Igbinigie, H. Wu, J. Li and G. Ren, IgG Antibody 3D Structures and Dynamics, Antibodies, 2018, 7, 18 CrossRef PubMed.
- A. McPherson and J. A. Gavira, Introduction to Protein Crystallization, Acta Crystallogr., Sect. F: Struct. Biol. Commun., 2014, 70, 2–20 CrossRef CAS PubMed.
- D. Zahavi and L. Weiner, Monoclonal Antibodies in Cancer Therapy, Antibodies, 2020, 9, 34 CrossRef CAS PubMed.
- M. L. Chiu, D. R. Goulet, A. Teplyakov and G. L. Gilliland, Antibody Structure and Function: The Basis for Engineering Therapeutics, Antibodies, 2019, 8, 55 CrossRef CAS PubMed.
- W. Chen, X. Li, M. Guo, F. J. Link, S. S. Ramli, J. Ouyang, I. Rosbottom and J. Y. Y. Heng, Biopurification of Monoclonal Antibody (MAb) through Crystallisation, Sep. Purif. Technol., 2021, 263, 118358 CrossRef CAS.
- G. Scapin, X. Yang, W. W. Prosise, M. McCoy, P. Reichert, J. M. Johnston, R. S. Kashi and C. Strickland, Structure of Full-Length Human Anti-PD1 Therapeutic IgG4 Antibody Pembrolizumab, Nat. Struct. Mol. Biol., 2015, 22, 953–958 CrossRef CAS.
- J. Hermann, D. Bischoff, P. Grob, R. Janowski, D. Hekmat, D. Niessing, M. Zacharias and D. Weuster-Botz, Controlling Protein Crystallization by Free Energy Guided Design of Interactions at Crystal Contacts, Crystals, 2021, 11, 588 CrossRef CAS.
- Y. Zang, B. Kammerer, M. Eisenkolb, K. Lohr and H. Kiefer, Towards Protein Crystallization as a Process Step in Downstream Processing of Therapeutic Antibodies: Screening and Optimization at Microbatch Scale, PLoS One, 2011, 6, e25282 CrossRef CAS PubMed.
- M. X. Yang, B. Shenoy, M. Disttler, R. Patel, M. McGrath, S. Pechenov and A. L. Margolin, Crystalline Monoclonal Antibodies for Subcutaneous Delivery, Proc. Natl. Acad. Sci. U. S. A., 2003, 100, 6934–6939 CrossRef CAS PubMed.
- S. Mitragotri, P. A. Burke and R. Langer, Overcoming the Challenges in Administering Biopharmaceuticals: Formulation and Delivery Strategies, Nat. Rev. Drug Discovery, 2014, 13, 655–672 CrossRef CAS.
- E. Mastrobattista, Formulation and Delivery Solutions for the next Generation Biotherapeutics, J. Controlled Release, 2021, 336, 583–597 CrossRef CAS PubMed.
- Q. Chai, J. Shih, C. Weldon, S. Phan and B. E. Jones, Development of a High-Throughput Solubility Screening Assay for Use in Antibody Discovery, mAbs, 2019, 11, 747 CrossRef CAS PubMed.
- W. Wang, S. Singh, D. L. Zeng, K. King and S. Nema, Antibody Structure, Instability, and Formulation, J. Pharm. Sci., 2007, 96, 1 CrossRef CAS PubMed.
- J. J. McManus, P. Charbonneau, E. Zaccarelli and N. Asherie, The Physics of Protein Self-Assembly, Curr. Opin. Colloid Interface Sci., 2016, 22, 73 CrossRef CAS.
- B. Rupp, Origin and Use of Crystallization Phase Diagrams, Acta Crystallogr., Sect. F: Struct. Biol. Commun., 2015, 71, 247 CrossRef CAS PubMed.
- M. I. J. Raybould, W. K. Wong and C. M. Deane, Antibody–Antigen Complex Modelling in the Era of Immunoglobulin Repertoire Sequencing, Mol. Syst. Des. Eng., 2019, 4, 679 RSC.
- S. Pusara, W. Wenzel and M. Kozlowska, Accurate Calculation of Second Osmotic Virial Coefficients of Proteins Using Mixed Poisson–Boltzmann and Extended DLVO Theory, Mol. Syst. Des. Eng., 2023, 8, 1203–1219 RSC.
- L. Griffin and A. Lawson, Antibody Fragments as Tools in Crystallography, Clin. Exp. Immunol., 2011, 165, 285 CrossRef CAS.
- I. M. Overton, G. Padovani, M. A. Girolami and G. J. Barton, ParCrys: A Parzen Window Density Estimation Approach to Protein Crystallization Propensity Prediction, Bioinformatics, 2008, 24, 901–907 CrossRef CAS PubMed.
- A. Elbasir, B. Moovarkumudalvan, K. Kunji, P. R. Kolatkar, R. Mall and H. Bensmail, DeepCrystal: A Deep Learning Framework for Sequence-Based Protein Crystallization Prediction, Bioinformatics, 2018, 35, 2216–2225 CrossRef PubMed.
- L. Kurgan, A. A. Razib, S. Aghakhani, S. Dick, M. Mizianty and S. Jahandideh, CRYSTALP2: Sequence-Based Protein Crystallization Propensity Prediction, BMC Struct. Biol., 2009, 9, 50 CrossRef PubMed.
- P. Charoenkwan, W. Shoombuatong, H.-C. Lee, J. Chaijaruwanich, H.-L. Huang and S.-Y. Ho, SCMCRYS: Predicting Protein Crystallization Using an Ensemble Scoring Card Method with Estimating Propensity Scores of P-Collocated Amino Acid Pairs, PLoS One, 2013, 8, e72368 CrossRef CAS PubMed.
- C. Jin, J. Gao, Z. Shi and H. Zhang, ATTCry: Attention-Based Neural Network Model for Protein Crystallization Prediction, Neurocomputing, 2021, 463, 265–274 CrossRef.
- H. Wang, M. Wang, H. Tan, Y. Li, Z. Zhang and J. Song, PredPPCrys: Accurate Prediction of Sequence Cloning, Protein Production, Purification and Crystallization Propensity from Protein Sequences Using Multi-Step Heterogeneous Feature Fusion and Selection, PLoS One, 2014, 9, e105902 CrossRef PubMed.
- W. Xuan, N. Liu, N. Huang, Y. Li and J. Wang, CLPred: A Sequence-Based Protein Crystallization Predictor Using BLSTM Neural Network, Bioinformatics, 2020, 36(Suppl_2), i709–i717 CrossRef CAS.
- Z. S. Derewenda, Application of protein engineering to enhance crystallizability and improve crystal properties, Acta Crystallogr., Sect. D: Biol. Crystallogr., 2010, 66, 604 CrossRef CAS PubMed.
- S. Maheshwari and M. Brylinski, Predicting Protein Interface Residues Using Easily Accessible On-Line Resources, Briefings Bioinf., 2015, 16, 1025 CrossRef CAS PubMed.
- N. N. Louros, G. Orlando, M. De Vleeschouwer, F. Rousseau and J. Schymkowitz, Structure-Based Machine-Guided Mapping of Amyloid Sequence Space Reveals Uncharted Sequence Clusters with Higher Solubilities, Nat. Commun., 2020, 11, 3314 CrossRef CAS.
- I. Kufareva, L. Budagyan, E. Raush, M. Totrov and R. Abagyan, PIER: Protein Interface Recognition for Structural Proteomics, Proteins: Struct., Funct., Bioinf., 2007, 67, 400 CrossRef CAS PubMed.
- L. S. Swapna, R. M. Bhaskara, J. Sharma and N. Srinivasan, Roles of Residues in the Interface of Transient Protein-Protein Complexes before Complexation, Sci. Rep., 2012, 2, 334 CrossRef PubMed.
- A. Mishra, S. Ranganathan, B. Jayaram and A. Sattar, Role of Solvent Accessibility for Aggregation-Prone Patches in Protein Folding, Sci. Rep., 2018, 8, 12896 CrossRef.
- H. M. Berman, The Protein Data Bank, Nucleic Acids Res., 2000, 28, 235–242 CrossRef CAS.
- J. Dunbar, K. Krawczyk, J. Leem, T. Baker, A. Fuchs, G. Georges, J. Shi and C. M. Deane, SAbDab: The Structural Antibody Database, Nucleic Acids Res., 2013, 42, D1140–D1146 CrossRef PubMed.
- Protein interfaces, surfaces and assemblies' service PISA at the European Bioinformatics Institute. (http://www.ebi.ac.uk/pdbe/prot_int/pistart.html), E. Krissinel and K. Henrick, Inference of Macromolecular Assemblies from Crystalline State, J. Mol. Biol., 2007, 372, 774–797 CrossRef CAS PubMed.
- P.-K. Lai, A. Fernando, T. K. Cloutier, Y. R. Gokarn, J. Zhang, W. Schwenger, R. Chari, C. Calero-Rubio and B. L. Trout, Machine Learning Applied to Determine the Molecular Descriptors Responsible for the Viscosity Behavior of Concentrated Therapeutic Antibodies, Mol. Pharmaceutics, 2021, 18, 1167–1175 CrossRef CAS PubMed.
- N. Chennamsetty, V. Voynov, V. Kayser, B. Helk and B. L. Trout, Design of Therapeutic Proteins with Enhanced Stability, Proc. Natl. Acad. Sci. U. S. A., 2009, 106, 11937–11942 CrossRef CAS PubMed.
- P.-K. Lai, A. Gallegos, N. Mody, H. A. Sathish and B. L. Trout, Machine Learning Prediction of Antibody Aggregation and Viscosity for High Concentration Formulation Development of Protein Therapeutics, mAbs, 2022, 14, 2026208 CrossRef.
- N. J. Agrawal, B. Helk, S. Kumar, N. Mody, H. A. Sathish, H. S. Samra, P. M. Buck, L. Li and B. L. Trout, Computational Tool for the Early Screening of Monoclonal Antibodies for Their Viscosities, mAbs, 2015, 8, 43–48 CrossRef PubMed.
- T. K. Cloutier, C. Sudrik, N. Mody, H. A. Sathish and B. L. Trout, Machine Learning Models of Antibody–Excipient Preferential Interactions for Use in Computational Formulation Design, Mol. Pharmaceutics, 2020, 17, 3589–3599 CrossRef CAS PubMed.
- T. K. Cloutier, C. Sudrik, N. Mody, S. A. Hasige and B. L. Trout, Molecular Computations of Preferential Interactions of Proline, Arginine.HCl, and NaCl with IgG1 Antibodies and Their Impact on Aggregation and Viscosity, mAbs, 2020, 12, 1816312 CrossRef PubMed.
- A. Pintar, O. Carugo and S. Pongor, CX, an Algorithm that Identifies Protruding Atoms in Proteins, Bioinformatics, 2002, 18, 980–984 CrossRef CAS.
- A. Pintar, O. Carugo and S. Pongor, DPX: For the Analysis of the Protein Core, Bioinformatics, 2003, 19, 313–314 CrossRef CAS PubMed.
- F. Soleymani, E. Paquet, H. Viktor, W. Michalowski and D. Spinello, Protein–Protein Interaction Prediction with Deep Learning: A Comprehensive Review, Comput. Struct. Biotechnol. J., 2022, 20, 5316–5341 CrossRef CAS PubMed.
- F. Pedregosa, G. Varoquaux, A. Gramfort, V. Michel, B. Thirion, O. Grisel, M. Blondel, P. Prettenhofer, R. Weiss, V. Dubourg, J. Vanderplas, A. Passos, D. Cournapeau, M. Brucher, M. Perrot and E. Duchesnay, Scikit-learn: Machine Learning in Python, J. Mach. Learn. Res., 2011, 12, 2825–2830 Search PubMed.
- T. Chen and G. Carlos, XGBoost: A Scalable Tree Boosting System, Proceedings of the 22nd ACM SIGKDD International Conference on Knowledge Discovery and Data Mining - KDD '16, 2016, p. 785 Search PubMed.
- B. X. Yan and Y. Q. Sun, Glycine Residues Provide Flexibility for Enzyme Active Sites, J. Biol. Chem., 1997, 272, 3190–3194 CrossRef CAS PubMed.
- W. N. Price II, et al., Understanding the Physical Properties That Control Protein Crystallization by Analysis of Large-Scale Experimental Data, Nat. Biotechnol., 2008, 27, 51 CrossRef.
- H. Hasegawa, J. Wendling, F. He, E. Trilisky, R. Stevenson, H. Franey, F. Kinderman, G. Li, D. Murphy Piedmonte, T. D. Osslund, M. Shen and R. R. Ketchem, In Vivo Crystallization of Human IgG in the Endoplasmic Reticulum of Engineered Chinese Hamster Ovary (CHO) Cells, J. Biol. Chem., 2011, 286, 19917–19931 CrossRef CAS PubMed.
- B. Smejkal, N. J. Agrawal, B. Helk, H. Schulz, M. Giffard, M. Mechelke, F. Ortner, P. Heckmeier, B. L. Trout and D. Hekmat, Fast and Scalable Purification of a Therapeutic Full-Length Antibody Based on Process Crystallization, Biotechnol. Bioeng., 2013, 110, 2452–2461 CrossRef CAS PubMed.
- J. Ereño-Orbea, T. Sicard, H. Cui, J. Carson, P. Hermans and J.-P. Julien, Structural Basis of Enhanced Crystallizability Induced by a Molecular Chaperone for Antibody Antigen-Binding Fragments, J. Mol. Biol., 2018, 430, 322–336 CrossRef PubMed.
- L. Gentiluomo, D. Roessner, W. Streicher, S. Mahapatra, P. Harris and W. Frieß, Characterization of Native Reversible Self-Association of a Monoclonal Antibody Mediated by Fab-Fab Interaction, J. Pharm. Sci., 2020, 109, 443–451 CrossRef CAS PubMed.
- V. Voynov, N. Chennamsetty, V. Kayser, B. Helk and B. L. Trout, Predictive Tools for Stabilization of Therapeutic Proteins, mAbs, 2009, 1, 580–582 CrossRef PubMed.
- K. Sankar, S. R. Krystek, S. M. Carl, T. Day and J. K. X. Maier, AggScore: Prediction of Aggregation-Prone Regions in Proteins Based on the Distribution of Surface Patches, Proteins: Struct., Funct., Bioinf., 2018, 86, 1147–1156 CrossRef CAS.
- T. M. Lauer, N. J. Agrawal, N. Chennamsetty, K. Egodage, B. Helk and B. L. Trout, Developability Index: A Rapid in Silico Tool for the Screening of Antibody Aggregation Propensity, J. Pharm. Sci., 2012, 101, 102–115 CrossRef CAS PubMed.
- J. M. Canaves, R. Page, I. A. Wilson and R. C. Stevens, Protein Biophysical Properties That Correlate with Crystallization Success in Thermotoga Maritima: Maximum Clustering Strategy for Structural Genomics, J. Mol. Biol., 2004, 344, 977–991 CrossRef CAS PubMed.
- C. J. Oldfield, E. L. Ulrich, Y. Cheng, A. K. Dunker and J. L. Markley, Addressing the Intrinsic Disorder Bottleneck in Structural Proteomics, Proteins: Struct., Funct., Bioinf., 2005, 59, 444–453 CrossRef CAS PubMed.
- C.-S. Goh, N. Lan, S. M. Douglas, B. Wu, N. Echols, A. Smith, D. Milburn, G. T. Montelione, H. Zhao and M. Gerstein, Mining the Structural Genomics Pipeline: Identification of Protein Properties That Affect High-Throughput Experimental Analysis, J. Mol. Biol., 2004, 336, 115–130 Search PubMed.
- I. M. Overton and G. J. Barton, A Normalised Scale for Structural Genomics Target Ranking: The OB-Score, FEBS Lett., 2006, 580, 4005–4009 CrossRef CAS.
- J. Kirkwood, D. Hargreaves, S. O'Keefe and J. Wilson, Analysis of Crystallization Data in the Protein Data Bank, Acta Crystallogr., Sect. F: Struct. Biol. Commun., 2015, 71, 1228–1234 CrossRef CAS.
- N. B. Rego, E. Xi and A. J. Patel, Identifying Hydrophobic Protein Patches to Inform Protein Interaction Interfaces, Proc. Natl. Acad. Sci. U. S. A., 2021, 118, e2018234118 CrossRef CAS PubMed.
- M. Bonomi, D. Branduardi, F. L. Gervasio and M. Parrinello, The Unfolded Ensemble and Folding Mechanism of the C-Terminal GB1 β-Hairpin, J. Am. Chem. Soc., 2008, 130, 13938–13944 CrossRef CAS PubMed.
- S. Pérez-Conesa, P. M. Piaggi and M. Parrinello, A Local Fingerprint for Hydrophobicity and Hydrophilicity: From Methane to Peptides, J. Chem. Phys., 2019, 150, 204103 CrossRef PubMed.
- D. Kozakov, D. R. Hall, G.-Y. Chuang, R. Cencic, R. Brenke, L. E. Grove, D. Beglov, J. Pelletier, A. Whitty and S. Vajda, Structural Conservation of Druggable Hot Spots in Protein-Protein Interfaces, Proc. Natl. Acad. Sci. U. S. A., 2011, 108, 13528–13533 CrossRef CAS PubMed.
- S. Dennis, T. Kortvelyesi and S. Vajda, Computational Mapping Identifies the Binding Sites of Organic Solvents on Proteins, Proc. Natl. Acad. Sci. U. S. A., 2002, 99, 4290–4295 CrossRef CAS.
- M. R. Arkin, M. Randal, W. L. DeLano, J. Hyde, T. N. Luong, J. D. Oslob, D. R. Raphael, L. Taylor, J. Wang, R. S. McDowell, J. A. Wells and A. C. Braisted, Binding of Small Molecules to an Adaptive Protein–Protein Interface, Proc. Natl. Acad. Sci. U. S. A., 2003, 100, 1603–1608 CrossRef CAS.
- R. Lieu, S. Antonysamy, Z. Druzina, C. Y. Ho, N.-W. Kang, A. Pustilnik, J. Wang and S. Atwell, Rapid and Robust Antibody Fab Fragment Crystallization Utilizing Edge-To-Edge Beta-Sheet Packing, PLoS One, 2020, 15, e0232311 CrossRef CAS.
- L. Shan, N. Mody, P. Sormani, K. L. Rosenthal, M. M. Damschroder and R. Esfandiary, Developability Assessment of Engineered Monoclonal Antibody Variants with a Complex Self-Association Behavior Using Complementary Analytical and in Silico Tools, Mol. Pharmaceutics, 2018, 15, 5697–5710 CrossRef CAS PubMed.
- C.-K. Chow, B. W. Allan, Q. Chai, S. Atwell and J. Lu, Therapeutic Antibody Engineering to Improve Viscosity and Phase Separation Guided by Crystal Structure, Mol. Pharmaceutics, 2016, 13, 915–923 CrossRef CAS PubMed.
- S. M. Lundberg and S.-I. Lee, A Unified Approach to Interpreting Model Predictions, Proceedings of the 31st International Conference on Neural Information Processing Systems, 2017, pp. 4768–4777, https://proceedings.neurips.cc/paper_files/paper/2017/file/8a20a8621978632d76c43dfd28b67767-Paper.pdf Search PubMed.
- B. Webb and A. Sali, Comparative Protein Structure Modeling Using Modeller, Curr. Protoc. Bioinf., 2016, 54 Search PubMed.
- W. Humphrey, A. Dalke and K. Schulten, VMD: Visual Molecular Dynamics, J. Mol. Graphics, 1996, 14, 33–38 CrossRef CAS PubMed.
- J. B. Klauda, R. M. Venable, J. A. Freites, J. W. O'Connor, D. J. Tobias, C. Mondragon-Ramirez, I. Vorobyov, A. D. MacKerell and R. W. Pastor, Update of the CHARMM All-Atom Additive Force Field for Lipids: Validation on Six Lipid Types, J. Phys. Chem. B, 2010, 114, 7830–7843 CrossRef CAS PubMed.
- J. Huang, S. Rauscher, G. Nawrocki, T. Ran, M. Feig, B. L. de Groot, H. Grubmüller and A. D. MacKerell, CHARMM36m: An Improved Force Field for Folded and Intrinsically Disordered Proteins, Nat. Methods, 2016, 14, 71–73 CrossRef.
- M. H. M. Olsson, C. R. Søndergaard, M. Rostkowski and J. H. Jensen, PROPKA3: Consistent Treatment of Internal and Surface Residues in Empirical PKa Predictions, J. Chem. Theory Comput., 2011, 7, 525–537 CrossRef CAS.
- T. J. Dolinsky, P. Czodrowski, H. Li, J. E. Nielsen, J. H. Jensen, G. Klebe and N. A. Baker, PDB2PQR: Expanding and Upgrading Automated Preparation of Biomolecular Structures for Molecular Simulations, Nucleic Acids Res., 2007, 35, W522–W525 CrossRef , (Web Server).
- J. C. Phillips, R. Braun, W. Wang, J. Gumbart, E. Tajkhorshid, E. Villa, C. Chipot, R. D. Skeel, L. Kalé and K. Schulten, Scalable molecular dynamics with NAMD, J. Comput. Chem., 2005, 26, 1781–1802 CrossRef CAS PubMed.
- C. Xiouras, F. Cameli, G. L. Quilló, M. E. Kavousanakis, D. G. Vlachos and G. D. Stefanidis, Applications of Artificial Intelligence and Machine Learning Algorithms to Crystallization, Chem. Rev., 2022, 122, 13006–13042 CrossRef CAS PubMed.
- R. M. Bhardwaj, A. Johnston, B. F. Johnston and A. J. Florence, A Random Forest Model for Predicting the Crystallisability of Organic Molecules, CrystEngComm, 2015, 17, 4272–4275 RSC.
- G. Van Rossum and F. L. Drake, Python 3 Reference Manual, 2009 Search PubMed.
- E. F. Pettersen, T. D. Goddard, C. C. Huang, E. C. Meng, G. S. Couch, T. I. Croll, J. H. Morris and T. E. Ferrin, UCSF ChimeraX: Structure visualization for researchers, educators, and developers, Protein Sci., 2021, 30, 70–82 CrossRef CAS PubMed.
- Schrödinger LLC, The AxPyMOL molecular graphics plugin for Microsoft PowerPoint, version 1.8, November, 2015 Search PubMed.
- Schrödinger LLC, The JyMOL molecular graphics development component, version 1.8, November, 2015 Search PubMed.
- Schrödinger LLC, The PyMOL molecular graphics system, version 1.8, November, 2015 Search PubMed.
- P. J. Turner, XMGRACE, Version 5.1.19. Center for Coastal and Land-Margin Research, Oregon Graduate Institute of Science and Technology, Beaverton, OR, 2005 Search PubMed.
Footnote |
| † Electronic supplementary information (ESI) available: Data set employed for training machine learning algorithms (XLSX format). Additional information on the dataset and antibody structures, including explanations of features used in the study (PDF format). See DOI: https://doi.org/10.1039/d4me00187g |
| This journal is © The Royal Society of Chemistry 2025 |