
 Open Access Article
 This Open Access Article is licensed under a Creative Commons Attribution-Non Commercial 3.0 Unported Licence
Grassystatin G, a new cathepsin D inhibitor from marine cyanobacteria: discovery, synthesis, and biological characterization†
Lobna A.
Elsadek
ab,
Gustavo
Seabra
 ab,
Valerie J.
Paul
c and
Hendrik
Luesch
*abd
ab,
Valerie J.
Paul
c and
Hendrik
Luesch
*abd
aDepartment of Medicinal Chemistry, University of Florida, 1345 Center Drive, Gainesville, FL 32610, USA. E-mail: luesch@cop.ufl.edu
bCenter for Natural Products, Drug Discovery and Development (CNPD3), University of Florida, 1345 Center Drive, Gainesville, FL 32610, USA
cSmithsonian Marine Station, 701 Seaway Drive, Ft. Pierce, FL 34949, USA
dProgram in Cancer and Stem Cell Biology, Duke-NUS Medical School, Singapore, 169857, Singapore
First published on 25th April 2025
Abstract
Through ongoing investigations of marine cyanobacteria, a prolific source of structurally diverse secondary metabolites, we isolated grassystatin G (1), a new statine-containing linear peptide, closely related to the cathepsin E (CatE) inhibitors grassystatins A–F, some of which may function as CatE probes. The planar structure of 1 was determined by analysis of 1D, 2D NMR and MS/MS fragmentation data, and is structurally distinct from its analogs by being shorter and containing a hydrophobic residue (Val) adjacent to the statine unit instead of a polar residue (Asn, Gln). We employed chiral HPLC analysis and modified Marfey's method to assign the absolute configuration of constituent amino acids, suggesting the presence of N-Me-L-Phe instead of N-Me-D-Phe in other grassystatins. To prove the structure and overcome the lack of material for further biological studies and mechanistic characterization, we developed a 3 + 3 convergent synthesis and have accessed the peptide with an overall yield of 19% using standard peptide coupling. As the statine moiety is a known pharmacophore with an inhibitory effect against aspartic proteases, we screened grassystatin G against a panel of human and virus aspartic proteases. In contrast to grassystatins A–F, preferentially targeting CatE over CatD with 18–66-fold selectivity, grassystatin G displayed 2-fold selectivity for CatD over CatE, suggesting that the key structural differences may be exploited for CatD probe design. Docking and molecular dynamics provided insights into the structural features responsible for the selectivity towards CatD. CatD is well-documented to play a role in cancer proliferation and metastasis, particularly in the context of breast cancer. We tested grassystatin G against MDA-MB-231 triple-negative breast cancer cells and demonstrated its cooperative effects with TRAIL. RNA-seq highlighted the potential pathways and molecular mechanisms governed by grassystatin G alone and in combination with TRAIL.
Introduction
Cathepsin D (CatD) is an aspartic protease that plays a role in numerous physiological and pathological functions.1–3 The active site of CatD consists of two catalytically active aspartate residues that facilitate peptide bond cleavage in an acid–base reaction, just like other aspartic proteases (pepsin, renin, cathepsin E, chymosin, HIV protease).3 This protease primarily resides in the lysosomes, where it actively participates in the degradation of internalized proteins and various intracellular components.2 Initially, CatD is synthesized as an inactive precursor molecule known as pro-CatD within the endoplasmic reticulum.2 Subsequently, it undergoes processing and activation specifically within the lysosomal environment.2 CatD exhibits the ability to cleave a diverse range of protein substrates, encompassing extracellular matrix components, growth factors, receptors, and cytoskeletal proteins.1 Thus multiple biological processes are regulated by CatD, including apoptosis, cell cycle, cellular differentiation, morphogenesis and tissue remodelling, immunological processes, fertilization, neuronal outgrowth, and angiogenesis.1 Dysregulation of CatD has been linked to a number of pathological ailments, such as cancer, neurological disorders, and cardiovascular issues.2 High levels of CatD, both intracellular and extracellular, have been implicated in the progression of cancers, including breast, ovarian, colorectal, prostate, bladder cancer and melanoma.2 Specifically in the context of breast cancer, the dysregulation of CatD expression and activity has been associated with tumor aggressiveness and poor prognosis.4–6 Regardless, to date, CatD inhibitors have not reached clinical trials, likely due to the lack of integrated understanding of its role in breast cancer progression and invasiveness. Thus, there is an emergent need for new CatD inhibitors to characterize molecular mechanisms of CatD in breast cancer.Marine cyanobacteria are a rich source of metabolites that possess inhibitory effects against various types of proteases, including serine, cysteine, and aspartic proteases,7–11 and demonstrate anticancer activity. Grassystatins A–F (Fig. 1) represent a class of modified linear peptides that contain the statine unit (γ-amino–β-hydroxy acid), a recognized pharmacophore for aspartic proteases inhibitors.12,13 These cyanobacterial metabolites have shown inhibitory activity against CatD and E, with a preference for CatE.12,13 Thus they were found to alter antigen presentation of dendritic cells which is thought to be regulated by CatE.13 Another group of cyanobacterial metabolites, tasiamides B and F, feature a Phe-derived statine,14,15 instead of the Leu-derived statine in grassystatins (Fig. 1). These tasiamides exhibit a broader range of inhibition against aspartic proteases, including beta-site amyloid precursor protein cleaving enzyme 1 (BACE1, involved in the pathogenesis of Alzheimer's disease),16 CatD, and CatE. Pepstatin A, isolated from actinomycetes, is a potent inhibitor of aspartic proteases.3 It acts as an inhibitor of pepsin, chymosin, renin, HIV proteases, CatD and E.3 It is known to inhibit enzymes such as pepsin, chymosin, renin, HIV proteases, and CatD and E. However, none of these natural modified linear peptides mentioned above possess selectivity towards CatD, rendering them unsuitable for exploring the role of CatD in breast cancer. Synthetic tasiamide B analogs possessed selectivity to CatD mainly via modifications at the N-terminal residues and maintained activity against BACE1 for some of them.17
 | ||
| Fig. 1 Chemical structures of isolated new grassystatin G (1), structurally related analogs from marine cyanobacteria and pepstatin A with binding site nomenclature. Differences in structures compared to 1 are colored. The pharmacophore unit is identified by dashed blue frame. | ||
In our efforts to explore the natural products produced by the marine cyanobacterium Caldora sp., collected from Guam, we discovered grassystatin G (1) (Fig. 1), preferentially inhibiting CatD. Here we report the isolation, structure elucidation, synthesis and biological characterization of grassystatin G, as a potential tool to probe the molecular mechanisms of CatD in breast cancer.
Results and discussion
Isolation and structure determination
Marine cyanobacterial mat identified as Caldora sp. was collected from Tanguisson Reef Flat, Guam, frozen and freeze-dried. The dried material was extracted using a mixture of EtOAc and MeOH (1![[thin space (1/6-em)]](https://www.rsc.org/images/entities/char_2009.gif) :1) and the resulting non-polar extract was subjected to sequential partitioning using solvents of varying polarities, namely hexane, EtOAc, and water. Fractionation of the EtOAc sample coupled with MS dereplication indicated the presence of new compounds in addition to the previously reported dimeric macrolide xylopyranoside, cocosolide.18 Further purification led to the isolation of 200 μg of grassystatin G (1) as an amorphous white solid.
:1) and the resulting non-polar extract was subjected to sequential partitioning using solvents of varying polarities, namely hexane, EtOAc, and water. Fractionation of the EtOAc sample coupled with MS dereplication indicated the presence of new compounds in addition to the previously reported dimeric macrolide xylopyranoside, cocosolide.18 Further purification led to the isolation of 200 μg of grassystatin G (1) as an amorphous white solid.
HRESIMS analysis showed a [M + Na]+ peak at m/z 810.4969 which suggested a molecular formula of C42H69N5O9. 1H NMR spectrum exhibited characteristic signal patterns for a modified peptide: signals for exchangeable amide protons (δH 7–8), signals of α-protons (δH 4.0–5.0), aliphatic methyl signals (δH 0.7–0.9), N-methyl (δH 2.7–2.9) and O-methyl ester protons (δH 3.57). Due to the minute quantities isolated, it was difficult to obtain 1D 13C NMR spectrum. However, analysis of 1H NMR COSY, HSQC, HMBC and ROESY spectra (Fig. 2, Table 1), revealed that grassystatin G (1) constituted of Pro-methyl ester, N-Me-Phe, 4-amino-3-hydroxy-6-methylheptanoic acid (Sta), N-Me-Leu, Leu and hydroxyisovaleric acid (Hiva). ROESY correlations between H-6 (δH 3.57) and H-3 (δH 1.81, 2.22) assisted with connecting the O-methyl ester to the Pro residue. Based on 2D NMR data, the connectivity between C-19 and C-20 was difficult to establish. However, the chemical shift of H-20 (δH 3.81) suggests that it is part of the statine moiety and linked to the hydroxylated methine C-19, as seen in grassystatin analogs. While there were only indications of four carbonyls in the HMBC spectrum, it was presumed that an additional carbonyl is present to account for the molecular formula. This carbonyl, C-38, was attached to the NH (δH 7.56) of the Leu residue to form the amide bond. Since there was a lack of additional NMR evidence to determine whether C-39 is attached to C-38 or C-7, as well as the nitrogen of the Pro-methyl ester, ESI-MS2 analysis was employed to establish the connectivity between these atoms. Upon fragmentation of the parent peak observed at m/z [M + Na+] 810.5, Na adducts of the y ions generated from amide bond cleavage were produced (Fig. 3). These fragment ions were at m/z 710.3 [M + Na-Hiva], 597.6 [M + Na-Hiva-Leu], 470.1 [M + Na-Hiva-Leu-NMeLeu], 313.3 [M + Na-Hiva-Leu-NMeLeu-Sta]. In addition, a base peak at m/z [M + Na+] 478.4 was produced, which is a product of McLafferty-type rearrangement at the statine unit (Fig. 3). MS3 fragmentation of the base peak ion led to the generation of the dehydration product and the loss of the Hiva unit (Fig. 3). This fragmentation pattern provided evidence supporting the connection between C-39 and C-38, as well as the Pro-methyl ester nitrogen and C-7. Furthermore, it confirmed the specific sequence of the peptide amino acids.
 | ||
| Fig. 2 Key 2D NMR correlations for grassystatin G (1). Bonds highlighted in red are connected after MSMS analysis. | ||
| Unit | C/H no. | δ C, type | δ H (J in Hz) | COSY | HMBC | ROESY (key correlations) |
|---|---|---|---|---|---|---|
| Pro-Methyl ester | 1 | 172.1, C | ||||
| 2 | 58.5, CH | 4.28, dd (8.8, 3.5) | 3 | 3 | ||
| 3 | 28.3, CH2 | 1.81 | 2 | 6 | ||
| 2.11 | 2, 4 | 2, 6 | ||||
| 4 | 24.0, CH2 | 1.82 | 3, 5 | 3 | ||
| 1.86 | 3, 5 | 3 | ||||
| 5 | 46.0, CH2 | 3.35 | 4 | 4 | ||
| 3.52 | 4 | 4 | ||||
| 6 | 51.3, CH3 | 3.57, s | 1 | 3 | ||
| N-Me-Phe | 7 | 168.0, C | ||||
| 8 | 54.3, CH | 5.46, t (7.3) | 9 | 7 | 5 | |
| 9 | 34.1, CH2 | 2.74, dd (−14, 7.3) | 8 | 7, 10, 11/15 | ||
| 3.09, dd (−14, 7.3) | 8 | 10, 11/15 | ||||
| 10 | 137.4, C | |||||
| 11/15 | 128.7, CH | 7.19 | 13 | |||
| 12/14 | 127.8, CH | 7.24 | 10 | |||
| 13 | 125.9, CH | 7.18 | 11/15 | |||
| 16 | 30.2, CH3 | 2.79 | 8, 17 | 18 | ||
| Sta | 17 | 170.4, C | ||||
| 18 | 36.71, CH2 | 2.12, dd (−16.2, 6.6) | 19 | 19, 17 | 16 | |
| 2.34, dd (−16.2, 6.7) | 19 | 17 | 16 | |||
| 19 | 68.4, CH | 3.80, m | 18, OH | |||
| 20 | 49.1, CH | 3.81, m | 21, NH | |||
| 21 | 40.1, CH2 | 1.16, m | 20 | |||
| 1.37, m | 20 | |||||
| 22 | 23.9, CH | 1.44, m | 23, 24 | |||
| 23 | 23.0, CH3 | 0.83, d (6.5) | 23 | |||
| 24 | 21.4, CH3 | 0.77, d (6.5) | 23 | 21, 22, 23 | ||
| OH | 4.68 | 19 | ||||
| NH | 7.05 | 20 | ||||
| N-Me-Leu | 25 | 169.9, C | ||||
| 26 | 53.4, CH | 5.03, t (7.5) | 27 | 25 | NH (Sta) | |
| 27 | 36.4, CH2 | 1.52, t (7.5) | 26, 28 | 26, 30 | ||
| 28 | 24.1, CH | 1.34, m | 27, 29, 30 | 27 | ||
| 29 | 21.41, CH3 | 0.79, d (6.6) | 28 | |||
| 30 | 22.8, CH3 | 0.87, m | 28 | |||
| 31 | 29.8, CH3 | 2.92, s | 26, 32 | |||
| Leu | 32 | 172.3, C | ||||
| 33 | 46.1, CH | 4.78, ddd (9.8, 8.7, 4.3) | 34, NH | 31 | ||
| 34 | 40.3, CH2 | 1.31, m | 33, 35 | |||
| 1.46, m | 33 | |||||
| 35 | 23.8, CH | 1.59, m | 34, 36, 37 | |||
| 36 | 13.7, CH3 | 0.86, m | 35 | |||
| 37 | 21.3, CH3 | 0.89, m | 35 | 34, 35 | ||
| NH | 7.56, d (8.7) | 33 | ||||
| Hiva | 38 | Unassigned, C | ||||
| 39 | 74.7, CH | 3.72, d (3.6) | 40, OH | NH (Leu) | ||
| 40 | 31.2, CH | 1.94, m | 39, 41, 42 | |||
| 41 | 18.8, CH3 | 0.87, m | 40 | 39, 40, 42 | ||
| 42 | 15.5, CH3 | 0.70, d (6.8) | 40 | 29, 40, 42 | ||
| OH | 5.38 | 39 |
 | ||
| Fig. 3 ESIMS/MS fragmentation of grassystatin G (1). | ||
ROESY correlations of α protons of Hiva, Leu, N-Me-Leu, N-Me-Phe to NH (Leu), N-Me (N-Me-Leu), NH (Sta), H-18 and H-5, respectively, indicated the predominant geometry at the amide bonds is trans. The 1H NMR spectrum indicated the presence of less abundant conformers present. One conformer arises from the cis amide geometry at the Pro-methyl ester, as indicated by the ROESY correlation between α protons signals at 4.39 ppm and 5.43 ppm. No other ROESY correlations were observed between the α amide protons. Thus, likely, the other conformer results from different spatial arrangements of atoms around single bonds. For example, ROESY correlations were observed between the two minor signals present at 4.35 ppm and 2.15 ppm, suggesting different rotamers at the bond between C-2 and C-3.
To assign the absolute configurations of the stereocenters present in grassystatin G (1), acid hydrolysis was performed on a portion of 1 (50 μg) using 6 N HCl at 110 °C for 4 hours. This shorter duration of acid hydrolysis instead of the more common 24 h was chosen to minimize dehydration at the statine unit and the associated risk of epimerization.19 Enantioselective HPLC–MS analysis was performed on the hydrolysate. By comparing with authentic standards, the analysis identified retention times that aligned with L-Pro, N-Me-L-Phe, L-Leu, and N-Me-L-Leu. To determine the configuration of the statine unit, a portion of the acid hydrolysate was treated with L-FDLA and DL-FDLA and then analyzed using modified Marfey's analysis alongside authentic standards. The standards included (3S,4S)-Sta-L-FDLA, (3R,4S)-Sta-L-FDLA, (3S,4S)-Sta-D-FDLA (corresponding to (3R,4R)-Sta-L-FDLA), and (3R,4S)-Sta-D-FDLA (corresponding to (3S,4R)-Sta-L-FDLA). Two peaks were observed, corresponding to (3S,4S)-Sta-L-FDLA and (3S,4S)-Sta-D-FDLA. Consequently, the configuration of the two stereocenters in the statine unit was determined as 3S,4S. This configuration corresponds to the configuration found in grassystatins A–F.12,13 To determine the configuration of the chiral center at Hiva, we performed chiral phase HPLC analysis on the FDLA-derivatized hydrolysate containing unreacted Hiva, revealing one peak that eluted at the same retention time as the D-Hiva standard, providing evidence that Hiva in 1 has D configuration. The observation of N-Me-L-Phe is an unusual configuration for grassystatin analogs. This atypical stereochemistry underscores the importance of synthetic validation to confirm the structural assignments.
Synthesis
To validate the structure and overcome the lack of material for biological studies, we accessed 1 synthetically using standard peptide coupling. In order to maximize the yield, we devised a [3 + 3] convergent synthesis. Thereby, the first retrosynthetic disconnection was at the amide bond between the Sta unit and N-Me-Leu (Fig. 4). | ||
| Fig. 4 Retrosynthesis for grassystatin G (1). | ||
To access intermediate 6, we considered the final coupling of the Pro-methyl ester to the dipeptide 4. This would prevent the risk of intramolecular peptide coupling by nucleophilic attack at the ester carbon if the N-Me-Phe and Pro-methyl ester were attached first. In addition, to minimize potential aminolysis, we incorporated protecting groups that could be deprotected without the need for bases such as ethyl amine or piperidine. Therefore, Boc-(3S,4S)-Sta-OH was coupled to N-Me-L-Phe benzyl ester using EDC/HOAT to afford 4 (Fig. 5). Subsequently, intermediate 4 underwent benzyl deprotection via hydrogenation, followed by its coupling to L-Pro-methyl ester to yield compound 6. In parallel, Boc-L-Leu was coupled with N-Me-L-Leu benzyl ester using EDC/HOAT, resulting in compound 9. Boc deprotection using TFA and coupling with D-Hiva led to intermediate 11. With both tripeptides, 6 and 11, in hand, we deprotected them using TFA and H2/Pd–C, respectively. The two intermediates were then coupled via EDC/HOAT to produce 1 with an overall yield of 19%.
 | ||
| Fig. 5 Forward synthesis of grassystatin G (1). | ||
The 1H NMR spectrum of the synthesized compound was in complete agreement with the natural product (Fig. S23†). However, there are minor signals along the NMR spectrum noticed that might suggest the presence of diastereomers or rotamers. To address this query, we carried out 1D selective gradient NOE. If a rotameric chemical exchange occurs between two protons, selective irradiation of one targeted proton will result in a new peak at the same phase, implying they undergo chemical exchange.20 In contrast, saturation/inversion transfer does not occur between diastereomers.20 Therefore, we performed selective irradiation of the resonances at 8.02, 6.94 and 4.35 ppm, which produced resonances at the same phase at 7.56, 7.05 and 4.28, 4.39 ppm, respectively (Fig. S24–S26†). These results indicate the presence of rotamers and not diastereomers within the NMR spectrum.
In vitro aspartic protease profiling
The statine moiety is a known pharmacophore with an inhibitory effect against aspartic proteases;3 therefore, to determine the contributions of the flanking unique amino acids including their configurations. We screened grassystatin G against a panel of aspartic proteases (human and HIV) (Table 2). No activity against BACE1 and HIV1 was detected, as observed for other grassystatins.12,13 Grassystatin G strongly inhibited CatD and E with IC50 values of 66 nM and 133 nM, respectively. In contrast to the previously recorded 2- to 66-fold selectivity of grassystatins A–F towards CatE,12–14 grassystatin G showed 2-fold selectivity for CatD. Grassystatin G is shorter and lacks the two amino acid units positioned between the N-Me-Phe and the statine moiety present in the other grassystatin analogs. Although the Pro-methyl ester and N-Me-Phe are retained in all analogs, grassystatin G displays an inverted stereocenter at the N-Me-Phe. Additionally, while the other analogs maintain a polar residue (Asn, Gln) adjacent to the statine unit, grassystatin G features a hydrophobic residue instead. These structural attributes could potentially contribute to the unique selectivity observed towards CatD. Structurally, grassystatin G is more similar to grassystatin C–E in the lack of N,N-diMe-Phe/Val unit at the N-terminus. In analogs like grassystatin A, B and F, this N-terminal moiety is known to increase the activity against CatD and C by helping anchor them in the binding cleft of the enzyme.12,13| Target | Grassystatin G (1) | Positive control (IC50, nM) | |
|---|---|---|---|
| IC50 (nM) | IC50 CatD/CatE | ||
| BACE1 | — | β-Secretase inhibitor IV (128) | |
| Cathepsin D | 66 | 0.5 | Pepstatin A (0.31) |
| Cathepsin E | 133 | Pepstatin A (0.073) | |
| HIV-1 | — | Pepstatin A (8820) | |
Molecular docking and molecular dynamic simulations
To gain insights into the structural features contributing to CatD selectivity, we studied the interaction of grassystatin G with CatD and E computationally using docking and molecular dynamics, based on the crystal structure of CatD co-crystallized with pepstatin A (PDBID: 1LYB) and a homology model for cathepsin E built using the crystal structure of CatD as a template (Fig. S1†). With a >30-fold preference for CatE, the activity profile of grassystatin C is the opposite of that of grassystatin G (∼2-fold preference for CatD), providing a good basis for comparison. We thus applied the same methodology to the binding of grassystatin C to CatD and E.In the crystal structure, the amide protons of pepstatin A residues Val3 and Ala5 (located before and after the statine unit) form hydrogen bonds (H-bonds) with CatD residues Ser80 and Gly35, respectively (Fig. S2†). Together with H-bonds between pepstatin A Iva and Val2 residues and Ser235, and an extra H-bond between pepstatin Ala5 and Tyr205, these interactions position the statine hydroxy group to form hydrogen H-bonds to the catalytic Asp231 and Asp33, and the statine nitrogen to form an H-bond to Gly233 backbone (Fig. S2†). In grassystatin G, the pepstatin A Val3 and Ala5 residues flanking the statine unit are substituted by the bulkier N-Me-Leu and N-Me-Phe, both N-methylated, requiring relatively large conformational changes in the loop regions composing the cathepsin binding pockets to accommodate the new ligand, and rendering conventional docking inadequate to identify binding poses. To study the interactions of grassystatin G to CatD and E, we applied molecular dynamics (MD) simulations, and the molecular mechanics, generalized born surface area (MM-GBSA) method to calculate the binding free energies. As shown Fig. 6, the total MM-GBSA binding energies reproduce the experimental trends, with grassystatin G showing preference towards CatD while grassystatin C shows preference towards CatE. For all systems studied, the most significant contributions for the interaction energies come from Coulomb, lipophilic and van der Waals interactions, with relatively smaller contributions from H-bonds. Decomposition analysis of the MM-GBSA energies indicates that the significant preference of grassystatin C towards CatE may be mainly due to the difference in electrostatic interactions between the ligand and each of the proteins. Conversely, grassystatin G is better accommodated by CatD, with extra lipophilic and van-der-Waals interactions (Fig. 6).
 | ||
| Fig. 6 MM-GBSA energy decomposition obtained from the last 400 ns of simulations. Error bars indicate standard deviations. | ||
During MD, CatD adjusts to the presence of the different grassystatins forming new interactions (Fig. 7). The Leu3 and Phe5 methylations in grassystatin G disturb the interactions with CatD Ser80 and Gly35, but Ser80 is still capable of forming an intermittent H-bond to N-Me-Leu3 which is visible in about 38% of the simulation time. Ser235 still makes H-bonds to Leu2 of grassystatin G (93% of simulation time), while Tyr205 maintains hydrogen bonding with the carbonyl oxygen of Phe5 for 83% of the time. These new interactions help hold the statine pharmacophore in place to establish H-bonds to Asp33/231 (4%/71%), Thr234 (42%) and Gly79 (99%, Fig. S3, S4 and Table S1†). In CatE, Ser80 is replaced by a Thr, breaking the H-bond to Leu3, which is replaced by weak water bridges between the carbonyl oxygen in N-Me-Leu3 and Thr80 (33%) and Gly81 (42%). This is reflected in the distance between residue Ser/Thr80 and Thr234, on the opposite side of the binding site, which increases by ∼2.3 Å on average. Overall, this increases the mobility of the ligand, weakening the interactions with Ser235 and Asp231, which are mostly eliminated.
 | ||
| Fig. 7 Snapshots from the MD simulations showing the most important interactions between grassystatin G (green carbons) or grassystatin C (blue carbons), and cathepsins D (cyan ribbons) or E (grey ribbons). a) Grassystatin G – cathepsin D; b) grassystatin C – cathepsin D; c) grassystatin G – cathepsin E; d) grassystatin C – cathepsin E. | ||
Grassystatin C is about 30-fold more potent against CatE as compared to CatD and provides a good basis for comparison.13 Compared to grassystatin G, a polar Gln3 replaces the apolar Leu3 in the position immediately before the statine group. Gln3 can maintain H-bonds to CatE residues Ser235 (97%), Leu236 (53%), and Gln307 (43%) (Fig. S5, S6 and Table S2†). Grassystatin C is also longer, with two extra residues in the portion after the statine unit. This extra length positions the backbone oxygen of the N-Me-D-Phe7 residue close enough to form an H-bond to the backbone nitrogen in CatE His312 (58%). Those two last interactions are crucial to position the statine unit towards Asp33/231, and to form a highly persistent bond to Ser235, present over 97% of the time. In contrast, in CatD, Gln307 is replaced by a Met and His312 by a Pro, eliminating the two H-bonds essential for molecular recognition. As a result, grassystatin C mostly detaches from the binding site, effectively losing the interactions with Ser235, Leu236, and Asp33/231.
Cellular biological characterization
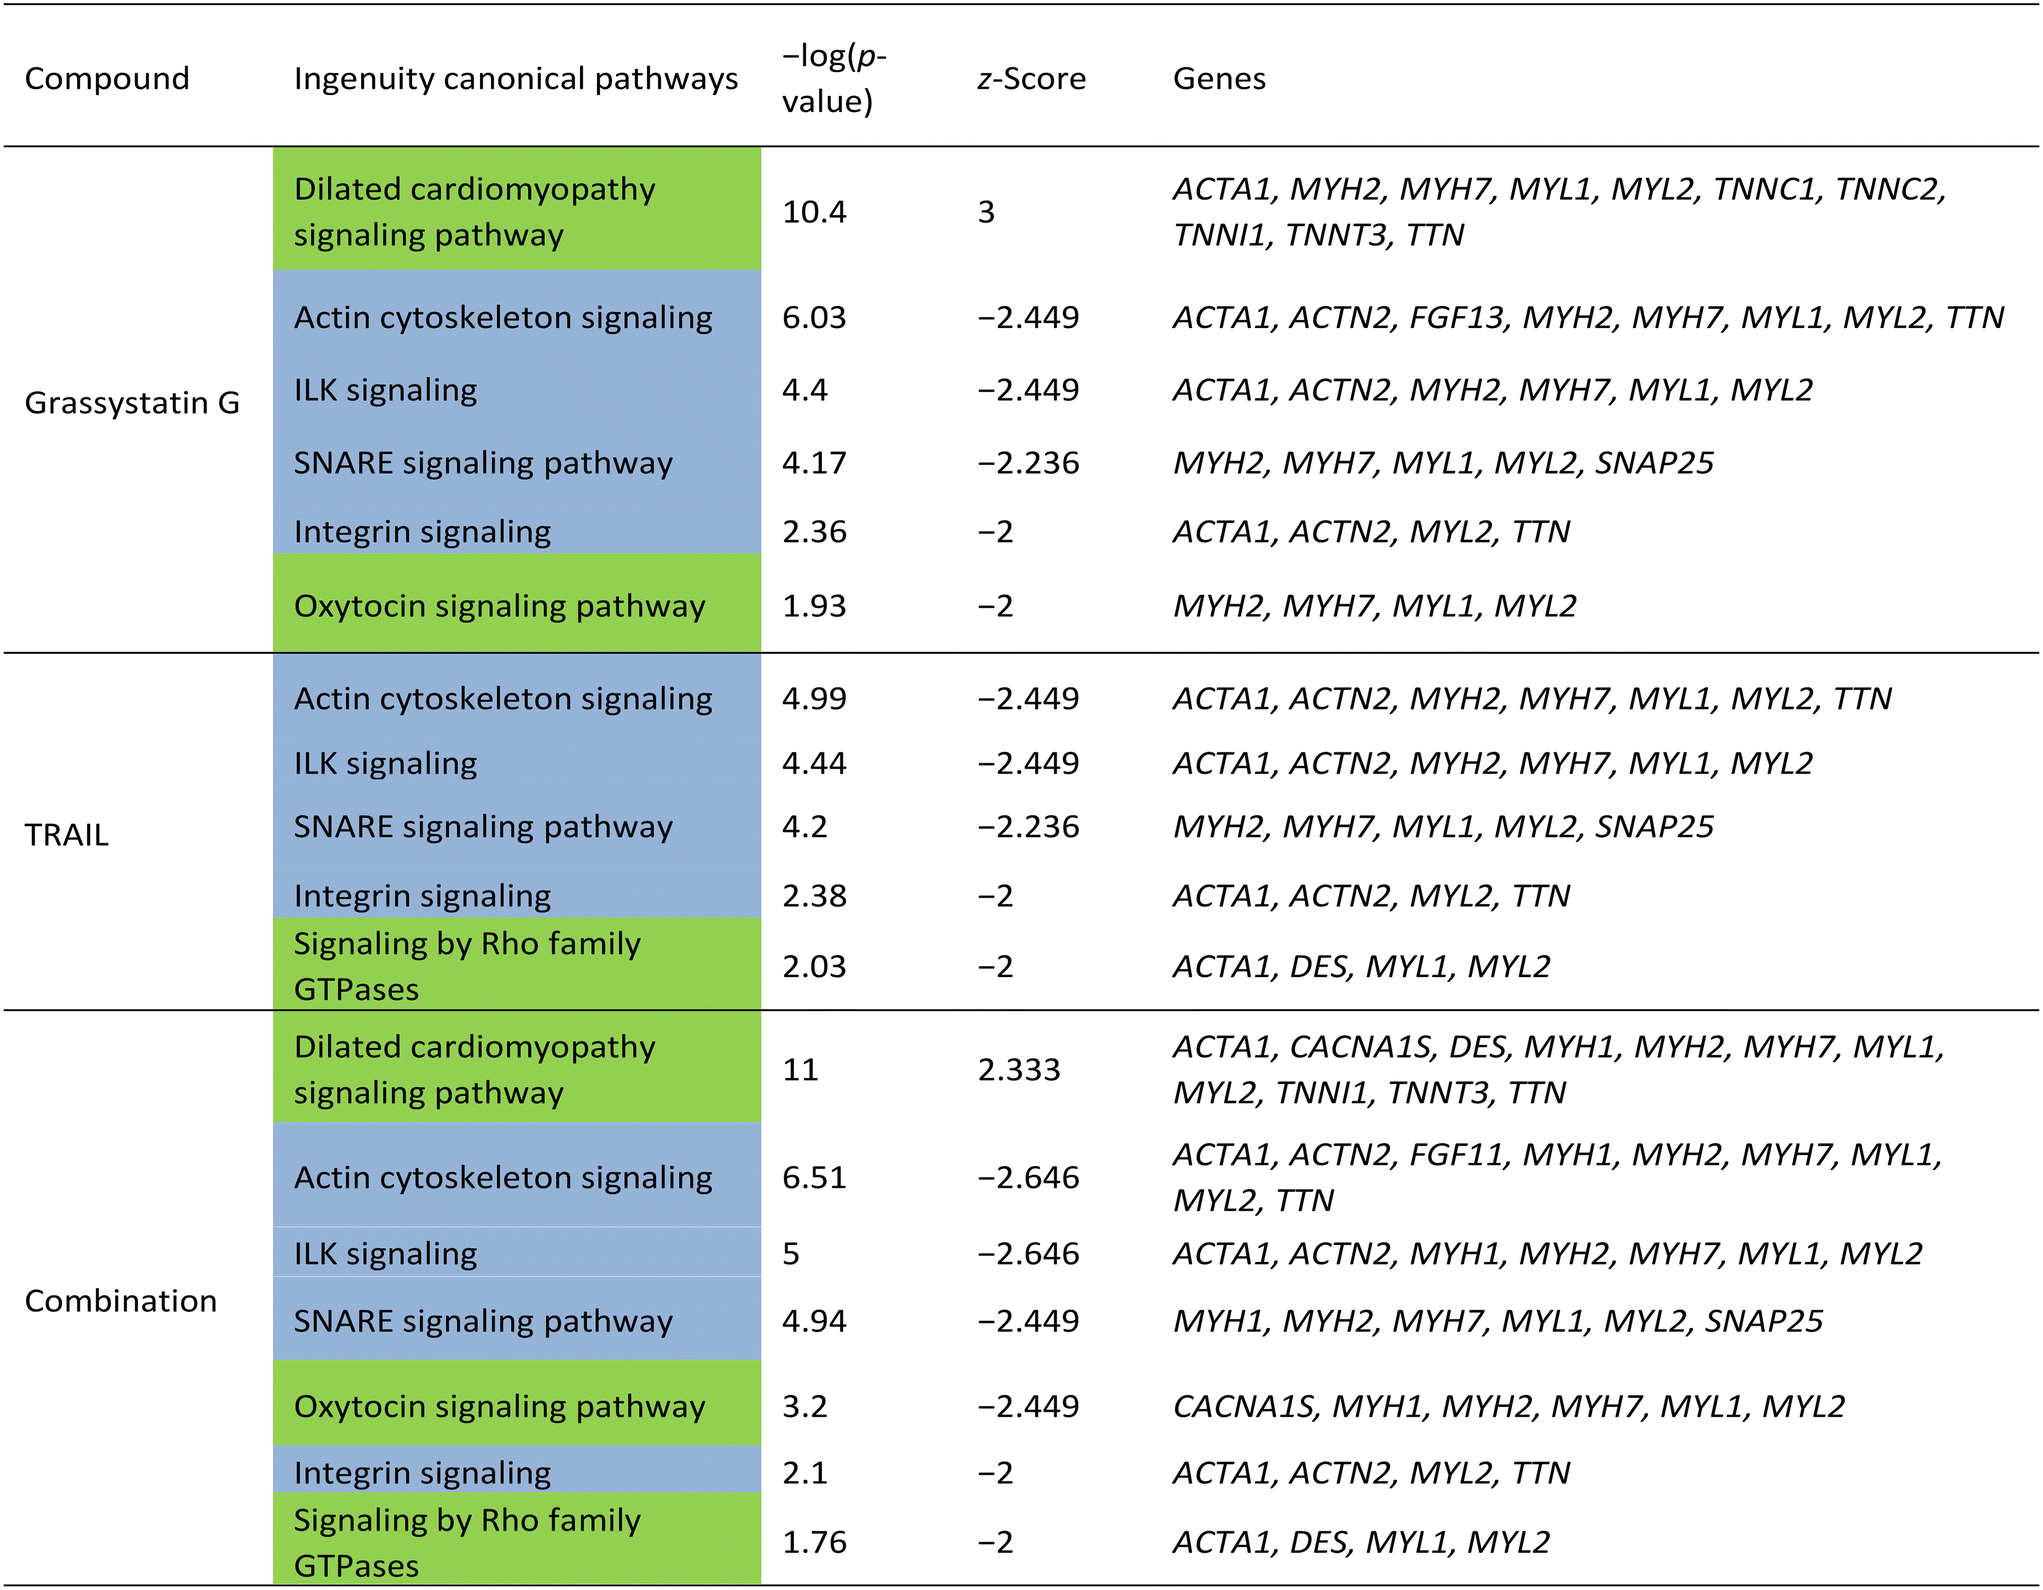
In order to investigate the cellular effects of grassystatin G, we chose to utilize the MDA-MB-231 cell line as a model system due to the aggressive nature of triple-negative breast cancer and the established role of CatD in tumor proliferation and invasiveness.4,5 Previous studies have indicated that combining pepstatin A can increase the sensitivity of cancer cells to tumor necrosis factor-related apoptosis-inducing ligand (TRAIL).21 Based on this, we sought to examine the potential synergistic effects of grassystatin G in combination with TRAIL in MDA-MB-231 cells. Various concentrations of grassystatin G (IC50 40 μM, Fig. 8a), along with TRAIL (IC50 25 ng mL−1, Fig. 8b) were employed (Fig. 8c). Our cell viability assay demonstrated that grassystatin G significantly enhanced the response of MDA-MB-231 cell lines to TRAIL at concentrations of 40 μM and 13 μM (Fig. 8d). Based on the Bliss independence model,22 the observed viability (15%) at 40 μM grassystatin G was lower than the predicted additive effect (23%), indicating a synergistic interaction between grassystatin G and TRAIL (Fig. 8d), while the combination effect was closer to an additive response at 13 μM. These findings indicate that combining TRAIL with CatD inhibitors may serve as a promising therapeutic strategy to augment TRAIL-induced apoptosis and overcome resistance23 observed in cancer cells. To provide insights into the molecular mechanism of activity and synergy, we surveyed global transcriptomic changes in MDA-MB-231 breast cancer cells. We treated MDA-MB-231 with grassystatin G (40 μM), TRAIL (25 ng mL−1) and the combination of both. RNA was extracted after 6 h and 12 h treatments. Genes were considered as differentially expressed at 2-fold change relative to the solvent control (P-value ≤ 0.05) (Fig. 9a). The results revealed distinct expression profiles between the 6 hour and 12 hour time points, indicating dynamic changes in gene expression over time (Fig. 9a and b). Ingenuity pathway analysis (IPA) of the differentially expressed genes after 6 h predicted the inhibition of several canonical pathways in all treatments as actin cytoskeleton signaling, ILK (integrin-linked kinase) signaling, SNARE (soluble NSF attachment protein receptor) signaling and integrin signaling (Table 3). These genes and pathways are involved in various aspects of cytoskeletal dynamics, cellular motility and contractility. Previous reports highlighted the dual role of CatD as a regulator of actin remodeling, which is governed by environmental pH and CatD's maturation stage.24,25 Under neutral pH conditions, the precursor form of CatD directly removes phosphate groups from and activates cofilin, a protein that severs actin filaments. When the environment is acidic, mature CatD functions to break down cofilin. Thus, inhibition of CatD proteolytic activity may dysregulate actin dynamics via perturbing cofilin degradation. The results of the IPA for differentially expressed genes in response to grassystatin G after 12 h (Table 4) appears to induce the unfolded protein response (UPR)26 which indicates that grassystatin G treatment induces endoplasmic reticulum (ER) stress due to the accumulation of misfolded proteins. This stress response aims to restore ER homeostasis by increasing the expression of chaperone proteins (HSPs) like HSPA1A/B and HSPA5, which assist in protein folding. DNAJB9, a co-chaperone, may also play a role in facilitating proper protein folding.27 ERO1B is involved in oxidative protein folding in the ER.28 When ER stress is overwhelming, UPR triggers apoptosis.26 The activation of the NOD1/2 signaling pathway suggests an immune response or inflammation.29,30 HSPs (HSPA1A/B, HSPA5, HSPA6) are known to interact with various immune signaling pathways and may be involved in modulating the immune response. IL1A is a pro-inflammatory cytokine, and its involvement suggests an inflammatory component to the cellular response. The expression profile of the combination of grassystatin G and TRAIL presented a new set of genes and resulted in enhancement of the expression of some genes (Fig. 9a and b). Of note, death receptor 3 (DR3) was differentially expressed only in the grassystatin G (log2FC = 2.40) treatment at the 6 h time point and this is also in effect in the combination (log2FC = 1.48). DR3 interacts with its ligand, TNF-like ligand 1A (TL1A), to initiate signaling pathways that ultimately lead to cell death.31 Similar to DR4 and DR5, also known as TRAIL receptors, activated DR3 induces the formation of a membrane-bound complex, which in turn, recruits and activates procaspase-8, an initiator caspase.31 Active caspase-8 can then cleave and activate effector caspases (e.g., caspase-3, caspase-7), which are responsible for executing the apoptotic process. It is possible that the combined grassystatin G and TRAIL treatment leads to a synergy between death receptors that resulted in amplifying the apoptotic signal and increased sensitivity of the cells. It should be noted that our studies did not assess the cellular uptake and localization of 1. Elevated levels of CatD, both intracellular and in the extracellular environment, have been linked to the progression of cancers.2,5 Understanding whether the compound penetrates cancer cells efficiently and targets intracellular CatD or primarily acts on secreted CatD will provide more context into its mechanism.
 | ||
| Fig. 8 Sensitization of breast cancer MDA-MB-231 cells by grassystatin G in combination with TRAIL. a) Dose–response curve of grassystatin G on MDA-MB-231 cells after 48 h treatment. b) Dose–response curve of TRAIL on MDA-MB-231 cells after 48 h treatment. c) Heat map representation depicting the combined effects of different concentrations of grassystatin G and TRAIL on MDA-MB-231 cell viability after 48 hours of treatment. d) Bar graphs showing the significant combination effects between grassystatin G and TRAIL after 48 h treatment. Analysis of treatment combinations and individual treatments was done using one-way ANOVA test and Bonferroni correction. The graph displays the mean values and standard deviations for each treatment group, with the significance level indicated by asterisks (*p < 0.05, **p < 0.01, ***p < 0.001, ****p < 0.0001). All experiments were done as technical triplicates. Data are presented as mean ± SD (n = 3). | ||
 | ||
| Fig. 9 Transcriptomic profiles of the differentially expressed genes (≥2-fold, P-value ≤0.05) of MDA-MB-231 cells treated with grassystatin G (G, 40 μM), TRAIL (T, 25 ng mL−1) and the combination of both (CO). a) Heatmap representation of the differentially expressed genes after 6 h and 12 h treatment. b) Area-proportional Venn diagram representation of the differentially expressed genes after 6 h and 12 h treatment. | ||
|
| Ingenuity canonical pathways | −log(p-value) | z-Score | Genes |
|---|---|---|---|
| Unfolded protein response | 6.05 | 2 | DNAJB9, ERO1B, HSPA1A/HSPA1B, HSPA5, HSPA6 |
| NOD1/2 signaling pathway | 3.29 | 2 | HSPA1A/HSPA1B, HSPA5, HSPA6, IL1A |
Materials and methods
General experimental procedure
The optical rotation was measured using a Perkin-Elmer 341 polarimeter. 1H and 2D NMR spectra were obtained in DMSO-d6 using Agilent VNMRS-600 MHz, 5 mm cold probe spectrometer. The spectra were referenced using the residual solvent signal [δH/C 2.50/39.52]. The HRESIMS data were obtained in the positive mode using Agilent LC-TOF mass spectrometer equipped with APCI/ESI multimode ion source-detector. MSMS data were obtained using an API 3200 (Applied Biosystems) equipped with an HPLC system (Shimadzu).Biological material
A golden cyanobacterial mat identified as Caldora sp. (VPG 14-1) was collected from Tanguisson Reef Flat, Guam on May 27, 2014. The sample was examined microscopically and was consistent with Caldora penicallata, which we have previously described,32 with a few differences. It had the same general morphology of soft clumps that were golden coloured on the surface with mucilaginous basal portions composed primarily of empty polysaccharide sheaths. The cyanobacterium formed clumps or mats on the bottom and was not branching or upright like some collections of C. penicillata. Cells had cylindrical dimensions, slightly longer than wide (cell length 6–9 μm, width 6–8 μm) surrounded by thin individual ∼1 μm polysaccharide sheaths. The major difference was filaments were slightly wider than reported for C. penicillata type specimen FK13-1.Extraction and isolation
The freeze-dried sample was subjected to non-polar extraction with 1:1 EtOAc–MeOH and polar extraction with 1:1 EtOH–H2O. The nonpolar extract was subsequently partitioned between hexane and MeOH:H2O (9:1). The MeOH:H2O fraction was further partitioned between EtOAc and H2O. The EtOAc fraction was fractionated using silica column chromatography applying a gradient of increasing polarity (DCM, 98% DCM/iPrOH, 96% DCM/iPrOH, 94% DCM/i-PrOH, 90% DCM/i-PrOH, 85% DCM/i-PrOH, 75% DCM/i-PrOH, 60% DCM/i-PrOH, 35% DCM/i-PrOH, i-PrOH, 50% MeOH/ i-PrOH, MeOH). The fraction eluting with 94% DCM/iPrOH was subjected to a second round of silica column chromatography applying a gradient of increasing polarity (DCM, 98% DCM/iPrOH, 96% DCM/iPrOH, 94% DCM/i-PrOH, 90% DCM/i-PrOH, i-PrOH, MeOH). The fraction eluting with 90% DCM/iPrOH was purified by C18 column using MeOH, then was further purified by HPLC [Luna PFP 150 × 3 mm; flow rate, 0.5 mL min−1; PDA detection 200–800 nm] using a MeOH–H2O gradient (60%–75% MeOH/ H2O over 7 min, 75% for 6 min) to afford 1 (0.2 mg, tR 14.3 min).
Grassystatin G (1): [α]20D −83 (c 0.02, MeOH); NMR data, 1H NMR, COSY, HSQC, HMBC in DMSO-d6, see Table 1, HRESIMS m/z [M + Na]+ 810.4971 (calcd for C42H69N5O9Na, 810.4993), [M + H]+ 788.5153 (calcd for C42H70N5O9, 788.5174).
Acid hydrolysis and chiral amino acid analysis by LC–MS and HPLC
50 μg of 1 was treated with 500 μL 6 N HCl and left to hydrolyze for 4 h at 110 °C. The reaction was left to cool at rt then dried under nitrogen. To get rid of residual HCl, 500 μL of water was added and then dried off two times. The dried material was reconstituted with 70 μL water. For the statine unit, 15 μL was divided into two vials where Marfey's reaction was carried out. To each of the two vials was added 10 μL 1 M NaHCO3, 50 μL of L-FDLA or DL-FDLA (dissolved as 1% in acetone). Both vials were heated to 37 °C using a hot plate for 1 h with frequent shaking, then left to cool down at RT, 5 μL HCl was added to the mixture and then dried under nitrogen. 100 μL of MeCN and water (1:1) was added to each vial, followed by LCMS analysis using reversed-phase HPLC [Kinetix 1.6μ XB-C18 50 × 4.6 mm; flow rate, 0.5 mL min−1] using MeOH with 0.1% formic acid and water with 0.1% formic acid at (60% MeOH/H2O over 10 min, 70% for 40 min). Two peaks at 5.46 and 17.40 min, corresponding to (3S,4S)-Sta-L-FDLA and (3S,4S)-Sta-D-FDLA, were observed, respectively. The retention times (tR, min) of the authentic standards were as follows: (3S,4S)-Sta-L-FDLA (5.6), (3R,4S)-Sta-L-FDLA (6.2), (3S,4S)-Sta-D-FDLA [corresponding to (3R,4R)-Sta-L-FDLA, 17.5], (3R,4S)-Sta-D-FDLA [corresponding to (3S,4R)-Sta-L-FDLA, 18.5]. The MS parameters used were as follows: DP −60.0, EP −7.0, CE −28.0, CXP −7.4, CUR 40, CAD High, IS −4500, TEM 750, GS1 40, GS2 40. For the Hiva, chiral LC was done using [Chiralpak MA (+) (4.6 mm × 50 mm); solvent, ACN −2 mM CuSO4 (10:90); flow rate, 1 mL min−1; detection by UV at 254 nm]. A peak at 3.8 min corresponding to D-Hiva was observed. Authentic standards' retention times (tR, min) were as follows: D-Hiva (3.8) and L-Hiva (5.6 min). For the rest of the amino acids, chiral HPLC was carried out using [chirobiotic TAG (4.6 mm × 250 mm), Supelco; solvent, MeOH −10 mM NH4OAc (40:60); flow rate, 0.5 mL min−1; detection by ESIMS in positive mode]. L-Pro, N-Me-L-Phe, L-Leu and N-Me-L-Leu eluted at tR 14, 22.6, 9.7 and 14.6 min, respectively. The retention times (tR, min) of the authentic amino acids were as follows: L-Pro (14.5), D-Pro (33.5), N-Me-L-Phe (22), N-Me-D-Phe (37), L-Leu (10), D-Leu (16.5), N-Me-L-Leu (14.4). N-Me-D-Leu (87).
In vitro aspartic protease inhibition assay
To assess the aspartic protease inhibitory activity of 1, in vitro BACE1, HIV-1, CatD and CatE inhibition assays were carried out. Assays were done by Reaction Biology Corp (RBC) (Malvern, PA, US). RBC's protease assays are based on the cleavage of fluorogenic peptide substrates for quantification of the proteolytic activity of proteases enabling the screening of direct and allosteric inhibitors. In brief, BACE-1 (R&D Systems), HIV1 (ProSpec), CatD (Biomol) and CatE (R&D Systems) were suspended in the appropriate assay buffer. The buffer for BACE-1 consisted of 100 mM sodium acetate with a pH of 4.0, while for HIV-1, it was 50 mM sodium acetate with a pH of 5.5. The buffer for CatD and CatE contained 100 mM sodium acetate with a pH of 3.5. The enzyme solutions were added to a 384-well plate such that the final concentration was 200 nM for BACE-1, 10 nM for HIV1, 0.83 nM for CatD and 0.6 nM for CatE. Various concentrations of 1 (starting from 100 μM and diluted 3-fold or 4-fold) were then added to the plate. The plate was incubated at room temperature for 5–15 minutes, followed by adding enzyme substrates to initiate the reaction. The enzymatic activities were monitored by measuring the fluorescence signal increase from the labeled substrate every 5 minutes for 120 minutes using Envision plate reader.Molecular docking and molecular dynamic simulations
The structure for CatD co-crystallized with pepstatin was obtained from the Protein Data Bank (PDBID: 1LYB)33 and prepared for simulations following the Schrödinger protein preparation workflow, at pH 3.5 and in the presence of the ligand. In all simulations, we enforced the protonated state in Asp33 and the deprotonated for Asp231. To obtain the initial configurations, we aligned the statine moieties from the grassystatins to the pepstatin unit and used Prime protein–ligand refinement to allow the protein to adjust to the presence of the grassystatins.There is no crystal structure available for CatE. However, CatE shares 53% identity (70% similarity) to cathepsin D, which is enough for a good quality homology model. For the simulations with CatE, we created a homology model using the final structure from the grassystatin/CatD preparations as templates, and the models were submitted to the same Prime protein–ligand refinement procedure before simulations.
Following preparation, both complexes were then submitted to the same simulation protocol. Systems are first relaxed using Desmond standard NPT relaxation protocol that involves (i) 100 ps of Brownian dynamics followed by (ii) 12 ps Langevin dynamics at constant volume, then (iii) 12 ns at constant pressure, all at 10 K temperature with restraints on the positions of solute heavy atoms. The system is then (iv) heated at a constant 1 atm pressure to 300 K for 12 ps, and finally (v) the restraints on heavy atoms are removed, and the system is allowed to relax for 24 ps at a constant 300 K temperature and 1 atm pressure. After the relaxation protocol, the systems were submitted to 500 MD at the same conditions. The first 100 ns of simulations was discarded as a thermalization period, and data analysis was done including only the last 400 ns. All calculations were made with Desmond MD engine34 from the Schrödinger small molecule drug discovery suite.
MTT cell viability assay
MDA-MB-231 cells were cultured and maintained in Dulbecco's modified Eagle medium (DMEM, Invitrogen) supplemented with 10% fetal bovine serum (FBS; HyClone, Logan, UT) and 1% antibiotic–antimycotic (Invitrogen) at 37 °C in a humidified atmosphere with 5% CO2. MDA-MB-231 cells were seeded in 96-well plates at densities of 9000 cells per well in 100 μL, respectively. After 16 h of incubation, the cells were treated with 0.5 μL of various concentrations of compounds or a solvent control. Following 48 h of incubation, cells were treated with 3-(4,5-dimethylthiazol-2-yl)-2,5-diphenyltetrazolium bromide according to the manufacturer's instructions (Promega). The experiment was done as technical triplicates.Synergistic effect evaluation of grassystatin G with TRAIL
9000 cells of MDA-MB-231 were seeded in 96-well plate wells. Incubated overnight (16 h), then 0.5 μL TRAIL dissolved in water was added. Grassystatin G (1) was added at the same time of TRAIL addition. Final DMSO concentration is 0.5% in 100 μL media. Total incubation time was 48 h, followed by MTT addition with 2 h incubation, then adding the solubilization solution. Absorbance measurements were taken after overnight incubation at wavelength of 562 nm. The experiment was done as technical triplicates.RNA isolation and sequencing
150000 cells of MDA-MB-231 were seeded in a 12-well plate, incubated 24 h before treatment with grassystatin G (40 uM), TRAIL (25 ng mL−1), the combination of both, and solvent control in triplicates. RNA was extracted after treatments of 6 h and 12 h using RNeasy Mini Kit (Qiagen). RNA-seq was done by the Interdisciplinary Center for Biotechnology Research (ICBR) Gene Expression Core, University of Florida (UF). Illumina RNA library construction and subsequent NextSeq500 sequencing (Illumina) were done as described.
RNA-seq bioinformatics analysis
Reads were cleaned up with the Cutadapt program (version 3.4) (Martin 2011) to trim off sequencing adaptors and low-quality bases with a quality Phred-like score <20. Reads <40 bases were excluded from RNA-seq analysis. The genome and gene annotation of Homo sapiens (version GRCh38.104) were retrieved from the Ensembl database as the reference sequences for RNA-seq analysis. The cleaned reads were mapped to the reference sequences using the read mapper of the STAR package (spliced transcripts alignment to a reference, v2.7.9a). The mapping results were processed with the HTSeq (high-throughput sequence analysis in Python, v2.03), SAMtools, and scripts developed in house at ICBR of UF to remove potential PCR duplicates and count uniquely mapped reads for gene expression analysis. Gene expression levels were analyzed by a DESeq2-based R pipeline.Total synthesis of grassystatin G (1)
:hexane to afford the product at 40% EtOAC as a transparent solid (311 mg, 75%).
Compound 4: [α]27D −79 (c 2.38, MeOH); 1H NMR (600 MHz, DMSO-d6) δ 7.36–7.32 (m, 5H), 7.26 (m, 2H), 7.23–7.19 (m, 3H), 6.23 (d, J = 9.5 Hz, 1H), 5.12 (d, J = 1.9 Hz, 2H), 4.99 (dd, J = 9.8, 5.5 Hz, 1H), 4.56 (d, J = 5.5 Hz, 1H), 3.83 (dtd, J = 7.8, 4.8, 2.7 Hz, 1H), 3.55 (m, 1H), 3.22 (dd, J = 14.2, 5.5 Hz, 1H), 3.06 (m, 1H), 2.73 (s, 3H), 2.38 (dd, J = 15.9, 4.4 Hz, 1H), 2.14 (dd, J = 16.1, 7.8 Hz, 1H), 1.55 (m, 1H), 1.37 (s, 9H), 1.31 (m, 1H), 1.22 (m, 1H), 0.87 (d, J = 6.6 Hz, 3H), 0.84 (d, J = 6.5 Hz, 3H); 13C NMR (150 MHz, DMSO-d6) δ 171.85, 170.29, 155.54, 137.72, 135.98, 128.93, 128.43, 128.35, 128.23, 127.89, 127.77, 127.66, 126.31, 77.43, 68.94, 65.89, 59.34, 51.91, 36.48, 34.02, 33.79, 28.19, 24.47, 23.22, 21.94; HRESIMS m/z: 527.3100 [M + H]+ (calcd for C30H43N2O6, 527.3121).
:hexane to afford 6 (130.3 mg, 64%).
Compound 6: [α]27D −50 (c 2.02, MeOH); 1H NMR (600 MHz, DMSO-d6) δ 7.24 (m, 2H) 7.19 (m, 2H) 7.18 (m, 1H) 6.12 (d, J = 9.9 Hz, 1H), 5.49 (t, J = 7.4 Hz, 1H), 4.53 (d, J = 5.9 Hz, 1H), 4.26 (dd, J = 8.8, 3.6 Hz, 1H), 3.80 (dd, J = 6.2, 2.1 Hz, 1H), 3.58 (d, J = 3.9 Hz, 2H), 3.57 (s, 3H), 3.50–3.46 (m, 1H), 3.39–3.36 (m, 1H), 3.09 (dd, J = 14.0, 7.3 Hz, 1H), 2.81 (s, 3H), 2.76–2.73 (m, 1H), 2.42 (dd, J = 16.0, 6.9 Hz, 1H), 2.15–2.11 (m, 1H), 2.09 (dd, J = 16.1, 6.3 Hz, 1H), 1.93–1.78 (m, 4H), 1.56–1.49 (m, 1H), 1.36 (s, 9H), 0.85 (d, J = 6.8 Hz, 3H), 0.81 (d, J = 6.5 Hz, 3H); 13C NMR (150 MHz, DMSO-d6) δ 172.16, 170.72, 168.00, 155.67, 137.75, 129.01, 128.05, 126.15, 77.42, 69.13, 58.80, 54.38, 51.72, 51.10, 46.34, 39.71, 36.56, 34.32, 30.48, 28.52, 28.16, 24.43, 24.32, 23.08, 21.84; HRESIMS m/z: 548.3315 [M + H]+ (calcd for C29H46N3O7, 548.3335).
:hexane to afford 9 at 24% EtOAC as a white crystalline solid (326 mg, 85%).
Compound 9: [α]27D −71 (c 2.23, MeOH); 1H NMR (600 MHz, chloroform-d) δ 7.37–7.29 (m, 5H), 5.42 (dd, J = 10.9, 4.9 Hz, 1H), 5.22 (d, J = 9.2 Hz, 1H), 5.16 (d, J = 12.2 Hz, 1H), 5.06 (d, J = 12.3 Hz, 1H), 4.61 (td, J = 9.4, 4.5 Hz, 1H), 2.94 (s, 3H), 1.80–1.73 (m, 1H), 1.73–1.66 (m, 2H), 1.55–1.47 (m, 1H), 1.42 (s, 9H), 1.39 (m, 2H), 0.94 (d, J = 2.9 Hz, 3H), 0.92 (d, J = 3.1 Hz, 3H), 0.90 (d, J = 6.5 Hz, 3H), 0.87 (d, J = 6.7 Hz, 3H); 13C NMR (150 MHz, chloroform-d) δ 173.89, 171.47, 155.72, 135.43, 128.53, 128.34, 128.23, 79.35, 66.87, 54.41, 48.89, 41.88, 36.86, 30.76, 28.23, 24.66, 24.49, 23.30, 23.23, 21.75, 21.33; HRESIMS m/z: 471.2815 [M + Na]+ (calcd for C25H40N2O5Na; 471.2834).
:hexane to afford 11 (43 mg, 23%).
Compound 11: [α]27D −43 (c 0.43, MeOH); 1H NMR (600 MHz, DMSO-d6) δ 7.53 (d, J = 8.6 Hz, 1H), 7.40–7.32 (m, 5H), 5.38 (d, J = 5.8 Hz, 1H), 5.20 (dd, J = 11.4, 4.5 Hz, 1H), 5.13 (d, J = 12.4 Hz, 1H), 5.08 (d, J = 12.3 Hz, 1H), 4.81–4.76 (m, 1H), 3.71 (dd, J = 5.7, 3.6 Hz, 1H), 2.91 (s, 3H), 1.93 (m, 1H), 1.76 (ddd, J = 14.3, 11.4, 4.1 Hz, 1H), 1.61 (ddd, J = 14.4, 10.1, 4.5 Hz, 1H), 1.54 (m, 1H), 1.43–1.40 (m, 1H), 1.40–1.37 (m, 1H), 1.29 (ddd, J = 13.6, 9.1, 4.5 Hz, 1H), 0.87 (d, J = 2.8 Hz, 3H), 0.86 (d, J = 3.0 Hz, 3H), 0.83 (d, J = 6.5 Hz, 3H), 0.81 (d, J = 6.7 Hz, 3H), 0.79 (d, J = 6.5 Hz, 3H), 0.68 (d, J = 6.8 Hz, 3H); 13C NMR (150 MHz, DMSO-d6) δ 173.01, 172.59, 170.92, 135.73, 128.44, 128.16, 128.04, 74.96, 66.30, 53.96, 46.18, 40.57, 36.14, 31.44, 30.78, 24.16, 24.08, 23.11, 23.01, 21.49, 21.04, 19.05, 15.81; HRESIMS m/z: 471.2812 [M + Na]+ (calcd for C25H40N2O5Na; 471.2834.
To a solution of anhydrous DCM (3 mL) containing the deprotected products of 11 and 6 at 0 °C, DIEA (0.024 mL, 3 equiv.), HOAT (8.39 mg, 1.3 equiv., 0.0000617 mol) and EDC·HCl (11.8 mg, 1.3 equiv., 0.0000617 mol) were added and left to stir for 30 min. The mixture was warmed to room temperature and stirred overnight. After 20 h, solvent was evaporated, then the mixture was treated with EtOAC (50 mL) and washed with 0.5 N HCl, (2 × 10 mL), sat. NaHCO3 (2 × 10 mL) and brine (2 × 10 mL), dried over MgSO4, and dried down under vacuum. The residue was purified by the Isolera Biotage system using SNAP KP-Sil 10 g column and a gradient of EtOAC:hexane, followed by reversed phase HPLC purification using [SynergiHydro 10 × 4.6 mm; flow rate, 1 mL min−1; PDA detection 200–800 nm] using 55% MeCN/H2O to afford 1 (tR 19.8 min, 14.5 mg, 40%).
Compound 1: [α]27D −108 (c 0.27, MeOH); 1H NMR (600 MHz, DMSO-d6) δ 7.56 (d, J = 8.6 Hz, 1H), 7.26–7.17 (m, 5H), 7.04 (d, J = 9.5 Hz, 1H), 5.46 (t, J = 7.4 Hz, 1H), 5.39 (d, J = 5.6 Hz, 1H), 5.03 (t, J = 7.9 Hz, 1H), 4.78 (ddd, J = 10.0, 8.6, 4.1 Hz, 1H), 4.69 (d, J = 5.6 Hz, 1H), 4.28 (dd, J = 8.8, 3.5 Hz, 1H), 3.83–3.79 (m, 2H), 3.72 (dd, J = 5.3, 3.4 Hz, 1H), 3.57 (s, 3H), 3.53–3.50 (m, 1H), 3.38–3.34 (m, 1H), 3.09 (dd, J = −14.0, 7.3 Hz, 1H), 2.92 (s, 3H), 2.79 (s, 3H), 2.74 (dd, J = −14, 7.3, 1H), 2.34 (dd, J = 16.1, 6.8 Hz, 1H), 2.15–2.09 (m, 2H), 1.96–1.91 (m, 1H), 1.91–1.77 (m, 3H), 1.63–1.56 (m, 1H), 1.52 (t, J = 7.5 Hz, 2H), 1.50–1.27 (m, 5H), 1.16 (ddd, J = 13.5, 9.0, 4.3 Hz, 1H), 0.90–0.85 (m, 12H), 0.83 (dd, J = 6.6, 3.3 Hz, 3H), 0.79 (d, J = 6.5 Hz, 3H), 0.77 (dd, J = 6.5, 2.8 Hz, 3H), 0.71–0.69 (m, 3H); 13C NMR (150 MHz, DMSO-d6) δ 172.98, 172.30, 172.14, 170.59, 170.02, 168.00, 137.76, 129.00, 128.04, 126.14, 74.96, 68.74, 58.81, 54.56, 53.57, 51.72, 49.40, 46.36, 40.76, 40.19, 40.06, 36.86, 36.68, 34.28, 31.43, 30.54, 30.11, 28.54, 24.49, 24.37, 24.22, 24.13, 23.21, 23.13, 22.96, 21.65, 21.47, 19.08, 15.85; HRESIMS m/z: 810.4961 [M + Na]+ (calcd for C42H69N5O9Na, 810.4993), 788.5147 [M + H]+ (calcd for C42H70N5O9, 788.5174).
Conclusions
Grassystatin G (1), a new statine-containing linear peptide, was isolated from Caldora sp. collected from Guam. The structure of grassystatin G was elucidated by analysis of 1D, 2D NMR and MS/MS fragmentation data. The absolute configurations of its stereocenters were determined through chiral HPLC analysis and modified Marfey's method. Grassystatin G showed inhibitory activity against CatD and E, with a preference for CatD. This selective inhibition is distinct from the previously reported selectivity of other grassystatins and tasiamides. The molecular dynamic simulations show the importance of CatD Ser80 in the recognition of grassystatin G and positioning the pharmacophore towards the cathepsin Asp33/231 pair. Substitution of Ser80 by a Thr in CatE leads to loss of important interactions and weakens grassystatin G binding to CatE. In contrast, simulations of grassystatin C show the importance of CatE residues Gln307 and His312 in substrate recognition, and positioning of the statine unit for interaction with Asp33/231. The substitution of these residues by Met and Pro in CatD leads to loss of multiple interactions, reflected in the lower activity towards CatD. MM-GBSA binding free energy calculations corroborate the analysis, reproducing the experimental trends.Our biological characterization showed that grassystatin G affected the viability of MDA-MB-231 cells and enhanced their response to TRAIL, an apoptosis-inducing ligand, at specific concentrations. The findings from RNA-seq suggested the role of CatD in actin remodeling, the induction of ER stress and the unfolded protein response, and the potential synergy between death receptors in enhancing apoptotic signaling as responses to the combined grassystatin G and TRAIL treatment.
Further investigations are needed to understand the precise molecular mechanisms of grassystatin G and TRAIL in MDA-MB-231 breast cancer cells. Moreover, structure–activity relationship studies should be performed to optimize the potency and selectivity of grassystatin G and to design novel derivatives with improved drug-like properties.
Data availability
The data supporting this article has been included as part of the ESI.†Author contributions
Conceptualization, L. A. E. and H. L.; sample collection: V. J. P.; methodology, L. A. E., G. S. and H. L.; formal analysis, L. A. E. and G. S.; investigation, L. A. E., G. S., and V. J. P.; resources, H. L. and V. J. P.; data curation, L. A. E.; writing – original draft preparation, L. A. E.; writing – review and editing, L. A. E., H. L., G. S. and V. J. P.; visualization, L. A. E. and G. S.; supervision, H. L.; project administration, H. L.; funding acquisition, H. L. and L. A. E. All authors have read and agreed to the published version of the manuscript.Conflicts of interest
There are no conflicts to declare.Acknowledgements
This research was supported by the National Institutes of Health, NCI grant R01CA172310 (to H. L.), NIGMS grants T32GM136583: Chemistry–Biology Interface Training Program at the University of Florida (to L. A. E.) and F31GM143915 (to L. A. E.), and the Debbie and Sylvia DeSantis Chair Professorship (to H. L.). We thank students and staff of the UOGML for assisting V. J. P. with collecting the sample in Guam. We thank the Guam Department of Agriculture Division of Aquatic and Wildlife Resources for collection permits.References
- P. Benes, V. Vetvicka and M. Fusek, Cathepsin D--many functions of one aspartic protease, Crit. Rev. Oncol. Hematol., 2008, 68(1), 12–28, DOI:10.1016/j.critrevonc.2008.02.008.
- O. Mijanovic, A. I. Petushkova, A. Brankovic, B. Turk, A. B. Solovieva, A. I. Nikitkina, S. Bolevich, P. S. Timashev, A. Parodi and A. A. Zamyatnin, Cathepsin D-Managing the Delicate Balance, Pharmaceutics, 2021, 13(6) DOI:10.3390/pharmaceutics13060837.
- G. Klebe, Aspartic Protease Inhibitors, ed. G. Klebe, Springer, Berlin, Heidelberg, 2013, DOI:10.1007/978-3-642-17907-5_24.
- M. Garcia, N. Platet, E. Liaudet, V. Laurent, D. Derocq, J. P. Brouillet and H. Rochefort, Biological and clinical significance of cathepsin D in breast cancer metastasis, Stem Cells, 1996, 14(6), 642–650, DOI:10.1002/stem.140642.
- A. Ratna and S. Das, Role of Cathepsins, in Particular Cathepsins B and D in Breast Cancer: Mechanisms and Clinical Implications, Springer, Singapore, 2017, DOI:10.1007/978-981-10-6141-7_8.
- E. Guerra, A. Cimadamore, P. Simeone, G. Vacca, R. Lattanzio, G. Botti, V. Gatta, M. D'Aurora, B. Simionati and M. Piantelli, et al., p53, cathepsin D, Bcl-2 are joint prognostic indicators of breast cancer metastatic spreading, BMC Cancer, 2016, 16, 649, DOI:10.1186/s12885-016-2713-3.
- D. Luo, Q. Y. Chen and H. Luesch, Total Synthesis of the Potent Marine-Derived Elastase Inhibitor Lyngbyastatin 7 and in Vitro Biological Evaluation in Model Systems for Pulmonary Diseases, J. Org. Chem., 2016, 81(2), 532–544, DOI:10.1021/acs.joc.5b02386.
- B. Miller, A. J. Friedman, H. Choi, J. Hogan, J. A. McCammon, V. Hook and W. H. Gerwick, The marine cyanobacterial metabolite gallinamide A is a potent and selective inhibitor of human cathepsin L, J. Nat. Prod., 2014, 77(1), 92–99, DOI:10.1021/np400727r.
- K. Taori, S. Matthew, J. R. Rocca, V. J. Paul and H. Luesch, Lyngbyastatins 5-7, potent elastase inhibitors from Floridian marine cyanobacteria, Lyngbya spp., J. Nat. Prod., 2007, 70(10), 1593–1600, DOI:10.1021/np0702436.
- J. C. Kwan, K. Taori, V. J. Paul and H. Luesch, Lyngbyastatins 8-10, elastase inhibitors with cyclic depsipeptide scaffolds isolated from the marine cyanobacterium Lyngbya semiplena, Mar. Drugs, 2009, 7(4), 528–538, DOI:10.3390/md7040528.
- F. H. Al-Awadhi and H. Luesch, Targeting eukaryotic proteases for natural products-based drug development, Nat. Prod. Rep., 2020, 37(6), 827–860, 10.1039/c9np00060g.
- F. H. Al-Awadhi, B. K. Law, V. J. Paul and H. Luesch, Grassystatins D-F, Potent Aspartic Protease Inhibitors from Marine Cyanobacteria as Potential Antimetastatic Agents Targeting Invasive Breast Cancer, J. Nat. Prod., 2017, 80(11), 2969–2986, DOI:10.1021/acs.jnatprod.7b00551.
- J. C. Kwan, E. A. Eksioglu, C. Liu, V. J. Paul and H. Luesch, Grassystatins A-C from marine cyanobacteria, potent cathepsin E inhibitors that reduce antigen presentation, J. Med. Chem., 2009, 52(18), 5732–5747, DOI:10.1021/jm9009394.
- F. H. Al-Awadhi, R. Ratnayake, V. J. Paul and H. Luesch, Tasiamide F, a potent inhibitor of cathepsins D and E from a marine cyanobacterium, Bioorg. Med. Chem., 2016, 24(15), 3276–3282, DOI:10.1016/j.bmc.2016.04.062.
- P. G. Williams, W. Y. Yoshida, R. E. Moore and V. J. Paul, The isolation and structure elucidation of Tasiamide B, a 4-amino-3-hydroxy-5-phenylpentanoic acid containing peptide from the marine Cyanobacterium Symploca sp., J. Nat. Prod., 2003, 66(7), 1006–1009, DOI:10.1021/np030114z.
- S. L. Cole and R. Vassar, The Alzheimer's disease beta-secretase enzyme, BACE1, Mol. Neurodegener., 2007, 2, 22, DOI:10.1186/1750-1326-2-22.
- Y. Liu, W. Zhang, L. Li, L. A. Salvador, T. Chen, W. Chen, K. M. Felsenstein, T. B. Ladd, A. R. Price and T. E. Golde, et al., Cyanobacterial peptides as a prototype for the design of potent β-secretase inhibitors and the development of selective chemical probes for other aspartic proteases, J. Med. Chem., 2012, 55(23), 10749–10765, DOI:10.1021/jm301630s.
- S. P. Gunasekera, Y. Li, R. Ratnayake, D. Luo, J. Lo, J. H. Reibenspies, Z. Xu, M. J. Clare-Salzler, T. Ye and V. J. Paul, et al., Discovery, Total Synthesis and Key Structural Elements for the Immunosuppressive Activity of Cocosolide, a Symmetrical Glycosylated Macrolide Dimer from Marine Cyanobacteria, Chemistry, 2016, 22(24), 8158–8166, DOI:10.1002/chem.201600674.
- P. Sullivan, A. Krunic, L. J. Davis, H. S. Kim, J. E. Burdette and J. Orjala, Phormidepistatin from the Cyanobacterium UIC 10484: Assessing the Phylogenetic Distribution of the Statine Pharmacophore, J. Nat. Prod., 2021, 84(8), 2256–2264, DOI:10.1021/acs.jnatprod.1c00334.
- D. X. Hu, P. Grice and S. V. Ley, Rotamers or diastereomers? An overlooked NMR solution, J. Org. Chem., 2012, 77(11), 5198–5202, DOI:10.1021/jo300734r.
- S. U. Seo, S. M. Woo, S. S. Im, Y. Jang, E. Han, S. H. Kim, H. Lee, H. S. Lee, J. O. Nam and E. Gabrielson, et al., Cathepsin D as a potential therapeutic target to enhance anticancer drug-induced apoptosis via RNF183-mediated destabilization of Bcl-xL in cancer cells, Cell Death Dis., 2022, 13(2), 115, DOI:10.1038/s41419-022-04581-7.
- J. Foucquier and M. Guedj, Analysis of drug combinations: current methodological landscape, Pharmacol. Res. Perspect., 2015, 3(3), e00149, DOI:10.1002/prp2.149.
- L. Zhang and B. Fang, Mechanisms of resistance to TRAIL-induced apoptosis in cancer, Cancer Gene Ther., 2005, 12(3), 228–237, DOI:10.1038/sj.cgt.7700792.
- Y. J. Liu, T. Zhang, S. Chen, D. Cheng, C. Wu, X. Wang, D. Duan, L. Zhu, H. Lou and Z. Gong, et al., The noncanonical role of the protease cathepsin D as a cofilin phosphatase, Cell Res., 2021, 31(7), 801–813, DOI:10.1038/s41422-020-00454-w.
- Y. J. Liu, T. Zhang, D. Cheng, J. Yang, S. Chen, X. Wang, X. Li, D. Duan, H. Lou and L. Zhu, et al., Late endosomes promote microglia migration via cytosolic translocation of immature protease cathD, Sci. Adv., 2020, 6(50) DOI:10.1126/sciadv.aba5783.
- C. Hetz, The unfolded protein response: controlling cell fate decisions under ER stress and beyond, Nat. Rev. Mol. Cell Biol., 2012, 13(2), 89–102, DOI:10.1038/nrm3270.
- Y. Huang, K. Arora, K. S. Mun, F. Yang, C. Moon, S. Yarlagadda, A. Jegga, T. Weaver and A. P. Naren, Targeting DNAJB9, a novel ER luminal co-chaperone, to rescue ΔF508-CFTR, Sci. Rep., 2019, 9(1), 9808, DOI:10.1038/s41598-019-46161-4.
- A. G. Shergalis, S. Hu, A. Bankhead and N. Neamati, Role of the ERO1-PDI interaction in oxidative protein folding and disease, Pharmacol. Ther., 2020, 210, 107525, DOI:10.1016/j.pharmthera.2020.107525.
- R. Caruso, N. Warner, N. Inohara and G. Núñez, NOD1 and NOD2: signaling, host defense, and inflammatory disease, Immunity, 2014, 41(6), 898–908, DOI:10.1016/j.immuni.2014.12.010.
- A. M. Keestra-Gounder, M. X. Byndloss, N. Seyffert, B. M. Young, A. Chávez-Arroyo, A. Y. Tsai, S. A. Cevallos, M. G. Winter, O. H. Pham and C. R. Tiffany, et al., NOD1 and NOD2 signalling links ER stress with inflammation, Nature, 2016, 532(7599), 394–397, DOI:10.1038/nature17631.
- A. Annibaldi and H. Walczak, Death Receptors and Their Ligands in Inflammatory Disease and Cancer, Cold Spring Harbor Perspect. Biol., 2020, 12(9) DOI:10.1101/cshperspect.a036384.
- N. Engene, A. Tronholm, L. A. Salvador-Reyes, H. Luesch and V. J. Paul, Caldora penicillata gen. nov., comb. nov. (cyanobacteria), a pantropical marine species with biomedical relevance, J. Phycol., 2015, 51(4), 670–681, DOI:10.1111/jpy.12309.
- E. T. Baldwin, T. N. Bhat, S. Gulnik, M. V. Hosur, R. C. Sowder, R. E. Cachau, J. Collins, A. M. Silva and J. W. Erickson, Crystal structures of native and inhibited forms of human cathepsin D: implications for lysosomal targeting and drug design, Proc. Natl. Acad. Sci. U. S. A., 1993, 90(14), 6796–6800, DOI:10.1073/pnas.90.14.6796.
- K. Bowers, D. Chow, H. Xu, R. Dror, M. Eastwood, B. Gregersen, J. Klepeis, I. Kolossvary, M. Moraes and F. Sacerdoti, et al., Scalable Algorithms for Molecular Dynamics Simulations on Commodity Clusters, SC '06: Proceedings of the 2006 ACM/IEEE Conference on Supercomputing, Tampa, FL, USA, 2006, pp. 43–43, DOI:10.1109/SC.2006.54.
Footnote |
| † Electronic supplementary information (ESI) available. See DOI: https://doi.org/10.1039/d5md00017c |
| This journal is © The Royal Society of Chemistry 2025 |