
 Open Access Article
 This Open Access Article is licensed under a
 Creative Commons Attribution 3.0 Unported Licence
Chiral bioderived supercapacitor electrodes based on cellulose nanocrystals†
Sai Gowtham
Allu
,
Mirina E.
Enderlin
and
Paraskevi
Flouda
 *
*
Department of Chemical and Environmental Engineering, University of Arizona, Tucson, AZ 85721, USA. E-mail: flouda@arizona.edu
First published on 19th June 2025
Abstract
The advancement of high-performance thin-film electrodes for next-generation supercapacitors is often hindered by the high cost and aggregation behavior of two-dimensional nanomaterials such as reduced graphene oxide (rGO). Here, we demonstrate that integrating rGO into a chiral, bio-derived matrix of cellulose nanocrystals (CNCs) via evaporation-induced self-assembly can simultaneously improve electrochemical performance and reduce rGO loading. Specifically, we investigate how CNC chirality directs rGO dispersion and modulates ionic transport pathways through hydrogen bonding and structural templating. The resulting CNC/rGO nanocomposites retain key features of chiral organization and exhibit reduced rGO restacking. The optimized CNC/10 wt% rGO composite achieved a specific capacitance of 209 F g−1 at 20 mV s−1 and 224 F g−1 at 2.0 A g−1, representing a 93% improvement over pure rGO, along with a volumetric energy density of 17.6 W h L−1 at 204 W L−1 and stable performance across a wide power range. This work offers a scalable and sustainable route to engineer nanostructured electrodes, revealing how chirality in bio-based materials can be harnessed to enhance charge storage and ion accessibility.
1. Introduction
The increasing demand for efficient energy storage is driven by the rapid growth of technologies such as electric vehicles, autonomous systems, and advanced robotics.1 Among the various electrode materials investigated, two-dimensional nanomaterials like reduced graphene oxide (rGO) have shown considerable promise due to their high electrical conductivity (∼106 S cm−1), large surface area (up to 2630 m2 g−1), and excellent mechanical properties (Young's modulus ∼1.1 TPa for a graphene monolayer).2 However, practical implementation of rGO-based electrodes is often limited by high synthesis costs, potential toxicity, and the tendency of nanosheets to agglomerate and restack, which reduces accessible surface area and hinders charge storage performance.3,4 One potential strategy to overcome these challenges is the incorporation of bio-derived polymers, which can act as dispersing and structuring agents, minimizing rGO aggregation and enabling efficient performance at lower rGO loadings.Among bio-derived polymers, cellulose stands out as a particularly promising candidate due to its natural abundance, low density, and rich surface chemistry.5,6 Its properties are largely governed by extensive hydrogen bonding between polymer chains, which influences both mechanical strength and chemical reactivity.5,6 Depending on the processing method, cellulose can be converted into nanofiber or nanocrystal forms.7,8 Cellulose nanofibers (CNFs) typically have diameters of 3–4 nm and lengths up to 0.5 μm, and have been widely investigated as polymeric binders in electrode materials due to their flexibility and high aspect ratio.9 In contrast, cellulose nanocrystals (CNCs) are rigid, rod-like structures with average diameters of approximately 6.1 nm and lengths around 165 nm and have been extensively studied for their photonic properties.9–11 CNCs are particularly attractive because of their ability to self-assemble into left handed chiral nematic phases at concentrations above 4.7 wt%,12 enabling the formation of highly ordered nanostructures.8,13–16
To date, only a handful of studies have investigated the use of CNCs in energy storage applications.17–19 For instance, CNC-based aerogels incorporating iron oxide and cobalt oxide nanoparticles have been developed as supercapacitor electrodes.17 Upon carbonization and activation at elevated temperatures up to 900 °C, the resulting aerogels exhibited a specific capacitance of 294 F g−1 at a scan rate of 50 mV s−1 and retained 92.4% of their capacitance after 2500 charge–discharge cycles.17 In another study, CNC/GeO2 aerogels were fabricated by integrating GeO2 nanoparticles into the CNC matrix through controlled hydrolysis and condensation.19 This approach enhanced electron transport pathways, resulting in a specific capacitance of 114 F g−1 at 50 mV s−1 and a capacitance retention of 95% after 3000 cycles.19 Additionally, helical metal–organic framework (MOF) composites were synthesized via in situ growth of zeolitic imidazolate frameworks on CNCs, followed by carbonization.20 These MOF/CNC composites reached 172 F g−1 at 0.1 A g−1 and 70 F g−1 at 10 A g−1.20 While these systems highlight CNCs as effective structural templates, they rely on pseudocapacitive materials or extensive thermal processing. Moreover, none of them directly examines the effect of CNC chirality or long-range ordering on ion transport, charge accessibility, or electrode architecture.
In this work, we sought to combine, for the first time, the chiral assembly of CNCs with the electrochemical properties of rGO to enhance supercapacitor electrode performance. Although CNCs are electrically insulating, they play a critical structural role in the composite, facilitating uniform rGO dispersion, suppressing sheet restacking, and guiding the formation of chiral architectures that enhance ion accessibility. In this composite system, CNCs serve as chiral structural hosts, while rGO serves as the electrochemically active component. The two materials were processed into free-standing electrodes using slow evaporation-induced self-assembly (EISA), enabling the formation of hierarchical, chiral morphologies. Electrodes with varying rGO content (5–50 wt%) were evaluated for mechanical and electrochemical performance using tensile testing, cyclic voltammetry, and galvanostatic charge–discharge cycling. Compared to pure rGO electrodes, CNC/rGO composites exhibited remarkedly improved electrochemical stability at high specific currents, even with rGO content as low as 10 wt%. This study highlights the critical role of chiral CNC assembly in tuning nanocomposite electrode behavior and demonstrates their potential for energy storage applications where both weight and space constraints are key considerations.
2. Experimental section
2.1 Preparation of cellulose nanocrystals (CNCs)
Cellulose nanocrystals were prepared by acid hydrolysis, according to prior reports.8,9,21 Initially, 17 g of wood pulp were cut into small pieces and were slowly added into a 150 ml of 64 wt% sulfuric acid solution, followed by stirring at 45 °C for 1 hour. Next, the mixture was diluted with ultra-pure water (to 1000–1400 ml) and was left overnight to separate the hydrolyzed cellulose. The suspension was collected and centrifuged twice at 6000 rpm for 5 min. The centrifuge tubes were filled again with ultra-pure water to redisperse the sediment and transferred into a beaker for dialysis against ultra-pure water using a dialysis tube (14![[thin space (1/6-em)]](https://www.rsc.org/images/entities/char_2009.gif) 000 Da, Ward's Science) for 10 days. The cellulose mixture was then placed into a beaker and stirred for 15 min to avoid aggregation, followed by two more rounds of centrifugation at 11000 rpm for 20 min. Finally, the supernatant was subjected to tip sonication using a 4208-B Thermofisher sonicator for 4 min 30 s with 5 s on/off pulse at 40% amplitude. Through this process, CNCs in water with a concentration of 6 mg ml−1 were obtained.
000 Da, Ward's Science) for 10 days. The cellulose mixture was then placed into a beaker and stirred for 15 min to avoid aggregation, followed by two more rounds of centrifugation at 11000 rpm for 20 min. Finally, the supernatant was subjected to tip sonication using a 4208-B Thermofisher sonicator for 4 min 30 s with 5 s on/off pulse at 40% amplitude. Through this process, CNCs in water with a concentration of 6 mg ml−1 were obtained.
2.2 Preparation of graphene oxide (GO)
Graphene oxide was prepared following a modified Hummers’ method, according to previous reports.22,23 Initially, 1.5 g of graphite was mixed with 1.2 g of NaNO3 and 60 ml of sulfuric acid (ACS reagent-grade, 95–98%). The mixture was stirred in an ice bath for 5 hours. 7.5 g of KMnO4 were added gradually while the temperature was maintained below 20 °C. Then the mixture was heated at 35 °C for 2 hours and 125 ml of ultra-pure water were added to the mixture. The mixture was stirred for 10 min followed by addition of 350 ml of water and stirred for 10 min again. 10 ml of 30% hydrogen peroxide were added to terminate the reaction, followed by the addition of 531 ml of 5% hydrochloric acid. The dispersant was stirred overnight, it was then centrifuged for 5 min at 5000 rpm twice. The precipitated cake was redispersed again in ultra-pure water and placed in dialysis tubes of 14000 Da (Ward's Science). The water was changed every 2–4 hours till the pH reached 7. The obtained mixture was tip sonicated for at least 2 hours at 90% amplitude with 3 s on/off using a 4208-B Thermofisher sonicator. Through this process, graphene oxide of 3 mg ml−1 in water was obtained.
2.3 Preparation of CNC/rGO nanocomposites
Thin film nanocomposites were prepared by mixing CNCs (6 mg ml−1) and GO (3 mg ml−1) in water at desired ratios (GO content in CNC/GO: 5, 10, 20, 30, 40, and 50 wt%) while carefully avoiding agglomeration. The mixtures were stirred for 1 hour, followed by drop-casting onto a 15 mm diameter Petri dish for slow evaporation self-assembly. Once dried in air, the films were carefully removed from the Petri dishes, yielding free-standing CNC/GO films.Pure CNC films were prepared using the same procedure. In contrast, pure GO films were obtained via vacuum filtration of 45 ml of GO in water at a concentration of 3 mg ml−1 using a Nylon membrane (47 mm diameter, 200 nm pore size). The GO films were washed with deionized water, peeled off the filter paper, and air-dried overnight. Vacuum filtration was chosen over drop-casting for GO films to prevent adhesion to the Petri dishes. The films were cut to the required dimensions for characterization and placed in a vacuum oven at 220 °C for 2 hours to achieve GO reduction, forming CNC/rGO nanocomposites.
2.4 Chemical, thermal, and morphological characterization
UV/Vis spectra were collected using a Double beam MSE PRO MA0616 series UV/Vis spectrophotometer at a wavelength range of 190–800 nm. Attenuated total reflectance Fourier transform infrared (ATR-FTIR) spectra in the range of 675–4000 cm−1 were collected using a Thermo fisher Nicolet iS50R FT-IR spectrometer with a resolution of 2 cm−1. Raman spectroscopy data were collected using a Renishaw Invia Raman Microscope with a 514 nm Laser, 2400 grating in the range of 500–4000 cm−1. The spectral baseline was fitted using Origin pro software.Thermal gravimetric analysis (TGA) was conducted on films before and after reduction using a TA instruments Discovery TGA 5500. The temperature was varied from room temperature to 700 °C with a heating rate of 10 °C min−1 in N2.
Contact angle measurements were performed by placing a 10 μL droplet of 6 M KOH electrolyte on the fabricated electrodes. A photograph was taken within 10 seconds, and the contact angle was analyzed using ImageJ software with the LBADSA drop analysis plugin. Each measurement was repeated three times.
Conductivity was determined using a CMT-SR2000N four-point probe. The reduced films were placed on a glass slide and tested for resistance. Conductivity (σ) was calculated using the formula:  where R denotes the resistance of the sample, A denotes the cross-sectional area, and l denotes the distance between the inner probes.24,25
Scanning electron microscopy (SEM) imaging was conducted to investigate the cross-sectional area of the composites. A Hitachi S-4800 cold FEG SEM was used for composites, with samples placed vertically and secured with carbon tape. The cellulose-containing samples were sputter-coated with an 8 nm platinum layer (Leica EM ACE 600). Pure GO samples were analyzed with an FEI Inspection SEM, placed on 45° stubs, and secured with carbon tape. Freshly cut films were imaged, and cross-sectional views were obtained by tilting the stage. Before analysis, the pure GO samples were sputter-coated with gold for 90 seconds.
Polarized optical microscopy was performed using an Olympus microscope operating in dark-field mode, enabling visualization of birefringent textures. Atomic force microscopy (AFM) was performed in air using a Bruker Dimension Icon system operating in tapping mode. Scans were acquired at a resolution of 512 × 512 pixels and a scan rate of 0.5 Hz using HQ:XSC11/AL BS probes (spring constant: 1.1–5.6 N m−1; tip radius ∼8 nm).
2.5 Mechanical characterization
Tensile testing was performed using a TA Instruments DMA 850. Composite films were cut into rectangular strips for testing. The length (∼1.5 cm), width (∼0.5 cm), and thickness (15–255 μm) of each sample were measured using vernier calipers and a micrometer prior to loading. Samples were mounted using a single-screw film clamp setup, with clamping torque applied between 0.6 and 2 in lb, depending on the composite. A constant strain rate of 1 mm min−1 and a preload force of 0.02 N were used for all tests. For each composition, five samples were tested, and results were compared using box plots. Tensile stress–strain curves were used to extract key mechanical parameters including Young's modulus, tensile strength, toughness, and elongation at break. Young's modulus was calculated from the slope of the initial linear region of the stress–strain curve, while toughness was determined by integrating the area under the curve.26 All tests were conducted in room conditions (temperature: 20–22 °C and humidity between 30 to 50%).2.6 Electrochemical characterization
Samples were cut into 15 mm diameter circles and assembled into two-electrode coin cells (CR2032) with 120 μL of 6 M KOH as the electrolyte. The cells consisted of two 15 mm diameter carbon paper pieces as current collectors, a 20 mm diameter Celgard 3501 microporous membrane separator, two spacers, and a spring. The total electrode mass of two electrodes ranged from 6 to 11 mg, with thickness values in the μm range. Electrochemical testing was conducted using a Biologic VMP-3e multichannel potentiostat.Cyclic voltammetry (CV) readings were obtained by varying the potential from 0 to 1 V at scan rates ranging from 1 to 200 mV s−1. The specific capacitance was calculated using the formula:  where m is the total electrochemically active mass of both electrodes (g), I is the current (A), V is the voltage (V), ΔV is the potential window, v is the scan rate (V s−1), and V+ and V− are the high and low voltage cutoff, respectively.27
Galvanostatic charge–discharge (GCD) measurements were performed by varying the cell potential between 0 and 1 V at specific currents ranging from 0.2 to 2.0 A g−1. The specific capacitance was calculated using the equation: C = 4·I·Δt/(m·ΔV), where I is the current (A), ΔV is the potential window (V), Δt is the discharge time (s), and m the total active mass of both electrodes (g).27 Prolonged galvanostatic charge–discharge cycling was performed at specific currents ranging from 0.5 A g−1 to 5 A g−1. Each supercapacitor was subjected to 10000 cycles at 0.5 A g−1, followed by 2 A g−1, 5 A g−1, and again at 0.5 A g−1 to evaluate cycling stability and rate performance. Electrochemical impedance spectroscopy (EIS) was conducted on the symmetric two electrode coin cells with an amplitude of 10 mV in the frequency range of 5 mHz to 1 MHz.
3. Results and discussion
Free-standing CNC/rGO nanocomposite films were fabricated using slow evaporation-induced self-assembly to maintain the inherent CNC chirality (Fig. 1(a)). Specifically, aqueous dispersions of CNCs and GO were mixed at controlled ratios and drop-cast onto Petri dishes. The resulting thin films were thermally reduced at 220 °C to partially restore GO's electrical conductivity.28 In the resulting structure, reduced GO (rGO) stacks serve as the electrochemically active component, while CNCs provide the chiral structure and mechanical support, ensuring uniform dispersion and stability within the composite films. The interaction between CNCs and rGO is primarily governed by hydrogen bonding between the CNC hydroxyl groups and the rGO oxygen-containing functional groups, facilitating both structural integrity and effective load transfer within the nanocomposites.29 | ||
| Fig. 1 (a) Schematic representation of the chiral CNC/rGO electrode fabrication, (b) and (c) FTIR spectra before (b) and after (c) thermal reduction of CNC, GO, CNC/10 wt% GO, and CNC/50 wt% GO. (d) TGA analysis of CNC, GO, CNC/10 wt% GO, and CNC/50 wt% GO before (solid lines) and after (dashed lines) reduction. | ||
FTIR analysis confirmed the successful incorporation of GO into CNC films by identifying characteristic functional groups of both components, as shown in Fig. 1(b). Pure CNC films exhibited key peaks related to the cellulose structure, including C–O–S symmetric stretching vibration at 807 cm−1, C–O stretching at 1054 cm−1, β-glucosidic linkages at 1161 cm−1, and hydroxyl (–OH) bending at 1645 cm−1.30–32 The presence of GO in the nanocomposite films was verified by the emergence of new peaks at 1621 cm−1 and 1712 cm−1, corresponding to C![[double bond, length as m-dash]](https://www.rsc.org/images/entities/char_e001.gif) C and CO functional groups, respectively.33,34
C and CO functional groups, respectively.33,34
Thermal reduction of the composite films was confirmed by FTIR spectroscopy, which demonstrated the removal of oxygen-containing functional groups (Fig. 1(c)). Compared to unreduced samples, CNC/rGO composites exhibited fewer peaks, with significant reductions in the –OH bending at 1645 cm−1 and the broad –OH stretching at 3246–3356 cm−1.33 In addition, an increase in the intensity of the CC stretching vibration characteristic of sp2 hybridized carbon was observed at 1621 cm−1.33 Successful reduction was further verified by Raman spectroscopy (Fig. S1, ESI†), where the intensity ratio of the D band (∼1347 cm−1, associated with structural defects) to the G band (∼1602 cm−1, related to sp2 carbon domains) decreased from 0.87 (pristine GO) to 0.85 in the reduced samples.35 This decrease indicates the heterogeneous reformation of sp2-hybridized graphitic regions throughout the rGO matrix, not limited to the surface.35,36 These spectral changes confirm the successful reduction of GO, leading to enhanced electrical conductivity in the nanocomposite films.
Thermogravimetric analysis further supported the successful incorporation of GO and thermal reduction by revealing changes in thermal stability, as shown in Fig. 1(d). The initial weight loss observed between 100–200 °C in all samples is attributed to the removal of residual moisture and labile oxygen-containing functional groups.37 Pure CNC films exhibited significant mass loss around 250–500 °C due to cellulose degradation, whereas GO-containing composites showed improved thermal stability.30 Upon thermal reduction, the composites exhibited even greater stability, with the degradation temperature shifting from 133–143 °C to 306–352 °C. This substantial increase supports the effective removal of oxygen-containing functional groups and the formation of a more thermally stable, graphitic structure in the reduced films.
3.1 Electrode morphology
Cross-sectional SEM analysis revealed distinct internal organizations among the composite films. Pure CNC films exhibited a uniform structure with a characteristic wavy, twisted pattern, indicative of their chiral nature (Fig. 2(a) and (d)). In contrast, pure GO films exhibited highly layered structures, consistent with previous reports in the literature (Fig. S2, ESI†).27,37 When GO was incorporated into the CNC matrix, the chiral structure remained visible but appeared less pronounced, likely due to the disruption of CNC alignment by the incorporation of GO sheets (Fig. 2(b), (c) and Fig. S2, ESI†). This indicates that while GO is integrated into the CNC network, it modulates the degree of order within the chiral domains. The insets in Fig. 2(a)–(c), taken under crossed polarizers, display distinct birefringence patterns associated with retained chiral nematic ordering.14,38 This optical response provides further evidence that the CNC's chiral architecture is partially preserved within the composite films, even at high GO loadings. Supporting this, UV-Vis spectroscopy showed a progressive decrease in transmittance with increasing GO content (Fig. S3, ESI†), consistent with the incorporation of optically dense rGO structures. | ||
| Fig. 2 SEM images of (a) CNC, (b) CNC/10 wt% GO, and (c) CNC/50 wt% GO. Higher magnification images of (d) CNC and (e) CNC/10 wt% rGO. (f) Schematic illustration of CNC/rGO composite assembly. The red box in panel (e) highlights a region where the curved, helical arrangement is visible, indicative of chiral nematic ordering within the CNC/10 wt% rGO composite. Insets in (a)–(c) show optical images of the corresponding films placed between two polarizers at 90°, highlighting birefringence and chiral ordering. | ||
Comparing unreduced and reduced samples, thermal reduction generally led to an increase in film thickness (Fig. 2, Fig. S2, S4, and Table S1, ESI†). For example, the thickness of the CNC/10 wt% rGO composite increased from approximately 9 μm to 14 μm after reduction. In contrast, the CNC/50 wt% rGO composite showed a much more substantial increase, from 23 μm to 255 μm—similar to the behavior of pure rGO films, which expanded from 6.5 μm to 143 μm. This expansion is primarily attributed to the removal of water and moisture trapped between the layers during thermal reduction. Additionally, the disruption of CNC chiral ordering and the crumpling of rGO sheets may contribute to the swelling observed in composites with high rGO content. Notably, the thickness increase for rGO exceeded values reported in previous studies, likely due to the omission of a three-day drying step at 80 °C that is commonly used to slowly evaporate residual moisture.27,37 This step was excluded to streamline processing and reduce fabrication time. The resulting increase in thickness suggests greater interlayer spacing and structural relaxation. These observations indicate that at higher rGO content, thermal treatment promotes enhanced network expansion.
Further examination at higher magnification confirmed the presence of chiral structures in the reduced composite films (Fig. 2(e)). Notably, the CNC/10 wt% rGO composite retained localized chiral organization after thermal reduction, suggesting that the process did not significantly disrupt the self-assembled structure. Based on the SEM images, we hypothesize that rGO sheets are intercalated between CNC chiral domains, consistent with the schematic representation shown in Fig. 2(f). Polarized optical microscopy (Fig. S5, ESI†) and AFM images (Fig. S6, ESI†) further support the chiral assembly, as evidenced by the characteristic fingerprint-like textures and twisted CNC patterns.39
The reduced CNC films exhibited a smoother cross-section compared to the other samples (Fig. S4, ESI†), with collapsed CNC layers and visible cracks. In contrast, CNC/10 wt% rGO composites retained well-defined cross-sectional features, indicating better structural preservation. This improvement is attributed to strong interactions between CNCs and rGO such as hydrogen bonding and π–π stacking which reinforce the composite framework and promote more uniform distribution of thermal and mechanical stress. These interactions help prevent layer collapse and minimize structural degradation during thermal reduction, thereby enhancing the overall structural integrity of the composite.
3.2 Mechanical properties and electrical conductivity
The mechanical properties of reduced CNC, rGO, and CNC/rGO composites were investigated using uniaxial tensile testing (Fig. 3(a)–(c), Fig. S7 and Table S2, ESI†). All samples exhibited typical linear stress–strain behavior characteristic of rGO-containing nanocomposite thin-film electrodes.23,27 Key mechanical parameters including Young's modulus, ultimate tensile strength, strain at break, and toughness were extracted and plotted to assess the effect of composition.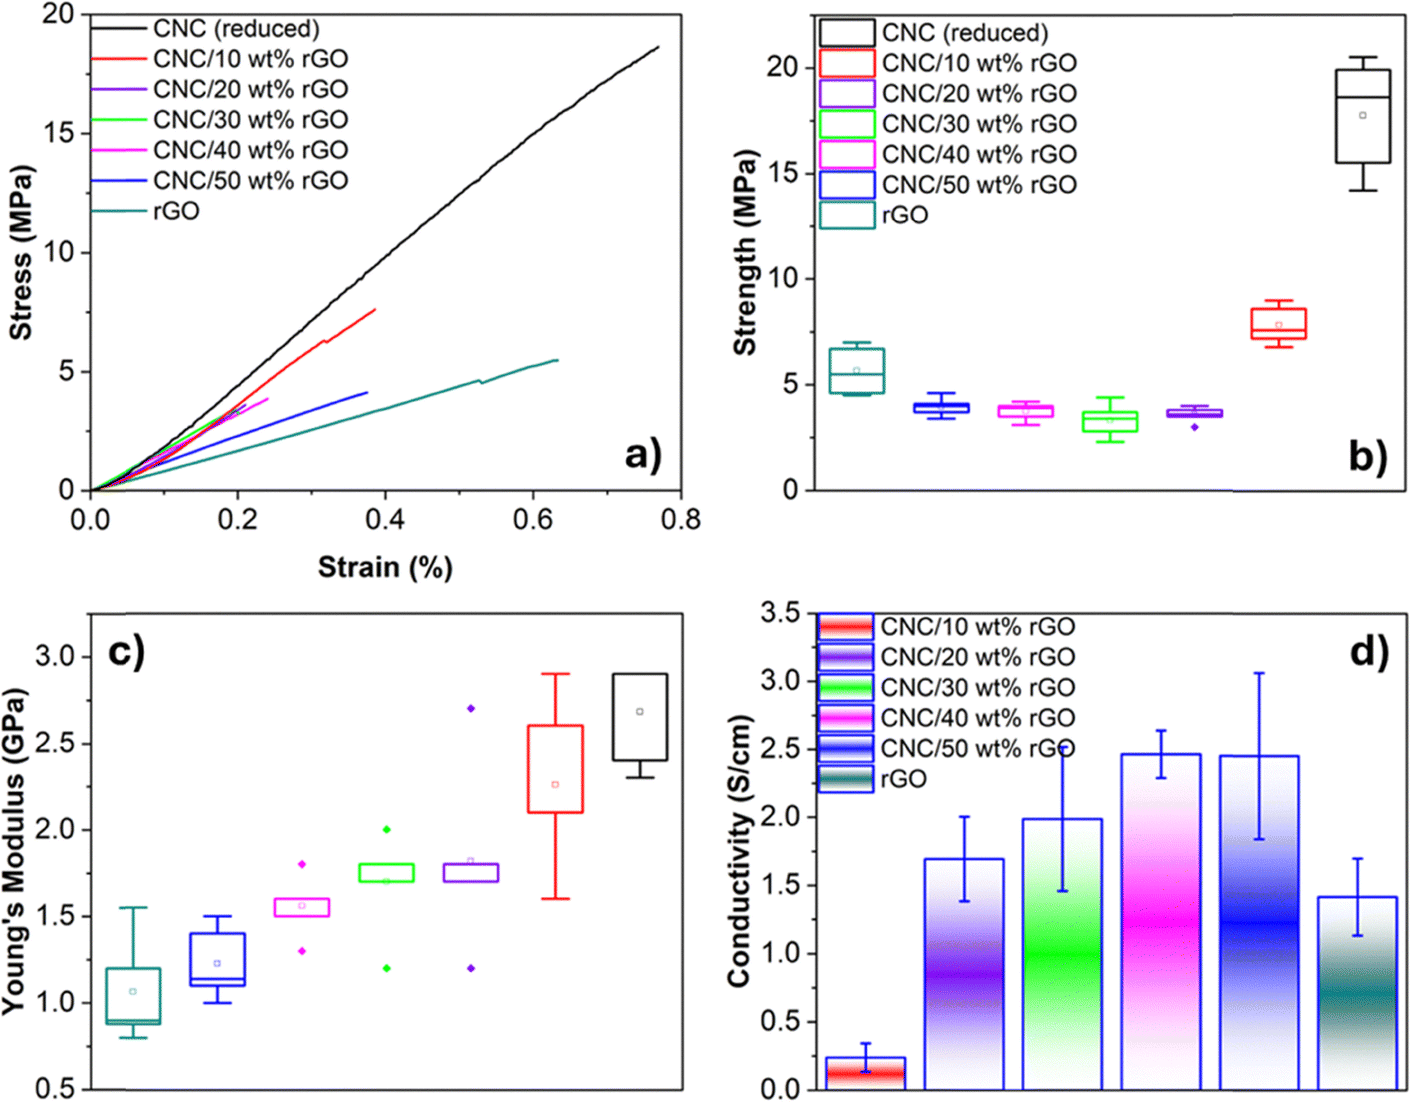 | ||
| Fig. 3 (a) Stress vs. strain curves of the CNC/rGO composites. Box plots of (b) the ultimate tensile strength, (c) Young's modulus, and (d) electrical conductivity. Square, line, rhombus and the error bars indicate the mean, median, and outliers, respectively. The legend shown in panel (b) also applies to panel (c). | ||
The addition of rGO to CNC resulted in a decrease in both tensile strength and Young's modulus (Fig. 3(b), (c) and Table S2, ESI†). Specifically, the CNC/10 wt% rGO composite exhibited a tensile strength of 7.8 ± 0.9 MPa and a modulus of 2.3 ± 0.5 GPa, compared to 17.7 ± 2.8 MPa and 2.7 ± 0.3 GPa, respectively, for pure reduced CNC. Further increasing the rGO content to 50 wt% led to a strength of 4.0 ± 0.5 MPa and a modulus of 1.2 ± 0.2 GPa, attributed to the disruption of the CNC's chiral assembly which facilitates efficient load transfer and the incorporation of mechanically weaker rGO.29 For intermediate compositions, no clear trend in strength was observed, as all values fell within experimental error, while the modulus followed a linear trend.
Pure rGO exhibited a modulus of 1.1 ± 0.3 GPa and a strength of 5.6 ± 1.1 MPa, which are on the lower end compared to values reported in the literature.23,27 This reduction is likely due to the lower density and higher porosity of our directly thermally reduced films, as discussed in the previous section. The large error bars observed are attributed to increased film brittleness, despite the use of specialized clamps during tensile testing. A minimum of five measurements was averaged for each composition to ensure statistical reliability. Similar observations were made for the toughness and ultimate strain, as shown in Fig. S7 and Table S2 (ESI†).
The electrical conductivity of the composites was measured using a four-point probe setup (Fig. 3(d) and Table S3, ESI†). The addition of rGO led to a clear increase in conductivity, with the highest values observed for CNC/50 wt% rGO and CNC/40 wt% rGO composites, measuring 2.5 ± 0.6 S cm−1 and 2.5 ± 0.2 S cm−1, respectively. In comparison, pure rGO films exhibited a conductivity of 1.4 ± 0.3 S cm−1, while reduced CNC films showed resistance beyond the instrument's sensitivity limit of 2 MΩ sq−1. A percolation threshold was observed between 10–20 wt%, as the CNC/10 wt% rGO composite exhibited a significantly lower conductivity of 0.2 ± 0.1 S cm−1, and CNC/20 wt% rGO measured 1.7 ± 0.3 S cm−1. The higher conductivity observed in composites above 20 wt% rGO, compared to pure rGO, is attributed to improved interconnectivity of rGO domains facilitated by the CNC matrix. CNCs help maintain nanosheet separation during assembly, reducing agglomeration and enhancing charge transport through a more continuous and uniform conductive network.
3.3 Electrochemical properties
The electrochemical performance of all electrodes including CNC (reduced), rGO, CNC/10 wt% rGO, CNC/20 wt% rGO, CNC/30 wt% rGO, CNC/40 wt% rGO, CNC/50 wt% rGO was evaluated in a symmetric two-electrode configuration using 6 M KOH as the electrolyte. For clarity, four representative samples were highlighted in Fig. 4: pure reduced CNC, pure rGO, the best-performing composite CNC/10 wt% rGO, and the intermediate composition CNC/50 wt% rGO. These selected samples represent key points across the composition range and illustrate trends in capacitive behavior as a function of rGO content. | ||
| Fig. 4 (a) Cyclic voltammograms recorded at a scan rate of 20 mV s−1 for CNC (reduced), CNC/10 wt% rGO, CNC/50 wt% rGO, and rGO. (b) Specific capacitance values at scan rates of 1, 5, 20, 50, 100, and 200 mV s−1. (c) Galvanostatic charge–discharge curves at a specific current of 0.5 A g−1 for CNC (reduced), CNC/10 wt% rGO, CNC/50 wt% rGO, and rGO. (d) Specific capacitance at specific currents of 0.2, 0.5, 0.8, 1.0, and 2.0 A g−1. The legend shown in panel (a) also applies to panels (b)–(d). | ||
Cyclic voltammograms (CVs) for most samples exhibited no distinct peaks, indicating the absence of redox reactions (Fig. 4 and Fig. S8, ESI†).17 Instead, the CV curves displayed a characteristic rectangular shape, confirming electric double-layer capacitance (EDLC) behavior.19,27 Notably, the CNC/10 wt% rGO composite showed the most well-defined CV curves, including the appearance of a broad peak at 0.5 V—suggesting limited pseudocapacitive behavior likely arising from accessible remaining oxygen containing surface functional groups on rGO.27,40 This indicates an enhanced charge storage capacity compared to both pure rGO and other composite formulations. Furthermore, the CV curves retained their shape at increasing scan rates, confirming stable capacitive behavior across different cycling conditions (Fig. S8, ESI†).41
The highest capacitance was observed in composites with the higher CNC content, up to 90 wt% (Fig. 4(b), Fig. S9 and Table S4, ESI†). At a scan rate of 20 mV s−1, the average specific capacitance was 209 F g−1, 161 F g−1, 161 F g−1, 164 F g−1, and 166 F g−1 for CNC/rGO composites with 10, 20, 30, 40, and 50 wt% rGO, respectively Motivated by the exceptional performance of the 10 wt% rGO composite, we also evaluated a CNC/5 wt% rGO sample. However, its specific capacitance was reduced to 167 ± 2 F g−1 at 20 mV s−1, likely due to the insufficient loading of electrochemically active material relative to the higher-performing 10 wt% composition. In comparison, pure rGO exhibited a capacitance of 157 F g−1, which was lower than all CNC/rGO composites, highlighting the beneficial role of CNCs chiral assembly in charge storage performance.17,19 At higher scan rates, the CNC/rGO composites consistently outperformed pure rGO, indicating improved ion transport kinetics. Additionally, contact angle measurements with the electrolyte revealed no significant differences across compositions, suggesting comparable wettability among all films (Fig. S10 and S11, ESI†).
Galvanostatic charge–discharge (GCD) measurements were conducted at specific currents ranging from 0.2 to 2.0 A g−1 (Fig. 4(c), Fig. S9, S12 and Table S5, ESI†). The GCD curves exhibited nearly symmetrical triangular shapes, indicating the absence of redox reactions and confirming EDLC behavior.42 At 0.5 A g−1, the CNC/10 wt% rGO composite showed the highest specific capacitance of 247 F g−1, followed by CNC/5 wt% rGO and pure rGO at 245 and 187 F g−1, respectively. The other composites CNC/20 wt% rGO, CNC/30 wt% rGO, CNC/40 wt% rGO and CNC/50 wt% rGO exhibited a specific capacitance of 175 F g−1, 185 F g−1, 167 F g−1 and 169 F g−1, respectively. At a higher current of 2.0 A g−1, the specific capacitance values were 166, 224, 149, 162, 138, and 147 F g−1 for CNC/rGO composites with 5, 10, 20, 30, 40, and 50 wt% rGO, respectively. In comparison, pure rGO displayed a significantly lower capacitance of 116 F g−1 at the same current.
The rGO, CNC/50 wt% rGO, and CNC/10 wt% rGO composites were selected for prolonged cycling up to 40000 cycles to evaluate their long-term electrochemical stability, as discussed earlier (Fig. 5). The specific currents were varied every 10000 cycles in the following sequence: 0.5 A g−1, 2.0 A g−1, 5.0 A g−1, and back to 0.5 A g−1. The prolonged cycling tests revealed that the CNC/rGO composites exhibited higher and more stable specific capacitance across the higher specific currents compared to pure rGO. When comparing the initial (1–10000 cycles) and final (30000–40000 cycles) stages at 0.5 A g−1, specific capacitance was well retained across all compositions, indicating excellent cycling stability; the performance of all electrodes remained within experimental error for most of these cycles. At this relatively low specific current, ion diffusion limitations are minimal, allowing all systems to perform comparably. However, at higher specific currents (2.0 A g−1 and 5.0 A g−1), the composites consistently outperformed pure rGO. The composites, CNC/10 wt% rGO, CNC/50 wt% rGO and rGO exhibited 142 ± 4 F g−1, 131 ± 7 F g−1, and 119 ± 13 F g−1 after 10000 cycles at a specific current of 2.0 A g−1. At 5.0 A g−1, the composites followed the same trend with highest specific capacitance for CNC/10 wt% rGO at 130 ± 4 F g−1 followed by CNC/50 wt% rGO and pure rGO at 102 ± 10 F g−1 and 26 ± 12 F g−1, respectively. With increasing specific current, the specific capacitance of rGO decreased significantly, while the CNC/rGO composites maintained superior capacitance, highlighting their enhanced structural integrity and charge storage capability during prolonged cycling.
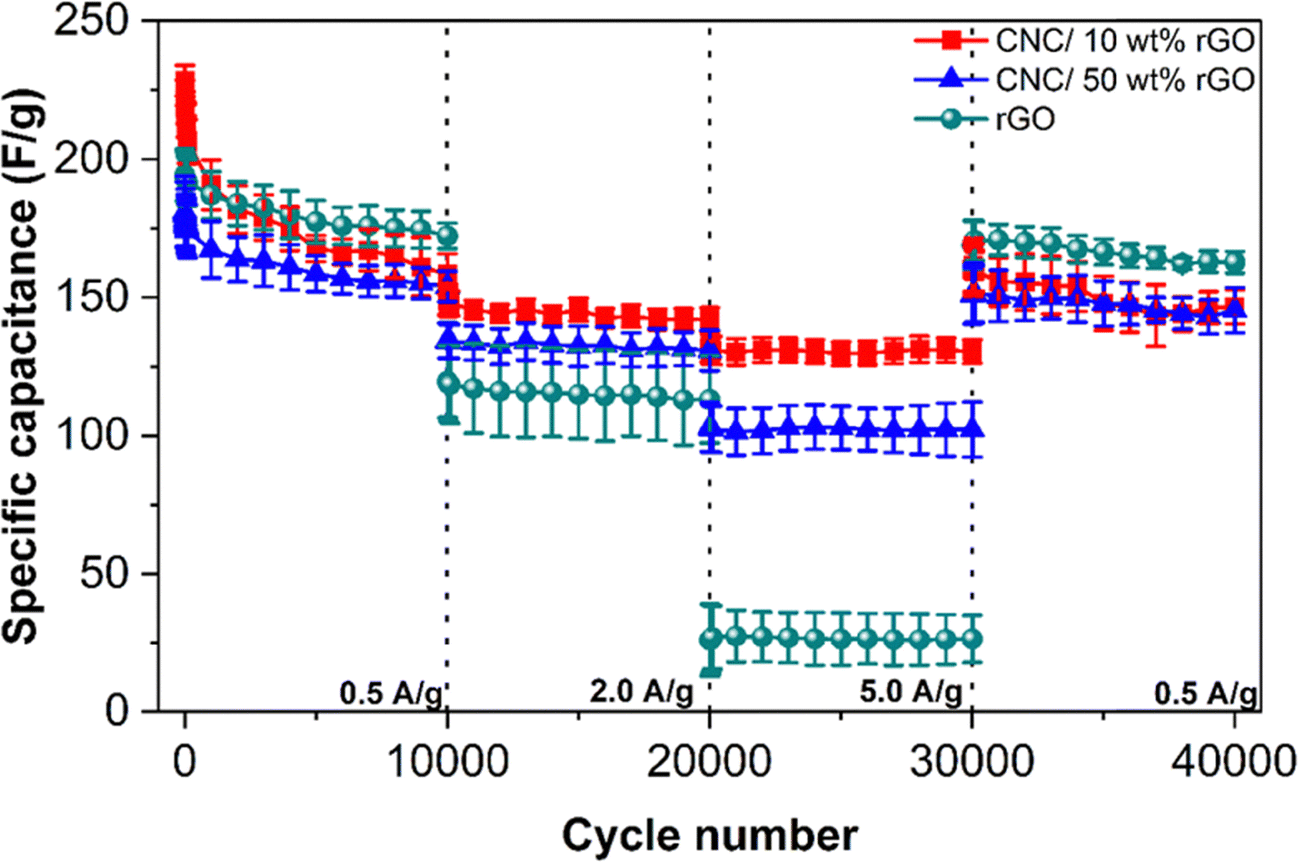 | ||
| Fig. 5 Prolonged tests of 10000 cycles each for CNC/rGO composites at various specific currents of 0.5 A g−1, 2.0 A g−1, 5.0 A g−1 and 0.5 A g−1. | ||
Electrochemical impedance spectroscopy was conducted to evaluate the charge transfer and ion diffusion properties of the composite electrodes (Fig. S13, S14 and Table S6, ESI†). Nyquist plots were fitted using a Randles circuit model consisting of five components: R1 (solution, contact and intrinsic resistance of the solution),43R2 (charge transfer resistance at the electrode–electrolyte interface),44Q2 (double-layer capacitance at the electrode surface), Q3 (pseudocapacitive behavior or surface inhomogeneity), and W2 (Warburg impedance related to ion diffusion within the electrode),45 according to prior reports.
All samples showed a semicircle in the high-frequency region and a near-vertical line at low frequencies, characteristic of EDLC (Fig. S14 and Table S6, ESI†).44,46,47R1 remained relatively consistent across all samples, with measured values of 11.2 Ω (rGO), 10.5 Ω (CNC/10 wt% rGO), 15.6 Ω (CNC/20 wt%), 9.1 Ω (CNC/30 wt%), 12.1 Ω (CNC/40 wt%), and 7.4 Ω (CNC/50 wt%). Charge transfer resistance (R2), which reflects both bulk electrode and interfacial resistance, generally decreased with increasing rGO content, consistent with improved electrical conductivity. Interestingly, CNC/10 wt% rGO exhibited the highest R2 among the composites yet showed the best electrochemical performance. This suggests that in CNC-rich composites, enhanced capacitance arises from improved accessibility of the rGO active surface area, facilitated by chiral templating and reduced aggregation, rather than from low charge transfer resistance. Although the equivalent circuit model included a Warburg element, consistent with prior literature, we do not discuss it further here due to the non-intercalating nature of EDLC electrodes.45
3.4 Discussion
We compared our samples to the state-of-the-art materials in terms of specific energy versus specific power, as shown in Fig. 6, Table S7 and Fig. S15 (ESI†). The specific energy of CNC/10 wt% rGO ranged from 8.7 to 6.6 W h kg−1, and CNC/50 wt% rGO ranged from 6.5 to 5.1 W h kg−1, remaining relatively stable as specific power increased from 100 to 1000 W kg−1. In contrast, pure rGO showed a broader drop in performance, with specific energy decreasing from 7.0 to 3.6 W h kg−1 over the same power range. These results highlight the superior energy retention of CNC/rGO composites, particularly CNC/10 wt% rGO, under high-power operating conditions.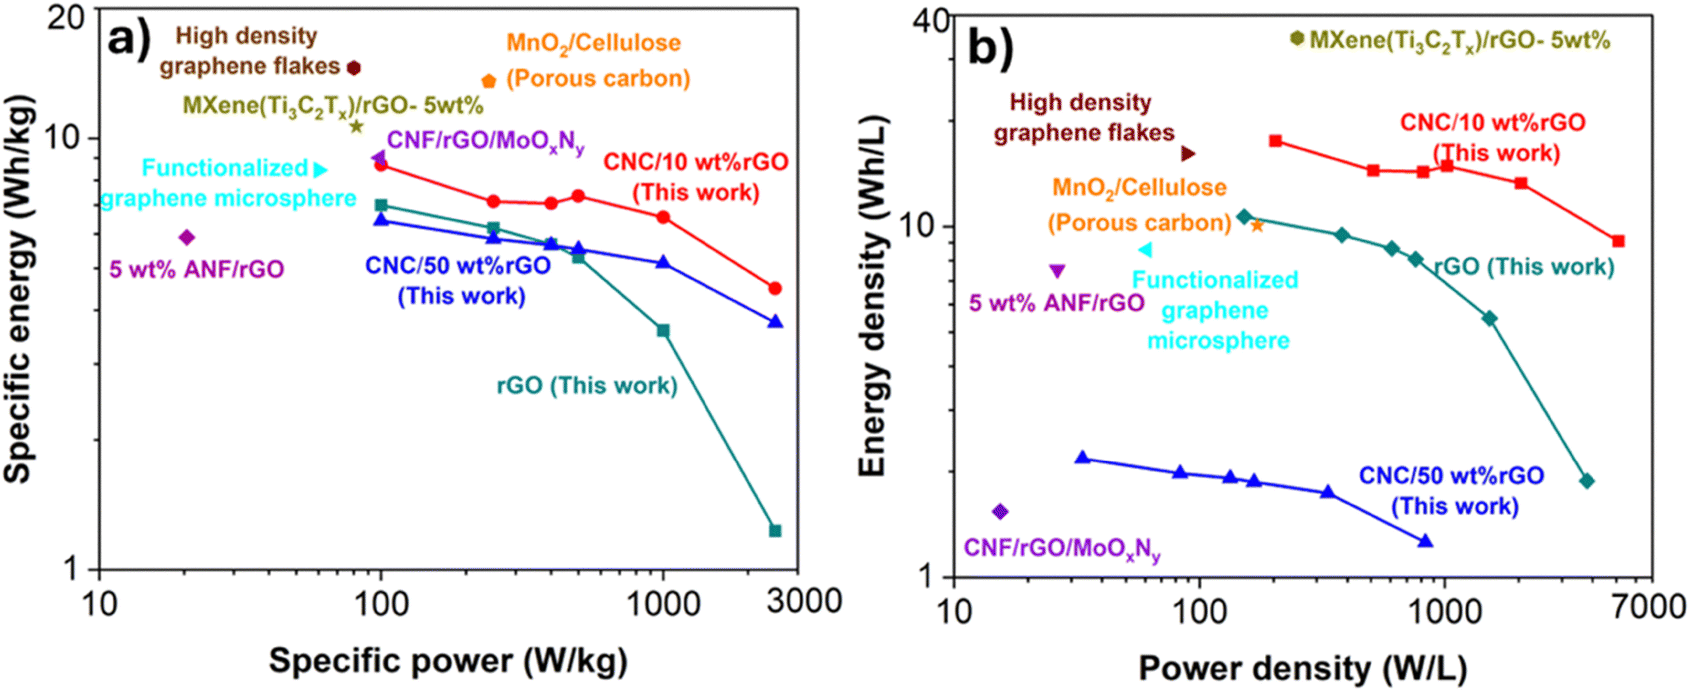 | ||
| Fig. 6 Comparison of (a) specific energy vs. specific power and (b) energy density vs. power density. rGO: reduced graphene oxide, CNC: cellulose nanocrystals, ANF: aramid nanofibers, CNF: cellulose nanofibril, MoOxNy: molybdenum oxynitride, and MnO2: manganese dioxide. | ||
Four literature-reported composites exhibited higher specific energy at low specific power values: high-density graphene flakes (14.6 W h kg−1 at 80.1 W kg−1), MnO2/cellulose (13.6 W h kg−1 at 240.9 W kg−1), MXene/rGO (10.7 W h kg−1 at 81.8 W kg−1), and CNF/rGO/MoOxNy (9 W h kg−1 at 99 W kg−1). These systems typically achieve high energy storage through elevated active material loading, aerogel-based architectures that enhance surface area, or the use of pseudocapacitive materials such as MXenes and MnO2. However, these approaches often come with trade-offs, including higher cost, limited mechanical integrity, or reduced long-term electrochemical stability.4,48–50
To assess performance under space-constrained conditions, we also compared volumetric energy and power densities of the electrodes. The CNC/10 wt% rGO composite outperformed both CNC/50 wt% rGO and pure rGO, achieving 17.6 W h L−1 at 204 W L−1, compared to 10.7 W h L−1 at 152.2 W L−1 for pure rGO and 2.2 W h L−1 at 33.3 W L−1 for CNC/50 wt% rGO. Notably, CNC/10 wt% rGO maintained high energy density across a wide power range, reaching 13.3 W h L−1 at 2040.8 W L−1, whereas pure rGO exhibited a sharp drop in energy density, declining to 1.9 W h L−1 at 3797 W L−1. This rapid decline in energy density is attributed to the reduction in accessible electrochemically active surface area due to restacking of rGO sheets. In contrast, CNC/10 wt% rGO maintained dispersed rGO domains and preserved access to active sites, enabling stable volumetric performance across the full power range.
While CNC/50 wt% rGO exhibited strong gravimetric performance due to its high rGO content, its volumetric energy density dropped significantly. This sharp decline is attributed to the substantial increase in film thickness after thermal reduction, which lowers energy density when normalized by volume. Although the electrode retained good electrochemical activity per unit mass, the expanded structure introduced by thermal processing—combined with possible restacking—reduced the packing efficiency and made it less effective for space-constrained applications.
In comparison, MXene/rGO thin films have reported volumetric energy densities of 34.5 W h L−1 at 250.2 W L−1, benefiting from pseudocapacitive behavior. In MXenes, this arises from surface redox reactions involving terminal functional groups such as –OH, –O, and –F, which participate in faradaic interactions with the electrolyte, enhancing charge storage beyond electric double-layer capacitance.51 High-density graphene flakes showed 16.1 W h L−1 at 88.6 W L−1, due to high bulk packing density and structural changes from small graphene pieces. However, CNF/rGO/MoOxNy, despite high gravimetric performance, had low volumetric energy (1.5 W h L−1 at 15.4 W L−1) due to its aerogel structure. Similarly, MnO2/cellulose reached 10.1 W h L−1 at 172 W L−1, but required more volume. Overall, CNC/10 wt% rGO demonstrated the best balance of gravimetric and volumetric performance, making it well-suited for compact, high-rate energy storage applications.
Chirality influenced the internal organization of both CNC/10 wt% rGO and CNC/50 wt% rGO composites. In CNC/10 wt% rGO, the preserved chiral structure effectively prevented rGO restacking and promoted better dispersion, resulting in greater accessibility of the active surface area and enhanced electrochemical performance. Despite being approximately 10× thinner than CNC/50 wt% rGO, CNC/10 wt% rGO still outperformed both rGO and CNC/50 wt% rGO, indicating that performance enhancements are due to internal structural features. In contrast, CNC/50 wt% rGO exhibited disrupted chiral ordering and significantly increased thickness after thermal reduction, leading to partial rGO aggregation and inefficient packing. While its higher rGO content provided greater electrical conductivity and strong gravimetric capacitance, the expanded structure limited its volumetric energy density. This contrast highlights that the enhanced performance of CNC/10 wt% rGO arises from the synergistic influence of chiral assembly on charge distribution and ion transport. Thus, the mechanisms of performance enhancement differ: CNC/10 wt% rGO benefits from stabilized morphology and accessible surface area, while CNC/50 wt% rGO relies on bulk rGO content. These findings emphasize the importance of chiral templating and morphological control in optimizing charge accessibility and structural efficiency for high-performance energy storage.
4. Conclusion
In this study, we successfully fabricated free-standing thin-film CNC/rGO composite electrodes via slow evaporation-induced self-assembly, preserving the chiral organization of cellulose nanocrystals. The chiral structuring of CNCs played a key role in controlling internal morphology and active surface accessibility within the composites. This resulted in distinct electrochemical behaviors: CNC/10 wt% rGO maintained stable chiral alignment, which prevented rGO restacking and maximized accessible surface area, while CNC/50 wt% rGO exhibited disrupted ordering and increased thickness, limiting its volumetric performance despite good gravimetric capacitance. Compared to pure rGO, both composites showed improved electrochemical performance, with specific capacitance enhancements of 93% and 28% at 2 A g−1 for CNC/10 wt% and CNC/50 wt% rGO, respectively. The CNC-rich systems also demonstrated enhanced mechanical robustness and stable cycling. Importantly, the best performance was achieved using bio-derived CNCs and only 10 wt% rGO, processed under low-temperature conditions, highlighting the potential for environmentally conscious electrode fabrication. These results highlight the potential of combining chiral nanocellulose templates with conductive fillers to engineer scalable, high-performance bio-derived electrodes with tunable structure–function relationships.Author contributions
The manuscript was written through contributions of all authors. All authors have given approval to the final version of the manuscript.Conflicts of interest
There are no conflicts to declare.Data availability
All supporting data for this study are provided in the ESI,† including cyclic voltammetry (CV), galvanostatic charge–discharge (GCD), electrochemical impedance spectroscopy (EIS), tensile testing data, SEM micrographs, FTIR and TGA spectra, UV-Vis absorbance plots, and tabulated performance comparisons. Additional data can be provided by the corresponding author upon reasonable request.Acknowledgements
This work was supported by startup funds from the University of Arizona through the Department of Chemical and Environmental Engineering and the Office of Research and Partnerships (ORP). SEM imaging (FEI Inspect S), FTIR (Thermo Fisher Nicolet iS50R), Raman spectroscopy (Renishaw Invia Raman Microscope), and TGA (TA Instruments Discovery TGA 5500) were performed at the W.M. Keck Center for Nano-Scale Imaging (RRID:SCR_022884), Department of Chemistry and Biochemistry, with support from the W.M. Keck Foundation. Cold field emission SEM was conducted at the Kuiper-Arizona Laboratory for Astromaterials Analysis (K-ALFAA), supported by NASA (grants NNX12AL47G and NNX15AJ22G) and NSF (grant 1531243). AIT four-point probe measurements were performed in part at the Nano Fabrication Center at the University of Arizona.References
- P. Simon and Y. Gogotsi, Perspectives for electrochemical capacitors and related devices, Nat. Mater., 2020, 19(11), 1151–1163 CrossRef CAS PubMed.
- A. K. Geim and K. S. Novoselov, The rise of graphene, Nat. Mater., 2007, 6(3), 183–191 CrossRef CAS PubMed.
- S. De, C. Purcell, J. Murley, P. Flouda, S. Shah, M. Green and J. Lutkenhaus, Spray-On Reduced Graphene Oxide-Poly(vinyl alcohol) Supercapacitors for Flexible Energy and Power, Adv. Mater. Interfaces, 2018, 5(23), 1801237 CrossRef.
- X. Peng, H. L. Cao, Z. H. Qin, C. Zheng, M. Zhao, P. Z. Liu, B. S. Xu, X. F. Zhou, Z. P. Liu and J. J. Guo, A simple and scalable strategy for preparation of high density graphene for high volumetric performance supercapacitors, Electrochim. Acta, 2019, 305, 56–63 CrossRef CAS.
- P. Lv, X. Lu, L. Wang and W. Feng, Nanocellulose-Based Functional Materials: From Chiral Photonics to Soft Actuator and Energy Storage, Adv. Funct. Mater., 2021, 31(45), 2104991 CrossRef CAS.
- K. I. Nargatti, A. R. Subhedar, S. S. Ahankari, A. N. Grace and A. Dufresne, Nanocellulose-based aerogel electrodes for supercapacitors: A review, Carbohydr. Polym., 2022, 297, 120039 CrossRef CAS PubMed.
- S. Ling, D. L. Kaplan and M. J. Buehler, Nanofibrils in nature and materials engineering, Nat. Rev. Mater., 2018, 3(4), 18016 CrossRef CAS PubMed.
- D. Bukharina, M. Kim, M. J. Han and V. V. Tsukruk, Cellulose Nanocrystals’ Assembly under Ionic Strength Variation: From High Orientation Ordering to a Random Orientation, Langmuir, 2022, 38(20), 6363–6375 CrossRef CAS PubMed.
- P. Flouda, D. Bukharina, K. J. Pierce, A. V. Stryutsky, V. V. Shevchenko and V. V. Tsukruk, Flexible Sustained Ionogels with Ionic Hyperbranched Polymers for Enhanced Ion-Conduction and Energy Storage, ACS Appl. Mater. Interfaces, 2022, 14(23), 27028–27039 CrossRef CAS PubMed.
- M. Kim, M. J. Han, H. Lee, P. Flouda, D. Bukharina, K. J. Pierce, K. M. Adstedt, M. L. Buxton, Y. H. Yoon, W. T. Heller, S. Singamaneni and V. V. Tsukruk, Bio-Templated Chiral Zeolitic Imidazolate Frameworkfor Enantioselective Chemoresistive Sensing, Angew. Chem., Int. Ed., 2023, 62(30), e202305646 CrossRef CAS PubMed.
- K. A. Randall, M. E. Enderlin and P. Flouda, Architectural engineering of nanocomposite electrodes for energy storage, MRS Commun., 2024, 14(5), 805–816 CrossRef CAS.
- R. M. Parker, B. Frka-Petesic, G. Guidetti, G. Kamita, G. Consani, C. Abell and S. Vignolini, Hierarchical self-assembly of cellulose nanocrystals in a confined geometry, ACS Nano, 2016, 10(9), 8443–8449 CrossRef CAS PubMed.
- V. S. Raghuwanshi, S. Varanasi, W. Batchelor and G. Garnier, Cellulose nanocrystals to modulate the self-assembly of graphene oxide in suspension, Mater. Des., 2022, 216, 110572 CrossRef.
- A. Tran, C. E. Boott and M. J. MacLachlan, Understanding the Self-Assembly of Cellulose Nanocrystals—Toward Chiral Photonic Materials, Adv. Mater., 2020, 32(41), 1905876 CrossRef CAS PubMed.
- R. M. Parker, G. Guidetti, C. A. Williams, T. Zhao, A. Narkevicius, S. Vignolini and B. Frka-Petesic, The Self-Assembly of Cellulose Nanocrystals: Hierarchical Design of Visual Appearance, Adv. Mater., 2018, 30(19), 1704477 CrossRef PubMed.
- Y. Habibi, L. A. Lucia and O. J. Rojas, Cellulose Nanocrystals: Chemistry, Self-Assembly, and Applications, Chem. Rev., 2010, 110(6), 3479–3500 CrossRef CAS PubMed.
- L. J. Andrew, E. R. Gillman, C. M. Walters, E. Lizundia and M. J. MacLachlan, Multi-Responsive Supercapacitors from Chiral Nematic Cellulose Nanocrystal-Based Activated Carbon Aerogels, Small, 2023, 19(34), 2301947 CrossRef CAS PubMed.
- K. Kim, P. J. Kim, R. A. Chowdhury, R. Kantharaj, A. Candadai, A. Marconnet, V. G. Pol and J. P. Youngblood, Structural orientation effect of cellulose nanocrystals (CNC) films on electrochemical kinetics and stability in lithium-ion batteries, Chem. Eng. J., 2021, 417, 128128 CrossRef CAS.
- C. M. Walters, G. K. Matharu, W. Y. Hamad, E. Lizundia and M. J. MacLachlan, Chiral nematic cellulose nanocrystal/germania and carbon/germania composite aerogels as supercapacitor materials, Chem. Mater., 2021, 33(13), 5197–5209 CrossRef CAS.
- Y. Wang, T. Liu, X. Lin, H. Chen, S. Chen, Z. Jiang, Y. Chen, J. Liu, J. Huang and M. Liu, Self-Templated Synthesis of Hierarchically Porous N-Doped Carbon Derived from Biomass for Supercapacitors, ACS Sustainable Chem. Eng., 2018, 6(11), 13932–13939 CrossRef CAS.
- V. F. Korolovych, V. Cherpak, D. Nepal, A. Ng, N. R. Shaikh, A. Grant, R. Xiong, T. J. Bunning and V. V. Tsukruk, Cellulose nanocrystals with different morphologies and chiral properties, Polymer, 2018, 145, 334–347 CrossRef CAS.
- W. S. Hummers and R. E. Offeman, Preparation of Graphitic Oxide, J. Am. Chem. Soc., 1958, 80(6), 1339 CrossRef CAS.
- P. Flouda, S. A. Shah, D. C. Lagoudas, M. J. Green and J. L. Lutkenhaus, Highly Multifunctional Dopamine-Functionalized Reduced Graphene Oxide Supercapacitors, Matter, 2019, 1(6), 1532–1546 CrossRef.
- L. Sun, J. Wang and E. Bonaccurso, Conductivity of individual particles measured by a microscopic four-point-probe method, Sci. Rep., 2013, 3(1), 1991 CrossRef PubMed.
- R. S. Waremra and P. Betaubun, In Analysis of electrical properties using the four point probe method, E3S Web of conferences, EDP Sciences, 2018, p. 13019.
- P. Flouda, X. Feng, J. G. Boyd, E. L. Thomas, D. C. Lagoudas and J. L. Lutkenhaus, Interfacial Engineering of Reduced Graphene Oxide for Aramid Nanofiber-Enabled Structural Supercapacitors, Batteries Supercaps, 2019, 2(5), 464–472 CrossRef CAS.
- S. R. Kwon, J. Harris, T. Zhou, D. Loufakis, J. G. Boyd and J. L. Lutkenhaus, Mechanically Strong Graphene/Aramid Nanofiber Composite Electrodes for Structural Energy and Power, ACS Nano, 2017, 11(7), 6682–6690 CrossRef CAS PubMed.
- C.-J. Kim, W. Khan and S.-Y. Park, Structural evolution of graphite oxide during heat treatment, Chem. Phys. Lett., 2011, 511(1–3), 110–115 CrossRef CAS.
- K. Jin, J. Xing, X. Liu, Z. Jiang, S. Yang, X. Yang and J. Ma, Manipulating the assembly of the CNC/RGO composite film for superior electromagnetic interference shielding properties, J. Mater. Chem. A, 2021, 9(47), 26999–27009 RSC.
- H. C. Oyeoka, C. M. Ewulonu, I. C. Nwuzor, C. M. Obele and J. T. Nwabanne, Packaging and degradability properties of polyvinyl alcohol/gelatin nanocomposite films filled water hyacinth cellulose nanocrystals, J. Bioresour. Bioprod., 2021, 6(2), 168–185 CAS.
- J. Han, C. Zhou, Y. Wu, F. Liu and Q. Wu, Self-assembling behavior of cellulose nanoparticles during freeze-drying: effect of suspension concentration, particle size, crystal structure, and surface charge, Biomacromolecules, 2013, 14(5), 1529–1540 CrossRef CAS PubMed.
- M. Madani, C. D. Cruz, Z. Gounani, H. Baniasadi, P. Tammela, T. Laaksonen, J. Niskanen and J. Seppälä, Functionalized cellulose nanocrystals reinforced PLA-gelatin electrospun fibers for potential antibacterial wound dressing and coating applications, Int. J. Biol. Macromol., 2025, 287, 138389 CrossRef CAS PubMed.
- U.-a Kanta, V. Thongpool, W. Sangkhun, N. Wongyao and J. Wootthikanokkhan, Preparations, characterizations, and a comparative study on photovoltaic performance of two different types of graphene/TiO2 nanocomposites photoelectrodes, J. Nanomater., 2017, 2017(1), 2758294 Search PubMed.
- T. F. Emiru and D. W. Ayele, Controlled synthesis, characterization and reduction of graphene oxide: A convenient method for large scale production, Egypt. J. Basic Appl. Sci., 2017, 4(1), 74–79 Search PubMed.
- A. Patel, D. Loufakis, P. Flouda, I. George, C. Shelton, J. Harris, S. Oka and J. L. Lutkenhaus, Carbon Nanotube/Reduced Graphene Oxide/Aramid Nanofiber Structural Supercapacitors, ACS Appl. Energy Mater., 2020, 3(12), 11763–11771 CrossRef CAS.
- W. Liu and G. Speranza, Tuning the Oxygen Content of Reduced Graphene Oxide and Effects on Its Properties, ACS Omega, 2021, 6(9), 6195–6205 CrossRef CAS PubMed.
- P. Flouda, J. Yun, D. Loufakis, S. A. Shah, M. J. Green, D. C. Lagoudas and J. L. Lutkenhaus, Structural reduced graphene oxide supercapacitors mechanically enhanced with tannic acid, Sustainable Energy Fuels, 2020, 4(5), 2301–2308 RSC.
- X. Zhang, R. Xiong, S. Kang, Y. Yang and V. V. Tsukruk, Alternating Stacking of Nanocrystals and Nanofibers into Ultrastrong Chiral Biocomposite Laminates, ACS Nano, 2020, 14(11), 14675–14685 CrossRef CAS PubMed.
- Y. Zhang, P. Flouda, V. Poliukhova, A. V. Stryutsky, V. V. Shevchenko and V. V. Tsukruk, Stretchable Laminates with Tunable Structural Colors from Layered Stacks of Elastomeric, Ionic, and Natural Polymers, ACS Appl. Mater. Interfaces, 2025, 17(14), 21830–21842 CrossRef CAS PubMed.
- F. T. Johra and W.-G. Jung, Hydrothermally reduced graphene oxide as a supercapacitor, Appl. Surf. Sci., 2015, 357, 1911–1914 CrossRef CAS.
- S. Alkhalaf, C. Ranaweera, P. Kahol, K. Siam, H. Adhikari, S. Mishra, F. Perez, B. K. Gupta, K. Ramasamy and R. K. Gupta, Electrochemical energy storage performance of electrospun CoMn2O4 nanofibers, J. Alloys Compd., 2017, 692, 59–66 CrossRef CAS.
- Z. Ding, Y. Tang and P. Zhu, Reduced graphene oxide/cellulose nanocrystal composite films with high specific capacitance and tensile strength, Int. J. Biol. Macromol., 2022, 200, 574–582 CrossRef CAS PubMed.
- Y. Gong, D. Li, Q. Fu and C. Pan, Influence of graphene microstructures on electrochemical performance for supercapacitors, Prog. Nat. Sci.: Mater. Int., 2015, 25(5), 379–385 CrossRef CAS.
- S. Ghasemi, S. R. Hosseini and O. Boore-Talari, Sonochemical assisted synthesis MnO2/RGO nanohybrid as effective electrode material for supercapacitor, Ultrason. Sonochem., 2018, 40, 675–685 CrossRef CAS PubMed.
- C. An, Y. Wang, Y. Wang, G. Liu, L. Li, F. Qiu, Y. Xu, L. Jiao and H. Yuan, Facile synthesis and superior supercapacitor performances of Ni2P/rGO nanoparticles, RSC Adv., 2013, 3(14), 4628–4633 Search PubMed.
- S. Gautam, J. S. Sidhu and M. Verma, Influence of reduction duration on reduced graphene oxide for supercapacitor energy storage enhancement, Carbon Trends, 2025, 100499 CrossRef CAS.
- P. A. Basnayaka, M. K. Ram, E. K. Stefanakos and A. Kumar, Supercapacitors based on graphene–polyaniline derivative nanocomposite electrode materials, Electrochim. Acta, 2013, 92, 376–382 Search PubMed.
- Q. Zheng, A. Kvit, Z. Cai, Z. Ma and S. Gong, A freestanding cellulose nanofibril–reduced graphene oxide–molybdenum oxynitride aerogel film electrode for all-solid-state supercapacitors with ultrahigh energy density, J. Mater. Chem. A, 2017, 5(24), 12528–12541 Search PubMed.
- J. Yan, C. E. Ren, K. Maleski, C. B. Hatter, B. Anasori, P. Urbankowski, A. Sarycheva and Y. Gogotsi, Flexible MXene/Graphene Films for Ultrafast Supercapacitors with Outstanding Volumetric Capacitance, Adv. Funct. Mater., 2017, 27(30), 1701264 Search PubMed.
- W. Tian, P. Ren, X. Hou, R. Xue, Z. Chen, Z. Guo, Y. Jin and F. Ren, MnO2 porous carbon composite from cellulose enabling high gravimetric/volumetric performance for supercapacitor, Int. J. Biol. Macromol., 2024, 261, 129977 Search PubMed.
- Q. Jiang, N. Kurra, M. Alhabeb, Y. Gogotsi and H. N. Alshareef, All pseudocapacitive MXene–RuO2 asymmetric supercapacitors, Adv. Energy Mater., 2018, 8(13), 1703043 Search PubMed.
Footnote |
| † Electronic supplementary information (ESI) available. See DOI: https://doi.org/10.1039/d5ma00475f |
| This journal is © The Royal Society of Chemistry 2025 |