
 Open Access Article
 This Open Access Article is licensed under a
 Creative Commons Attribution 3.0 Unported Licence
Defect mediated modulation of electrochemical efficacy and stability of Fe3O4 nanodiamond incorporated MoS2 based hierarchical 2D nanostructures for high performance supercapacitor electrodes†
Md. Raihan
Siddiki
a,
Shahid Abubakar
Abtahee
ac,
Mehedi
Hasan
b,
Mizanur
Rahaman
b,
Muhammad Rakibul
Islam
 b and
Md. Abdullah
Zubair
*a
b and
Md. Abdullah
Zubair
*a
aDepartment of Nanomaterials and Ceramic Engineering, Bangladesh University of Engineering and Technology, Dhaka, Bangladesh. E-mail: mazubair2017@gmail.com
bDepartment of Physics, Bangladesh University of Engineering and Technology, Dhaka, Bangladesh
cMechanical Engineering and Engineering Science, The University of North Carolina at Charlotte, North Carolina, USA
First published on 11th June 2025
Abstract
In this study, pristine MoS2 and 1 to 5 wt% Fe3O4 nanodiamond incorporated MoS2 nanoflowers were synthesized via a facile hydrothermal route to identify the optimal material combination for electrodes in supercapacitors. The nanostructured composite with 3% Fe3O4 nanodiamonds exhibited an impressive specific capacitance of 712 F g−1 at 0.3 A g−1 current density and remarkable cyclic stability, with 84% capacitance retention and 103% coulombic efficiency after 10![[thin space (1/6-em)]](https://www.rsc.org/images/entities/char_2009.gif) 000 cycles at 2 A g−1 current density. The crystallographic and morphological analyses revealed that the improved electrochemical performance of the optimum composition could be attributed to the formation of disorder induced surface active sites and broadening of crystallographic interlayer spacing of MoS2 leading to an enhancement in ionic adsorption, intercalation and surface redox reaction. Additionally, the reduced interface charge transfer resistance for the optimal composition obtained from the EIS analysis could also contribute towards specific capacitance enhancement by facilitating the faradaic process. However, the observed diminution in capacitance by 50% above the optimum Fe3O4 content (5%) was attributed to a sudden drop in electrolytic channel integrity. The power (45–90 W kg−1) and energy (2.15–3.70 W h kg−1) densities of the material obtained from the two-electrode system setup corresponded to the performance zone of symmetric supercapacitors in the Ragone plot. These findings highlight the Fe3O4 nanodiamond incorporated MoS2 nanocomposite as a very effective material for high performance supercapacitors, noticeably out-performing other material combinations with different morphologies.
000 cycles at 2 A g−1 current density. The crystallographic and morphological analyses revealed that the improved electrochemical performance of the optimum composition could be attributed to the formation of disorder induced surface active sites and broadening of crystallographic interlayer spacing of MoS2 leading to an enhancement in ionic adsorption, intercalation and surface redox reaction. Additionally, the reduced interface charge transfer resistance for the optimal composition obtained from the EIS analysis could also contribute towards specific capacitance enhancement by facilitating the faradaic process. However, the observed diminution in capacitance by 50% above the optimum Fe3O4 content (5%) was attributed to a sudden drop in electrolytic channel integrity. The power (45–90 W kg−1) and energy (2.15–3.70 W h kg−1) densities of the material obtained from the two-electrode system setup corresponded to the performance zone of symmetric supercapacitors in the Ragone plot. These findings highlight the Fe3O4 nanodiamond incorporated MoS2 nanocomposite as a very effective material for high performance supercapacitors, noticeably out-performing other material combinations with different morphologies.
Introduction
The demand for energy storage and energy conversion from renewable sources is of great concern due to the rapid development of human civilization and the growing global economy. Proper utilization of renewable energy sources like the sun, wind, water, and others provides an apparent solution towards remediation of contemporary energy crisis and environmental pollution.1,2 Nevertheless, solar energy availability varies significantly with the time of day, weather conditions, and seasonal changes, making it challenging to rely on it solely for continuous power supply. Wind power is also unpredictable due to fluctuating wind speeds, which vary with weather patterns and geographical location, leading to inconsistent power output from wind turbines. The inconsistency and the unpredictable nature of these resources throughout the entire time period create a substantial obstruction towards their usability and thus cannot fully address our needs. Therefore, to secure a long-term sustainable energy future, it is essential not only to rely on renewable sources but also to find alternative ways to incorporate cutting-edge technologies for energy storage, such as fuel cells, batteries, and supercapacitors (SCs).3–5 Among the numerous alternatives, a novel type of electrochemical capacitor called supercapacitors have attracted significant research attention as a promising energy storage device. This is due to their enhanced power density, safety, high charge–discharge rates, superior cycle stability, extended life cycle, and the ability to operate with minimal maintenance costs at low temperatures. These advantageous characteristics of supercapacitors have drawn significant interest from both the scientific and technological sectors, recognizing them as a potential alternative for batteries.6,7 As a result, supercapacitors are being widely used in various applications such as smart door locks, hybrid forklifts, cranes, smart grids, televisions, UPS (uninterruptible power supply) systems, electric vehicles, and other electronic devices.8,9 However, the performance of supercapacitors relies heavily on the properties of electrode materials.Recently, the transition metal oxides have gained attention as a promising option for developing energy storage device electrodes due to their diverse compositions, unique morphologies, larger specific surface area, and higher specific capacitance. These types of materials are crucial for enhancing the performance of supercapacitors, particularly by offering improved capacitance through nanoscale defect manipulation and surface/interface engineering. Despite these appreciable properties and potentials, challenges associated with low electrical conductivity, uncontrolled volume expansion and slow ionic diffusion often hinder their peak performance.10–13 To address these issues, researchers have employed numerous strategies, such as doping, creating multi-cation structures, introducing porous architectures, and making composites. These strategies aim to help transition metal oxides overcome their inherent limitations and play a crucial role in achieving the desired goals in energy storage technologies.14–18 Nowadays, nanostructured transition metal dichalcogenides (TMDs) have also attracted significant research interest as promising materials for supercapacitor electrodes due to their exceptional structural and electronic properties.19 Among these, molybdenum disulfide (MoS2) stands out as a particularly promising candidate owing to its large surface area, enhanced hydrophilicity, high electrical conductivity, fast intrinsic ionic conductivity, exhibition of multiple oxidation states and multi-layer formation at the crystallographic scale.20–24 MoS2 features a two-dimensional layered structure consisting of S–Mo–S atomic tri-layers, where molybdenum (Mo) and sulfur (S) atoms are strongly bonded by covalent bonds, and these S–Mo–S layers are held together by weak van der Waals forces. This unique structure allows for easy intercalation of ions from the electrolyte into the MoS2 interlayers without any distortion of the crystal structure.25,26 The multi-valence states of Mo (+2 to +6), and the space between the interlayers supporting the intercalation of cations provide MoS2 with pseudo-capacitance properties. Nevertheless, the inherent restacking property, poor conductivity, unstable solid–electrolyte interface, and side reactions linked to electrolyte decomposition contribute to low capacitance and limited cyclic stability, potentially limiting its effectiveness as an electrode material.27–29
Numerous studies have explored the various morphologies of MoS2 nanoparticles, particularly in the context of their use in composite materials.30–36 Fe3O4 (magnetite) is frequently chosen as a complementary component for MoS2 due to its remarkable magnetic and surface characteristics. The electrical conductivity of Fe3O4 is significantly enhanced by the presence of multiple valence states of Fe which enables electron transition between Fe2+ and Fe3+ cations within the octahedral sites. Composite materials incorporating Fe3O4 exhibit outstanding stability. Additionally, surface functionalization of Fe3O4 nanoparticles further improves their stability and increases the specific surface area.37–39 However iron oxide-based materials alone face inherent limitations due to their sluggish ion diffusion kinetics. Various types of nanostructures for iron oxide-based electrodes, such as spheres, buttons, microspheres, octahedra, and nanowires, have been investigated, showing notable electrochemical performance. To address the individual shortcomings of these materials, iron oxides, particularly Fe3O4, are often combined with MoS2 for electrochemical applications.33–36 Such combinations have been found to significantly improve the electrochemical properties of the materials.
Sarno et al. introduced a nanostructure composed of uniformly sized Fe3O4 nanoparticles embedded in MoS2 nanosheets, achieving a specific capacitance of 670 F g−1 at 0.25 A g−1 and 76% capacitance retention after 2000 cycles.36 Bayat et al. investigated a MoS2/Fe3O4/PANI composite, where polygon-shaped Fe3O4 nanoparticles were dispersed on MoS2 sheets, delivering a specific capacitance of 401 F g−1 at 0.5 A g−1 and excellent cycling stability with 89.3% retention after 5000 cycles.33 Salarizadeh et al. synthesized a ternary hybrid nanocomposite of sheet-like MoS2, spherical Fe3O4, and reduced graphene oxide (rGO) via a two-step hydrothermal process, which yielded a high specific capacitance of 527 F g−1 at 0.5 mA cm−2 and 93% capacitance retention after 5000 cycles.34 Similarly, Li et al. developed a ternary carbon nanotube/flower-like MoS2/spherical Fe3O4 nanocomposite with a specific capacitance of 522.7 F g−1 at 0.5 A g−1, using a two-step hydrothermal method.35 These studies demonstrate that the combination of MoS2 and iron oxide in a single structure shows significant promise for high-performance supercapacitor electrodes, offering benefits such as improved specific capacitance due to the high redox electroactivity of these two components and a reduced diffusion path that promotes rapid and reversible faradaic reactions.
In this study, diamond-shaped Fe3O4 nanoparticles were incorporated into MoS2 to enhance its specific capacitance. The MoS2 particles exhibited flower-like nanostructures, formed by an assembly of numerous nanopetals in a hierarchical manner. To the best of our knowledge, the diamond-shaped Fe3O4 nanoparticles were integrated hierarchically into MoS2 nanoflowers in this study for the first time. To evaluate the impact of Fe3O4 nanodiamonds on the electrochemical performance of MoS2 nanoflowers, pure MoS2 and three nanocomposites of MoS2 with 1, 3 and 5 wt% Fe3O4 denoted as MoS2/(1%) Fe3O4, MoS2/(3%) Fe3O4, and MoS2/(5%) Fe3O4, respectively, were synthesized via a simple hydrothermal method. The performance of these nanocomposites, along with a pure MoS2 nanoflower sample as a reference, was then evaluated electrochemically to determine the optimal Fe3O4 content for improved electrochemical response and compared with similar nanocomposites available in the recent literature to assess the materials’ usability as a high-performance supercapacitor electrode.
Materials and methods
Materials
Sodium molybdate dihydrate (Na2MoO4·2H2O) and thiourea (CH4N2S) were used as precursors for the synthesis of MoS2 nanoflowers. Iron(III) chloride hexahydrate (FeCl3·6H2O), polyethylene glycol (PEG 8000), and hydrazine 64% (N2H4) were used to prepare Fe3O4 nanoparticles. All reagents were obtained from Merck, India, and were of analytical grade (purity ≥ 98%), eliminating the need for additional purification. Deionized (DI) water was used as the solvent during the synthesis processes. All required nanostructured materials were prepared by adopting a facile hydrothermal synthesis route.Synthesis of diamond shaped Fe3O4 nanoparticles
To synthesize diamond shaped Fe3O4 nanoparticles, 0.028 mol of FeCl3·6H2O and 0.0003 mol of PEG were dissolved by magnetic stirring in 80 mL of DI water for 30 minutes. After that, 9 mL of N2H4 was added to the solution dropwise. When the solution color became dark brown during the addition of N2H4, it was immediately transferred to a Teflon-lined autoclave and heated in an oven at 160 °C for 4 hours. The resulting solution with precipitate was cooled naturally. Using DI water and ethanol, the precipitate was washed and collected by centrifuging the solution and then dried in an oven at 60 °C for 24 hours to obtain the diamond shaped Fe3O4 nanoparticles.Synthesis of MoS2 nanoflowers
To synthesize MoS2 nanoflowers, 0.0119 mol of Na2MoO4·2H2O was dissolved in 85 mL of deionized water and stirred vigorously until a clear solution was obtained. Subsequently, 0.05525 mol of CH4N2S was introduced into the solution, with continuous stirring for an additional 30 minutes to homogenize the solution. Once the homogeneity was achieved, the solution was quickly transferred to a Teflon-lined autoclave and heated at a temperature of 200 °C for 24 hours in an oven. The resultant suspension was centrifuged and washed using DI water and ethanol to collect the precipitate. The collected substance was then dried in an oven at 60 °C for 10 hours to obtain the MoS2 nanoflowers.Synthesis of MoS2 nanoflower–Fe3O4 nanodiamond composites
To synthesize MoS2/(1 wt%) Fe3O4, 0.0119 mol of Na2MoO4·2H2O and 0.05525 mol of CH4N2S were mixed by vigorous stirring for 30 minutes in 80 mL of deionized water. Subsequently, an appropriate quantity of pre-synthesized Fe3O4 nanodiamonds was added into the solution and subjected to sonication using a probe sonicator for 30 minutes to ensure a homogeneous suspension. The resulting mixture was then immediately transferred to a Teflon-lined autoclave and placed in an oven, where it was heated at 200 °C for 24 hours. The resultant material was separated through centrifugation, subjected to multiple washes with ethanol and DI water, and then dried at a temperature of 60 °C for 24 hours to obtain the desired composite. Following a similar procedure, varying amounts of Fe3O4 (3 and 5 wt%) were used to synthesize MoS2/(3 wt%) Fe3O4 and MoS2/(5 wt%) Fe3O4 nanocomposites, respectively. The synthesis process is schematically depicted in Fig. 1.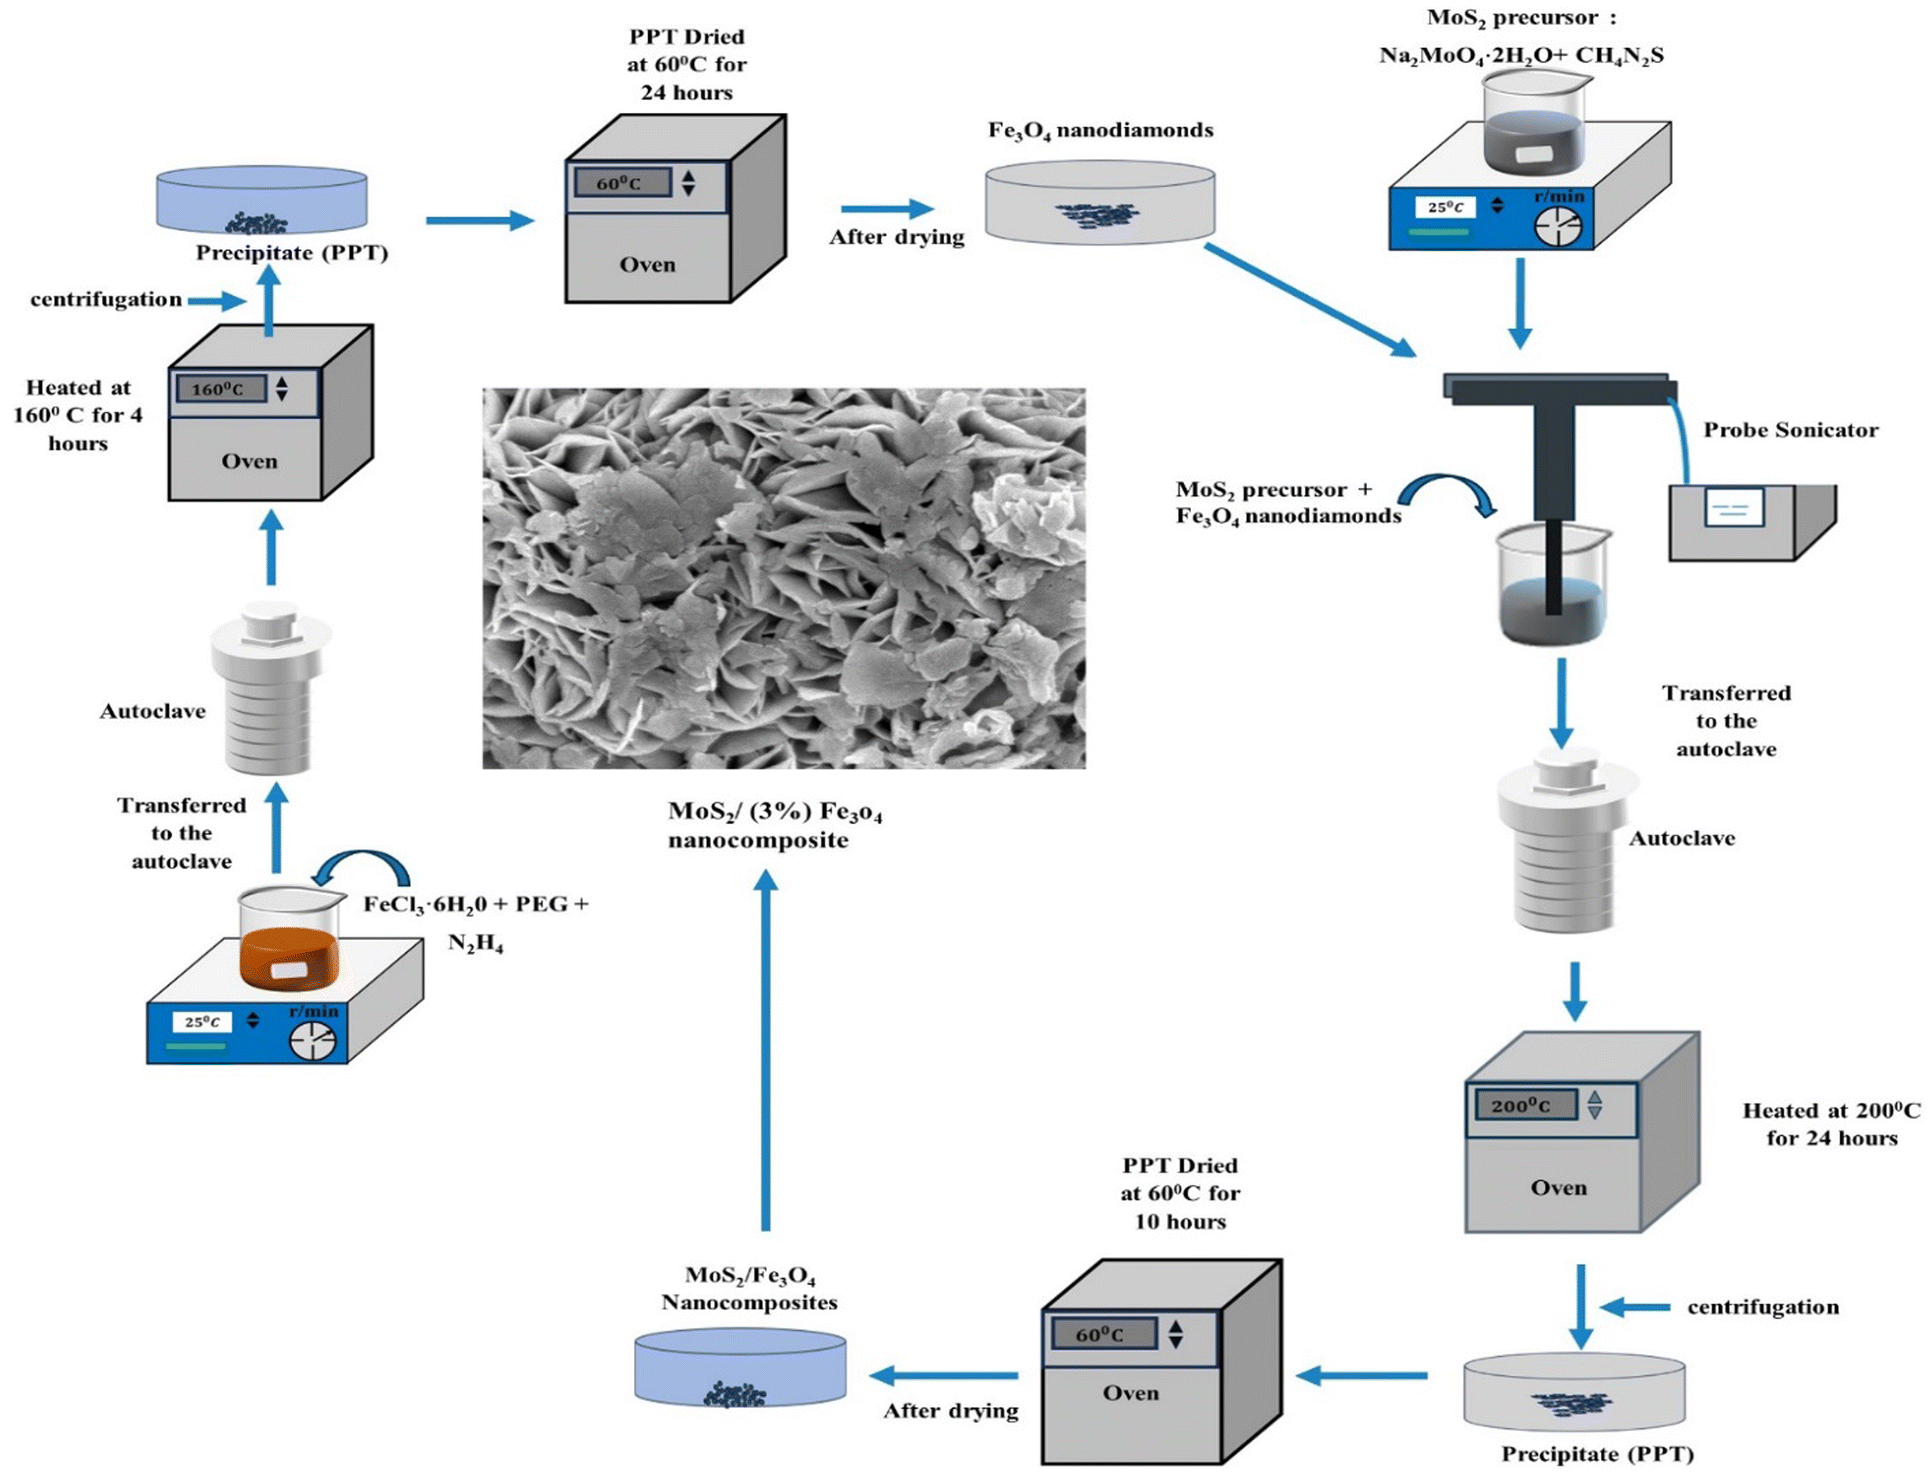 | ||
| Fig. 1 Flowchart of the synthesis process of the MoS2/Fe3O4 nanocomposite: after preparing diamond-shaped Fe3O4, it is mixed into the precursor solution of MoS2 nanoflowers in various amounts: 1%, 3%, and 5%, producing MoS2/(1%) Fe3O4, MoS2/(3%) Fe3O4 and MoS2/(5%) Fe3O4 nanocomposites, respectively. | ||
Fig. 2 schematically shows the synthesized nanoflowers of pure MoS2 and MoS2/Fe3O4 nanocomposites. The MoS2 nanoflowers are composed of numerous nano-sized petals. In the nanocomposites, diamond-shaped Fe3O4 nanoparticles are embedded within the MoS2 nanoflowers. As the Fe3O4 content increases to 5%, these nanoparticles begin to protrude from the surface of the MoS2 nanoflowers, disrupting the hierarchical growth of the flower type structures, and the nanopetals become scattered, resembling a pile of discarded petals.
 | ||
| Fig. 2 The schematic illustration shows the synthesized pure MoS2 and MoS2/Fe3O4 nanocomposites. The MoS2 nanoflowers are composed of numerous nano-petals that are radially aligned and hierarchically grown. Fe3O4 nanoparticles vary in size. Larger Fe3O4 nano-diamonds protrude from the surface of the MoS2 nanoflowers due to the presence of an excessive amount of Fe3O4, which disrupts the formation of nano-petals and the flowers appear fragmented, resembling a disordered pile of nanopetals. | ||
Electrode preparation
To prepare the working electrodes, the active material's slurry was applied to a 0.3 cm2 specific area of a glassy carbon electrode. This slurry was prepared by mixing 96% active material with 4% polyvinyl alcohol (PVA) and dimethyl sulfoxide. The mixture was then subjected to sonication for several hours. In this method, PVA acts as a binder, containing hydroxyl groups that enable hydrogen bond formation between the glassy carbon electrode and the active material. Dimethyl sulfoxide serves as a dispersant to achieve uniform slurry, which can help produce high quality electrodes.Characterization
For crystallographic characterization, X-ray diffraction (XRD) patterns of the nanostructured particles (NPs) were recorded over a 2θ range of 10° to 80° using a PANalytical Empyrean diffractometer equipped with a Cu-Kα X-ray source (λa = 1.54278 Å) operated at 45 kV and 40 mA. The powder samples were placed on a silicon zero-background holder, with the surface of the sample precisely aligned with the diffraction plane. A reflection-transmission spinner module was employed to rotate the sample at a speed of 60 rpm during pattern acquisition to ensure a consistent irradiation area at both low and high X-ray incident angles. The scanning speed was set to 0.041683° per second under continuous scanning mode. A field emission scanning electron microscope (JEOL JSM 7600F) operated at 5 kV was used to examine surface morphologies. Elemental composition was analyzed by energy dispersive X-ray spectroscopy (EDX). The micromorphology of MoS2/Fe3O4 nanocomposites was investigated using a JEOL JEM 2100 F high-resolution transmission electron microscope (HRTEM) operated at 200 kV. For sample preparation, a small amount of ethanol was used to evenly disperse the active material, followed by 20 minutes of sonication. After sonication, the sample was placed on a carbon-coated 3 mm Cu grid and dried before being inserted into the transmission electron microscope for microstructural analysis. The electrochemical performance of electrodes consisting of pure MoS2 nanoflowers and all nanocomposites of MoS2/Fe3O4 was evaluated using a CS310 electrochemical workstation (Corrtest) with a three-electrode configuration, in a 0.5 M aqueous solution of Na2SO4 as the electrolyte. The glassy carbon electrode served as the working electrode, a 1 cm × 1 cm platinum plate as the counter electrode, and Ag/AgCl as the reference electrode. The electrochemical measurements included cyclic voltammetry (CV), galvanostatic charge–discharge (GCD), and electrochemical impedance spectroscopic (EIS) analyses. The CV and GCD analyses were performed within a potential window of −0.2 V to 0.7 V, with scan rates of 20, 40, 60, 80, and 100 mV s−1 and EIS analysis was performed using a sinusoidal bias signal over a frequency range of 10−1 to 105 Hz. Furthermore, a symmetric two-electrode supercapacitor configuration was used to evaluate the real device performance with an optimized MoS2/Fe3O4 nanocomposite. To prepare the symmetric cell, a slurry of the active materials was cast on two glassy carbon electrodes, employed as the anode and the cathode of the supercapacitor. All other measurement conditions were kept unchanged for the two-electrode configuration.Results and discussion
X-ray diffraction (XRD)
Fig. 3 shows the X-ray diffraction (XRD) patterns of MoS2 nanoflowers and MoS2/Fe3O4 nanocomposites. The diffraction patterns observed for the pristine MoS2 nanoflower can be satisfactorily matched with the JCPDS card number 37–1492 and the corresponding peaks can be indexed to the (002), (100), (102), (006), and (110) reflections. The most prominent peak in the hexagonal MoS2 structure, attributed to the reflection from the (002) plane, stipulates a regular periodicity along the c-axis, indicating a well-layered structure along the [001] direction.40–42 | ||
| Fig. 3 XRD patterns of pure MoS2 nanoflowers and MoS2/Fe3O4 nanocomposites. The peak marked with an asterisk corresponds to the (311) plane of Fe3O4 nanodiamonds, and this peak appears only in the nanocomposite with 5% Fe3O4 due to the presence of an excessive amount of Fe3O4. | ||
In the case of MoS2/Fe3O4 composites with up to 3% Fe3O4 content, no distinct Fe3O4 peak was observed in the diffraction pattern which could likely be due to the presence of only a minute amount of Fe3O4 nanodiamonds along with their poor crystallinity. However, a new peak at a 2θ value of 36° (marked with an asterisk (*)) appeared in the diffraction pattern of the MoS2/5% Fe3O4 nanocomposite which corresponded to Fe3O4 nanodiamonds and this peak can be indexed to the (311) reflection of diamond-shaped Fe3O4 nanoparticles, which has the highest relative intensity among all the (hkl) reflections from polycrystalline Fe3O4.43 The addition of Fe3O4 nanodiamonds to MoS2 results in a small peak shift, observed for the (002) reflection in Fig. 3, suggesting a small uniform parent lattice deformation, which could possibly be explained by the formation of defects due to the incorporation of Fe2+/Fe3+ ions into the MoS2 lattice. In fact, the incorporation of Fe3O4 nanodiamonds into MoS2 nanoflowers could cause both Fe2+/Fe3+ and Mo4+ ions to migrate across the MoS2/Fe3O4 interface over a limited distance (due to low ionic mobility in solid phases at low processing temperature) on either side of the interface leading to the formation of crystal defects as follows:
 | (1) |
 | (2) |
 | (3) |
 | (4) |
On top of that, in the case of material processing carried out at low temperature (∼200 °C) the formation of bulk lattice defects within the matrix is not unlikely as shown below:
 | (5) |
The limited migration of Mo4+ and Fe2+/Fe3+ ions across the interface could create both substitutional (eqn (1) and (2)) and interstitial (eqn (3) and (4)) defects which are accompanied by generation of free carriers (e−) to maintain the charge neutrality within a narrow region of the interface giving rise to carrier rich zones around the contact areas between the two solid phases of the nanocomposite. Additionally, the possible coexistence of multivalence state of Fe in magnetite could contribute towards polaronic type hopping within the bulk of nanodiamonds as follows:
 | (6) |
Apart from the above, due to the relative abundance of S with respect to Mo in the starting MoS2 precursor solution, it is not unlikely to expect an abundance of S-interstitial compared to any cationic interstitial within the MoS2 lattice.
Now the vacancies and interstitials from reactions (1), (3) and (4) could contribute to matrix lattice distortion. The formation of defects could also generate both non-uniform and uniform lattice strain in the material, potentially leading to a reduction in the average crystallite size.44 This decrease in size is also evident with the addition of Fe3O4 nanodiamonds, as illustrated in Fig. 4. Nonetheless, Mo4+ could also migrate across the composite interface and could form the crystallographic defects within the dispersed Fe3O4 nanodiamonds as shown by eqn (2). However, with the volume fraction of the nanodiamonds being much smaller than that of the MoS2 matrix, any influence of lattice disorder generated within the relatively small fraction of Fe3O4 on the overall microstructure of the bulk nanostructured composite could be neglected for the time being. Yet the cationic vacancy  generated by Mo4+ migration across the interface could add to defect induced disorder within the MoS2 matrix lattice.
 | ||
| Fig. 4 The variations in crystallite size (L), dislocation density (δ), and stacking fault (SF) for pure MoS2 nanoflowers and δ-MoS2/Fe3O4 nanocomposites with Fe3O4 content, obtained from XRD line profile analysis. The addition of 3% Fe3O4 nanodiamonds resulted in the highest dislocation density and stacking fault and the smallest crystallite size. | ||
Wu et al. hydrothermally synthesized MoS2 microspheres with a flower-like structure, where high-resolution XPS spectra revealed two core-level Mo 3d peaks at binding energies (BEs) of 229.6 eV and 232.8 eV, corresponding to Mo 3d5/2 and Mo 3d3/2, characteristic of Mo(IV). Furthermore, the core-level S 2p spectra at BEs of 162.4 eV and 163.5 eV were attributed to S 2p3/2 and S 2p1/2, consistent with sulfur in the −2 oxidation state.45 Similarly, Li et al. prepared defect-rich MoS2 nanoflowers by a hydrothermal method and identified BEs at 229.1 eV and 232.1 eV in the Mo 3d region, also indicative of Mo(IV). Additionally, S 2p spectral peaks with BEs of 162.3 eV and 163.5 eV were associated with S 2p3/2 and S 2p1/2, confirming the S2− oxidation state.46 Mizanur et al. developed a MoS2/MnS nanocomposite, with high-resolution XPS spectra showing six distinct peaks, including two doublets for Mo at 229 eV and 232.15 eV, confirming the presence of Mo(IV).32 Pawar et al. analyzed Fe3O4 using XPS, revealing that the Fe 2p3/2 peak consisted of two maxima at 710.96 eV and 708.39 eV, whereas the Fe 2p1/2 peak was deconvoluted into peaks at 722.8 eV and 725.3 eV, indicative of the presence of Fe2+ and Fe3+ species.47 Similarly, Esfandiari et al. studied the core-level XPS spectra of Fe3O4, identifying Fe(III) 2p3/2 and Fe(III) 2p1/2 peaks at 711.89 eV and 725.53 eV, and Fe(II) 2p3/2 and Fe(II) 2p1/2 peaks at 710.94 eV and 723.33 eV, respectively, confirming the coexistence of Fe2+ and Fe3+ in Fe3O4.48
The diffraction patterns in Fig. 3 display a significantly high noise-to-signal ratio. The presence of weak and diffuse XRD peaks suggests that the synthesized MoS2 nanostructure has poor crystallinity. In such materials, the arrangement of atoms or molecules lacks long-range order, resulting in significant disorder over large scales. This poor crystallinity may be due to the factors such as the size effect, lattice distortion, dislocation density, and stacking faults that are directly connected to the formation of lattice defects.49 The average crystallite size (L) of the sample was determined using the Scherrer formula:
 | (7) |
 | (8) |
The stacking fault (SF) within the MoS2 layered structure was estimated from the equation below:
 | (9) |
Fig. 4 depicts the relationship between the structural parameters and the amount of diamond-shaped Fe3O4 nanoparticles in MoS2 nanoflowers. The addition of Fe3O4 nanodiamonds results in an initial decrease in the average crystallite size by ∼39% for up to 3% Fe3O4 in the nanocomposite when compared to pristine MoS2. However, as the Fe3O4 content exceeds 3%, the average crystallite size increases by ∼54% at 5% Fe3O4 relative to the crystallite size observed for 3% Fe3O4 content. Additionally, Fig. 4 illustrates a variation in the stacking fault, which reflects the degree of lattice imperfections caused by the incorporation of diamond-shaped Fe3O4 nanoparticles into the MoS2 nanoflowers. The stacking fault exhibits ∼17% increment with the increase in Fe3O4 content up to 3% compared to pure MoS2. The increased stacking fault may result from crystal imperfections, vacancies, and dislocations within the layered structure. However, increasing the diamond-shaped Fe3O4 content beyond 3% caused a ∼39% decrease in the stacking fault for the nanocomposite with 5% Fe3O4, which at the same time led to an increase in the average crystallite size. Fig. 4 also shows the variation in interface dislocation density caused by the incorporation of diamond-shaped Fe3O4 nanoparticles. The dislocation density, reflecting the level of defects arising from lattice mismatch at the crystallite interfaces, increased by ∼15% for up to 3% Fe3O4 nanodiamonds. However, it decreased by ∼63% for 5% Fe3O4 incorporation compared to the MoS2/(3%) Fe3O4 nanocomposite. The dislocation density and stacking fault generally indicate the level of imperfections in the prepared samples. In Fig. 4, both dislocation density and stacking fault of the MoS2/Fe3O4 nanocomposites appear to follow a similar trend, indirectly suggesting their interdependency. Thus, the incorporation of Fe3O4 nanodiamonds into pure MoS2 nanoflowers causes lattice distortion, resulting in defects like dislocations, stacking imperfections, and point defects as described before, potentially leading to the formation of openings and/or interconnected channels for transportation of various charged species from the electrode surface to the interior. This could enhance the transportation of electrons and ions within the electrode. Additionally, structural imperfections within MoS2 crystals may disrupt the crystal lattice arrangement, creating new active sites that enhance electrochemical performance. The combined effects of changes in crystallite size, lattice distortion, and crystal defects can lead to increased effective surface area through the creation of new active sites, and improved charge carrier intercalation/deintercalation kinetics during the charging/discharging process.38,39,50–52 Notably, among all the samples, the MoS2/(3%) Fe3O4 composite shows the smallest crystallite size and the highest crystal imperfection, which are likely to contribute to improved charge carrier transportation, enhancing the overall electrochemical performance.50,53
Scanning electron microscopy (SEM)
Fig. 5(a) shows an FE-SEM micrograph of Fe3O4 nanoparticles. Due to their diamond-like appearance, these Fe3O4 nanoparticles are referred to as nano-diamonds, as illustrated in the inset of Fig. 5(a). The Fe3O4 particles display two distinct size distributions, where more than 80% of the particles are ∼40–50 nm in size, while the larger particles, making up less than 20% of the total, range from ∼300 to 400 nm. Fig. 5(b) and (c) display micrographs of pristine MoS2 at different magnifications, revealing a flower-like nanostructure composed of numerous aligned but curled nano-petals. These nano-petals are connected in a hierarchical fashion through a common central core (shown later), forming flower-like structures. A nanostructure typically refers to an organized formation of nanoscale sub-units, and in this case, the 2D nano-petals are arranged in a manner so as to create 3D flower-like patterns.54 However, as observed in Fig. 5(b), these flower-like structures tend to form in clusters. The average diameter of the nanostructured flowers is ∼5 to 7 μm, while the average thickness of the nano-petals is ∼18 nm. When Fe3O4 nanodiamonds are added to the MoS2 precursor solution, Mo4+ ions from the cationic precursor are likely to be drawn to the surface of the Fe3O4 nanodiamonds due to various forces arising from van der Waals, cohesive, electrostatic, or other chemical interactions.55 Negatively charged sulfide ions (S2−) from the precursor react with molybdenum ions (Mo4+) on the surface of the Fe3O4 nanodiamonds, resulting in the formation of MoS2 nanoflowers.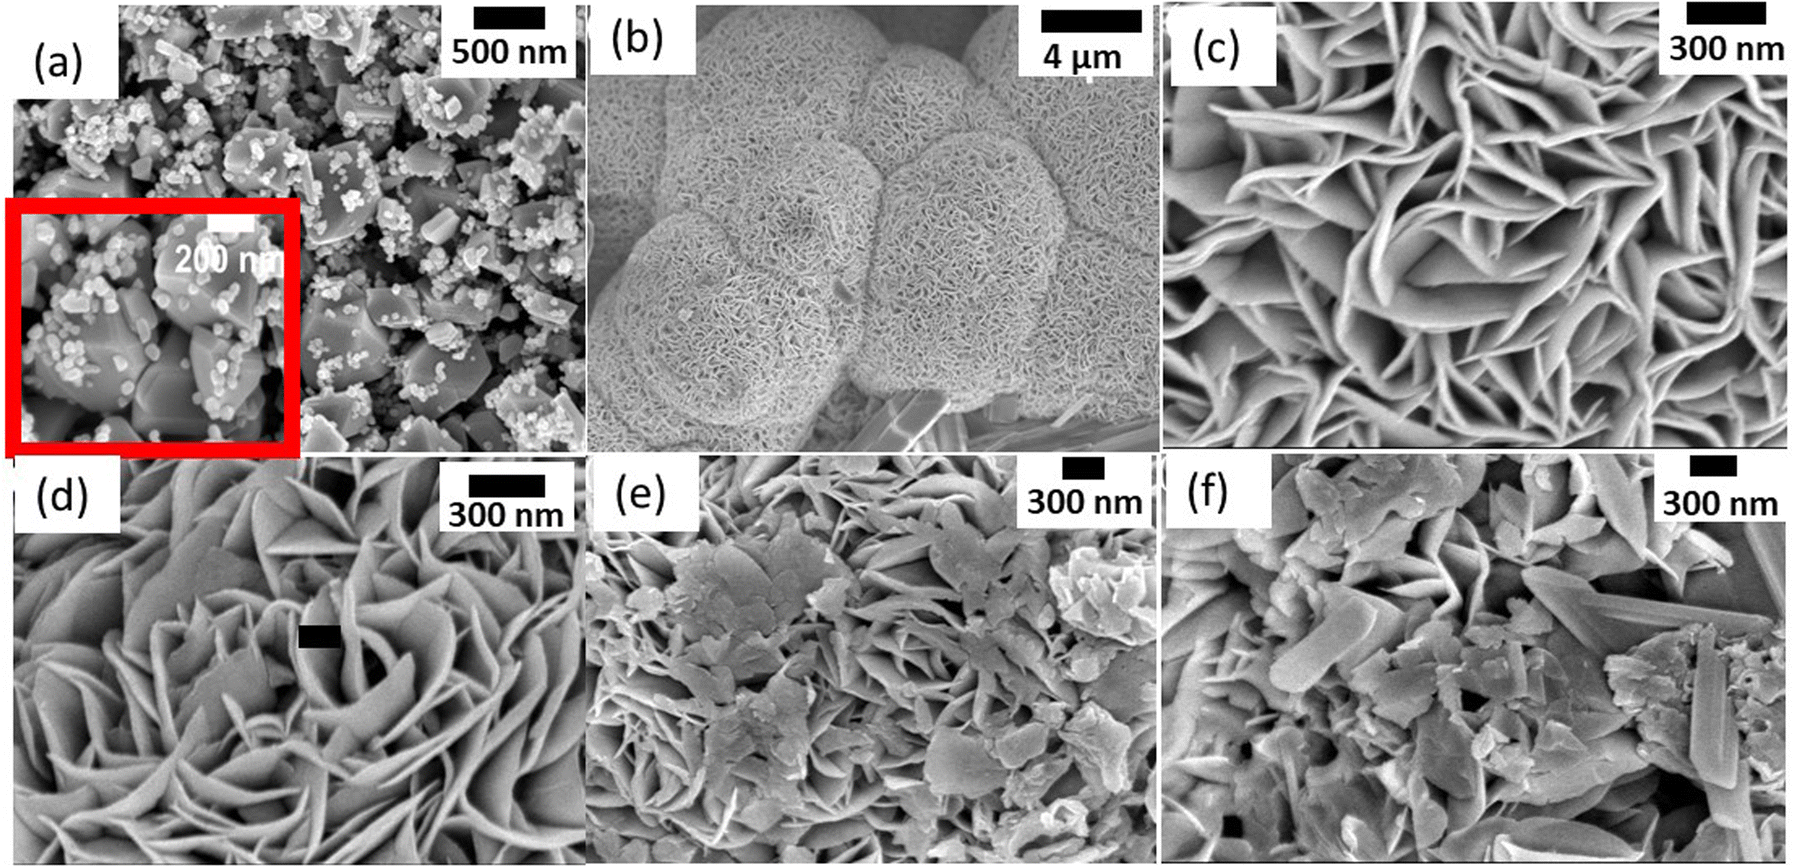 | ||
| Fig. 5 FE-SEM micrographs of (a) Fe3O4 nanodiamonds, (b and c) pristine MoS2 nanoflowers at different magnifications where the nanopetals are grown in a hierarchical manner, (d) MoS2/(1%) Fe3O4 nanocomposite, (e) MoS2/(3%) Fe3O4 nanocomposite, and (f) MoS2/(5%) Fe3O4 nanocomposite. The micrographs of the MoS2/(1%) Fe3O4 and MoS2/(3%) Fe3O4 nanocomposites look similar to pristine MoS2 nanoflowers due to low Fe3O4 content. When Fe3O4 content exceeds 3%, the nanodiamonds protrude from the surface of the MoS2 nanoflowers causing the nanoflowers to become fragmented, and thus giving them the appearance of randomly piled up nanopetals. | ||
The 3D porous architecture of the nanoflower includes both micro-pores (larger pores) and nano-pores (smaller pores). Micropores provide pathways for the rapid transport of electrolyte ions, while nano-pores offer a large surface area for ion storage and electrochemical reactions. This hierarchical porous structure ensures easy access of ions from the bulk electrolyte to the active sites within the material, which is essential for high-performance energy storage devices.56,57 In these applications, electrochemical reactions depend on the active sites on the material's surface to achieve better redox capacity and faster mass transfer rates. The porous architecture arising from the nanoflower-like structure of MoS2 increases the material's specific surface area. A higher specific surface area means more active sites are available for electrochemical reactions, which directly contributes to larger capacitance and better energy storage capabilities.58,59
Na+ ions can be intercalated or extracted not only at the surface but also within the pores due to the nanoporous structure of MoS2 that allows efficient penetration of the electrolyte. The unique morphology of the MoS2 nanoflowers consists of structural imperfections, such as dislocations, stacking faults and point defects within the MoS2 nanoflowers, creating additional pathways for Na+ ion diffusion. These imperfections reduce the energy barrier for ion movement, allowing ions to travel more freely through the electrode material. Besides, the nanoflower morphology improves the contact between the electrode material and the electrolyte. Better interfacial contact ensures efficient ion exchange and minimizes the resistance at the electrode–electrolyte interface.60,61Fig. 5(d) displays the micrograph of the MoS2/(1%) Fe3O4 nanocomposite. Due to the low wt% of Fe3O4, the micrograph closely resembles that of pristine MoS2 nanoflowers. However, the average thickness of the nano-petals has slightly increased to ∼21 nm. The MoS2 nanoflowers maintain their structure without any noticeable disruption in nano-petal orientation, even with a higher Fe3O4 content (3%), as shown in Fig. 5(e). Additionally, the average thickness of the nano-petals increases to ∼26 nm at 3% Fe3O4 content. As can be seen from Fig. 5(d) and (e), the Fe3O4 nanodiamonds are barely noticeable for up to 3 wt% Fe3O4, whereas from Fig. 5(f), it can be found that as the amount of Fe3O4 nanodiamonds increases to 5%, some of their larger particles are observed to protrude on the surface of the MoS2 nanoflowers. This hinders the uninterrupted growth of the nano-petals, leading to noticeable disruptions in both the bulk and the surface regions. Consequently, the nanoflowers become fragmented, giving the appearance of randomly scattered pile of discarded petals, as depicted in Fig. 5(f). Here the growth of the nano-petals is uneven, with some growing excessively compared to others, resulting in significant variation in thickness, ranging from ∼18 to 37 nm. The variation of petal thickness is shown in Fig. SF3 (ESI†).
The typical standardless EDX (area analysis) semiquantitative spectral analysis in Fig. SF1 (ESI†) illustrates the variation in S/Mo atomic % ratio with the incorporation of Fe3O4 nanodiamonds, as clearly depicted in Fig. SF2 (ESI†). This ratio appears to increase from ∼7.4 to ∼13.3 with the addition of Fe3O4 up to 5 wt%, qualitatively indicating an abundance of the S atom in MoS2 nanoflowers. Such plenitude of sulfur could be accommodated as interstitial defects within MoS2 lattice planes as discussed earlier, and concurrently, a possible accumulation of sulfur atoms on the surface of MoS2 nanopetals cannot be ignored as suggested by Wu et al.45 It may further be inferred that this superficial accumulation of abundant unsaturated sulfur atoms could occur from the presence of an ample number of defects on the surface of ultra-thin nanosheets of MoS2, enhancing the stability of the nano petals of MoS2 through decreasing their surface energies.62,63 These active unsaturated atoms may also affect the electronic structure and modulate the activity of the reactive sites which ultimately influences the electrochemical properties.64
Transmission electron microscopy (TEM)
Fig. 6(a) presents the transmission electron microscopic (TEM) image of pure MoS2 nanoflowers, which consist of numerous nano-petals stacked in a hierarchical manner. These petal-like nanostructures appear to emerge from the core of the nanoflower (indicated by a dotted circle in Fig. 6(a)) extending in a radially outward direction. The nano-petals overlap with each other at some point due to their curled, wrinkled structures and are exceptionally thin with slightly varying thicknesses and partially transparent, as indicated by the varying light contrasts in different areas. The HRTEM image in Fig. 6(b) displays the disordered lattice fringes of MoS2 nanoflowers, with a lattice spacing of ∼0.62 nm corresponding to the (002) plane of the hexagonal structure, consistent with JCPDS card no. 37-1492, and the observed (002) plane of hexagonal MoS2 further suggests the growth of hexagonal nanopetals along the [002] crystal axis.30 The HRTEM images of the nanocomposites, shown in Fig. 6(c–e), reveal discontinuities in the lattice fringes at the curled edges, indicating the presence of dislocations and imperfections in the stacking sequence.40,45 The lattice spacings corresponding to the (002) planes of MoS2 are observed to be ∼0.63 nm, ∼0.68 nm, and ∼0.65 nm for 1%, 3% and 5% Fe3O4, respectively. This suggests that the addition of Fe3O4 nanoparticles to the MoS2 nanoflower significantly increases the lattice spacing of the nanocomposites, as illustrated in Fig. 6(f). The incorporation of Fe3O4 nanoparticles into the MoS2 nanoflowers can create defects within the MoS2 lattice as described before, leading to an enhancement in interplanar gaps.65 Furthermore, the observation of expanded lattice fringes may also suggest the presence of crystal defects, forming along crystal boundaries as a result of strain relief. Such defects may provide accessible storage sites, shortening the path for electrolyte ions. Additionally, the slight broadening of interlayer spacing can help prevent the crystallographic layers from collapsing during fast charge–discharge cycles. The hydrothermally produced MoS2/Fe3O4 nanocomposite, with its nanoporous surface, widened interlayer spacing, and unique nanoflower–nanodiamond morphology, can lead to an augmentation in specific capacitance by providing better ion intercalation, more electroactive sites, and improved electrolyte access, resulting in superior electrochemical properties and higher efficiency.55,66,67 | ||
| Fig. 6 (a) TEM image of MoS2 nanoflowers. HR-TEM images of (b) pure MoS2, (c) MoS2/(1%) Fe3O4, (d) MoS2/(3%) Fe3O4, and (e) MoS2/(5%) Fe3O4. (f) Variation of d-spacing as a function of Fe3O4 content. Here, the generation of defects due to the possible incorporation of Fe ions into the MoS2 lattice leads to the augmentation of interplanar spacing. Other point defects like S-interstitials and vacant sites could also contribute to enhancing the interplanar spacing. | ||
The TEM EDX spectra of the MoS2 and MoS2/Fe3O4 nanostructured materials are shown in Fig. SF4(a–d) (ESI†). In Fig. SF4(a) (ESI†), the peaks corresponding to Mo and S elements come from pure MoS2. In Fig. SF4(b) (ESI†), no Fe peak is observed for the MoS2/(1%) Fe3O4 nanocomposite, which can be attributed to the very small amount of Fe3O4 being added to MoS2. When 3% Fe3O4 nanodiamonds are incorporated into MoS2, a small Fe peak becomes noticeable in the EDX spectrum as shown in Fig. SF4(c) (ESI†), suggesting the presence of Fe3O4 nanodiamonds. However, Fig. SF4(d) (ESI†) exhibits a prominent peak of Fe in the MoS2/(5%) Fe3O4 nanocomposite due to a higher amount of Fe3O4 incorporation.
Electrochemical performance analysis
 | ||
| Fig. 7 (a) CV loops of MoS2 nanoflowers and other MoS2/Fe3O4 nanocomposites obtained at 60 mV s−1 scan rate; (b) variation of the area of the CV loops as a function of Fe3O4 content, calculated from (a); (c) CV loops of the MoS2/(3%) Fe3O4 nanocomposite at scan rates of 20 to 100 mV s−1; (d) Tafel's slope (fitted red line – MoS2/(3%) Fe3O4; fitted blue line – pure MoS2); variation in contribution ratio as a function of scan rates for (e) pure MoS2 and (f) MoS2/(3%) Fe3O4 nanocomposite. | ||
Moreover, Fig. 7(c) shows additional CV measurements carried out on the MoS2/(3%) Fe3O4 nanocomposite at different scan rates, knowing that this composite demonstrates the best performance. The CV curves consistently exhibit a quasi-rectangular shape at all scan rates, suggesting that both electric double-layer capacitance (EDLC) and pseudocapacitance mechanisms are likely to contribute to the charge storage process.69 This observation is further validated by analyzing the slope of the Tafel plot, according to which the relationship between current and scan rate can be described by the following equation:
| i = avb | (10) |
i can be plotted against logv, which should ideally give a straight line with a slope “b” according to eqn (10) and the value of b indicates different charge storage mechanisms. Here, b = 0.5 indicates a diffusion-controlled process typically associated with redox reactions where charge transfer occurs across the electrode/electrolyte interface, known as the faradaic process, and gives rise to pseudocapacitance, and b = 1 represents electric double-layer capacitance (EDLC), indicating capacitive behavior with charge stored at the electrode/electrolyte interface. Values within the range 0.5 < b < 1 signify a combination of both faradaic and capacitive mechanisms, stipulating a mixed charge storage behavior involving both diffusion-controlled redox reactions and capacitive storage.70,71 In note S3(A) (ESI†), detailed calculation of the Tafel slope is provided. The Tafel slopes for MoS2 and MoS2/(3%) Fe3O4 as shown in Fig. 7(d) were determined to be 0.57 and 0.60, respectively, both suggesting a charge storage mechanism that combines both the faradaic and the capacitive processes. A Tafel slope of 0.57 indicates a stronger influence of the faradaic process, implying that charge storage is more diffusion-controlled with a capacitive component. Conversely, a Tafel slope of 0.60 indicates a higher capacitive contribution, reflecting a more balanced combination of faradaic and capacitive behaviors. Although both materials exhibit mixed charge storage mechanisms, the slightly higher value of the Tafel slope for MoS2/(3%) Fe3O4 points toward an increased capacitive behavior compared to MoS2 alone.
Now, pseudocapacitance may result from processes like underpotential deposition, intercalation, and surface redox reactions. The mechanism of underpotential deposition involves the adsorption or desorption of alkali cations at the electrode/electrolyte interface through a surface process, such as
| (MoS2)surface + Na+ + e− ↔ (MoS2·Na)surface | (11) |
In the case of highly disordered materials, this underpotential deposition process has the most significant contribution. During underpotential deposition, Na+ ions get attracted to the surface of the MoS2 nanostructures from the electrolyte solution at a potential lower than the equilibrium value for the deposition to occur, as the presence of surface defects tends to suppress the deposition potential below its equilibrium value. This results in the formation of a thin layer of Na+ ions on the defect rich MoS2 surface. This dynamic interaction at the interface contributes to the overall charge storage mechanism by influencing the surface electrochemical behavior of the MoS2 nanostructures.72
The second mechanism, known as the intercalation process, involves the insertion of the alkali cations (Na+) into the layered structure of MoS2 from electrolyte and/or extraction of the alkali cations (Na+) from the layered structure of MoS2 to the electrolyte. In this structure, layers of molybdenum atoms are sandwiched between layers of sulfur atoms, forming its crystallographic framework. During charging, alkali Na+ ions penetrate into the space between the consecutive sandwich structures of MoS2 atomic layers from the electrolyte without causing any noticeable dimensional distortion of the overall crystal lattice. Conversely, during discharging, these ions are released back into the electrolyte. Thus, the intercalation and deintercalation processes are facilitated by the layered structure of MoS2.73–76 This reversible movement of ions enhances the charge storage capacity of the supercapacitor by utilizing the space within the layered structure. The intercalation process can be represented by the following equation:
| (MoS2)interlayerspace + Na+ + e− ↔ (MoS–SNa)intercalation | (12) |
The intercalation/de-intercalation process is favored by both the pristine MoS2 and the MoS2/Fe3O4 nanocomposites during the fast and reversible successive surface redox reactions. In the presence of magnetite, the Fe2+ ions can get oxidized to Fe3+ by donating electrons, and to balance this positive charge, sulfate ions from the electrolyte intercalate into the layered structure of MoS2. Simultaneously, Na+ and H+ ions from the solution also intercalate in between the MoS2 layers to accept the donated electrons.77 These processes result in the formation of conjugates, as shown in the following equations:
| 2FeIIO + SO42− ↔ (FeIIIO)+SO42−(FeIIIO)+ + 2e− | (13) |
| MoS2 + H+ + Na+ + 2e− = MoS – SHNa | (14) |
So, from the above discussions, it can readily be inferred that the presence of magnetite nanodiamonds not only enhances the ionic intercalation through the layered structure but also expedites the redox process following the intercalation. Now, the equation given below can be used to investigate the reaction kinetics:
| i = k1v + k2v1/2 | (15) |
 | (16) |
Now, using eqn (16), both k1 and k2 can be obtained from the slope and y-intercept of the i/v1/2vs. v1/2 plot, respectively. In Supplementary note S3(B) (ESI†), the detailed analysis of current contribution is provided. Fig. 7(e and f) shows that as the scan rate increases, the capacitive contribution of the materials increases, while the diffusion contribution decreases.78,79 This phenomenon arises from the fact that a significant decrease in the speed of potential sweep across the electrode at lower scan rates provides an ample amount of time for the diffusion of electrolyte ions or molecules to occur. However, when the scan rate is increased, the potential sweep becomes too fast for the ionic diffusion to occur, resulting in a reduction in diffusion contribution to current density. On the other hand, the double-layer capacitor undergoes charging and discharging due to the alternation of voltage in cyclic voltammetry measurements, resulting in a capacitive current response. When the scan rates are high (100 mV s−1), a more noticeable contribution of capacitive current is observed, as at high scan rates the potential changes rapidly, requiring the electric double layer at the electrode/electrolyte interface to charge and discharge quickly. This leads to an enhancement in capacitive current arising from an escalated rate of electrode surface charge accumulation (charging) and deaccumulation (discharging) at elevated scan rates.80
Achieving an optimal balance between capacitive and diffusion contributions is vital for ensuring effective energy utilization, rapid energy distribution, stability and a prolonged lifespan for the energy storage devices. When capacitive processes are more significant than diffusion-controlled ones, the system's ability to store energy becomes restricted, leading to a diminution in overall energy density. If diffusion processes are too dominant, the supercapacitor may experience slow charge–discharge rates and struggles to meet high-power demands. Therefore, the MoS2/(3%) Fe3O4 nanocomposite, as shown in Fig. 7(f), is more likely to achieve a better balance between capacitive and diffusion currents than pure MoS2 nanoflowers, leading to improved energy storage, higher energy and power densities, and overall better performance.
The CV responses of the MoS2/(3%) Fe3O4 nanocomposite electrode in Fig. 7(c) exhibit a gradual transition towards a more spindle-shaped loop as the scan rate increases from 20 to 100 mV s−1. At slow scan rates, the electrolyte ions have sufficient time to diffuse towards the electrode surface, allowing them to thoroughly penetrate the porous MoS2 nanoflowers and fully utilize the active surface sites within the nano-petal structure. This extensive interaction enables a large amount of charge to be stored, thereby increasing the material's specific capacitance. On the other hand, at faster scan rates, the time available for the electrolyte ions to reach the inner nanoporous surface of the MoS2 nanoflowers becomes limited. Consequently, the ions are limited to interacting solely with the active sites that are easily reachable on the outer surface. Hence the inner structure is not fully utilized for storing charges, culminating in a decrement in overall capacitance.81 Furthermore, at high scan rates, the electrode potential undergoes rapid alteration, causing the potential to shift suddenly, and hence the electrode faces difficulties in achieving equilibrium, which leads to polarization. This polarization effect hinders the charge transfer between the surface of the electrode material and the electrolyte, causing the capacitance to fall.82–84
Galvanostatic charge–discharge (GCD)
Among all electrochemical measurements, galvanostatic charging–discharging (GCD) can be used directly to determine the charge storage capacity of a material. The GCD technique more closely mimics the real-world applications and provides more accurate quantitative information compared to the CV measurement of any material. Fig. 8(a) shows the GCD curves of all samples at a current density of 0.3 A g−1 within a potential window of −0.2 to 0.4 V. A pseudocapacitive charge storage mechanism can be identified by the deviation of the GCD curve from the usual symmetrical triangular-shape. According to eqn (12)–(14), the intercalation of Na+ ions from the electrolyte into the space between the atomic layers of the crystal structure may lead to pseudocapacitive behavior.30 | ||
| Fig. 8 (a) GCD curves of MoS2 nanoflowers and MoS2/Fe3O4 nanocomposites at a specific current density of 0.30 A g−1 (IR-drop of all electrode materials is indicated by black vertical lines); (b) GCD curves of the MoS2/(3%) Fe3O4 nanocomposite at different current densities (the inset shows the specific capacitance variation of the MoS2/(3%) Fe3O4 nanocomposite as a function of current density). | ||
Fig. 8(b) depicts the GCD curves of the MoS2/(3%) Fe3O4 nanocomposite at different current densities. The specific capacitance of the nanocomposite, as determined from the GCD curves, decreases as the current density increases (as shown in the inset of Fig. 8(b)). The observed pattern of decreasing specific capacitance at higher current densities is a common phenomenon. At very low current densities, ions in the electrolyte have sufficient time to diffuse and reach all the active sites of the electrode, allowing for the complete insertion and extraction of ions within the electrode material. This allows the electrode to utilize its full capacity to store charge, leading to a higher specific capacitance.85 Conversely, at higher current densities, the limited time available for ionic diffusion prevents ions from effectively reaching all the active sites of the electrode interior, permitting only the outer surface regions of the electrode to contribute to the capacitance, rather than the bulk of the material. This restricted ionic movement and incomplete utilization of the electrode's active sites lead to a reduction in specific capacitance.86
Fig. 9 illustrates the changes in specific capacitance and discharge time of nanostructured MoS2 and MoS2/Fe3O4 composites obtained from the GCD measurements (Fig. 8(a)) at a current density of 0.30 A g−1. The specific capacitance (Csp) was determined by applying the following equation:
 | (17) |
 | ||
| Fig. 9 (a) Specific capacitance of the samples versus Fe3O4 content, with the MoS2/(3%) Fe3O4 nanocomposite exhibiting the highest specific capacitance; (b) discharge time of the samples relative to Fe3O4 content, as determined from the GCD curves shown in Fig. 8(a). | ||
Nevertheless, the crystallite size increased significantly when the Fe3O4 content exceeded 3%, leading to a decline in capacitive performance during GCD measurements, as depicted in Fig. 9(a), compared to the MoS2/(3%) Fe3O4 nanocomposite. Moreover, the collapsed nanoporous electrolytic channels in MoS2/(5%) Fe3O4 by the protruding Fe3O4 nanodiamonds as described previously could contribute significantly towards the observed reduction in specific capacitance by blocking effective percolation of the electrolyte into the bulk and thus diminishing the effective electrode/electrolyte contact area or available active electrode surface sites.
Additionally, in Fig. 8(a), a rapid drop in potential can be observed at the beginning of the discharging phase, indicating energy dissipation caused by internal resistance.90 The MoS2/Fe3O4 nanocomposite electrodes exhibit relatively small abrupt potential drop (IR drop) compared to the pure MoS2 electrode, indirectly suggesting that the incorporation of Fe3O4 into MoS2 nanoflowers results in higher conductivity or reduced internal resistance. The decrease in internal resistance could be partly attributed to the development of structural imperfections (vacancies and interstitials), the presence of Fe3O4 with multiple oxidation states and narrow conducting pathways generated by the possible cation exchange across the MoS2–Fe3O4 interface, as discussed before. The enhanced conductivity could improve charge transportation dynamics within the system. It has also been suggested that incorporation of Fe3O4 nanodiamonds into pure MoS2 decreases the self-discharging phenomenon, leading to a minimal voltage drop and an increase in discharge time.91
Electrochemical impedance spectroscopy (EIS)
Electrochemical impedance spectroscopic (EIS) analysis can provide additional evidence to support the influence of conductivity and internal resistance on the specific capacitance trend of nanocomposites. The EIS measurements were conducted to assess the resistive characteristics and gain insights into the charge transfer mechanisms of both pure MoS2 and composite electrodes. The fitted Nyquist plots for all samples are shown in Fig. 10, highlighting different regions that correspond to charge transfer-limited and diffusion-limited processes in the supercapacitor. Conventionally, a high-frequency semicircle and a low-frequency inclined line can be differentiated by the knee frequency, as shown in Fig. 10. | ||
| Fig. 10 EIS spectra of (a) pure MoS2 nanoflowers; (b) MoS2/(1%) Fe3O4 nanocomposite; (c) MoS2/(3%) Fe3O4 nanocomposite; and (d) MoS2/(5%) Fe3O4 nanocomposite electrodes. The solid lines indicate the fitted data. The inset of all graphs shows equivalent Randle's circuit with which the experimental EIS data were fitted to extract the values of different electrical components of the circuit. | ||
In the high frequency region, the intersection of the semicircle with the real impedance axis with a non-zero value represents the equivalent series resistance (Rs) which is a combination of the interfacial resistance between the electrode and the current collector, the intrinsic ionic electrolyte resistance, and the internal resistance of the electroactive materials.92 In the high-to-medium frequency range, the semicircle corresponds to a parallel combination of the constant phase element (CPE) and the charge transfer resistance (Rct). The CPE signifies the non-ideal capacitive behavior of the electrochemical system. In the low frequency region, the straight line, inclined to the Z′-axis of the Nyquist plot, represents the Warburg impedance (Zw), which describes the impedance associated with the ionic diffusion in the electrolyte. An equivalent Randle's circuit, as shown in the insets of Fig. 10, was adopted to simulate the experimental EIS spectra using Z View software, to extract various electrical components of the circuit.
According to the fitting circuit, the MoS2/(3%) Fe3O4 composite exhibits a rather low Rs value among all the nanocomposites as shown in Table 1. This could be attributed to the optimum incorporation of Fe3O4 nanodiamonds. However, in the case of magnetite, above the Verwey transition temperature (>120 K), the density of states at the Fermi level is non-zero, and it conducts electricity effectively behaving like a zero-band-gap material.93 Thus, Fe3O4 behaves like a metal at room temperature, where conductivity arises from electron hopping between Fe2+ and Fe3+ ions in its inverse spinel structure.94 Now, depending on the extent of interdiffusion of ions across the solid interface, two common scenarios may arise. On the one hand, the work function of the Fe3O4 phase could be considerably greater than that of MoS2, and on the other hand, the work function of the Fe3O4 phase could be smaller than or very close to that of MoS2, if not smaller. Now, in the case of predominant migration of Fe2+/Fe3+ ions across the interface to the MoS2 phase, some extra free carriers are expected to be generated within the MoS2 lattice causing the Fermi level of MoS2 to rise above that of Fe3O4. In such case, the chemical equilibrium is attained through migration of free carriers across the interface to level-off the Fermi energy levels of the two phases in contact, and consequently, a Schottky-type interface potential barrier could form at the Fe3O4–MoS2 interface. On the other hand, in the case of predominant migration of Mo4+ ions into the Fe3O4 lattice, some extra free carriers are expected to be generated within the magnetite lattice causing its Fermi level to rise above that of MoS2. In such case, to establish chemical equilibrium, the Fermi levels of both phases are levelled off through transfer of electrons from Fe3O4 to MoS2 near the interface region causing the band to bend in such a way that pure ohmic contact is generated between the two phases. Now, following the EIS study of the nanocomposite system as depicted in Fig. 10, it can be reasonably inferred that no strong Schottky type potential barrier could have formed at the Fe3O4–MoS2 interface, as no prominent feature other than a single semicircle, a linear inclined slope and a high frequency intercept at the real axis of the Nyquist plot obtained from the extrapolation of the semicircle, consecutively associated with the electrode–electrolyte interfacial charge transfer process, Warburg diffusion and the internal resistance, could be observed in support of an interface potential barrier. However, the formation of a pure resistive contact at the interface can readily be justified by considering it as a contributor towards the overall series resistive component Rs in the EIS spectra. Nonetheless, it is not unlikely that a weak Schottky potential could have formed at the interface, the effect of which is approximately similar to that of the resistive effect. Therefore, the presence of dispersed Fe3O4 nanodiamonds in MoS2 nanoflowers act like localized regions of conductive sinks, which could effectively reduce the equivalent series resistance (Rs), as observed from the EIS data in Table 1, particularly for the MoS2/(3%) Fe3O4 sample. The lower Rs indicates minimal energy loss during electron flow through the bulk of the material system, indirectly indicating an improved bulk electrode material conductivity under the assumption that the electrode–collector contact resistance remains unchanged. Such enhanced bulk electrode conductivity not only facilitates faster electron transfer but also supports improved discharging behavior through reduction in linear potential drop as indicated by the reduced IR loss in the GCD response of MoS2/Fe3O4 nanocomposites compared to pure MoS2 nanoflowers (Fig. 8(a)).95
| Electrode | R s (Ω) | R ct (Ω) | Z w (Ω) |
|---|---|---|---|
| Pure MoS2 | 6.7 | 5.9 | 18.09 |
| MoS2/(1%) Fe3O4 | 9.2 | 3.2 | 23.79 |
| MoS2/(3%) Fe3O4 | 7.3 | 1.8 | 11.56 |
| MoS2/(5%) Fe3O4 | 7.5 | 3.83 | 11.93 |
The diameter of the semicircle of the Nyquist plot is directly related to the charge transfer resistance (Rct) at the interface between the electrode and the electrolyte. The MoS2/(3%) Fe3O4 nanocomposite exhibits the smallest semicircle diameter, signifying the lowest Rct (1.8 Ω) compared to both pristine and other nanocomposite samples as shown in Table 1. It has already been argued that introducing diamond-shaped Fe3O4 nanoparticles into MoS2 nanoflowers can create a synergistic effect by enhancing the specific surface area, defect induced active surface sites and lattice interlayer spacing of the nanocomposites which in turn can promote charge transfer across the interface between the electrode and the electrolyte, causing the nanocomposite to surpass pure MoS2 in terms of electrochemical performance.96 The lowest Rct value of the MoS2/(3%) Fe3O4 nanocomposite suggests that 3% Fe3O4 content is optimal for improving the charge transportation across the electrode/electrolyte interface. However, increasing the Fe3O4 content beyond this level causes random fragmentation of the MoS2 nanopetals which accumulate in the form of discarded piles of detached petals partly blocking the nanoporous channels and hence the active surface sites deeper inside the nanoflowers for redox reaction to occur, as discussed in the previous sections. These blockages could also hamper the Na+ intercalation process and lead to an increase in charge transfer resistance.
In the Nyquist plot, all the 3-electrode systems display a slope between 45° and 90° in the low-frequency range, indicating a combination of capacitive and diffusion-controlled behaviors.77 From Table 1, it is evident that the MoS2/(3%) Fe3O4 3-electrode system has the lowest Warburg impedance (Zw) of 11.56 Ω compared to the other systems, suggesting that the given system has a superior ionic diffusion transportation capability than others. This observation indirectly suggests that an efficient ionic intercalation through the broadened crystallographic interlayer spacing of the MoS2/(3%) Fe3O4 composite renders a steeper ionic gradient in the electrolyte, by effectively limiting any type of ionic charge accumulation at the electrode–electrolyte interface. This in turn allows for an enhanced ionic diffusion drive through the electrolyte and thus lowers the Warburg impedance to some extent that contributes towards the improved specific capacitance of the sample. Hence, the EIS result is also consistent with the CV and GCD analyses, demonstrating that the nanostructured composites have lower resistance for charge migration between the electrolyte and the electrode compared to pristine MoS2 nanoflowers.
Cyclic stability
Long-term cyclic stability is crucial for any supercapacitor based device. The MoS2/(3%) Fe3O4 nanocomposite demonstrated the highest specific capacitance compared to all other samples in this study. Thus, it was subjected to repeated GCD measurements to evaluate its capacitance retention capability and coulombic efficiency over 10000 cycles, as depicted in Fig. 11. The calculations of capacitance retention and coulombic efficiency were performed using the following equations: | (18) |
 | (19) |
 | ||
| Fig. 11 Long-term cyclic stability performance showing capacitance retention and coulombic efficiency of the MoS2/(3%) Fe3O4 nanocomposite sample measured at a current density of 2 A g−1 over 10000 cycles. | ||
In eqn (19), tdischarge refers to the time duration the system requires to release its stored energy or discharge, while tcharge represents the time needed to fully charge the system. As shown in Fig. 11, the MoS2/(3%) Fe3O4 nanocomposite electrode retained 84% of its initial specific capacitance after 10000 charge–discharge cyclic loading at a current density of 2 A g−1, demonstrating good cyclic stability. Fig. 11 also shows that after 5000 cycles, the coulombic efficiency is ∼94%, which rises to 103% after 10000 cycles. This level of retention at the given current density suggests that the system preserves a significant portion of its energy storage capacity even after extensive cycling, which is a rather desirable feature for practical applications. However, a monotonic reduction in capacitance retention is observed in Fig. 11. As the system undergoes repeated charging–discharging cycles, the mechanical stress associated with repeated cycling can lead to the collapse of the electrode structure and separation of active materials from the electrode. Such deterioration in structural integrity reduces the effective contact area between the active material and the electrolyte, which is essential for efficient interfacial charge transfer and energy storage. As the contact area decreases, the capacitance of the system decreases, resulting in a decrease in performance. The materials’ detachment not only reduces the effective area for charge transfer but also results in the dissolution of active materials into the electrolyte and alters its ionic transportation property. Nonetheless, as the contact between the electrode and the current collector weakens due to electrode disintegration, the system becomes less efficient at storing and releasing charge, leading to a drop in specific capacitance.34,97
The efficiency value obtained from eqn (19), expressed as percentage, reflects how effectively the system utilizes the charge collected during the charging process. A higher coulombic efficiency indicates better performance, as more of the input energy is retained and made available during the discharging phase. Fig. 11 shows that after 4000 cycles, the coulombic efficiency is ∼95%, which rises to 103% after 10000 cycles, highlighting the exceptional stability of the MoS2/(3%) Fe3O4 composite. Here, the electrode's exceptional cycling stability and high efficiency can be attributed to its long-lasting structural integrity and improved ionic diffusion within the pores over time.98,99 Overall, the nanocomposite's advantageous morphological and structural features contribute to its stability, as evidenced by the analyses.
The comparative analysis of MoS2/Fe3O4 based composites reveals the superior performance in the current study, which employs a hydrothermal synthesis route to create defect-rich MoS2 nanoflowers with 3% diamond-shaped Fe3O4 nanoparticles as shown in Table ST1. This work achieves a specific capacitance of 712 F g−1 at 0.3 A g−1, which outperforms the 2D MoS2 sheets with polygonal-shaped Fe3O4, the flower-like MoS2 with spherical Fe3O4, the sheet-like MoS2 with nonuniform spherical Fe3O4 and the MoS2 nanosheets with uniform sized Fe3O4 nanoparticles exhibiting specific capacitances of 401 F g−1 (at 0.5 A g−1),33 522.7 F g−1 (at 0.5 A g−1),35 527 F g−1 (at 0.5 mA cm−2)34 and 670 F g−1 (at 0.25 A g−1),36 respectively. In terms of capacitance retention, our optimized material also outperforms by retaining 94% after 5000 cycles (84% after 10000 cycles), compared to 89.3% after 5000 cycles for the Fe3O4/MoS2/PANI composite synthesized by a hydrothermal method and 76% after 2000 cycles for the MoS2/Fe3O4 composite synthesized via thermal decomposition. The distinctive defect-rich nanoflower morphology combined with Fe3O4 nanodiamonds provides numerous active sites, as discussed previously. This contributes to the exceptional electrochemical properties observed in the current study, establishing it as one of the most promising candidates among the most recently developed MoS2/Fe3O4 based nanostructured composites in terms of both specific capacitance and long-term stability.
To investigate the reduction of capacitance retention, EIS measurements were performed before and after the cycling test. Fig. 12 shows the Nyquist plots for MoS2/(3%) Fe3O4 before and after the cycling test. The extracted data from the fittings (using ZView software) shown in Table ST2 (ESI†) reveal that Rs, Rct and Zw increased by 8.2%, 27.8% and 1.3%, respectively, following the long-term GCD cyclic loading process. Here the noticeable rise in Rct suggests a reduced efficiency of interfacial charge transfer due to structural degradation. Over an extended cyclic loading, however, the mechanical damage of the network of microstructural channels limits the availability of active redox sites by restricting the specific surface area of the interfaces, causes loss of disintegrated active electrode material and hampers ionic diffusion, thereby enhancing the resistive contributions from all three electrical components, with a conspicuous increment in electrode–electrolyte charge transfer resistance. This increase in post-cycling Rct hinders faradaic activity by slackening the interfacial electron transfer kinetics.
 | ||
| Fig. 12 EIS spectra of MoS2/(3%) Fe3O4 (a) before and (b) after the cyclic stability test. The solid lines indicate the fitted data. The inset of all graphs shows equivalent Randle's circuit with which the experimental EIS data were fitted to extract the values of different electrical components of the circuit. | ||
Additionally, Table 2 presents some recently reported electrochemical data for various MoS2 and MnO2-based electrodes with different structural and morphological characteristics. Here, our MoS2/(3%) Fe3O4 shows the highest specific capacitance and % capacity retention among the reported nanocomposites. The superior capacitive performance clearly indicates that the hydrothermally prepared MoS2/(3%) Fe3O4 nanocomposite is a very suitable candidate material for high-performance supercapacitor electrodes.100,101
| Electrode | Synthesis route | Electrolyte | Specific capacitance (F g−1) | Capacitance retention | Ref. |
|---|---|---|---|---|---|
| Fe3O4/MnO2/RGOs | Hydrothermal | 1 M Na2SO4 | 77.5 F g−1 at 0.5 A g−1 | — | 100 |
| CNTs/MoS2/Fe3O4 | Hydrothermal | 6 M KOH | 522.7 F g−1 at 0.5 A g−1 | — | 35 |
| Fe3O4/MoS2/PANI | Hydrothermal | 3 M KOH | 401 F g−1 at 0.5 A g−1 | 91% after 4000 cycles | 33 |
| MoS2/MnS | Hydrothermal | 0.5 M Na2SO4 | 351 F g−1 at 0.3 A g−1 | 78% after 4000 cycles | 32 |
| rGO/CNT/MnO2 | Hydrothermal | 1 M Na2SO4 | 319 F g−1 at 0.5 A g−1 | 89% after 3000 cycles | 101 |
| MnO2 nanospheres/carbon nanoparticles/graphene | Freeze-drying | 1 M Na2SO4 | 255 F g−1 at 0.5 A g−1 | 83% after 1000 cycles | 102 |
| MnO2/PPy/rGO | Sonication-induced assembly of aqueous dispersions | 0.5 M Na2SO4 | 404 F g−1 at 0.25 A g−1 | 92% after 4000 cycles | 103 |
| MnO2/(3%) Fe3O4 | Hydrothermal | 0.5 M Na2SO4 | 459 F g−1 at 0.3 A g−1 | 75% after 4000 cycles | 49 |
| MoS2/MnO2 | Hydrothermal | 0.5 M Na2SO4 | 199.12 F g−1 at 0.04 A g−1 | 95% after 4000 cycles | 31 |
| MoS2/(3%) Fe3O4 | Hydrothermal | 0.5 M Na2SO4 | 712 F g−1 at 0.3 A g−1 | 95% after 4000 cycles; 84% after 10000 cycles |
This work |
Two electrode system
Two-electrode systems are preferred over three-electrode systems in practical device applications. Therefore, a prototype supercapacitor was made using the optimized MoS2/(3%) Fe3O4 nanocomposite as the electrode material, to evaluate its performance for real-world applications under symmetrical two-electrode configuration. In this setup, the MoS2/(3%) Fe3O4 nanocomposite served as both the anode and cathode material. The electrolyte was 0.5 M Na2SO4 solution. The Whatman filter paper acted as a separator, preventing direct contact between the two electrodes, and the electrolyte ensured ionic connectivity between them. Fig. 13 depicts the schematic diagram of the charge storage mechanism in a symmetric two-electrode system, where the charge storage process combines electric double-layer capacitance (EDLC) and pseudocapacitance. The pseudocapacitance contribution may arise from intercalation, underpotential deposition, and surface redox reactions, during charging, whereas these processes are reversed during discharging. | ||
| Fig. 13 A schematic representation of the charge storage mechanism of a two electrode symmetric supercapacitor. Under an applied voltage, Na+ and SO42− ions migrate toward the respective electrodes, forming two distinct regions: the inner Helmholtz plane (IHP), which is located directly adjacent to the electrode surface, and the outer Helmholtz plane (OHP), which extends further into the bulk electrolyte. The interaction between these planes establishes the basis of the electric double layer capacitance (EDLC). Additionally, the porous, defect-rich structure with slightly widened interlayer spacing of the MoS2/(3%) Fe3O4 electrode provides better electrode–electrolyte interaction, enhancing the charge storage capacity through processes like ion percolation and intercalation, surface adsorption, and redox reactions. These mechanisms contribute significantly to the pseudocapacitance of the system. The combination of EDLC and pseudocapacitance mechanisms underpins the overall charge storage process, allowing for enhanced energy storage performance. | ||
When an external voltage is applied to charge the electrodes, Na+ and SO42− ions of the electrolyte solution move towards the respective electrode surfaces. The positive ions (Na+) migrate towards the negative electrode (cathode) and negative ions (SO42−) migrate towards the positive electrode (anode). Some of these ions get adsorbed onto the electrode surfaces, forming a layer called the inner Helmholtz plane (IHP). The adsorption of electrolyte ions on the surface is significantly influenced by the presence of surface vacancies, as suggested by eqn (1) and (5). The cationic vacancies  at the surface of the electrode function as negatively charged sites that attract positively charged Na+ ions, effectively stabilizing the double layer, as follows:
 | (20a) |
 at the surface of the anode act as positively charged sites interacting with SO42− ions, facilitating the formation of a double layer as follows:
 | (20b) |
The IHP is marked by high density of ions resulting from strong electrostatic interactions between the electrode surface and various charged species in the electrolyte. This region consists of highly ordered solvent molecules and ions due to higher electrostatic force, which are crucial for forming the electric double layer (EDL) and facilitating reversible redox reactions. The outer Helmholtz plane (OHP) lies beyond the IHP, which consists of ions that are less tightly bound to the electrode surface compared to those in the IHP. This layer serves as a transitional region between the bulk electrolyte and the IHP. Ions adsorbed in the IHP are closely bound, leading to charge separation physically, creating an area of high capacitance. The IHP and OHP together form the electric double layer (EDL), which stores higher energy near the electrode surface region. The diffuse layer, extending from the OHP to the bulk electrolyte, contains more mobile ions that are less influenced by the electrode surface. The diffuse layer, although not directly contributing to energy storage processes, plays a vital role in creating and maintaining the necessary conditions for pseudocapacitance or EDLC.
Fig. 13 shows that electrolyte ions can intercalate between the crystallographic layers of the MoS2/(3%) Fe3O4 nanocomposite, which is known as ion intercalation. Defects such as vacancies increase the number of active sites available for intercalation. The defect sites can strongly interact with incoming ions, facilitating their adsorption and subsequent intercalation. Sulfur and molybdenum vacancies (according to eqn (1) and (5)) can enhance electrolyte ion intercalation by providing additional entry points and diffusion routes within the material's layered structure. The subsequent electrode REDOX reactions can be expressed as
| Cathode: (MoS2)(interlayerspace) + xNa+ + xe− → NaxMoS2 | (21a) |
| Anode: 2FeIIO + (MoS2)interlayer + SO42− ↔ (FeIIIO)+SO42−(FeIIIO)+ + 2e− | (21b) |
| (MoS2)interlayer + xSO42− → MoS2(SO4)x + 2xe− | (21c) |
Reversible surface redox reactions have a great influence on the overall charge storage process. The vacancy defects could create under-coordinated atoms around the defect site, which are chemically more active. These atoms can strongly interact with reactants, making the surface more reactive for redox processes. Vacancies alter the local electronic density of states, often creating localized defect states. These can lower the activation energy for electron transfer during redox reactions, enhancing the reaction rate. Additionally, the diffuse layer facilitates the necessary conditions for these surface redox reactions by providing a stable ionic environment that supports fast and reversible processes at the electrode surfaces. Consequently, the total capacitance is derived from the combined contributions of both electric double-layer capacitance (EDLC) and pseudocapacitance mechanisms, enhancing the overall energy storage capability.
However, the charging process is reversed during discharging. When the potential applied to the electrode is reduced during the discharging process, the Na+ and SO42− ions that were previously intercalated into the MoS2/(3%) Fe3O4 lattice and participated in the surface redox reactions are released back into the electrolyte solution, which can be shown simply by reversing eqn (20) and (21), associated with a reverse redox reaction, deintercalation and surface desorption processes.
Now, the electrochemical measurements with two electrode configuration (in Fig. 14) were performed within the same potential window (−0.2 to 0.6 V) adopted for the three-electrode system. The measurements were carried out at different scan rates ranging from 20 to 100 mV s−1 in a 0.5 M Na2SO4 aqueous electrolyte. The CV loops of the MoS2/(3%) Fe3O4 electrode, as shown in Fig. 14(a), maintained their shape even at high scan rates, indicating the material's excellent reversibility and high-rate capability in the case of two electrode device application. The CV loops of the MoS2/(3%) Fe3O4 material exhibit a consistently stable quasi-rectangular shape across the entire potential range, regardless of the scan rate, indicating that the mechanisms of both electric double-layer capacitance (EDLC) and pseudocapacitance may be active in the charge storage process.69 Additionally, in order to understand the charge storage mechanism of the electrodes, the value of Tafel slope ‘b’ (according to eqn (10)) was calculated, which was found to be 0.59 as shown in Fig. 14(b). The value is comparable to those observed for the three-electrode system, suggesting a charge storage mechanism that combines both the faradaic and the capacitive processes. To comprehend the reaction kinetics, both capacitive and diffusive current contributions were determined as shown in Fig. 14(c) following eqn (16). The figure demonstrates that as the scan rate increases, the capacitive contribution of the synthesized samples increases, while the diffusion contribution decreases. At 100 mV s−1, the diffusive and capacitive current contributions are 74% and 26% respectively, illustrating a balance between these two contributions. This balance is crucial for understanding the electrochemical mechanisms and optimizing the performance of supercapacitor devices.
 | ||
| Fig. 14 Electrochemical performance of a symmetrical two electrode system: (a) CV loops at various scan rates ranging from 20 mV s−1 to 50 mV s−1; (b) Tafel's slope indicates the charge storage mechanism to be a combination of EDLC and pseudocapacitive processes; (c) variation in the diffusion and capacitive contribution ratio as a function of scan rate; (d) GCD curves at different current densities; (e) variation of specific capacitance as a function of current density; and (f) Ragone plot showing the energy and power densities of symmetric supercapacitors based on various electrode materials. Each colored data point represents a specific material reported in recent supercapacitor research. | ||
GCD measurements were conducted to determine the specific capacitance, as well as the power and energy densities of the synthesized materials under two electrode configuration. The following equations were used to calculate the specific capacitance (Csp) of a single electrode, along with the energy density (E) and power density (P) of the two-electrode system:
 | (22) |
 | (23) |
 | (24) |
Fig. 14(d) shows the charging and discharging curves for MoS2/(3%) Fe3O4 nanocomposite electrodes at various current densities, from which the specific capacitance values were determined and it can be found that they decrease with the increase in current density, as shown in Fig. 14(e). The maximum capacitance observed is 296 F g−1 at a current density of 0.3 A g−1. The operational efficiency of energy storage devices is critically influenced by their energy density (E) and power density (P). The Ragone plot in Fig. 14(f) illustrates the energy and power densities of various reported supercapacitor systems, with each data point representing a distinct electrode configuration. The CuCo2S4–MoS2 composite (red diamond) exhibits an energy density of ∼3.65 W h kg−1 and a power density of ∼87 W kg−1.104 In comparison, CuCo2S4 (blue star) displays a significantly lower energy density (∼0.65 W h kg−1) while maintaining a comparable power density.5 The Ce0.9Zr0.1O2 electrode (green triangle) achieves an energy density of ∼1.13 W h kg−1 and a power density of ∼112.5 W kg−1, while CeO2 (purple circle) shows slightly lower energy (∼0.68 W h kg−1) at the same power level.105 Notably, the sulfur-doped carbon and graphene composite (yellow diamond) delivers a relatively high energy density of ∼5 W h kg−1 at a power density of ∼20 W kg−1.106 The MoS2/(3%) Fe3O4 composite investigated in this study, represented by black dotted markers, demonstrates energy densities of 3.7, 2.67, and 2.15 W h kg−1 at corresponding power densities of 45, 67.5, and 90 W kg−1 and these points very closely resemble the obtained results from the present-day studies and reflect the efficient performance level of various symmetric systems. Therefore, the improved performance of the MoS2/(3%) Fe3O4 electrode provides strong evidence for the material's supercapacitive capabilities.
Finally, we have fabricated a coin cell device using the optimized MoS2/(3%) Fe3O4 nanocomposite electrode as shown in Fig. SF5 (ESI†). To showcase its practical utility, the device was successfully employed to power an LED lamp. A series of six photographs have been included for illustration: the first image captures the moment the lamp is initially turned on, while the subsequent images display the lamp remaining continuously illuminated at 30, 60, 90, 120, and 150 seconds, respectively. This demonstration clearly reflects the reasonably good energy storage and delivery capabilities of the MoS2–(3%) Fe3O4 nanocomposite-based device.
Conclusion
In this work, pristine MoS2 and 1–5 wt% Fe3O4 nanodiamond incorporated MoS2 nanoflowers were synthesized by a simple hydrothermal route to evaluate and optimize the amounts of the two nanostructured components in the nanocomposite that would deliver an optimized electrochemical performance for high performance supercapacitor electrodes. The XRD analysis confirms the successful formation of the desired material, with the highest level of crystallographic defect induced disorders for an optimum combination of 3 wt% Fe3O4 incorporated MoS2 nanocomposite. The SEM micrographs revealed distinct morphological changes leading to fragmentation and random piling up of MoS2 nanopetals hampering the radial alignment of the petal like formations at higher Fe3O4 content. TEM analysis revealed that the nanostructured composite maintains a hierarchical structure, with the interlayer spacing of MoS2 increased by ~10% for an increase in Fe3O4 content from 0 to 3 wt%, which is followed by a sudden drop in the spacing beyond the given composition limit. The comprehensive crystallographic and morphological analyses predicted a superior electrochemical performance of the nanocomposite with 3 wt% Fe3O4 compared to other synthesized nanostructured materials. In a three-electrode system, the MoS2/(3%) Fe3O4 nanocomposite electrode demonstrated an impressive specific capacitance of 712 F g−1 at 0.3 A g−1, along with excellent cyclic stability, retaining 84% of its initial capacitance after 10000 cycles. The incorporation of Fe3O4 nanodiamonds significantly boosted the electrochemical performance of MoS2 nanoflowers through the formation of a defect-rich crystal structure, providing more active sites and allowing a greater number of electrolyte ions to interact with both the outer surface and nanoporous interior of the composite. The increased interlayer spacing with Fe3O4 nanodiamond incorporation allowed more efficient penetration of electrolyte ions into the electrode materials enhancing the overall capacitive response of the MoS2/Fe3O4 nanocomposite. The electrochemical performance of the nanostructured composite reached its maximum at 3 wt% of Fe3O4 nanodiamonds. The lowest charge transfer resistance observed for this composition significantly contributed towards a more efficient faradaic process, enhancing the specific capacitance. With further incorporation of Fe3O4 (5 wt%) beyond this limit, excess nanodiamonds hindered the uninterrupted growth of MoS2 nano-petals causing the nanoporous channels for electrolytic ions to collapse along with a reduction in MoS2 interlayer spacing, restricting the electrode/electrolyte interface area and the ionic intercalation/deintercalation process. In the case of a two electrode system with the optimized composition mimicking the real devices, the charge storage mechanism involved both capacitive and faradaic processes similar to the three-electrode counterpart. The kinetics study of the optimized nanocomposite showed certain balance between capacitive and diffusive contributions of current, which is crucial for device optimization. The energy and the power densities of the optimized nanocomposite were found to fall within the region of symmetric supercapacitors in the Ragone plot. Consequently, the MoS2/(3%) Fe3O4 nanocomposite emerged as the optimal combination, outperforming a plethora of nanocomposites in terms of electrochemical responses, reinforcing its effectiveness as a high-performance supercapacitor electrode material.
Author contributions
Md. Raihan Siddiki: conceptualization, methodology, investigation, formal analysis, writing – original draft. Shahid Abubakar Abtahee: conceptualization, methodology, investigation, formal analysis. Mehedi Hasan: investigation, formal analysis. Mizanur Rahaman: investigation, formal analysis. Muhammad Rakibul Islam: investigation, formal analysis. Md. Abdullah Zubair: supervision, conceptualization, methodology, investigation, writing – review & editing.Conflicts of interest
There are no conflicts to declare.Data availability
All necessary data are available within this article.Acknowledgements
The authors are grateful to the Department of Nanomaterials and Ceramic Engineering and the Department of Physics, BUET, for their support in synthesis and characterization of the materials. We also acknowledge the Committee for Advanced Studies and Research (CASR), BUET, for financial support.References
- P. Simon and Y. Gogotsi, Nat. Mater., 2008, 7, 845–854 CrossRef CAS PubMed.
- T. Zhu, J. Pan, Z. An, R. Zhe, Q. Ou and H.-E. Wang, J. Mater. Chem. A, 2022, 10, 20375–20385 RSC.
- P.-Y. Liu, J.-J. Zhao, Z.-P. Dong, Z.-L. Liu and Y.-Q. Wang, J. Alloys Compd., 2021, 854, 157181 CrossRef CAS.
- H. Lu and X. S. Zhao, Sustainable Energy Fuels, 2017, 1, 1265–1281 RSC.
- Md. R. Islam, M. Rahaman, Md. M. Billah and M. R. Islam, Mater. Adv., 2024, 5, 5307–5321 RSC.
- Y.-F. Ren, Z.-L. He, H.-Z. Zhao and T. Zhu, Rare Met., 2022, 41, 830–835 CrossRef CAS.
- D. Lan, Y. Chen, P. Chen, X. Chen, X. Wu, X. Pu, Y. Zeng and Z. Zhu, ACS Appl. Mater. Interfaces, 2014, 6, 11839–11845 CrossRef CAS.
- W. Gu and G. Yushin, Wiley Interdiscip. Rev.: Energy Environ., 2014, 3, 424–473 CAS.
- P. Thounthong, V. Chunkag, P. Sethakul, S. Sikkabut, S. Pierfederici and B. Davat, J. Power Sources, 2011, 196, 313–324 CrossRef CAS.
- Y. Dong, Y. Wang, Y. Xu, C. Chen, Y. Wang, L. Jiao and H. Yuan, Electrochim. Acta, 2017, 225, 39–46 CrossRef CAS.
- X. Xiao, G. Zhang, Y. Xu, H. Zhang, X. Guo, Y. Liu and H. Pang, J. Mater. Chem. A, 2019, 7, 17266–17271 RSC.
- X. Guo, Y.-Z. Zhang, F. Zhang, Q. Li, D. H. Anjum, H. Liang, Y. Liu, C. Liu, H. N. Alshareef and H. Pang, J. Mater. Chem. A, 2019, 7, 15969–15974 RSC.
- J. Ma, X. Guo, Y. Yan, H. Xue and H. Pang, Adv. Sci., 2018, 5, 1700986 CrossRef PubMed.
- J. Shin, D. Shin, H. Hwang, T. Yeo, S. Park and W. Choi, J. Mater. Chem. A, 2017, 5, 13488–13498 RSC.
- A. Zhang, R. Zhao, L. Hu, R. Yang, S. Yao, S. Wang, Z. Yang and Y. Yan, Adv. Energy Mater., 2021, 11, 2101412 CrossRef CAS.
- Y.-P. Zhu, C. Xia, Y. Lei, N. Singh, U. Schwingenschlögl and H. N. Alshareef, Nano Energy, 2019, 56, 357–364 CrossRef CAS.
- W. Li, J. Shao, Q. Liu, X. Liu, X. Zhou and J. Hu, Electrochim. Acta, 2015, 157, 108–114 CrossRef CAS.
- W. Lu, Y. Li, M. Yang, X. Jiang, Y. Zhang and Y. Xing, ACS Appl. Energy Mater., 2020, 3, 8190–8197 CrossRef CAS.
- C. Zhang, Z. Peng, Y. Chen, H. Chen, B. Zhang, H. Cheng, J. Wang and M. Deng, Electrochim. Acta, 2020, 347, 136246 CrossRef CAS.
- X. Chia, A. Y. S. Eng, A. Ambrosi, S. M. Tan and M. Pumera, Chem. Rev., 2015, 115, 11941–11966 CrossRef CAS PubMed.
- R. N. Bulakhe, V. H. Nguyen and J.-J. Shim, New J. Chem., 2017, 41, 1473–1482 RSC.
- N. Choudhary, M. R. Islam, N. Kang, L. Tetard, Y. Jung and S. I. Khondaker, J. Phys.: Condens. Matter, 2016, 28, 364002 CrossRef.
- M. Chen, Y. Dai, J. Wang, Q. Wang, Y. Wang, X. Cheng and X. Yan, J. Alloys Compd., 2017, 696, 900–906 CrossRef CAS.
- F. Ghasemi, M. Jalali, A. Abdollahi, S. Mohammadi, Z. Sanaee and S. Mohajerzadeh, RSC Adv., 2017, 7, 52772–52781 RSC.
- X. Huang, Z. Zeng and H. Zhang, Chem. Soc. Rev., 2013, 42, 1934 RSC.
- C. Sha, B. Lu, H. Mao, J. Cheng, X. Pan, J. Lu and Z. Ye, Carbon, 2016, 99, 26–34 CrossRef CAS.
- Y. Zhang, T. He, G. Liu, L. Zu and J. Yang, Nanoscale, 2017, 9, 10059–10066 RSC.
- X. Zhou, L.-J. Wan and Y.-G. Guo, Nanoscale, 2012, 4, 5868 RSC.
- J. B. Cook, H. Kim, Y. Yan, J. S. Ko, S. Robbennolt, B. Dunn and S. H. Tolbert, Adv. Energy Mater., 2016, 6, 1501937 CrossRef.
- M. H. Ahmad, R. B. Alam, A. Ul-Hamid, S. F. U. Farhad and M. R. Islam, J. Energy Storage, 2022, 47, 103551 CrossRef.
- Md. R. Islam, M. Rahaman, Md. M. Billah and M. R. Islam, Mater. Adv., 2024, 5, 5307–5321 RSC.
- M. Rahaman, M. J. Islam, A. Ul-Hamid and M. R. Islam, Surf. Interfaces, 2024, 45, 103886 CrossRef CAS.
- P. Bayat, K. Karami, F. Tavakoli, S. Rahimi, S. Kamali and B. Rezaei, 2023, preprint DOI:10.21203/rs.3.rs-3354348/v1.
- P. Salarizadeh, M. B. Askari, K. Hooshyari and H. Saeidfirozeh, Nanotechnology, 2020, 31, 435401 CrossRef CAS PubMed.
- Z. Li, Y. Zhang and W. Zhang, Mater. Res. Express, 2017, 4, 055018 CrossRef.
- M. Sarno and A. Troisi, J. Nanosci. Nanotechnol., 2017, 17, 3735–3743 CrossRef CAS.
- G. Yu, L. Hu, N. Liu, H. Wang, M. Vosgueritchian, Y. Yang, Y. Cui and Z. Bao, Nano Lett., 2011, 11, 4438–4442 CrossRef CAS.
- X. Li, L. Zhang, X. Zang, X. Li and H. Zhu, ACS Appl. Mater. Interfaces, 2016, 8, 10866–10873 CrossRef CAS PubMed.
- A. Gigot, M. Fontana, M. Serrapede, M. Castellino, S. Bianco, M. Armandi, B. Bonelli, C. F. Pirri, E. Tresso and P. Rivolo, ACS Appl. Mater. Interfaces, 2016, 8, 32842–32852 CrossRef CAS PubMed.
- L. Hu, Y. Ren, H. Yang and Q. Xu, ACS Appl. Mater. Interfaces, 2014, 6, 14644–14652 CrossRef CAS PubMed.
- S. Dutta and S. De, Mater. Today: Proc., 2018, 5, 9771–9775 CAS.
- H. Song, A. Tang, G. Xu, L. Liu, Y. Pan and M. Yin, Int. J. Electrochem. Sci., 2018, 13, 6708–6716 CrossRef CAS.
- N. Torres-Gómez, O. Nava, L. Argueta-Figueroa, R. García-Contreras, A. Baeza-Barrera and A. R. Vilchis-Nestor, J. Nanomater., 2019, 2019, 1–15 CrossRef.
- Md. A. Zubair, T. Mouri and M. T. Chowdhury, Phys. Chem. Chem. Phys., 2023, 25, 27628–27653 RSC.
- Z. Wu, B. Li, Y. Xue, J. Li, Y. Zhang and F. Gao, J. Mater. Chem. A, 2015, 3, 19445–19454 RSC.
- X. Li, T. Li, Y. Ma, Q. Wei, W. Qiu, H. Guo, X. Shi, P. Zhang, A. M. Asiri, L. Chen, B. Tang and X. Sun, Adv. Energy Mater., 2018, 8, 1801357 CrossRef.
- A. A. Pawar, H. A. Bandal and H. Kim, J. Alloys Compd., 2021, 863, 158742 CrossRef CAS.
- N. Esfandiari, M. Kashefi, M. Mirjalili and S. Afsharnezhad, Mater. Sci. Eng. B, 2020, 262, 114690 CrossRef CAS.
- Md. R. Siddiki, S. A. Abtahee, M. Rahaman, M. R. Islam and Md. A. Zubair, Mater. Adv., 2024, 5, 9641–9655 RSC.
- L. Ma, L. Xu, X. Xu, X. Zhou, J. Luo and L. Zhang, Mater. Sci. Eng. B, 2016, 212, 30–38 CrossRef CAS.
- G. Tang, Y. Wang, W. Chen, H. Tang and C. Li, Mater. Lett., 2013, 100, 15–18 CrossRef CAS.
- R. Zhou, C. Han and X. Wang, J. Power Sources, 2017, 352, 99–110 CrossRef CAS.
- A. M. Alsaad, A. A. Ahmad, Q. M. Al-Bataineh, A. A. Bani-Salameh, H. S. Abdullah, I. A. Qattan, Z. M. Albataineh and A. D. Telfah, Materials, 2020, 13, 1737 CrossRef CAS PubMed.
- M. Fang, G. Dong, R. Wei and J. C. Ho, Adv. Energy Mater., 2017, 7, 1700559 CrossRef.
- R. Sha, A. Gopalakrishnan, K. V. Sreenivasulu, V. V. S. S. Srikanth and S. Badhulika, J. Alloys Compd., 2019, 794, 26–34 CrossRef CAS.
- P. Bayat, K. Karami, M. Gholamian, F. Tavakoli, S. Rahimi, S. Kamali and B. Rezaei, ChemistrySelect, 2024, 9, e202304049 CrossRef CAS.
- Y. Zhao, W. Cai, Y. Shi, J. Tang, Y. Gong, M. Chen and Q. Zhong, ACS Sustainable Chem. Eng., 2020, 8, 12603–12611 CrossRef CAS.
- S. Wei, R. Zhou and G. Wang, ACS Omega, 2019, 4, 15780–15788 CrossRef CAS PubMed.
- X. Wang, J. Ding, S. Yao, X. Wu, Q. Feng, Z. Wang and B. Geng, J. Mater. Chem. A, 2014, 2, 15958–15963 RSC.
- Z. Hu, L. Wang, K. Zhang, J. Wang, F. Cheng, Z. Tao and J. Chen, Angew. Chem., 2014, 126, 13008–13012 CrossRef.
- K. Ramakrishnan, C. Nithya and R. Karvembu, Nanoscale Adv., 2019, 1, 334–341 RSC.
- J. Xie, H. Zhang, S. Li, R. Wang, X. Sun, M. Zhou, J. Zhou, X. W. (David) Lou and Y. Xie, Adv. Mater., 2013, 25, 5807–5813 CrossRef CAS PubMed.
- J. Xie, J. Zhang, S. Li, F. Grote, X. Zhang, H. Zhang, R. Wang, Y. Lei, B. Pan and Y. Xie, J. Am. Chem. Soc., 2013, 135, 17881–17888 CrossRef CAS PubMed.
- Y. Sun, Q. Liu, S. Gao, H. Cheng, F. Lei, Z. Sun, Y. Jiang, H. Su, S. Wei and Y. Xie, Nat. Commun., 2013, 4, 2899 CrossRef PubMed.
- K. D. Rasamani, F. Alimohammadi and Y. Sun, Mater. Today, 2017, 20, 83–91 CrossRef CAS.
- N. Kanaujiya, N. Kumar, A. K. Srivastava, Y. Sharma and G. D. Varma, J. Electroanal. Chem., 2018, 824, 226–237 CrossRef CAS.
- J. Wang, H. Zhou, M. Zhu, A. Yuan and X. Shen, J. Alloys Compd., 2018, 744, 220–227 CrossRef CAS.
- R. Zhou, S. Wei, Y. Liu, N. Gao, G. Wang, J. Lian and Q. Jiang, Sci. Rep., 2019, 9, 3980 CrossRef PubMed.
- G. K. Sharma, B. Ranjan and D. Kaur, Appl. Phys. Lett., 2021, 118, 203901 CrossRef CAS.
- R. Wang, S. Wang, X. Peng, Y. Zhang, D. Jin, P. K. Chu and L. Zhang, ACS Appl. Mater. Interfaces, 2017, 9, 32745–32755 CrossRef CAS PubMed.
- B. A. Ali, A. M. A. Omar, A. S. G. Khalil and N. K. Allam, ACS Appl. Mater. Interfaces, 2019, 11, 33955–33965 CrossRef CAS PubMed.
- M. R. Siddiki, S. A. Abtahee and M. A. Zubair, in Comprehensive Materials Processing, Elsevier, 2024, pp. 340–379 Search PubMed.
- T. Xiong, W. S. V. Lee and J. Xue, ACS Appl. Energy Mater., 2018, 1, 5619–5626 CAS.
- B. A. Ali, O. I. Metwalli, A. S. G. Khalil and N. K. Allam, ACS Omega, 2018, 3, 16301–16308 CrossRef CAS PubMed.
- S.-L. Kuo, J.-F. Lee and N.-L. Wu, J. Electrochem. Soc., 2006, 154, A34 CrossRef.
- S. K. Ghosh, ACS Omega, 2020, 5, 25493–25504 CrossRef CAS PubMed.
- J. Zhu, S. Tang, H. Xie, Y. Dai and X. Meng, ACS Appl. Mater. Interfaces, 2014, 6, 17637–17646 CrossRef CAS PubMed.
- L. Xu, G. Pan, C. Yu, J. Li, Z. Gong, T. Lu and L. Pan, Inorg. Chem. Front., 2023, 10, 1748–1757 RSC.
- L. Chen, X. Xu, L. Wan, G. Zhu, Y. Li, T. Lu, M. D. Albaqami, L. Pan and Y. Yamauchi, Mater. Chem. Front., 2021, 5, 3480–3488 RSC.
- M. Tarek and M. A. Basith, J. Mater. Chem. C, 2023, 11, 16605–16622 RSC.
- Y. Liu, S. P. Jiang and Z. Shao, Mater. Today Adv., 2020, 7, 100072 CrossRef.
- Y. Wang, Z. Shi, Y. Huang, Y. Ma, C. Wang, M. Chen and Y. Chen, J. Phys. Chem. C, 2009, 113, 13103–13107 CrossRef CAS.
- M. Toupin, T. Brousse and D. Bélanger, Chem. Mater., 2002, 14, 3946–3952 CrossRef CAS.
- X.-L. Bai, Y.-L. Gao, Z.-Y. Gao, J.-Y. Ma, X.-L. Tong, H.-B. Sun and J. A. Wang, Appl. Phys. Lett., 2020, 117, 183901 CrossRef CAS.
- Y. Chen, W. Ma, K. Cai, X. Yang and C. Huang, Electrochim. Acta, 2017, 246, 615–624 CrossRef CAS.
- A. K. Thakur, A. B. Deshmukh, R. B. Choudhary, I. Karbhal, M. Majumder and M. V. Shelke, Mater. Sci. Eng. B, 2017, 223, 24–34 CrossRef CAS.
- S. Guo, W. Chen, M. Li, J. Wang, F. Liu and J. P. Cheng, Electrochim. Acta, 2018, 271, 498–506 CrossRef CAS.
- J.-H. Lin, Materials, 2018, 11, 263 CrossRef PubMed.
- S. S. Nardekar, K. Krishnamoorthy, P. Pazhamalai, S. Sahoo, V. K. Mariappan and S.-J. Kim, J. Mater. Chem. A, 2020, 8, 13121–13131 RSC.
- Z. Yu, L. Tetard, L. Zhai and J. Thomas, Energy Environ. Sci., 2015, 8, 702–730 RSC.
- M. A. A. Mohd Abdah, N. A. Zubair, N. H. N. Azman and Y. Sulaiman, Mater. Chem. Phys., 2017, 192, 161–169 CrossRef CAS.
- M. Gaire, K. Liang, S. Luo, B. Subedi, S. Adireddy, K. Schroder, S. Farnsworth and D. B. Chrisey, RSC Adv., 2020, 10, 16817–16825 RSC.
- S. Grenier, G. Subías, J. García, J. Blasco and L. Morellón, Phys. Rev. B, 2018, 97, 104403 CrossRef CAS.
- M. D. Nguyen, H.-V. Tran, S. Xu and T. R. Lee, Appl. Sci., 2021, 11, 11301 CrossRef CAS PubMed.
- Y. Liu, D. He, H. Wu, J. Duan and Y. Zhang, Electrochim. Acta, 2015, 164, 154–162 CrossRef CAS.
- P. Si, S. Ding, X.-W. (David) Lou and D.-H. Kim, RSC Adv., 2011, 1, 1271 RSC.
- F. Wang, K. Zhou, J. Zheng and J. Ma, Synth. Met., 2019, 256, 116113 CrossRef CAS.
- Z. Ling, Z. Wang, M. Zhang, C. Yu, G. Wang, Y. Dong, S. Liu, Y. Wang and J. Qiu, Adv. Funct. Mater., 2016, 26, 111–119 CrossRef CAS.
- K. Xu, S. Li, J. Yang, H. Xu and J. Hu, J. Alloys Compd., 2016, 678, 120–125 CrossRef CAS.
- J. Li, Y. Chen, Q. Wu and H. Xu, J. Alloys Compd., 2017, 693, 373–380 CrossRef CAS.
- H. Jiang, Y. Dai, Y. Hu, W. Chen and C. Li, ACS Sustainable Chem. Eng., 2014, 2, 70–74 CrossRef CAS.
- Y. Xiong, M. Zhou, H. Chen, L. Feng, Z. Wang, X. Yan and S. Guan, Appl. Surf. Sci., 2015, 357, 1024–1030 CrossRef CAS.
- G. Han, Y. Liu, E. Kan, J. Tang, L. Zhang, H. Wang and W. Tang, RSC Adv., 2014, 4, 9898–9904 RSC; Y. Liu, D. He, H. Wu, J. Duan and Y. Zhang, Electrochim. Acta, 2015, 164, 154–162 CrossRef CAS.
- S. Hasan, A. H. Reaz, S. Das, C. K. Roy and M. M. Basith, J. Mater. Chem. C, 2022, 10, 7980–7996 RSC.
- S. Ghosh, G. R. Rao and T. Thomas, arXiv, 2021, preprint, arXiv:2101.02907 DOI:10.48550/arXiv.2101.02907.
- M. Seredych and T. J. Bandosz, J. Mater. Chem. A, 2013, 1, 11717–11727 RSC.
Footnote |
| † Electronic supplementary information (ESI) available. See DOI: https://doi.org/10.1039/d5ma00291e |
| This journal is © The Royal Society of Chemistry 2025 |