DOI:
10.1039/D5MA00255A
(Paper)
Mater. Adv., 2025,
6, 5449-5474
CuFe2O4/EB and PPY/GO/EB materials for the removal of basic fuchsin from wastewater: kinetic, equilibrium and thermodynamic studies
Received
20th March 2025
, Accepted 17th June 2025
First published on 21st June 2025
Abstract
In the present investigation, Eucalyptus bark (EB)-based magnetic (CuFe2O4/EB) and polypyrrole–graphene oxide (PPY/GO/EB) composites were designed to eliminate BF from aqueous medium. The physicochemical properties of the adsorbents were analyzed via FTIR spectroscopy, SEM, EDX spectroscopy, and TGA. According to the batch adsorption studies, the optimum adsorption parameters were determined to be pH = 5 (EB), 9 (CuFe2O4/EB), and 10 (PPY/GO/EB), adsorbent dosage = 0.05 g/50 mL, basic fuchsin (BF) dye initial concentration = 10 mg L−1, contact time = 90 min, temperature = 303 K, agitation speed = 120 rpm, and adsorbent particle size ≤300 μm. The BF adsorption capacity of EB, CuFe2O4/EB and PPY/GO/EB was found to be 6.71 ± 0.24, 9.64 ± 0.33 and 9.29 ± 0.31 mg g−1, respectively, with CuFe2O4/EB showing the best results. According to isothermal and kinetic studies, the Langmuir and pseudo-second-order models best described the experimental results. According to the thermodynamic study, it was concluded that the adsorption process is spontaneous and exothermic in nature, with ΔG° and ΔH° values of −3.32 ± 0.21 and −75.18 ± 1.8, respectively. Desorption tests revealed that high levels of dye desorption were caused by 0.1 N eluting reagent concentration. To check the functionality of CuFe2O4/EB on the pilot scale, a column study was conducted, and the maximum BF uptake attained was 8.93 ± 0.28 mg g−1 at a 3 cm bed height. The Thomas and BDST models fitted the experimental data well. Thus, this study demonstrated that CuFe2O4/EB and PPY/GO/EB composites have promising adsorption potential, and this class of adsorbents can be used for the eco-friendly remediation of wastewater containing complex organic pollutants.
1. Introduction
Water is one of the most fundamental resources that humanity depends on to survive. Accordingly, increasing water pollution due to human activities has significantly posed health risks to living organisms.1 Wastewater from different industries, such as the textile, leather, and paper industries, contains toxic compounds including heavy metals, herbicides, insecticides and dyes, posing a threat to the environment.2
Among the discharged pollutants, dyes are recognized as the most prevalent poisons. Dyes contain extremely dangerous, harmful and non-biodegradable pigments and are visible in water even at very low levels, i.e., less than 1 ppm.3 Various synthetic dyes, such as direct, reactive, disperse, mordant, azo, and sulfur dyes, are used in textile industries.4 Among them, basic dyes have remarkable color intensity and luminosity and are more resistant to degradation than anionic dyes. Because of the positive charge on their molecules, they are also known as cationic dyes. Moreover, these dyes are recognized as carcinogenic because they have toxic attributes and tend to induce mutations.5 Basic fuchsin or triamino triphenylmethane dye, which has the chemical formula C20H20ClN3, was selected as the model pollutant in this study because it is one of the most common industrial effluents and is widely employed in the biological staining, leather, and textile industries. Upon contact, this dye causes skin/eye irritation, and its ingestion leads to stomach discomfort (nausea, vomiting, and diarrhea). When inhaled, it irritates the respiratory system. Prolonged exposure results in toxicity, cancer risks, and nervous system effects such as headaches, dizziness, and muscle contractions. Its persistent nature, carcinogenicity, and toxicity make it a priority pollutant to remove from wastewater. Additionally, it shows a prominent and clear absorption peak in the visible region, which permits the accurate measurement of its concentration through UV-visible spectroscopy.6,7
Currently, dyes are removed from wastewater utilizing various conventional methods, including chemical precipitation,8 electrocoagulation,9 solvent extraction,10 photo-catalytic degradation,11 and membrane processes.12 However, the treatment of dyes using these techniques is somewhat challenging because of their drawbacks, including high cost, sludge disposal, overuse of chemicals and ineffective color removal. Alternatively, adsorption stands out as a simple, cost-effective, and highly efficient method for dye removal.13
Many adsorbent materials have been used commercially for the removal of dyes, with some documented research on the use of activated carbon,14 silica,15 zeolites,16 alumina,17etc. Although activated carbon is thought to be more effective in comparison to other materials, it suffers from certain disadvantages.18 After several cycles, activated carbon becomes saturated and loses its ability to adsorb colors. It also becomes difficult to regenerate for use in water purification. Furthermore, the majority of activated carbon-treated water needs additional treatment, which is expensive.19 Thus, researchers have devoted their efforts to identifying inexpensive adsorbent materials that can be regenerated or reused. Presently, the use of biological agricultural waste products such as coverings of various fruits, coir pith, cotton, bagasse pith, fibrous stones, rice or wheat bran, and Eucalyptus bark as adsorbent materials is trending.20Eucalyptus bark (EB) is abundant, given that it is discarded as waste from timber production units, paper mills and wood processing industries. The direct disposal of large amounts of EB waste into the environment can result in the production of numerous chemicals and toxic gases through burning and decomposition, alarmingly contributing to environmental pollution.21 Thus, using these waste products for fabricating novel adsorbents with improved removal efficiency is the primary goal of the present research.
To achieve the greatest adsorption outcomes, native EB can be modified to improve its biomass qualities using various chemical treatment techniques.22 The synergistic combination of EB with copper ferrite (CuFe2O4) plays a key role in increasing the adsorption capacity because CuFe2O4 offers a large number of active sites and a high surface area for the adsorption of dyes.23 Alternatively, the combination of a conductive polymer, polypyrrole (PPY) and graphene oxide (GO) with EB facilitates π–π stacking interactions with dye molecules, additional adsorption sites, high porosity and abundant functional groups, respectively. These composites are known to exhibit improved physicochemical properties, including enhanced durability, stability, reusability, porosity and mechanical strength, making them highly effective for the elimination of toxic organic contaminants.24,25
However, despite the substantial research on the adsorption of dyes utilizing a variety of natural/modified adsorbents, most studies only used single-component systems, lacking comparative assessments among adsorbents having diverse functions. Additionally, the majority of current studies do not sufficiently address the improvement in adsorption efficiency through the integration of carbon-based materials, such as GO and conducting polymers such as PPY, with the agricultural waste. Furthermore, due to the lack of information on toxicity evaluations and antibacterial activity, the practical significance of adsorption studies is frequently disregarded. Thus, the current research aims to bridge these gaps through the comparison of native biomass (EB), a magnetic composite (CuFe2O4/EB), and a hybrid polymer–carbon (PPY/GO/EB) composite for BF removal. Nanomagnetic CuFe2O4/EB and PPY/GO/EB composites were synthesized through the co-precipitation method. GO was synthesized using the modified Hummers’ method. To elucidate the structural functionalities, morphology, and thermal stability of the synthesized composites, FTIR, SEM, and TGA characterizations were applied. The native EB and both composites were applied in a batch experiment for the removal of BF dye from simulated wastewater. To achieve the maximum dye adsorption, various process parameters such as pH, composite dosage, initial dye concentration, contact time and temperature were optimized. Furthermore, to comprehend the mechanism and nature of BF adsorption on the composites, kinetic modelling, equilibrium, and thermodynamic studies were executed. The desorption efficacy of the adsorbents was also evaluated to assess their potential for reuse/regeneration. To assess the environmental safety of the synthesized composites, this study also extended beyond adsorption by executing antibacterial and toxicity tests. To date, no comprehensive report has been published on the adsorption of BF and antibacterial and toxicity assessments using CuFe2O4/EB and PPY/GO/EB composites.
2. Material and methods
2.1 Chemicals and reagents
Analytical grade chemicals and reagents (methanol (CH3OH), 99.6%, Merck, ethanol (C2H5OH), ≥99%, Merck, sulfuric acid (H2SO4), 95–98%, Merck, hydrogen chloride (HCl), 37%, Sigma-Aldrich, (St. Louis, Missouri, US), pyrrole, 98%, Sigma-Aldrich, ferric chloride hexahydrate (FeCl3·6H2O), 98%, Sigma-Aldrich, copper chloride hexahydrate (CuCl2·6H2O), 99%, Sigma-Aldrich, formaldehyde (HCHO), 37%, ACS Reagents, sodium nitrate (NaNO3), 99%, Daejung, ammonium hydroxide (NH4OH), 32%, Merck, sodium hydroxide (NaOH), ≥99%, Riedel-de Haen, hydrogen peroxide (H2O2), 35%, BDH, potassium permanganate (KMnO4), ≥99%, Merck, and graphite powder, 99%, Daejung) were employed without any further purification in the current research. Basic fuchsin dye (C20H20ClN3), >88%, was purchased from Sigma-Aldrich. For the preparation of solutions, ultra-pure water (Milli-Q system (Millipore)) was utilized. Throughout the experiments, distilled water (DW) with the physicochemical properties of pH = 6.8 ± 0.2, specific gravity = 1.000/25 °C, conductivity = 1.1 μS cm−1, hardness = not detected (as anticipated for DW), and turbidity = <1 NTU, was utilized. The standard laboratory instruments (calibrated) were employed for all measurements.
2.2 Biomass collection and treatment
EB biomass was procured from a local market in Faisalabad. Initially, the EB biomass was rinsed with DW to remove impurities and dust. After being exposed to direct sunlight for a week, the biomass was oven-dried for 36 h at 60 °C, crushed, and converted to powder using an electric ball mill. Then, 10 g of EB powder was treated with a solution of 0.1 M H2SO4 (100 mL) and formaldehyde (5 mL) and agitated at 120 rpm at 50 °C for 24–48 h in an orbital shaker.26 After filtering, washing with water and methanol, and drying at 70 °C, the biomass was sieved through a 300-μm mesh (OCT-DIGITAL 4527-01), and then stored in a glass jar (Fig. 1).
 |
| | Fig. 1 Schematic of the color-removing protocol. | |
2.3 Synthesis of magnetic nanocomposite (CuFe2O4/EB)
The co-precipitation method was employed for the synthesis of the nanomagnetic CuFe2O4/EB. Chloride salts of Fe and Cu, such as FeCl3·6H2O and CuCl2·6H2O, were added to 3 Erlenmeyer flasks labelled A, B and C at 3 distinct mass ratios, as shown in Table 1. EB powder (0.5 g) was added to each flask containing DW (100 mL) to make suspensions, which were then stirred at 120 rpm for 4 h at 353 K in an orbital shaker. Then, NH4OH solution was added to increase the pH level of the suspension to 10. The mixture was again magnetically stirred for 2 h and allowed to cool to room temperature. Afterwards, the composite samples were filtered, rinsed with DW and ethanol to bring the pH to neutral, dried at ∼353 K and kept in an air-tight container13 (Fig. 2).
Table 1 Mass ratios of CuCl2·6H2O and FeCl3·6H2O
| Sample |
EB (g) |
H2O (mL) |
CuCl2·6H2O![[thin space (1/6-em)]](https://www.rsc.org/images/entities/char_2009.gif) :FeCl3·6H2O (g) :FeCl3·6H2O (g) |
| A |
0.5 |
100 |
0.15:0.00 |
| B |
0.5 |
100 |
0.15:0.05 |
| C |
0.5 |
100 |
0.15:0.10 |
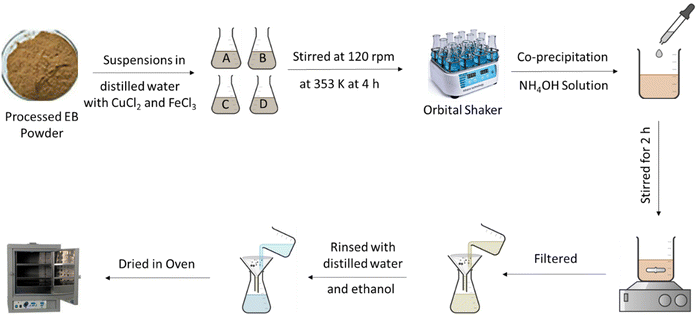 |
| | Fig. 2 Schematic of the synthesis of the CuFe2O4/EB composite. | |
Adsorption experiments were performed using the three different composite samples having different mass ratios of CuCl2·6H2O and FeCl3·6H2O to achieve the optimal removal of BF from water. The outcomes revealed that the most favorable results were achieved with composite sample C, possessing a mass ratio of 0.15 g of CuCl2·6H2O and 0.10 g of FeCl3·6H2O.
2.4 Synthesis of polypyrrole–graphene oxide Eucalyptus bark (PPY/GO/EB) composite
The modified Hummers’ method was used to synthesize GO,27 which involved combining 2.5 g of sodium nitrate, 180 mL of sulfuric acid, and 5 g of graphite powder in a round-bottom flask submerged in an ice bath. KMnO4 (40 g) was progressively added while stirring, causing the mixture to become green. It turned dark brown after three days of stirring at 30–35 °C. After diluting the resultant suspension with 100 mL DW (98 °C), hydrogen peroxide (60 mL) was added to terminate the reaction, which gave the solution a yellow appearance. Later, the solution was centrifuged, neutralized with water, and then sonicated for one hour before being dried at 65 °C. Ultimately, the obtained brownish GO sheets were sealed in an airtight container.
Afterwards, 3 mL of pyrrole and 100 mL of HCl (0.2 M) were combined, and the mixture was sonicated for 10 min to create a 0.2 M pyrrole solution. The pyrrole solution and 0.2 M HCl were added in equal amounts (100 mL each) to two flasks, one containing 0.5 g of biomass and the other containing 0.2 g of GO. The materials were sonicated for one hour, and then left overnight to undergo polymerization. The next day, 5.4 g of FeCl3·6H2O was added to 100 mL of 0.2 M HCl and sonicated for 5 min. This solution was added dropwise to the HCl, polypyrrole, and GO mixture, stirred for an additional 1 h, and then left overnight to undergo polymerization. The final product was washed with ethanol, followed by water, dried at 60 °C, and then stored in a plastic bag (Fig. 3).
 |
| | Fig. 3 Schematic of the synthesis of the PPY/GO/EB composite. | |
2.5 Characterization
The prepared samples were characterized using various tools. Fourier transform infrared spectroscopy (FTIR, Agilent Technologies Cary-630) was used for functional group analysis in the wavelength range of 4000–400 cm−1. To increase the signal-to-noise ratio, 32 scans per sample were averaged at a resolution of 4 cm−1. Morphological features were observed using scanning electron microscopy (SEM, JEOL JMT 300) at a magnification of 1.0–25.0k×. The elemental composition of the samples was analyzed using energy dispersive X-ray spectroscopy (EDX, Bruker QUANTAX 200). The thermal stability of the samples was assessed through thermogravimetric analysis (TGA, PerkinElmer STA 8000, USA), operating in an atmosphere of flowing N2, at a scan rate of 10 °C min−1, in the range of 25–800 °C. The concentration of BF dye before and after adsorption was measured using a UV-visible spectrophotometer (CECIL CE-7200). Additional tools used for the batch adsorption experiments included a pH meter (HI-8014 Hanna) for solution pH adjustment, an electric grinder (Moulinex, France) for grinding, and an orbital shaker (PA 250/25. H). Plotting and data analysis were carried out employing Microsoft Excel 2021 for primary tabulation and data processing, and OriginPro 2021 for fitting curves and graphing.
2.6 Batch adsorption studies
The batch adsorption experiments aimed at removing BF dye by native EB and CuFe2O4/EB and PPY/GO/EB composites were carried out in 250 mL conical flasks, at 120 rpm in a temperature-controlled rotary shaker. Operating variables including pH (2–10), adsorbent dosage (0.05–0.4 g), contact time (5–120 min), initial dye concentration (2–10 mg L−1), adsorption temperature (303–323 K), agitation speed (60–150 rpm), and particle size of adsorbent (300–900 μm) were systematically varied in the experiments. The dye solution pH was adjusted with 0.1 M NaOH and HCl solutions. After introducing the adsorbents into the dye solution (0.05 g/50 mL), the mixture was placed in an orbital rotator shaker operating at 120 rpm. Finally, filtration (0.2 μm Teflon filter) was performed, which led to the separation of the adsorbents. The filtered solution was analyzed using a UV-VIS spectrophotometer at 543 nm to detect the reduction in the quantity of dye molecules. The adsorption capacity was determined using eqn (1), as follows:| |  | (1) |
where qe (mg g−1) represents the amount of equilibrium adsorbate removed by the adsorbent, and C0 and Ce (mg L−1) indicate the initial and final dye concentrations, respectively. V (L) stands for volume and W (g) denotes the mass of the adsorbent. A calibration curve of concentration (2, 4, 6, 8, 10, 12 and 14 ppm) versus absorbance was plotted for BF. The linear equation of the calibration curve is presented in eqn (2).
As predicted in the calibration curve, the working solution of 10 ppm concentration was used in further experimentation for convenience. Furthermore, a desorption study was also conducted to evaluate the reusability and reliability of the adsorbent.
After the adsorption process, strict safety procedures were implemented when disposing of waste to avoid any secondary environmental pollution. Following the adsorption procedure, initially the polluted solution was neutralized through the appropriate adjustment of its pH before collecting in authorized perilous liquid waste containers. Conversely, the spent adsorbents were cautiously filtered and dried. Later, they were sealed in labeled biohazard containers. In compliance with regional environmental standards, the authorized waste disposal facility of the institution handled the disposal of both solid and liquid wastes, making sure that no secondary contamination was generated.
2.7 Column study
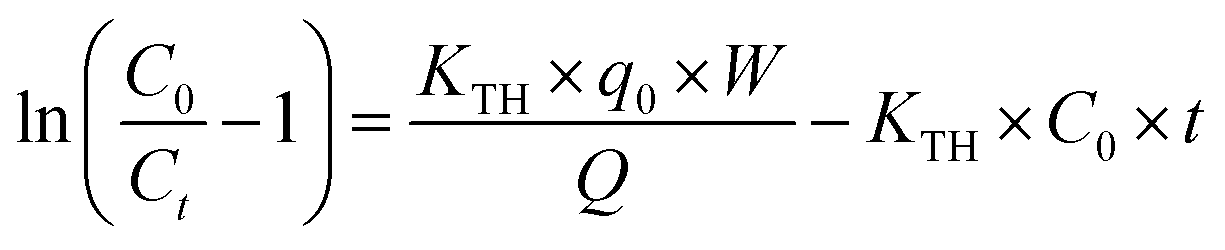
To evaluate the real-time applications of the biosorption approach, a fixed-bed column study was executed employing the adsorbent that showed the best performance (CuFe2O4/EB). The main concern in this study was designing the dynamic simulation of BF adsorption on a packed column made of Pyrex glass with a fixed bed. A glass column having a length of 42 cm and a diameter of 1.2 cm was utilized for this study. The impact of various process variables, including bed height, flow rate, and BF concentration, was studied. At different bed height levels of 1, 2, and 3 cm, an inlet liquid sample with concentrations of 15, 20, and 25 mg L−1 was run through a column that had 0.5, 1.5, and 2.5 g of adsorbent. Given that the small outlet of the column was blocked at higher flow rates, the flow was set to 1.8 mL min−1 during the run. The adsorbent was held inside the column by some glass wool that was secured at the end of the column outlet. The experiments were executed at room temperature using a pH of 9, which was the most effective pH determined in the previous batch experiments. Even if the inlet solution concentration was changed during the concentration tests, it was kept at 20 mg L−1 during bed height optimization. To calculate Ci/C0, the outlet solution concentrations following adsorption tests were examined using a UV-visible spectrophotometer at different intervals.13,28
2.8 Antibacterial activity
The susceptibility pattern of E. coli and S. aureus bacteria to native EB and the EB-based composites was determined using the agar well diffusion assay, as reported elsewhere.29 Briefly, a Petri plate measuring 80 mm was filled with 20 mL of Mueller-Hinton agar. After letting the medium cool, Petri plates were inoculated with 108 CFU per mL of bacterial cultures. Agar wells with a diameter of 5 mm were created using a sterile cork borer to pierce the agar container, and then scooping out the punched portion. Each well contained 100 μL of each of the EB-based material suspensions. To allow the antibacterial agent solution to diffuse, the plates were kept in place for 1 h. After that, the agar plates were incubated for 24 h at 37 °C. The antibacterial activity was assessed based on the zones of inhibition, measured in millimeters (mm). Eqn (3) was used to measure the clear zone width (Wc).| | 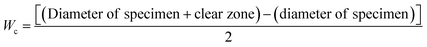 | (3) |
2.9 Toxicity studies
The dye solution toxicity test was executed based on the percentage reduction in colony-forming units (CFU).30 Briefly, 20 mL of BF solution was added to an Erlenmeyer flask with a capacity of 100 mL, which was subjected to autoclave treatment at 121 °C for 30 min. Then, the contents were inoculated with 1% v/v of E. coli and S. aureus cell cultures, and incubation was performed at a temperature of 37 °C ± 2 °C for a period of 24 h, while sterilized DW served as the control. Using eqn (4), the percentage reduction in CFU was calculated.| |  | (4) |
2.10 Statistical analysis
All experiments were conducted in triplicate to ensure the statistical reliability and reproducibility of the data, and the results were expressed as the mean ± standard deviation. Employing a one-way ANOVA test, the statistical significance between the adsorption capabilities of the various adsorbents was assessed. A P value less than 0.05 was regarded as statistically significant.31 GraphPad Prism and Microsoft Excel were used to carry out the statistical computations.
3. Results and discussion
3.1 FT-IR analysis
FT-IR is a spectroscopic technique that is used to identify the functional groups present on the surface of adsorbents.32 The processed and synthesized adsorbents, named EB and CuFe2O4/EB and PPY/GO/EB, respectively, before and after the adsorption process were analyzed using this technique. The results of the FT-IR analyses are shown in Fig. 4. Native EB before adsorption (Fig. 4A(a)) exhibited a wide and broad peak at 3306.14 cm−1, corresponding to the O–H stretching vibration, which revealed the presence of hydroxyl (OH) groups. The small peak at around 2890 cm−1 is ascribed to the –CH stretching vibration of the CH2 and CH3 associated functional groups.22 The peak observed at 1604 cm−1 is due to the C![[double bond, length as m-dash]](https://www.rsc.org/images/entities/char_e001.gif) C stretching of the lignin aromatic rings. The other peaks at around 1300.84–1480 cm−1 are attributed to the syringyl and guaiacyl C–O stretching vibrations of lignin.33 The peak detected at 1032.47 cm−1 is ascribed to the C–O–C glycosidic linkage stretching of the cellulose and hemi-cellulosic groups.34 The band at 771.29 cm−1 corresponds to the bending vibrations of polysaccharides and aromatic rings.35 On incorporating CuFe2O4 in EB (before adsorption), minor intensity changes and shifts in the peaks were seen, suggesting the interaction between the metal oxides and biomass. The appearance of new peaks at around 642.3 and 572.4 cm−1, corresponding to Fe–O and Cu–O, respectively, confirmed the successful integration of CuFe2O4 in EB.36 The decrease in the intensity of the peaks corresponding to organic functional groups indicated that some functional moieties in EB may have contributed to the stabilization or binding of CuFe2O4 (Fig. 4B(a)). Conversely, the incorporation of PPY and GO in EB resulted in significant intensity changes and shifts in the peaks. The presence of GO in the PPY/GO/EB composite (before adsorption) was confirmed by the intense peak at 1239.3 cm−1, which is associated with the C–O stretching of the epoxy groups in GO. The characteristic PPY peaks appeared at 1556.1 and 1340.3 cm−1, corresponding to the CC stretching of the pyrrole ring and C–N stretching of PPY, respectively (Fig. 4C(a)).37 The successful incorporation of PPY and GO in EB, which improved its functional and structural attributes for adsorption applications, was confirmed by these FTIR measurements. The FTIR spectra of the samples after the adsorption of BF dye are presented in Fig. 4A–C(b). The broadening of the peaks located in the region of 3000–3500 cm−1 in all the spectra after the adsorption of BF on the adsorbents indicated the formation of intermolecular hydrogen bonds between BF and the functional groups associated with the adsorbents. After adsorption, slight modifications in the functional group intensities were noticed, primarily characterized by a decrease in peak intensity because of the attachment of BF molecules on the active sites of the adsorbent. The Fe–O and Cu–O peaks are slightly shifted to 624.6 and 547.3 cm−1, respectively, which is likely due to the surface complexation with dye molecules. The C–O stretching vibration of GO shifted to 1209.1 cm−1, while the CC stretching of the pyrrole ring and C–N stretching of the PPY shifted to 1569.8 and 1338.2 cm−1, respectively. The FTIR spectrum of the CuFe2O4/EB composite depicted an additional peak at 1448 cm−1, corresponding to the characteristic peak of the dye (aromatic CC vibration) after its adsorption.28 Furthermore, the slight shifts in the C–O and C–O–C stretching vibrations further confirmed the interaction between the dye molecules and adsorbents. Thus, after adsorption, the FTIR spectra of the samples depicted the characteristic dye peaks as well as slight intensity changes and peak shifts, suggesting the strong contact and successful adsorption of the BF dye by the synthesized adsorbents.
C stretching of the lignin aromatic rings. The other peaks at around 1300.84–1480 cm−1 are attributed to the syringyl and guaiacyl C–O stretching vibrations of lignin.33 The peak detected at 1032.47 cm−1 is ascribed to the C–O–C glycosidic linkage stretching of the cellulose and hemi-cellulosic groups.34 The band at 771.29 cm−1 corresponds to the bending vibrations of polysaccharides and aromatic rings.35 On incorporating CuFe2O4 in EB (before adsorption), minor intensity changes and shifts in the peaks were seen, suggesting the interaction between the metal oxides and biomass. The appearance of new peaks at around 642.3 and 572.4 cm−1, corresponding to Fe–O and Cu–O, respectively, confirmed the successful integration of CuFe2O4 in EB.36 The decrease in the intensity of the peaks corresponding to organic functional groups indicated that some functional moieties in EB may have contributed to the stabilization or binding of CuFe2O4 (Fig. 4B(a)). Conversely, the incorporation of PPY and GO in EB resulted in significant intensity changes and shifts in the peaks. The presence of GO in the PPY/GO/EB composite (before adsorption) was confirmed by the intense peak at 1239.3 cm−1, which is associated with the C–O stretching of the epoxy groups in GO. The characteristic PPY peaks appeared at 1556.1 and 1340.3 cm−1, corresponding to the CC stretching of the pyrrole ring and C–N stretching of PPY, respectively (Fig. 4C(a)).37 The successful incorporation of PPY and GO in EB, which improved its functional and structural attributes for adsorption applications, was confirmed by these FTIR measurements. The FTIR spectra of the samples after the adsorption of BF dye are presented in Fig. 4A–C(b). The broadening of the peaks located in the region of 3000–3500 cm−1 in all the spectra after the adsorption of BF on the adsorbents indicated the formation of intermolecular hydrogen bonds between BF and the functional groups associated with the adsorbents. After adsorption, slight modifications in the functional group intensities were noticed, primarily characterized by a decrease in peak intensity because of the attachment of BF molecules on the active sites of the adsorbent. The Fe–O and Cu–O peaks are slightly shifted to 624.6 and 547.3 cm−1, respectively, which is likely due to the surface complexation with dye molecules. The C–O stretching vibration of GO shifted to 1209.1 cm−1, while the CC stretching of the pyrrole ring and C–N stretching of the PPY shifted to 1569.8 and 1338.2 cm−1, respectively. The FTIR spectrum of the CuFe2O4/EB composite depicted an additional peak at 1448 cm−1, corresponding to the characteristic peak of the dye (aromatic CC vibration) after its adsorption.28 Furthermore, the slight shifts in the C–O and C–O–C stretching vibrations further confirmed the interaction between the dye molecules and adsorbents. Thus, after adsorption, the FTIR spectra of the samples depicted the characteristic dye peaks as well as slight intensity changes and peak shifts, suggesting the strong contact and successful adsorption of the BF dye by the synthesized adsorbents.
 |
| | Fig. 4 FT-IR spectra of unloaded and loaded (A) native EB, (B) CuFe2O4/EB, and (C) PPY/GO/EB composites, and (D) calibration curve for basic fuchsin dye. | |
3.2 Surface morphological analysis
The surface morphological properties of EB and the CuFe2O4/EB and PPY/GO/EB composites were analyzed through SEM analysis, and the results are shown Fig. 5. EB biomass (Fig. 5A) showed a porous and rough surface morphology with layered configurations, irregular voids and channels, which are characteristics of lignin and cellulose-based materials.22 All these features contribute to the larger surface area as well as the potential adsorption capacity of the biomass. After the incorporation of CuFe2O4 in EB and PPY and GO in EB, significant morphological alterations were observed. The CuFe2O4/EB composite exhibited a denser heterogeneous structure with evenly distributed CuFe2O4 embedded in the EB matrix (Fig. 5B). Alternatively, in the PPY/GO/EB composite, the uniform distribution of PPY and EB across the GO surface demonstrated strong interfacial interactions, triggering enhanced structural stability and adsorption efficiency (Fig. 5C and D). Consequently, the CuFe2O4/EB composite exhibited higher porosity, improved surface roughness, enhanced surface area, and more active sites as compared to the native EB and PPY/GO/EB composite, which ultimately contribute to its improved adsorption performance.
 |
| | Fig. 5 SEM images of (A) EB (native), (B) CuFe2O4/EB, and (C) and (D) PPY/GO/EB composites. | |
3.3 EDX analysis
Using EDX, the elemental composition of the adsorbents was investigated, and the results, as presented in Fig. 6A–C, respectively, showed that all the desired components were introduced successfully. In the EDX spectrum of EB biomass (Fig. 6A), silicon (Si), oxygen (O), and carbon (C) were found to be the main components. The significant silica content found naturally in EB was responsible for the presence of the Si peak in its spectrum. Also, a potassium (K) peak was observed, suggesting the existence of trace minerals in EB.38 The successful integration of copper (Cu) and iron (Fe) in the biomass matrix was validated by the EDX spectrum of CuFe2O4/EB, as shown in Fig. 6B. Together with the C, O, and Si peaks, strong peaks for Fe and Cu were seen at their distinctive energy levels. The oxide form of CuFe2O4 was responsible for the increased content of oxygen in the EDX spectrum of CuFe2O4/EB, whereas C and Si originated from the structure of EB. The EDX spectrum of PPY/GO/EB (Fig. 6C) showed dominant O and C signals, which were correlated with the PPY and GO content. Additionally, there was also a nitrogen (N) signal, indicating that the pyrrole polymerization process was successful. The biomass base was still present, as evidenced by the Si peak. Thus, the EDX results confirmed the successful fabrication of all the composites and the existence of essential components linked to their constituents. Furthermore, the EDX results were consistent with the SEM analysis.
 |
| | Fig. 6 EDX spectra of (A) EB, (B) CuFe2O4/EB, and (C) PPY/GO/EB, and (D) thermogravimetric analysis of EB (native), CuFe2O4/EB, and PPY/GO/EB composites. | |
3.4 TGA analysis
To investigate the stability at higher temperatures and decomposition behavior of the native EB and PPY/GO/EB and CuFe2O4/EB composites, TGA analysis was executed and the results are displayed in Fig. 6D. The samples were subjected to a high temperature of approximately 800 °C, at a controlled heating rate of 10 °C min−1. The decomposition of the adsorbent structure started early for native EB and PPY/GO/EB at ∼254 °C and 292 °C, respectively, whereas CuFe2O4/EB exhibited initial decomposition at ∼342 °C. The early decomposition of native EB and PPY/GO/EB was ascribed to the decomposition of various loosely bonded structural functionalities such as cellulose, hemicellulose and lignin groups and polypyrrole, where about 20–25% and 10–15% weight loss were detected up to 342 °C, respectively.28,39 The incorporation of GO enhanced the thermal resistance of the PPY/GO/EB composite compared to EB and shifted the decomposition process towards a higher temperature range. Similarly, because of the highest stability of CuFe2O4/EB, its decomposition started at ∼342 °C with a weight loss of 5–10%. Subsequently, 60–65% and 70–75% weight loss were detected after ∼436 °C and 546 °C in the case of native EB and PPY/GO/EB, respectively, but for CuFe2O4/EB, it was observed at ∼625 °C (80–85%). In contrast to the native EB and PPY/GO/EB, a notable improvement in the thermal stability of CuFe2O4/EB was seen. The increased stability of this composite was facilitated by the inorganic CuFe2O4 matrix. The higher thermal stability of the composites revealed their strong interfacial interactions, making them much better for high-temperature applications.
3.5 Batch study experimentation
3.5.1 Effect of pH, point of zero charge (pHpzc).
The adsorption process is substantially influenced by pH, which is widely acknowledged. pH affects the surface charge, composition makeup of the functional groups of the adsorbents, structural stability of the dye molecules and chemical interactions between the dye and adsorbent molecules.40 Thus, to investigate the effect of pH on the adsorption of BF dye, experiments were carried out utilizing the different biosorbents including EB, CuFe2O4/EB and PPY/GO/EB at different pH in the range of 3–10, as shown in Fig. 7A. The dose of adsorbent, dye initial concentration and irradiation time were kept constant (0.05 g, 10 mg L−1 and 90 min, respectively) throughout the experiments. Based on the information presented, the optimal adsorption values were observed at pH 5, 9, and 10 for EB, CuFe2O4/EB, and PPY/GO/EB, respectively. The qe value for EB was determined to be 6.7 ± 0.25 mg g−1, and for CuFe2O4/EB and PPY/GO/EB it was 9.64 ± 0.18 and 9.28 ± 0.32 mg g−1, respectively. Among the three adsorbents, CuFe2O4/EB showed the best results, and a statistically significant difference (P < 0.05) was noted in their dye removal efficacy. The point of zero charge plays an effective role in explaining the pH effect. The pHpzc is the point where the charge on the surface of the adsorbent becomes zero or neutral, below which the charge on the surface of the adsorbent is positive, while above it, the charge is negative. It is ruled out that when pH < pHpzc, significant adsorption of anions occurs, and when pH > pHpzc, significant adsorption of cations occurs. The pHpzc values of the composites were determined by applying the mass addition method, as described elsewhere.41 In this method, a 0.1 M solution of KNO3 (background electrolyte) was used with the pH varying from 2–10. The experimental results are shown in Fig. 7B. It can be seen that the pH value at the point of zero charge was 3.2 for EB, 3.8 for PPY/GO/EB, and 6.3 for CuFe2O4/EB. The interaction of protons with functional groups on the surface of the adsorbents causes them to develop a positive charge below these pH values. Alternatively, the adsorbents possess a negative charge and have a greater ability for the adsorption of positive species above these pH values. This can be attributed to the presence of negative OH− ions at higher pH values (such as 9 and 10), making the surface of the adsorbent negatively charged. Because the BF dye is cationic, it was concluded that for the removal of BF from wastewater, a higher pH is more favorable. Thus, the adsorption process was most effective at pH levels higher than the point of zero charge, and less effective at lower pH values. However, the electrostatic force of attraction comes into play, and the negatively charged surface of the EB, CuFe2O4/EB, and PPY/GO/EB adsorbents interacts with the positively charged BF dye more efficiently, resulting in better adsorption.42 A comparative study on BF adsorption using Y-doped ZnO nanoparticles by Ben Aissa et al. concluded that the adsorption efficiency was highly effective in the basic pH range.43
 |
| | Fig. 7 (A) Effect of pH, (B) measurement of point of zero charge, (C) effect of adsorbent dose, (D) effect of dye concentration, (E) effect of contact time, (F) effect of temperature, (G) effect of agitation speed, (H) effect of adsorbent particle size, (I) effect of salts, and (J) effect of surfactants (conditions: 10 mg L−1, 0.05 g L−1, 120 rpm, 90 min, 303 K) on BF degradation by EB, CuFe2O4/EB (MAG/EB), and PPY/GO/EB. | |
3.5.2 Effect of adsorbent dose.
Adsorbent dosage is also one of the crucial parameters that influences the adsorption performance.4 Thus, to evaluate the effect of adsorbent dose on the adsorption of BF, experiments were conducted by applying different doses in the range of 0.05 to 0.4 g/10 mg L−1 at pH 5 (EB), 9 (CuFe2O4/EB), 10 (PPY/GO/EB), and irradiation time of 90 min, as shown in Fig. 7C. All three adsorbents showed similar trends. The maximum qe values for the biomass EB and CuFe2O4/EB and PPY/GO/EB composites at an adsorbent dosage of 0.05 g/50 mL were found to be 6.70 ± 0.51, 9.64 ± 0.34 and 9.28 ± 0.25 mg g−1, respectively. The difference in the performance of the three adsorbents was statistically significant (P < 0.05), confirming the superior adsorption efficiency of the CuFe2O4/EB composite. It was noted that the adsorption capacity greatly decreased as the adsorbent dose increased from 0.05 to 0.4 g/50 mL because there were too many active sites compared to those needed for saturation adsorption, and thus many of the active sites were underutilized, causing the adsorption capacity to decrease. Moreover, another reason for the decrease in the adsorption capacity with an increase in the adsorbent dosage could be the aggregation or overlap of the active sites, which lengthened the diffusion path and reduced the surface area available for biosorption, thereby decreasing the biosorption potential of the adsorbent.1 Hence, 0.05 g of adsorbent was found to be the optimum value for the adsorption process to occur efficiently. A similar trend for the effect of dosage on the adsorption of BF dye was also found in the experiment conducted by Yang and coworkers, where they used anionic polyacrylamide graphene oxide aerogels as adsorbents for the removal of BF dye.44 Furthermore, Bessashia and coworkers also found the same trend of dosage effect in their study on BF adsorption.45
3.5.3 Effect of initial dye concentration.
The initial concentration of dye is one of the most important parameters influencing the efficiency of the adsorption process because a particular amount of adsorbent can only adsorb a limited number of adsorbate species.4 Thus, experiments were conducted to explore different concentrations between 2 and 10 ppm, while keeping the other parameters constant to optimize this effect. As shown in Fig. 7D, the biosorption capacity was found to increase with an increase in the initial BF concentration. The maximum adsorption values were attained at a concentration of 10 ppm for all the adsorbents utilized in the experiment. The driving forces that lessen the resistance of ionic species during mass transfer between the solid and the liquid phases are responsible for the enhanced biosorption of dye with an increase in its concentration. A direct relationship between the initial concentration of dye and adsorption capability was found up to a certain point. Once equilibrium was reached, there was no further increase in the adsorption capacity given that all the accessible capturing sites on the surface of the biosorbent became occupied by the dye molecules. Adsorption is a surface phenomenon that depends mainly on the availability of the active binding sites on the adsorbent surface. As a result, the adsorption capacity decreased further by increasing the dye concentration because the dye molecules no longer got attached to the finite adsorbent molecules.46 An identical pattern of biosorption capacity with an increase in the initial dye concentration was observed in the experiment conducted by Santosh Singh and colleagues when they applied banana peel as a biosorbent for the eradication of rhodamine B.47
3.5.4 Effect of contact time.
Contact time also plays an important role in the adsorption capacity and the adsorption process.48 Thus, to determine how the agitation time affects the adsorption process of BF and to attain the optimal agitation time, experiments were conducted using different adsorbents such as native EB and CuFe2O4/EB and PPY/GO/EB composites with different contact periods of 5, 20, 30, 60, 90 and 120 min, while keeping the other parameters such as dosage, pH, initial dye concentration and temperature constant (Fig. 7E). According to the results, it was observed that at the beginning, the adsorption efficiency amplified with time and showed the maximum biosorption capacity at 90 min.22 The underlying reason for the fast adsorption process at the start is the availability of the maximum number of adsorption sites on the adsorbent particles to which the dye molecules can easily attach. Gradually, the reaction rate became slow because all the active sites on the adsorbent surface were occupied by the dye molecules as the reaction proceeded. According to the thorough analysis of the experiment done by Zambrano and colleagues to adsorb blue 19 dye on an adsorbent made from rice husk biomass, the adsorption capacity of the adsorbent gradually increased over time because numerous open active sites on its surface eventually became occupied by the dye molecules.49
3.5.5 Effect of temperature.
One of the crucial and significant factors that has an impact on the adsorption system is the solution temperature because of its effects on the surface features of the adsorbent and the mobility and solubility of the dye molecules in aqueous solutions.50 Thus, to determine the influence of temperature on the sorption process, experiments were performed at different temperatures ranging from 303 to 323 K, while keeping all the other parameters constant, as shown in Fig. 7F. According to the results, the biosorption capacity decreased with an increase in temperature. The maximum biosorption values were obtained at 30 °C for all three adsorbents utilized in the experiment. This phenomenon can be attributed to the reduction in the binding forces between the dye particles and the adsorbent surface, which facilitated their detachment, and consequently led to a decrease in adsorption at higher temperatures. This behavior can also be explained by the solubility principle; the solubility of dye molecules is enhanced by an increase in temperature, and thereby the attraction of the dye particles for the adsorbent decreases.40 The same trend for temperature effect is also found in the literature. By adsorbing BY2 on natural, untreated clay (NUC), at varying temperatures of 25 °C, 35 °C, and 45 °C, Öztürk and Malkoc performed tests to examine the impact of temperature on the elimination of BY2. Their findings demonstrated that when the temperature of the adsorption reaction was increased, the adsorption capacity and efficiency decreased.51
3.5.6 Effect of agitation speed.
The agitation speed controls the mobility between the adsorbates and adsorbent, while improving the surface-based removal of dye from aqueous solutions.52 The graphical representation in Fig. 7G shows how the agitation speed affects the dye removal capacity for EB and the modified CuFe2O4/EB and PPY/GO/EB adsorbents. The experimental conditions used a stirring speed in the range of 60–150 rpm to analyze BF adsorption, keeping all the other parameters constant. The adsorption conditions reached the peak at 120 rpm given that the adsorbent mixture displayed its best mixing homogeneity at this point. The homogeneity between the solution components decreased at increased speeds, thereby leading to a reduction in the adsorption of BF. Thus, 120 rpm was utilized as the optimal mixing speed in further studies because it demonstrated the best results.
3.5.7 Effect of adsorbent particle size.
The BF adsorption studies utilized multiple adsorbent particle types measured from ≤300 to 900 μm in size (Fig. 7H). In this experiment, the adsorbent particle size was changed, while the other experimental variables remained fixed. The results showed that an increase in the adsorbent particle size led to a decreased adsorption rate. All the adsorbents, including EB, CuFe2O4/EB, and PPY/GO/EB, demonstrated this same adsorption pattern. The smaller particles delivered elevated adsorption capabilities because their increased surface area led to superior dye-adsorbent contact. The highest adsorption potential emerged from particles smaller than 300 μm, which possessed a large surface area combined with the highest active site density.
3.5.8 Effect of salts and surfactants on sorption efficiency.
The sorption process of dyes is a significantly impacted by the various salts that textile industries release in their wastewater. Thus, the biosorption efficiency undergoes significant changes due to salt concentrations, which control non-electrostatic and electrostatic types of interactions between the adsorbate and adsorbent.13 The current investigation evaluated the influence of NaCl, AlCl3, and CaCl2 salts on the adsorption process of BF dye. Fig. 7I shows that the introduction of these salts in the aqueous solution decreased the biosorption capacity because of the charge shielding effects resulting from the salt ions, which decreased the electrostatic attractions between the positively charged dye and negatively charged adsorbents. Salt molecules compete for the available active sites by blocking some active sites during the sorbate and salt particle interaction. The results showed that AlCl3 had a significant influence on the adsorption efficiency of EB and the CuFe2O4/EB and PPY/GO/EB composites. The solution medium containing this substance lowered the adsorption potential of all three adsorbents. Among the salts tested, CaCl2 and NaCl showed the least impact on the adsorption capacity than AlCl3. This can be ascribed to the differences in their ionic charge strengths as well as adsorbent surface interactions. The dissociation of AlCl3 creates Al3+ ions, which carry higher charge densities compared to the Na+ and Ca2+ ions present in NaCl and CaCl2, respectively. The trivalent Al3+ ions create strong connections with both the dye molecules and the adsorbent surface, and thus the adsorption sites become less accessible for adsorption. Thus, the reduced accessibility of the adsorption sites due to site competition adversely affects the dye adsorption rates. These findings revealed that composite materials demonstrated a superior dye sorption efficiency given that their sorption capacity remained stable among the electrolytes. These results are similar to the removal of basic blue 41 by EB composites reported by Zafar et al.22
Different surfactants, including SDS, CTAB, Triton, and Brite, are utilized in industrial applications, with special emphasis on their use in textile processing. The presence of surfactants in the reaction solution results in noteworthy changes to the sorption behavior of biosorbents.53 Thus, this study explored the influence of SDS, CTAB, Triton, and Brite surfactants on the biosorption capacities of EB, CuFe2O4/EB, and PPY/GO/EB, which are displayed in Fig. 7J. The results showed that all the tested adsorbents showed reduced potential for adsorption when surfactants were present in the reaction medium. The sorbate–sorbent interaction was affected by the presence of surfactants, given that the surfactant molecules also occupied some of the surface-active sites of the biosorbent, possibly competing with the sorbate for adsorption. The interaction between the surfactants and biosorbents led to pore blockage, which occurred on the sorbent surface when surfactants were present. CTAB demonstrated the strongest influence on the sorption efficiency of all the adsorbents, while Triton had a minimal impact on their sorption efficiency.54
3.6 Mechanism of adsorption for BF
Both chemical and physical interactions are involved in governing the adsorption of BF on the EB, CuFe2O4/EB, and PPY/GO/EB adsorbents. Because of the cationic nature of the BF molecules, they retain a positive charge, although the negatively charged functional groups, i.e., –OH, –COO−, on the surface of the adsorbents may lead to a negative charge. This encourages robust electrostatic interactions. The dye and the graphene/carbonaceous material-based elements of the adsorbents both include aromatic rings that promote π–π interactions, thus improving the dye adsorption.55 Numerous functional moieties on the surface of the adsorbents such as –COOH and –OH can also create H-bonds with the dye molecule nitrogen-containing groups, this bonding can facilitate greater dye uptake by the adsorbents.56 Moreover, the formation of a complex may result from the coordination between the lone pairs present on the nitrogen atoms in the structure of the BF dye and metal ions such as Cu2+ and Fe3+ on the surface of the CuFe2O4/EB adsorbent, which further improves the adsorption process. The mechanism for the removal of BF through the EB, CuFe2O4/EB, and PPY/GO/EB adsorbents is shown in Fig. 8.
 |
| | Fig. 8 Mechanism of BF adsorption by EB, CuFe2O4/EB, and PPY/GO/EB. | |
3.7 Kinetic modeling
Kinetic analysis is crucial for comprehending the experimental design of the adsorption phenomenon, where several models are employed to determine the order of the reaction. Adsorption, a surface phenomenon, consists of three steps, where the first step is the rate of mass transfer towards the external surface of the adsorbent. The second step is the internal dispersion of the sorbate towards the active sites of the adsorbent. The third step is the adsorption process itself.57 Some models are applied for the evaluation considering sorption as the rate-determining step. In contrast, some models are applied considering the dispersion rate as the rate-determining step. The fitness of the model that is applied gives information on the mechanism of the biosorption process. Kinetic studies can also be used to determine whether there is a physical or chemical change occurring during the reaction. The adsorption of BF was examined on various adsorbents, including native biomass EB and CuFe2O4/EB and PPY/GO/EB composites. Various kinetic models, including intraparticle, pseudo-first-order, and pseudo-second-order models, were utilized to analyze the adsorption process. According to the value of the coefficient of determination (R2), it was determined to what extent the model fits the data.
3.7.1 Pseudo-first-order model.
The pseudo-first-order kinetic model gives the relationship between the amount of adsorbate adsorbed and the time needed for this adsorption. The term “pseudo-first-order reaction” refers to a reaction that in theory, should occur at a higher order (greater than 1) but does so at first order due to the high concentration of one reactant utilized and the fact that the rate of the reaction depends on the reactant that is present in a smaller quantity in the reaction medium. An R2 value closer to 1 implies that the pseudo-first-order model is the most suitable. This is only possible when the experimental qe values and theoretical qe values appear to be close. The straight-line equation of the pseudo-first-order kinetic model is given as eqn (5).58| |  | (5) |
where qe = amount BF adsorbed at equilibrium, qt = amount BF adsorbed at any time t, k1 = pseudo 1st order rate constant, and t = contact time. According to the plot of log(qe − qt) vs. t (Fig. 9A), it could be inferred that this model was not appropriate to fit the data of this experimental work, given that the R2 values of EB (0.439), CuFe2O4/EB (0.109), and PPY/GO/EB (0.138) are not close to 1 (Table 2). Hence, this model could not be used to explain the biosorption process of BF on the above-mentioned adsorbents.
 |
| | Fig. 9 Kinetic study and equilibrium isotherm models of BF adsorption by EB, CuFe2O4/EB, and PPY/GO/EB: (A) pseudo-first-order, (B) pseudo-second-order, (C) intraparticle diffusion kinetic, (D) Langmuir, (E) Freundlich, and (F) Temkin isotherm models. | |
Table 2 Kinetic models applied to the adsorption data of BF by EB and its composites
| Kinetic models |
EB |
CuFe2O4/EB |
PPY/GO/EB |
| Pseudo 1st order |
|
K
1
|
0.0021 ± 0.003 |
0.0074 ± 0.004 |
0.0055 ± 0.001 |
|
q
e experimental value (mg g−1) |
6.71 ± 0.24 |
9.64 ± 0.32 |
9.29 ± 0.28 |
|
q
e calculated value (mg g−1) |
1.22 |
1.11 |
0.85 |
|
R
2
|
0.439 |
0.109 |
0.138 |
|
|
| Pseudo 2nd order |
|
K
2
|
0.07 ± 0.004 |
0.203 ± 0.002 |
0.183 ± 0.003 |
|
q
e experimental value (mg g−1) |
6.71 ± 0.22 |
9.64 ± 0.36 |
9.29 ± 0.32 |
|
q
e calculated value (mg g−1) |
6.32 |
9.319 |
9.14 |
|
R
2
|
0.991 |
0.998 |
0.994 |
|
|
| Intraparticle diffusion |
|
K
pi
|
0.21 ± 0.05 |
0.72 ± 0.03 |
0.11 ± 0.02 |
|
C
i
|
4.3 ± 0.18 |
8.60 ± 0.44 |
8.13 ± 0.34 |
|
R
2
|
0.708 |
0.571 |
0.679 |
3.7.2 Pseudo-second-order kinetic model.
Pseudo-second order kinetics refers to an adsorption process that occurs chemically, and it depends on the active adsorption pores. It is based on the idea that chemisorption, which includes the exchange and sharing of electrons between the adsorbent and the adsorbate, is the rate-determining phase in the biosorption process.59 To understand the mechanism of adsorption over a complete range of contact times, the pseudo-second-order kinetic model can be successfully applied. This model offers thorough knowledge of the process and is a useful way for investigating the adsorption mechanism throughout a range of contact times. The straight-line equation of this model is given as eqn (6).60| |  | (6) |
where qe = amount BF adsorbed at equilibrium, qt = amount BF adsorbed at any time t, k2 = pseudo 2nd order rate constant, and t = contact time (min). Through experimentation and calculations, the values of R2 for EB, CuFe2O4/EB, and PPY/GO/EB were observed to be 0.991, 0.998 and 0.994, respectively, from the plot of  (Fig. 9B). Given that the values of EB and its composites are very close to 1, this model was the best fit for the adsorption of BF on these adsorbents. The pseudo-second-order kinetic model demonstrated significantly stronger correlation (P < 0.05) with the adsorption data compared to the pseudo-first-order kinetic model, indicating that the adsorption process may be predominantly governed by chemisorption. Also, the experimental qe and theoretical qt values were detected to be close, i.e., there was a very small difference between the two, which also indicated the fitness of this model. The calculated kinetic parameters are presented in Table 2. These elucidated outcomes are consistent with the validated findings found in the literature.43
3.7.3 Intraparticle diffusion model.
The diffusion (movement) of ionic pollutant molecules into the inner pores of the EB, CuFe2O4/EB, and PPY/GO/EB adsorbents was assessed by the intraparticle diffusion model. Given that the diffused molecules interacted with the binding adsorption sites of the adsorbent, this interaction influenced the biosorption efficacy of the adsorbents. The effect was quantified using eqn (7),61 as follows:where qt = biosorption capacity at time t, Ci = constant describing the boundary layer thickness, and kpi = rate constant of intraparticle diffusion. The values of R2 for EB, CuFe2O4/EB, and PPY/GO/EB were calculated to be 0.708, 0.571, and 0.679, respectively, from the plot of qtvs. t1/2 (Fig. 9C) (Table 2). Considering the above-mentioned results, it was obvious that this model was not best suited to the adsorbents used in the biosorption process. In this particular scenario, given that the plot did not pass through the origin, it was inferred that this type of diffusion was not the sole rate-limiting process. Instead, the biosorption rate could also be influenced by various other kinetic models. All the constant values were determined from the slope and intercept of the plots drawn employing the linear form of the equations.
Although the adsorption rate is directly correlated with the rate constant (k) value, the highest adsorption (9.64 ± 0.36 mg g−1) of BF was obtained using the CuFe2O4/EB composite with the k2 value of 0.203 ± 0.002 g mg−1 min−1. The high adsorption efficiency of the CuFe2O4/EB composite is ascribed to its enhanced surface area and porosity, dual metal adsorption sites, high thermo-chemical stability, and stronger electrostatic interactions compared to the EB and PPY/GO/EB adsorbents.
Notably, without additional verification, the acquired kinetic parameters are not directly applicable to technical applications because they are restricted to controlled experimental conditions.
3.8 Isotherm models
Equilibrium isotherms were employed to analyze the interaction between the adsorbent and the adsorbate as well as the biosorption mechanism by evaluating various equilibrium models against the experimental data. The most suitable models were identified by comparing the R2 values and assessing the biosorption capacity derived from both the experimental and calculated results.
3.8.1 Langmuir isotherm model.
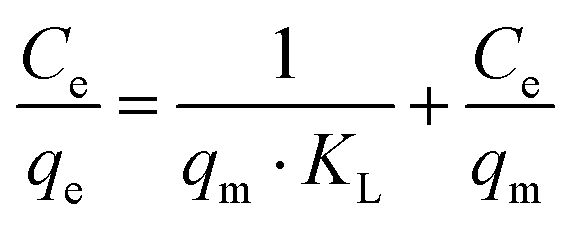
The Langmuir equation explains homogenous monolayer adsorption having a finite number of identical binding sites with little or no interaction between the adsorbed molecules and adsorbent surface.62 The model fitness is described by the R2 value and the model is considered to be the best fit when the R2 value is close to 1. The Langmuir equation is presented as eqn (8).63| |  | (8) |
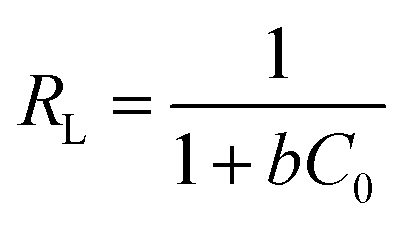
where qm (mg g−1) = maximum sorption capacity, qe (mg g−1) = equilibrium sorption capacity, Ce (mg L−1) = equilibrium concentration, and KL = the Langmuir constant. The key characteristics of the Langmuir isotherm can be represented by a dimensionless parameter called the separation factor, symbolized as RL. RL is a noteworthy constant that is determined using eqn (9).| |  | (9) |
where b = the Langmuir constant and C0 (mg L−1) = adsorbate concentration at the initial point. KL and b are generally related to the energy or affinity of biosorption (L mg−1). By plotting Ce/qevs. Ce (Fig. 9D), the values for each of these constants were obtained from the above-mentioned equation. Different reaction conditions are directed by the values of RL. If the RL value falls within the range of 0 to 1, it indicates that the process progresses gradually (favorable). Further, three options are connected to RL, as follows: (1) the process of adsorption is deemed unfavorable if RL > 1. (2) The reaction is regarded as irreversible if RL = 0. (3) The process is regarded as linear if RL = 1. Based on the experimental results (Table 3), the RL values for EB, CuFe2O4/EB, and PPY/GO/EB were calculated to be 0.213, 0.067, and 0.105, and the R2 values were determined to be 0.987, 0.988, and 0.991, respectively. The adsorption process was deemed favorable because of 0 < RL < 1. Hence, this model was concluded to be the best fit to explain the adsorption process by the above-mentioned adsorbents. Among the isotherm models applied to the data, the Langmuir isotherm model with the lowest residual error and highest R2 values offered the best fit. Also, the difference in fit among the Langmuir, Freundlich, and Temkin models was found to be statistically significant (P < 0.05).
Table 3 Isotherm models applied to the adsorptive removal data of BF by EB, CuFe2O4/EB and PPY/GO/EB
| Isotherm models |
EB |
CuFe2O4/EB |
PPY/GO/EB |
| Langmuir |
|
K
L
|
0.026 ± 0.06 |
0.01 ± 0.02 |
0.012 ± 0.05 |
|
R
L
|
0.213 |
0.067 |
0.105 |
|
b
|
0.169 ± 0.02 |
0.721 ± 0.05 |
0.698 ± 0.04 |
|
q
max Cal. (mg g−1) |
7.69 |
10.30 |
10.04 |
|
q
max Exp. (mg g−1) |
6.71 ± 0.24 |
9.64 ± 0.33 |
9.29 ± 0.31 |
|
R
2
|
0.987 |
0.988 |
0.991 |
|
|
| Freundlich |
|
K
f (mg g−1) |
1.82 ± 0.33 |
2.64 ± 0.54 |
2.50 ± 0.43 |
|
n
|
2.25 ± 0.29 |
2.46 ± 0.37 |
2.7 ± 0.42 |
|
R
2
|
0.853 |
0.727 |
0.820 |
|
|
| Temkin |
|
A
|
12.82 ± 1.22 |
83.13 ± 1.17 |
82.39 ± 1.33 |
|
B
|
1.75 ± 0.25 |
2.0 ± 0.32 |
1.89 ± 0.26 |
|
R
2
|
0.890 |
0.740 |
0.875 |
|
|
| Dubinin–Radushkevich |
|
q
m (mg g−1) |
5.88 ± 0.22 |
8.97 ± 0.43 |
8.65 ± 0.27 |
|
β (mol2 kJ−2) |
0.0087 ± 0.0002 |
0.076 ± 0.004 |
0.054 ± 0.003 |
|
E (kJ mol−1) |
0.353 ± 0.04 |
2.234 ± 0.51 |
1.187 ± 0.23 |
|
R
2
|
0.634 |
0.773 |
0.588 |
3.8.2 Freundlich isotherm model.
The Freundlich isotherm model focuses on the sorption of multiple layers of adsorbate molecules onto the surface of the adsorbent, considering the heterogeneity of the adsorbent surface. It provides information about the concentration of the adsorbate on the surface of the biosorbent based on the concentration of adsorbate in the solution, which determines the interaction with the biosorbent.64 The expression for this model is written as eqn (10).65| |  | (10) |
where Ce = adsorbate concentration at equilibrium, qe = quantity of adsorbate on the adsorbent surface area (mg g−1), kf = Freundlich constant that shows the adsorption potential, 1/n = heterogeneous factor, and n = adsorption intensity constant. The value of ‘n’ indicates the degree of deviation from the linear relationship between adsorption and solution concentration. There are three potential scenarios, as follows: (1) when n > 1, it suggests that adsorption is a chemical process. (2) When n < 1, it indicates that adsorption is a physical process. (3) When n = 1, it suggests that adsorption follows a linear process.66 A graphical representation of the results obtained is shown in Fig. 9E. According to the results, it can be seen that this model did not fit the experimental data very well given that the R2 values of EB, CuFe2O4/EB and PPY/GO/EB were found to be 0.853, 0.727 and 0.820, respectively, as shown in Table 3. The value of n was observed to be greater than 1, which indicated that the biosorption process was chemical in nature.
3.8.3 Temkin isotherm model.
According to the Temkin isotherm, the binding energies are dispersed uniformly over the numerous biosorbent surface swapping sites. This model predicts that the interactions between the adsorbent and adsorbate cause the heat of sorption to decline linearly with an increase in surface coverage on the adsorbent.67 The linear expression of the isotherm is presented in eqn (11).68where B = the heat of adsorption constant and A = the optimal binding energy achieved at the equilibrium point. In the above-mentioned equation, B can be expressed as eqn (12).| |  | (12) |
where b = the Temkin constant, R = the ideal gas constant, and T = temperature. Plotting qe against lnCe (Fig. 9F) allows the calculation of the constant parameters and R2. According to the value of B, one can predict whether the adsorption process is endothermic or exothermic. A negative B value predicts that the sorption process is endothermic and vice versa. Moreover, based on the R2 values, it was inferred that the Temkin model was not well suited for the adsorption of BF on the EB, CuFe2O4/EB, and PPY/GO/EB adsorbents. The isotherm parameters for BF with the EB, CuFe2O4/EB, and PPY/GO/EB adsorbents are provided in Table 3.
3.8.4 Dubinin–Radushkevich (D–R) isotherm model.
Another model accounting for a heterogeneous energy distribution on the adsorbent surface is D–R isotherm model. The apparent free energy on the surface pores of the adsorbent can be estimated with the aid of this isotherm. Eqn (13) displays the D–R model in its straight-line version.69| | | lnqe = lnqm − βε2 | (13) |
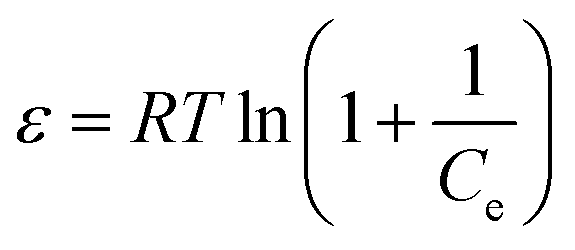
where ε stands for the Polanyi potential (J mol−1), β is the D–R constant, which denotes the sorption energy in mol2 kJ−2, qm represents the theoretical monolayer capacity in mg g−1, and qe signifies the amount adsorbed at equilibrium in mg g−1. Eqn (14) can be used to get the Polanyi potential.| |  | (14) |
where Ce indicates the dye equilibrium concentration (mg L−1), T is the absolute temperature (K), and R is the universal gas constant (8.314 J mol−1 K−1). The mean free energy can be calculated by applying eqn (15).
Table 3 provides the calculated values for each constant together with the experimental values. The results showed that the D–R model was not fitted to the BF adsorption because EB, CuFe2O4/EB, and PPY/GO/EB had the R2 values of 0.634, 0.773, and 0.588, respectively. The energy of sorption values for EB, CuFe2O4/EB, and PPY/GO/EB were found to be 0.353 ± 0.04, 2.234 ± 0.51, and 1.187 ± 0.23 kJ mol−1, respectively. It is acknowledged that when the energy of sorption is lower than 8 kJ mol−1, the adsorption type can be physical adsorption.70 Thus, the physisorption mechanism played a vital role in the biosorption of BF on the EB-based composites.
3.8.5 Isotherm study at variable temperatures.
To investigate the isothermal behavior at varying temperatures, the adsorption tests were carried out at distinct temperatures (303, 308, 313, 318, and 323 K) with different dye initial concentrations (2, 4, 6, 8, 10, and 12 mg L−1). To generate isotherms, the qe values were determined for each temperature at varying initial dye concentrations and plotted. As shown in Table 4, qe increased with an increase in the dye concentration up to 10 mg L−1 because of the enhanced surface interaction and mass transfer, and beyond that saturation caused a drop. Conversely, all the adsorbents showed a constant drop in qe as the temperature increased, suggesting that the adsorption is exothermic. The comparative isotherm graphs, as displayed in Fig. 10A–C, confirmed the superior performance of the CuFe2O4/EB composite at the optimal concentration and lower temperature.
Table 4 Comparison of qe (mg g−1) obtained for different concentrations at variable temperatures
| Sample |
Temperature (K) |
2 mg L−1 |
4 mg L−1 |
6 mg L−1 |
8 mg L−1 |
10 mg L−1 |
12 mg L−1 |
| EB |
303 |
1.31 ± 0.032 |
1.95 ± 0.21 |
3.65 ± 0.20 |
5.06 ± 0.26 |
6.71 ± 0.24 |
6.28 ± 0.50 |
| 308 |
1.02 ± 0.034 |
1.62 ± 0.26 |
3.14 ± 0.12 |
4.84 ± 0.34 |
6.23 ± 0.23 |
5.97 ± 0.37 |
| 313 |
0.72 ± 0.041 |
1.24 ± 0.17 |
2.15 ± 0.31 |
4.32 ± 0.22 |
5.73 ± 0.35 |
5.42 ± 0.22 |
| 318 |
0.44 ± 0.022 |
0.95 ± 0.013 |
1.77 ± 0.33 |
3.97 ± 0.19 |
5.17 ± 0.23 |
4.71 ± 0.4 |
| 323 |
0.16 ± 0.041 |
0.67 ± 0.031 |
1.54 ± 0.14 |
3.74 ± 0.55 |
4.55 ± 0.32 |
4.33 ± 0.33 |
|
|
| MAG/EB |
303 |
3.88 ± 0.24 |
5.67 ± 0.23 |
6.76 ± 0.25 |
8.22 ± 0.43 |
9.64 ± 0.33 |
9.43 ± 0.23 |
| 308 |
3.34 ± 0.25 |
5.23 ± 0.41 |
6.52 ± 0.33 |
7.93 ± 0.33 |
8.72 ± 0.20 |
8.07 ± 0.24 |
| 313 |
3.04 ± 0.31 |
5.09 ± 0.26 |
6.22 ± 0.45 |
7.55 ± 0.54 |
8.62 ± 0.27 |
7.45 ± 0.15 |
| 318 |
2.55 ± 0.12 |
4.76 ± 0.17 |
5.87 ± 0.32 |
7.07 ± 0.42 |
8.11 ± 0.35 |
6.65 ± 0.27 |
| 323 |
2.07 ± 0.22 |
4.14 ± 0.38 |
5.23 ± 0.22 |
6.56 ± 0.54 |
7.74 ± 0.43 |
6.09 ± 0.29 |
|
|
| PPY/GO/EB |
303 |
2.89 ± 0.11 |
3.88 ± 0.35 |
4.87 ± 0.15 |
6.61 ± 0.47 |
9.29 ± 0.31 |
9.08 ± 0.34 |
| 308 |
2.62 ± 0.14 |
3.61 ± 0.22 |
4.52 ± 0.27 |
6.24 ± 0.36 |
8.30 ± 0.26 |
8.05 ± 0.24 |
| 313 |
2.33 ± 0.17 |
3.23 ± 0.21 |
4.24 ± 0.36 |
5.88 ± 0.45 |
7.95 ± 0.38 |
7.51 ± 0.44 |
| 318 |
2.06 ± 0.10 |
3.03 ± 0.33 |
3.88 ± 0.34 |
5.23 ± 0.34 |
7.21 ± 0.48 |
6.89 ± 0.33 |
| 323 |
1.55 ± 0.022 |
2.76 ± 0.14 |
3.56 ± 0.24 |
4.78 ± 0.44 |
6.74 ± 0.14 |
6.44 ± 0.23 |
 |
| | Fig. 10 Adsorption isotherms for (A) EB, (B) CuFe2O4/EB, and (C) PPY/GO/EB at different temperatures. | |
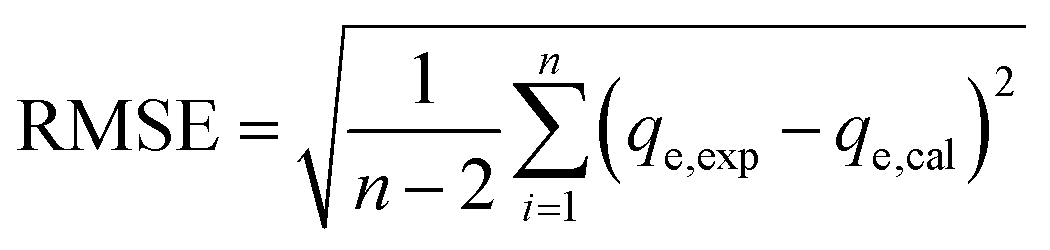
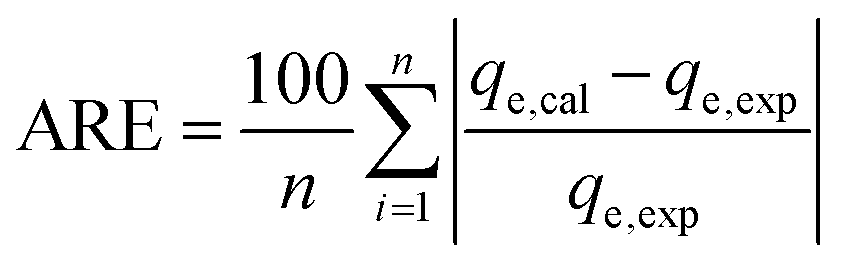
3.9 Goodness of fit
A crucial metric that gauges how well the curve matches the data is the goodness of fit. The following metrics were assessed to determine the degree of fit. R2 is useful because it indicates the percentage variance of one variable that can be predicted from another. It is a metric that enables the degree of certainty to be confirmed in projections derived from a particular model. The conventional techniques of using linear regression to calculate the isotherm parameters seem to fit the experimental data well. However, R2 does not reflect the errors in the isotherm curves, rather it is dependent on the non-linear forms of the isotherm equations. The equilibrium model with ideal magnitude was evaluated using non-linear error functions including chi-square test error function (χ2), residual root mean square error (RMSE), sum of square of errors (ERRSQ), sum of absolute errors (EABS), average relative error (ARE), hybrid error function (HYBRID), and Marquardt's percent standard deviation (MPSD), and their standard equations are presented as eqn (16)–(22), respectively.71,72| |  | (16) |
| |  | (17) |
| |  | (18) |
| |  | (19) |
| |  | (20) |
| |  | (21) |
| |  | (22) |
Where the ‘cal’ and ‘exp’ subscripts indicate the calculated and experimental values, respectively, p signifies the number of parameters, and n shows the number of observations in the experimental isotherm. The calculated error metrics for the kinetic models are depicted in Table 5. The kinetic data for the EB, CuFe2O4/EB, and PPY/GO/EB adsorbents best fitted the pseudo-second order model, as seen by the highest R2 values and lowest χ2, RMSE, ARE, ERRSQ, EABS, HYBRID, and MPSD values. This suggests that the process of adsorption is possibly governed by chemisorption, including valency forces via electron sharing or exchange. Similarly, the Langmuir isotherm model demonstrated the lowest error metrics and highest R2 values, confirming its appropriateness for equilibrium data (Table 6).
Table 5 Calculation of error functions for the kinetic models of BF adsorption
| Adsorbent |
Model |
R
2
|
χ
2
|
RMSE |
ARE |
ERRSQ |
EABS |
HYBRID |
MPSD |
|
PFO = pseudo first order.
PSO = pseudo second order.
IPD = intraparticle diffusion.
|
| EB |
PFOa |
0.439 |
0.037 |
0.46 |
5.59 |
1.04 |
2.29 |
1.85 |
4.19 |
| PSOb |
0.991 |
0.016 |
0.22 |
1.23 |
0.38 |
0.92 |
0.53 |
1.30 |
| IPDc |
0.708 |
0.025 |
0.33 |
4.43 |
0.94 |
1.87 |
1.21 |
3.54 |
|
|
| CuFe2O4/EB |
Pseudo 1st order |
0.109 |
0.032 |
0.37 |
4.30 |
0.88 |
1.80 |
1.47 |
3.73 |
| Pseudo 2nd order |
0.998 |
0.013 |
0.19 |
1.10 |
0.34 |
0.79 |
0.44 |
1.27 |
| Intraparticle diffusion |
0.571 |
0.021 |
0.31 |
3.35 |
0.45 |
1.43 |
1.10 |
2.24 |
|
|
| PPY/GO/EB |
Pseudo 1st order |
0.138 |
0.026 |
0.32 |
3.92 |
0.71 |
1.50 |
1.37 |
3.26 |
| Pseudo 2nd order |
0.999 |
0.007 |
0.11 |
0.91 |
0.20 |
0.42 |
0.35 |
0.97 |
| Intraparticle diffusion |
0.679 |
0.011 |
0.24 |
2.54 |
0.43 |
1.21 |
1.11 |
2.76 |
Table 6 Calculation of error functions for the isotherm models of BF adsorption
| Adsorbent |
Model |
R
2
|
χ
2
|
RMSE |
ARE |
ERRSQ |
EABS |
HYBRID |
MPSD |
| EB |
Langmuir |
0.987 |
0.021 |
0.25 |
2.33 |
0.65 |
1.26 |
1.10 |
2.81 |
| Freundlich |
0.853 |
0.038 |
0.48 |
5.91 |
1.22 |
2.51 |
2.30 |
5.13 |
| Temkin |
0.890 |
0.034 |
0.41 |
4.60 |
1.12 |
2.17 |
2.07 |
4.72 |
|
|
| CuFe2O4/EB |
Langmuir |
0.988 |
0.015 |
0.22 |
1.10 |
0.37 |
0.93 |
0.90 |
2.13 |
| Freundlich |
0.727 |
0.035 |
0.46 |
5.22 |
1.20 |
2.40 |
2.16 |
4.95 |
| Temkin |
0.740 |
0.028 |
0.38 |
4.28 |
1.02 |
1.95 |
1.87 |
3.88 |
|
|
| PPY/GO/EB |
Langmuir |
0.991 |
0.009 |
0.12 |
0.86 |
0.18 |
0.52 |
0.53 |
1.29 |
| Freundlich |
0.820 |
0.032 |
0.43 |
3.93 |
0.92 |
1.85 |
1.70 |
3.71 |
| Temkin |
0.875 |
0.026 |
0.35 |
3.52 |
0.82 |
1.61 |
1.55 |
3.15 |
3.10 Thermodynamic study
Thermodynamic studies are crucial for exploring the heat transfer, spontaneity, and viability of adsorption on the surface of an adsorbent as well as the adsorption mechanisms.73 These parameters can provide insight into whether the reaction is characterized as exothermic or endothermic. Eqn (23) was used to calculate the Gibbs free energy change (ΔG) values.| | | ΔG = −RTlnKd | (23) |
where Kd is regarded as the equilibrium constant for biosorption at the absolute temperature (T). Its formula is given in eqn (24).| |  | (24) |
where R signifies the general gas constant (8.314 J mol−1 K−1) and Ce indicates concentration at equilibrium. Free energy (ΔG), enthalpy (ΔH), and entropy (ΔS) are the three thermodynamic parameters that can be calculated to gain insights into the adsorption mechanism. These parameters were calculated by using eqn (25) and (26).| |  | (26) |
where ΔG represents the Gibbs free energy change, ΔH represents the change in heat content of the system, ΔS indicates the randomness of the system, and T signifies the temperature. The parameter values were determined by plotting lnKd against 1/T, and the results are summarized in Table 7. As the temperature increased, a decrease in the ΔG values was observed, with negative ΔG values confirming the nature of the reaction as spontaneous. Similarly, the negative ΔH values for all the adsorbents indicated that the adsorption process was exothermic. Additionally, the entropy of the system increased with an increase in temperature.74
Table 7 Thermodynamic parameters for the adsorption of BF by EB, CuFe2O4/EB, and PPY/GO/EB
| Temperature (K) |
303 |
308 |
313 |
318 |
323 |
| EB |
| ΔG (kJ mol−1) |
−0.17 ± 0.021 |
−0.26 ± 0.032 |
−0.48 ± 0.034 |
−1.293 ± 0.022 |
−1.79 ± 0.012 |
| ΔH (kJ mol−1) |
−38.87 ± 1.2 |
|
|
|
|
| ΔS (kJ mol−1 K) |
0.13 ± 0.035 |
|
|
|
|
|
|
| CuFe2O4/EB |
| ΔG (kJ mol−1) |
−3.32 ± 0.21 |
−3.89 ± 0.32 |
−4.74 ± 0.22 |
−4.95 ± 0.33 |
−8.31 ± 0.24 |
| ΔH (kJ mol−1) |
−75.18 ± 1.8 |
|
|
|
|
| ΔS (kJ mol−1 K) |
0.22 ± 0.043 |
|
|
|
|
|
|
| PPY/GO/EB |
| ΔG (kJ mol−1) |
−1.95 ± 0.033 |
−2.52 ± 0.054 |
−3.53 ± 0.22 |
−4.07 ± 0.27 |
−6.49 ± 0.23 |
| ΔH (kJ mol−1) |
−70.63 ± 1.7 |
|
|
|
|
| ΔS (kJ mol−1 K) |
0.21 ± 0.037 |
|
|
|
|
3.11 Desorption study
Desorption studies aid in explaining the recovery of the biosorbent after adsorption. Desorption experiments were carried out to regenerate the used adsorbent, given that this makes the treatment procedure more cost-effective.75 This study was carried out to determine the percentage of desorption. For this, the adsorbents loaded with the dye particles were separated from the solution using a 0.2 μm Teflon filter after the adsorption process. However, after separation, the loaded adsorbents were treated with solutions of different concentrations of HCl and NaOH. The different concentrations of HCl and NaOH used were 0.1, 0.2, and 0.3 N.76 The results of the desorption experiments are shown in Fig. 11A. Based on the depicted graph, it is evident that the desorption capacity declined as the concentration of eluting reagents (NaOH and HCl) increased. This decrease in desorption percentage can be attributed to the protonation of the functional groups on the surface of the adsorbent caused by too many protons in the acidic media. Elevated NaOH concentrations can deprotonate the surface, changing the structure of the adsorbent and decreasing its dye-desorption efficiency. Thus, elevated levels of acid and base can change the surface chemistry of the adsorbent, modifying its functional groups to better trap the dye rather than release it.77 About 72.21% ± 1.2%, 95.21% ± 1.5%, and 91.43% ± 1.4% of BF was desorbed by EB, CuFe2O4/EB, and PPY/GO/EB, respectively, at 0.1 N concentration of eluting reagents. The desorption ability was detected to be higher for CuFe2O4/EB compared to the native EB and PPY/GO/EB composite. Eqn (27) was utilized to calculate the % desorption for BF.| |  | (27) |
 |
| | Fig. 11 (A) Desorption study of BF dye using eluting reagents, EDX analysis after desorption, (B) EB, (C) CuFe2O4/EB, and (D) PPY/GO/EB, (E) effect of bed-height, and (F) dye concentration on breakthrough curve, and (G) test aqueous medium cell viability with, (a) control, and BF solution (10 mg L− 1) (b) before, and (c) after treatment. | |
The reusability and structural stability of the adsorbents were further evaluated through EDX characterization after desorption. The EDX spectra of EB, CuFe2O4/EB, and PPY/GO/EB after desorption are shown in Fig. 11B–D, respectively. In the case of EB (Fig. 11B), the intensity of the O and Si peaks decreased slightly, which could be explained by the partial dissolution of silica or mild surface etching, resulting from the contact with the eluting agents. The carbon peak remained constant, indicating that the organic matrix was retained. In contrast, CuFe2O4/EB (Fig. 11C) showed a minimal reduction in the Fe and Cu signal intensity, which was probably because the metal ions partially leached from the surface during desorption steps. However, the existence of Fe and Cu signals after desorption indicated that the composite retained its overall structure. The EDX spectrum of PPY/GO/EB (Fig. 11D) after desorption revealed a decrease in the intensity of the N signal, indicating that the chains of polypyrrole were partly degraded or solubilized by the elution process. The O and C signals remained comparatively stable, suggesting that the GO framework was preserved. The absence of any contamination peaks supported the chemical stability of the composites.
3.12 Column studies
The success of the adsorption process is influenced by the effectiveness of the adsorbent; the batch study showed that the magnetic composite could adsorb a high quantity of BF. In the case of industrial applications, the efficiency of CuFe2O4/EB was studied in a continuous flow packed column. Two parameters, bed height of adsorbent and concentration of BF, were investigated in the column study experiments. Many articles have been reported on adsorbing BF by various substances, but not many about performing column experiments with BF. The most crucial factor in column experiments is the time the column takes for breakthrough, which shows how well the bed height and regeneration work. The breakthrough time for concentration and bed height factors was calculated employing eqn (28).| |  | (28) |
The bed-depth service time and Thomas models were applied to the experimental data for kinetic examination of the column study experimentation.
3.12.1 Effect of the process variables.
The impact of the bed height of the CuFe2O4/EB composite was investigated at bed heights of 1, 2, and 3 cm, while maintaining a constant rate of flow (1.8 mL min−1) and an inlet BF concentration of 20 mg L−1 at pH 9. The tests showed that an increase in the bed height caused an increase in the adsorption efficiency (Fig. 11E). When the bed height was 3 cm, the adsorption increased until the maximum capacity of 8.44 ± 0.22 mg g−1 was reached after 580 min. Because there were more available sites on the surface of CuFe2O4/EB, a shift towards a higher breakthrough time occurred as the bed height increased (Table 8). This also facilitated the adsorption of additional BF ions by boosting the intraparticle diffusion. The longer it takes for a breakthrough, the more time the pollutant spends in the column, and thus a larger quantity of the effluent is treated.78
Table 8 Breakthrough time and capacity values for BF at different bed heights, concentrations, and flow rates
| Dye conc. (inlet) (mg L−1) |
Bed height (cm) |
Flow rate (mL min−1) |
Breakthrough point (min) 50% |
Adsorption capacity (mg g−1) |
| 15 |
3 |
1.8 |
420 |
6.34 ± 0.32 |
| 20 |
1 |
1.8 |
200 |
7.53 ± 0.42 |
| 20 |
2 |
1.8 |
260 |
7.89 ± 0.35 |
| 20 |
3 |
1.8 |
380 |
8.44 ± 0.22 |
| 25 |
3 |
1.8 |
240 |
8.93 ± 0.28 |
The impact of another parameter, concentration of pollutant, was examined by testing the BF levels of 15, 20, and 25 mg L−1 at a constant flow rate of 1.8 mL min−1 and bed height of 3 cm. The results showed that the adsorption efficiency increased from 6.34 ± 0.32 mg g−1 to 8.93 ± 0.28 mg g−1 on increasing the BF concentration from 15 mg L−1 to 25 mg L−1 (Fig. 11F). It was noted that at a higher BF concentration, the breakthrough time was reached more quickly. A higher concentration gradient between the two reactants led to a shorter time required for the reaction, thus shortening the breakthrough time. The active sites on the adsorbent surface reached the saturation level fast, owing to the sufficient concentration to saturate them by shortening the breakthrough time. This also led to a steeper breakthrough curve given that there was less mass transferred from the bulk to the surface of the adsorbent because of weaker forces.78,79
3.12.2 Modelling for column study.
The behavior of CuFe2O4/EB in the column study was demonstrated by applying the Thomas and BDST models to the data to determine the maximum adsorption efficiency and breakthrough curve, respectively.
3.12.2.1 Thomas model.
The driving force (between the molecules of adsorbent and adsorbate) in the Thomas model obeys reversible pseudo 2nd order kinetics as well as Langmuir isotherm (depending on whether adsorption is favorable/unfavorable) at the equilibrium state. Eqn (29)80 indicates the linear version of this model.| |  | (29) |
where C0 (inlet) and Ct (outlet) indicate the initial (t = 0) and time ‘t’ concentrations of BF in mg L−1, respectively, KTH (mL min−1 mg−1) represents the rate constant for the Thomas model, q0 (mg g−1) signifies the adsorption of pollutant at equilibrium, t (min) indicates the time of flow, Q (mL min−1) represents the rate of flow, and W (g) symbolizes the adsorbent mass. Table 9 provides the Thomas parameter values. The applicability of the Thomas model to the experimental data was demonstrated by its higher R2 values and close match between the experimental and calculated adsorption values. According to the results, the inter-phase movement of mass was found to decrease with an increase in concentration.28
Table 9 Parameters of the Thomas model for BF adsorption using CuFe2O4/EB
| Dye conc. (inlet) (mg L−1) |
Bed height (cm) |
Flow rate (mL min−1) |
K
TH (mL min−1) × 103 |
q
e cal (mg g−1) |
q
e exp (mg g−1) |
R
2
|
| 15 |
3 |
1.8 |
0.0003 ± 0.0001 |
7.37 |
6.34 ± 0.32 |
0.982 |
| 20 |
1 |
1.8 |
0.0004 ± 0.0001 |
8.21 |
7.53 ± 0.42 |
0.963 |
| 20 |
2 |
1.8 |
0.0003 ± 0.0002 |
7.97 |
7.89 ± 0.35 |
0.972 |
| 20 |
3 |
1.8 |
0.0003 ± 0.0001 |
8.82 |
8.44 ± 0.22 |
0.989 |
| 25 |
3 |
1.8 |
0.0002 ± 0.0003 |
9.21 |
8.93 ± 0.28 |
0.994 |
3.12.2.2 Bed-depth service time (BDST) model.
To illustrate the parameters of the column study, including flow rate, adsorption capacities, and initial BF concentration, the BDST model examined the link between the service time and the bed-depth.81 The maximum period a test adsorbent needs for the elimination of pollutant from the aqueous media before regeneration is done can be termed the service time (t). It can also be described as the period until the column bed reaches the breakthrough point. Using eqn (30)82 in its linear version, the performance level of the adsorbent at different breakthrough values was measured.| |  | (30) |
where N0 represents the biosorption capacity, U the linear velocity, Z (cm) signifies the bed height, Ka demonstrates the BDST rate constant, C0 symbolizes the initial BF concentration, and Cb signifies the BF concentration at the breakthrough point. According to the slope and intercept of the plot drawn employing eqn (30), the values of all the parameters of the BDST model were calculated and provided in Table 10.| |  | (32) |
| |  | (33) |
Table 10 Parameters of the BDST model for BF adsorption using CuFe2O4/EB
|
C
t
/C0 |
A
|
B
|
K
a (L mg−1 min−1) × 104 |
N
0 (mg L−1) × 10−4 |
R
2
|
| 0.2 |
85 |
−44.53 |
0.00079 ± 0.0002 |
2143 ± 1.2 |
0.994 |
| 0.4 |
130 |
−6.77 |
0.00195 ± 0.0001 |
2797 ± 1.5 |
0.998 |
| 0.6 |
150 |
35 |
0.00033 ± 0.0002 |
3554 ± 1.7 |
0.998 |
The best fit of the BDST model to the experimental data was shown by its higher R2 values.
3.13 Antibacterial potential
The EB-based composites could display multiple functional characteristics featuring optical attributes and biological response. Similarly, treating the effluents with both colorants and microbial species may be considered. Using the agar well diffusion method, the antibacterial activity of EB biomass and CuFe2O4/EB and PPY/GO/EB composites was assessed to treat E. coli (Gram-negative bacterium) and S. aureus (Gram-positive bacterium). According to the results shown in Table 11, the native EB biomass had the lowest antibacterial activity (6 ± 2 mm for E. coli; 4 ± 1 mm for S. aureus), while CuFe2O4/EB had the greatest (12 ± 2 mm for E. coli; 8 ± 2 mm for S. aureus), followed by the PPY/GO/EB composite (10 ± 2 mm for E. coli; 7 ± 1 mm for S. aureus). The zone of inhibition of all three adsorbents varied significantly (P < 0.05), with CuFe2O4/EB exhibiting the best performance. The existence of metal oxides and the conductive polymeric components, which increase the release of metal ions, electrostatic interactions, oxidative effects, and damage to the cell membranes of bacteria, could be responsible for the enhanced antibacterial activity of the composites. Among the tested strains, S. aureus showed comparatively lower susceptibility, whereas E. coli showed a larger zone of inhibition, suggesting its higher susceptibility. The cell wall differences and variations in resistance mechanisms may be the cause of this discrepancy in the growth inhibition of the two strains.83 Antibacterial action occurs when composite materials bind to the bacterial cell membrane, which contains sulfur and phosphorus. Due to their high aspect ratio, these composites exhibit rapid penetration of the bacterial membranes. The fast penetration ability of antimicrobial agents damages the cellular structure and results in cell organelle leakage. CuFe2O4/EB and PPY/GO/EB activate redox reactions through ROS production, which causes the cellular components to be damaged by oxidative stress.84 These findings indicate that the EB-based composites have promising antibacterial potential, making them solid contenders for use in biomedical and water purification applications.
Table 11 Antibacterial activity in terms of the zone of inhibition of the prepared materials
| Sample type |
Bacteria type |
Inhibition zone (mm) |
| EB |
E. coli
|
6 ± 2 |
|
S. aureus
|
4 ± 1 |
|
|
| CuFe2O4/EB |
E. coli
|
12 ± 2 |
|
S. aureus
|
8 ± 2 |
|
|
| PPY/GO/EB |
E. coli
|
10 ± 2 |
|
S. aureus
|
7 ± 1 |
3.14 Toxicity profiling
Toxicity studies are aimed at demonstrating the effectiveness of the adsorption process in eliminating the adverse impacts of dyes on biological systems. Environmental remediation requires detoxification processes to make treated effluents safe before natural water discharge, thus decreasing the ecological damage.11 This study measured dye detoxification through CFU analysis (Fig. 11G). A reference point was established for measuring the control culture cell viability at 100% (Fig. 11G(a)). The BF solution in aqueous media (10 ppm) demonstrated a cell survival rate of 18.44% ± 1.1% against E. coli and 20.27% ± 1.3% against S. aureus test cultures (Fig. 11G(b)). The cell viability reached 96.35% ± 1.5% and 94.44% ± 1.4% when testing the CuFe2O4/EB composite-treated dye media (Fig. 11G(c)). The experimental results showed that treatment of the BF solution with the EB-based composites effectively produced detoxified solution media. The cell viability differences among the three adsorbents were statistically significant (P < 0.05), suggesting the lowest toxicity of the CuFe2O4/EB composite-treated wastewater sample.
4. Conclusions
In this study, CuFe2O4/EB and PPY/GO/EB composites derived from Eucalyptus bark biomass were synthesized through the co-precipitation method to improve the adsorption capacity of native EB biomass. The successful integration of CuFe2O4 with EB and the incorporation of PPY and GO in EB were confirmed by FTIR analysis. The SEM analysis showed a more porous and rougher surface morphology of the CuFe2O4/EB and PPY/GO/EB composites compared to the native EB. The elemental distribution and successful composite formation were confirmed by EDX analysis. Among EB, PPY/GO/EB, and CuFe2O4/EB, the highest thermal stability was shown by the CuFe2O4/EB composite in the TGA analysis. During the batch adsorption experiments, the prepared composites exhibited superior adsorption capabilities for BF dye, with CuFe2O4/EB showing the highest adsorption of 9.64 ± 0.33 mg g−1. The experimental data from the batch studies were analyzed using kinetic, equilibrium, and thermodynamic models. The Langmuir isotherm and pseudo-second-order kinetic models provided the best fit, indicating that monolayer adsorption and chemisorption played a dominant role, respectively. In the thermodynamic study, the negative ΔG and ΔH values demonstrated the spontaneous, feasible and exothermic nature of the adsorption process. The desorption tests demonstrated that 95.21% ± 1.5% (CuFe2O4/EB) and 91.43% ± 1.4% (PPY/GO/EB) of BF were easily desorbed at a low eluting agent concentration (0.1 N), indicating the capacity of the biosorbents to be regenerated. In the case of industrial applications, fixed-bed column studies were also carried out with CuFe2O4/EB, which showed the adsorption capacity of 8.93 ± 0.28 mg g−1 at 25 mg L−1. The actual breakthrough curve was found to be near the anticipated curve, which proved the higher adsorption capacity of CuFe2O4/EB against BF dissolved in wastewater. The limitations of this study included that all the experiments were carried out under particular laboratory conditions, which may not accurately represent real-world conditions. Moreover, this study focused on BF dye, while industrial effluents frequently include a combination of pollutants, which may react competitively throughout adsorption. Thus, the current study suggests that the CuFe2O4/EB and PPY/GO/EB composites can serve as effective adsorbents for the treatment of real industrial effluents in multi-component systems in the future.
Author contributions
M. Ahsan Rashid: investigation, and writing – original draft. Haq N. Bhatti: conceptualization, supervision, and project administration. Sidra Perveen: data curation. Fatimah M. Alzahrani: resources and formal analysis. Mahwish Iqbal: methodology and software. Munawar Iqbal: writing – review & editing, visualization, and validation.
Conflicts of interest
There are no conflicts of interest to declare.
Nomenclature, subscripts, and acronyms
Nomenclature
|
q
e
| Equilibrium adsorption capacity (mg g−1) |
|
q
t
| Adsorption capacity at time ‘t’ (mg g−1) |
|
C
e
| Equilibrium concentration of dye (mg L−1) |
|
C
0
| Initial concentration of dye (mg L−1) |
|
V
| Dye solution volume (L) |
|
W
| Weight of adsorbent (g) |
|
q
m
| Maximum adsorption capacity (mg g−1) |
|
k
1 and k2 | Kinetic rate constants |
|
t
| Time (min) |
|
k
pi
| Intraparticle diffusion rate constant |
|
K
L
| Langmuir constant |
|
R
L
| Separation factor |
|
k
f
| Freundlich constant |
|
R
2
| Correlation coefficient |
|
RT
| Product of general gas constant (J mol−1 K−1) and temperature (K) |
|
B
| Heat of adsorption constant |
|
b
| Temkin's constant |

| Polanyi potential (J mol−1) |
|
β
|
D–R constant |
| ΔG, ΔH, and ΔS | Free energy (kJ mol−1), enthalpy (kJ mol−1), and entropy change (kJ mol−1 K−1), respectively |
|
K
TH
| Thomas model rate constant |
|
K
a
| BDST rate constant |
Subscripts
| e | Equilibrium |
|
t
| At time ‘t’ |
| o | Initial |
| m | Maximum |
| pi | Intraparticle |
| f | Freundlich |
| TH | Thomas |
Acronyms
| CuFe2O4 | Copper ferrite |
| EB |
Eucalyptus bark |
| PPY | Equilibrium concentration of dye (mg L−1) |
| GO | Initial concentration of dye (mg L−1) |
| BF | Dye solution volume (L) |
| FTIR | Weight of adsorbent (g) |
| SEM | Maximum adsorption capacity (mg g−1) |
| EDX | Kinetic rate constants |
| TGA | Time (min) |
| UV-VIS | Intraparticle diffusion rate constant |
| Wc | Langmuir constant |
| CFU | Separation factor |
|
χ
2
| Chi-square test error function |
| RMSE | Root mean square error |
| ERRSQ | Error sum of squares |
| EABS | Sum of absolute errors |
| ARE | Average relative error |
| HYBRID | Hybrid error function |
| MPSD | Marquardt's percent standard deviation |
Data availability
The data used to support the findings of this study are available from the corresponding author upon request.
Acknowledgements
The authors express their gratitude to the Princess Nourah bint Abdulrahman University Researchers Supporting Project number (PNURSP2025R42), Princess Nourah bint Abdulrahman University, Riyadh, Saudi Arabia. We also thank the reviewers for their insightful comments and constructive suggestions, which greatly contributed to the improvement of the paper's content.
References
- P. Sethi, S. Barman and S. Basu, Strategic tuning of GO ratios in CuBTC-GO nanocomposites for next-generation tetracycline adsorption: A deep dive into isotherms, kinetics, and thermodynamics, Sep. Purif. Technol., 2025, 361, 131311 CrossRef CAS.
- A. Saravanan,
et al., Effective water/wastewater treatment methodologies for toxic pollutants removal: Processes and applications towards sustainable development, Chemosphere, 2021, 280, 130595 CrossRef CAS.
- M. Iqbal, H. N. Bhatti, S. Noreen and S. Shukrullah, Microwave plasma processing of Ag2Zr4 nanospheres@GO composite: A novel approach of improving structural and photocatalytic properties, Diamond Relat. Mater., 2024, 146, 111218, DOI:10.1016/j.diamond.2024.111218.
- B. Garg, P. Sethi and S. Basu, Strategic innovation in CuBTC/PANI nanocomposites for dye remediation: a holistic approach for enhancing adsorption, isotherms, and kinetic studies, RSC Sustainability, 2025, 3, 2311–2324 RSC.
- D. N. Shetty, V. A. Lobo, S. Rani and N. Raghavendra, Tectona Grandis seed powder and Mangifera Indica leaf powder as bio adsorbents for removal of methylene blue from aqueous solution, Hybrid Adv., 2024, 7, 100316, DOI:10.1016/j.hybadv.2024.100316.
- F. H. S. Radha, D. M. S. Shwan and S. Kaufhold, Adsorption Study and Removal of Basic Fuchsin Dye from Medical Laboratory Wastewater Using Local Natural Clay, Adsorpt. Sci. Technol., 2023, 2023, 9398167, DOI:10.1155/2023/9398167.
- S. S. Kushare, V. D. Bobade, D. R. Tope and A. V. Borhade, CoCr2O4@ GeO2@ ZnO core-shell nanoparticle as a novel recoverable catalyst: Preparation, characterization and photocatalytic degradation of basic fuchsin dye, J. Indian Chem. Soc., 2021, 98(12), 100239 CrossRef CAS.
- M. C. Benalia, L. Youcef, M. G. Bouaziz, S. Achour and H. Menasra, Removal of Heavy Metals from Industrial Wastewater by Chemical Precipitation: Mechanisms and Sludge Characterization, Arabian J. Sci. Eng., 2022, 47(5), 5587–5599, DOI:10.1007/s13369-021-05525-7.
- N. Sqalli Houssini, E. Elqars, A. Fadili and A. H. Essadki, Removal of textile pollutants by electrocoagulation using all bipolar and monopolar connection mode of iron and aluminum composite electrodes, Int. J. Environ. Sci. Technol., 2024, 21(6), 5759–5776, DOI:10.1007/s13762-023-05398-3.
- K. Chen,
et al., Selective extraction of anionic and cationic dyes using tailored hydrophobic deep eutectic solvents, Talanta, 2024, 268, 125312, DOI:10.1016/j.talanta.2023.125312.
- M. Iqbal, M. A. Rashid, R. Fatima, M. Iqbal and H. N. Bhatti, Exploring the impact of cold plasma-induced surface oxygen vacancies on charge carrier dynamics in Z-scheme CoMoO6/ZrO2/GO heterojunction for efficiency improvement in photocatalysis, J. Water Process Eng., 2025, 71, 107227, DOI:10.1016/j.jwpe.2025.107227.
- R. R. Gonzales,
et al., Treatment of high-strength wastewater with coupled flocculation and membrane filtration prior to ammoniacal nitrogen enrichment by osmotically assisted reverse osmosis, Sep. Purif. Technol., 2025, 352, 128159, DOI:10.1016/j.seppur.2024.128159.
- A. Jabeen and H. N. Bhatti, Adsorptive removal of reactive green 5 (RG-5) and direct yellow 50 (DY-50) from simulated wastewater by Mangifera indica seed shell and its magnetic composite: Batch and Column study, Environ. Technol. Innovation, 2021, 23, 101685 CrossRef CAS.
- B. M. Thamer, F. A. Al-aizari, H. S. Abdo and A. M. Al-Enizi, Activated carbon-decorated electrospun polystyrene fibers for highly efficient removal of hazardous crystal violet dye from water, Colloids Surf., A, 2024, 688, 133612, DOI:10.1016/j.colsurfa.2024.133612.
- T. D. Pham,
et al., Adsorptive removal of anionic azo dye new coccine using silica and silica-gel with surface modification by polycation, Polymers, 2021, 13(10), 1536, DOI:10.3390/polym13101536.
- M. Rakanović,
et al., Zeolites as Adsorbents and Photocatalysts for Removal of Dyes from the Aqueous Environment, Molecules, 2022, 27(19), 6582, DOI:10.3390/molecules27196582.
- F. Deng,
et al., Adsorption and Removal of Industrial Dyes by Water-Stabilized Aluminum-Based Metal-Organic Frameworks, ACS Appl. Nano Mater., 2023, 6(10), 8675–8684, DOI:10.1021/acsanm.3c01031.
- N. S. M. Sayed, A. S. A. Ahmed, M. H. Abdallah and G. A. Gouda, ZnO@ activated carbon derived from wood sawdust as adsorbent for removal of methyl red and methyl orange from aqueous solutions, Sci. Rep., 2024, 14(1), 5384, DOI:10.1038/s41598-024-55158-7.
- H. Liu,
et al., Agricultural biomass/waste-based materials could be a potential adsorption-type remediation contributor to environmental pollution induced by pesticides-A critical review, Sci. Total Environ., 2024, 946, 174180, DOI:10.1016/j.scitotenv.2024.174180.
- F. Younas,
et al., A critical review on the separation of heavy metal(loid)s from the contaminated water using various agricultural wastes, Int. J. Phytorem., 2024, 26(3), 349–368, DOI:10.1080/15226514.2023.2242973.
- P. Yang,
et al., Effective removal of methylene blue and crystal violet by low-cost biomass derived from eucalyptus: Characterization, experiments, and mechanism investigation, Environ. Technol. Innovation, 2024, 33, 103459, DOI:10.1016/j.eti.2023.103459.
- L. Zafar, A. Khan, U. Kamran, S. J. Park and H. N. Bhatti, Eucalyptus (camaldulensis) bark-based composites for efficient Basic Blue 41 dye biosorption from aqueous stream: Kinetics, isothermal, and thermodynamic studies, Surf. Interfaces, 2022, 31, 101897, DOI:10.1016/j.surfin.2022.101897.
- D. Zala and A. Ray, Synthetically modified mixed phase inverse spinel CuFe2O4 magnetic nanoparticles: Structure, physical, and electrochemical properties for photocatalytic applications, Phys. B, 2025, 699, 416770, DOI:10.1016/j.physb.2024.416770.
- B. Saha, A. Debnath and B. Saha, Polypyrrole-encapsulated metal oxide nanocomposite for adsorptive abatement of anionic dye from dye laden wastewater: Cost analysis and scale up design, Mater. Today Commun., 2024, 39, 109061, DOI:10.1016/j.mtcomm.2024.109061.
- M. Iqbal,
et al., Graphene oxide nanocomposite with CuSe and photocatalytic removal of methyl green dye under visible light irradiation, Diamond Relat. Mater., 2021, 113, 108254, DOI:10.1016/j.diamond.2021.108254.
- H. Shahid,
et al., Fe2O3/polypyrrole/peanut husk composite for the adsorptive removal of basic blue 41 from the aqueous medium: Kinetics, equilibrium modeling and thermodynamic studies, J. Indian Chem. Soc., 2025, 102(1), 101500 CrossRef CAS.
- W. S. Hummers and R. E. Offeman, Preparation of Graphitic Oxide, J. Am. Chem. Soc., 1958, 80(6), 1339, DOI:10.1021/ja01539a017.
- A. Jabeen, H. N. Bhatti, S. Noreen and A. Gaffar, Adsorptive removal of 2, 4, 6-trichloro-phenol from wastewater by mango seed shell and its magnetic composites: batch and column study, Int. J. Environ. Anal. Chem., 2023, 103(17), 5639–5659, DOI:10.1080/03067319.2021.1941916.
- V. Jeevanantham, D. Tamilselvi, S. R. Bavaji and S. Mohan, Green formulation of gold nanoparticles and their antioxidative assays, antimicrobial activity and photocatalytic colour decay, Bull. Mater. Sci., 2023, 46(1), 32, DOI:10.1007/s12034-022-02868-1.
- M. Abdi, M. Balagabri, H. Karimi, H. Hossini and S. O. Rastegar, Degradation of crystal violet (CV) from aqueous solutions using ozone, peroxone, electroperoxone, and electrolysis processes: a comparison study, Appl. Water Sci., 2020, 10(7), 1–10, DOI:10.1007/s13201-020-01252-w.
- M. Z. Alam, M. N. Bari and S. Kawsari, Statistical optimization of Methylene Blue dye removal from a synthetic textile wastewater using indigenous adsorbents, Environ. Sustainability Indic., 2022, 14, 100176 CrossRef.
- M. A. Busharat,
et al., Effect of Nonthermal Plasma on Cation Distribution and Photocatalytic Activity of MgFe2O4Nanoparticles for Dye Degradation Application, Int. J. Chem. Eng., 2024, 2024(1), 8059559, DOI:10.1155/2024/8059559.
- M. Z. Xiao,
et al., Structural characterization of lignin in heartwood, sapwood, and bark of eucalyptus, Int. J. Biol. Macromol., 2019, 138, 519–527, DOI:10.1016/j.ijbiomac.2019.07.137.
- T. Raja and Y. Devarajan, Analysis of the properties of a novel natural fibre extracted from pumpkin plant stalks: A sustainable alternative for lightweight applications, Mater. Lett., 2024, 357, 135748, DOI:10.1016/j.matlet.2023.135748.
- J. Gominho, A. Habrant, R. A. Costa, B. Chabbert and A. Lourenço, Unlocking the potential of undervalued forest residues: a comprehensive characterization of eucalypt stump in the biorefinery context, Wood Sci. Technol., 2025, 59(2), 33, DOI:10.1007/s00226-025-01640-y.
- E. M. Mostafa and R. E. Hammam, Tailored solar collector coatings: Synthesis and characterization of CuFe2O4/PANI nanocomposites, Opt. Mater., 2024, 156, 115879, DOI:10.1016/j.optmat.2024.115879.
- T. Shu,
et al., Unidirectional freezing robust PPy@GO-SA aerogel for stable and efficient solar desalination, Desalination, 2025, 593, 118208, DOI:10.1016/j.desal.2024.118208.
- N. Ullah,
et al., Assessing the influence of eucalyptus bark ash and willow wood ash on the physical, mechanical, and microstructural properties of portland cement pastes and mortars, Innovative Infrastruct. Solutions, 2025, 10(2), 68 CrossRef.
- W. A. Shaikh,
et al., Removal of toxic dye from dye-laden wastewater using a new nanocomposite material: Isotherm, kinetics and adsorption mechanism, Chemosphere, 2022, 308, 136413 CrossRef CAS.
- P. Sethi, S. Basu and S. Barman, Innovative CuBTC/gC3N4 materials for tetracycline mitigation: adsorption, photocatalysis, and mechanistic perspectives, New J. Chem., 2025, 49, 8454–8471 RSC.
- M. Iqbal, H. N. Bhatti, S. Noreen and S. Shukrullah, Surface modification of heterostructured Bi8W4O24/ZrO2@GO composite via low-pressure cold plasma for boosting photocatalytic potential against Basic fuchsin and Bismarck brown Y dyes, Environ. Sci. Pollut. Res., 2024, 1–31, DOI:10.1007/s11356-024-35541-7.
- N. Caponi,
et al., Adsorption of basic fuchsin using soybean straw hydrolyzed by subcritical water, Environ. Sci. Pollut. Res., 2022, 1–8 Search PubMed.
- M. A. Ben Aissa,
et al., Yttrium oxide-doped ZnO for effective adsorption of basic fuchsin dye: equilibrium, kinetics, and mechanism studies, Int. J. Environ. Sci. Technol., 2022, 19(10), 9901–9914, DOI:10.1007/s13762-021-03816-y.
- X. Yang,
et al., Highly effective removal of basic fuchsin from aqueous solutions by anionic polyacrylamide/graphene oxide aerogels, J. Colloid Interface Sci., 2015, 453, 107–114 Search PubMed.
- W. Bessashia, Y. Berredjem, Z. Hattab and M. Bououdina, Removal of Basic Fuchsin from water by using mussel powdered eggshell membrane as novel bioadsorbent: Equilibrium, kinetics, and thermodynamic studies, Environ. Res., 2020, 186, 109484 CrossRef CAS.
- M. A. Tahir, H. N. Bhatti and M. Iqbal, Solar Red and Brittle Blue direct dyes adsorption onto Eucalyptus angophoroides bark: Equilibrium, kinetics and thermodynamic studies, J. Environ. Chem. Eng., 2016, 4(2), 2431–2439 CrossRef.
- S. Singh, A. Kumar and H. Gupta, Activated banana peel carbon: a potential adsorbent for Rhodamine B decontamination from aqueous system, Appl. Water Sci., 2020, 10(8), 1–8 Search PubMed.
- S. Sultana,
et al., Adsorption of crystal violet dye by coconut husk powder: isotherm, kinetics and thermodynamics perspectives, Environ. Nanotechnol., Monit. Manage., 2022, 17, 100651 CAS.
- L. A. Zambrano-Intriago, M. L. Gorozabel-Mendoza, A. Cordova Mosquera, M. H. Delgado-Demera, M. M. M. B. Duarte and J. M. Rodríguez-Díaz, Kinetics, equilibrium, and thermodynamics of the blue 19 dye adsorption process using residual biomass attained from rice cultivation, Biomass Convers. Biorefin., 2022, 12(9), 3843–3855 CrossRef CAS.
- Z. H. Abd Al-khuder and F. F. Karam, Synthesis and characterization of a quaternary composite based on RGO/MWCNTs/choline chloride+ malonic acid for methyl orange dye adsorption, Results Chem., 2025, 15, 102133 CrossRef.
- A. Öztürk and E. Malkoc, Adsorptive potential of cationic Basic Yellow 2 (BY2) dye onto natural untreated clay (NUC) from aqueous phase: mass transfer analysis, kinetic and equilibrium profile, Appl. Surf. Sci., 2014, 299, 105–115 CrossRef.
- E. Darma Ramadhani and D. Kurniawati, Effect of Contact Time and Agitation Speed on the Adsorption Process of Methylene Blue Dyes Using Longan Shell (Euphoria longan L.) as Biosorbent, Am. J. Sci. Eng. Res., 2021, 4(6), 2021 Search PubMed , [Online]. Available: https://www.iarjournals.com.
- H. N. Bhatti,
et al., Erratum: Enhanced adsorption of Foron Black RD 3GRN dye onto sugarcane bagasse biomass and Na-alginate composite* (Desalination and Water Treatment (2021) 216 (423–435), (S1944398624092658), (10.5004/dwt.2021.26893)), Desalin. Water Treat., 2021, 218, 456, DOI:10.5004/dwt.2021.27278.
- A. A. Siyal, M. R. Shamsuddin, A. Low and N. E. Rabat, A review on recent developments in the adsorption of surfactants from wastewater, J. Environ. Manage., 2020, 254, 109797 CrossRef CAS.
- J. Nath,
et al., Chitosan-based adsorbents for remediation of toxic dyes from wastewater: A review on adsorption mechanism, reusability, machine learning based modeling and future perspectives, Int. J. Biol. Macromol., 2025, 143388 CrossRef CAS.
- Y. Hui, R. Liu, J. Lan, T. Sun and A. Xu, Recyclable chitosan adsorbent: Facile functionalization strategy, excellent removal capacity of dyes and adsorption mechanism, Chemosphere, 2024, 359, 142291 CrossRef CAS.
- M. Iqbal,
et al., Utilization of Mangifera indica leaves powder as a cost-effective adsorbent for the removal of eosin yellow from wastewater, Desalin. Water
Treat., 2023, 306, 236–244, DOI:10.5004/dwt.2023.29843.
-
L. SK, About the Theory of So-called Adsorption of Soluble Substances, Sven. Vetenskapsakad. Handingarl., vol. 24, no. NII Article ID10016440244, pp. 1–39, 1898 Search PubMed.
- Y. Chauhdary,
et al., Effective removal of reactive and direct dyes from colored wastewater using low-cost novel bentonite nanocomposites, Water, 2022, 14(22), 3604 CrossRef CAS.
- Y. S. Ho and G. McKay, Pseudo-second order model for sorption processes, Process Biochem., 1999, 34(5), 451–465, DOI:10.1016/S0032-9592(98)00112-5.
- W. J. Weber Jr and J. C. Morris, Kinetics of adsorption on carbon from solution, J. Sanit. Eng. Div., 1963, 89(2), 31–59 CrossRef.
- P. Ganguly, R. Sarkhel and P. Das, Synthesis of pyrolyzed biochar and its application for dye removal: Batch, kinetic and isotherm with linear and non-linear mathematical analysis, Surf. Interfaces, 2020, 20, 100616 CrossRef CAS.
- I. Langmuir, The adsorption of gases on plane surfaces of glass, mica and platinum, J. Am. Chem. Soc., 1918, 40(9), 1361–1403 CrossRef CAS.
- G. K. Rajahmundry, C. Garlapati, P. S. Kumar, R. S. Alwi and D.-V. N. Vo, Statistical analysis of adsorption isotherm models and its appropriate selection, Chemosphere, 2021, 276, 130176 CrossRef CAS.
- H. M. F. Freundlich, Over the Adsorption in Solution, J. Phys. Chem., 1906, 57(385471), 385–471 CAS.
- M. A. Al-Ghouti and D. A. Da’ana, Guidelines for the use and interpretation of adsorption isotherm models: A review, J. Hazard. Mater., 2020, 393, 122383, DOI:10.1016/j.jhazmat.2020.122383.
- M. Musah, Y. Azeh, J. T. Mathew, M. T. Umar, Z. Abdulhamid and A. I. Muhammad, Adsorption kinetics and isotherm models: a review, Caliphate J. Sci. Technol., 2022, 4(1), 20–26 CrossRef.
- M. I. Temkin, Kinetics of ammonia synthesis on promoted iron catalysts, Acta Physiochim. URSS, 1940, 12, 327–356 CAS.
- M. Dubinin and L. Raduskhevich, Proceedings of the academy of sciences of the USSR, Phys. Chem., 1947, 55, 327–329 CAS.
- Y. Ge,
et al., One-step synthesis of a core-shell structured biochar using algae (Chlorella) powder and ferric sulfate for immobilizing Hg (II), J. Hazard. Mater., 2024, 469, 133991 CrossRef CAS.
- A. S. Mahmoud, N. Y. Mohamed, M. K. Mostafa and M. S. Mahmoud, Effective chromium adsorption from aqueous solutions and tannery wastewater using bimetallic Fe/Cu nanoparticles: response surface methodology and artificial neural network, Air, Soil Water Res., 2021, 14, 11786221211028162 CrossRef.
- I.-H. T. Kuete, D. R. T. Tchuifon, G. N. Ndifor-Angwafor, A. Kamdem Tamo and S. G. Anagho, Kinetic, isotherm and thermodynamic studies of the adsorption of thymol blue onto powdered activated carbons from garcinia cola nut shells impregnated with H3PO4 and KOH: Non-linear regression analysis, J. Encapsulation Adsorpt. Sci., 2020, 10(1), 1–27 CrossRef CAS.
- S. Hussain,
et al., Adsorption, kinetics and thermodynamics studies of methyl orange dye sequestration through chitosan composites films, Int. J. Biol. Macromol., 2021, 168, 383–394 CrossRef CAS.
- W. T. Sibhat,
et al., Effect of Ethiopian kaolin treatment on the performance of adsorptive removal of methylene blue dye, Results Chem., 2025, 13, 102027 CrossRef CAS.
- E. Rápó and S. Tonk, Factors affecting synthetic dye adsorption; desorption studies: a review of results from the last five years (2017–2021), Molecules, 2021, 26(17), 5419 CrossRef.
- H. Patel, Review on solvent desorption study from exhausted adsorbent, J. Saudi Chem. Soc., 2021, 25(8), 101302 Search PubMed.
- M. Maqbool,
et al., Sodium alginate and polypyrrole composites with algal dead biomass for the adsorption of Congo red dye: Kinetics, thermodynamics and desorption studies, Surf. Interfaces, 2021, 25, 101183 CrossRef CAS.
- N. Saha, L. Das, P. Das, A. Bhowal and C. Bhattacharjee, Comparative experimental and mathematical analysis on removal of dye using raw rice husk, rice husk charcoal and activated rice husk charcoal: batch, fixed-bed column, and mathematical modeling, Biomass Convers. Biorefin., 2023, 13(12), 11023–11040 CrossRef CAS.
- I. N. Iroh, O. C. Okeh, V. C. Igbokwe, F. N. Ezugworie, V. O. Onyema and C. O. Onwosi, Congo red removal from aqueous solution by a consortium of Aspergillus sp. immobilized on activated carbon in a packed bed column: Modelling of the breakthrough curves, Biorem. J., 2024, 1–19 Search PubMed.
- H. C. Thomas, Heterogeneous ion exchange in a flowing system, J. Am. Chem. Soc., 1944, 66(10), 1664–1666 CrossRef CAS.
- Z. Laggoun,
et al., Evaluation of the selectivity and modelling of breakthrough curves in fixed-bed bio-adsorption studies to remove DR 81 and CG-H3G textile dyes using cockle shells, Part. Sci. Technol., 2025, 1–14 Search PubMed.
- R. A. Hutchins, New method simplifies design of activated carbon systems, Chem. Eng., 1973, 80, 133–138 CAS.
- Z. N. Kayani, M. G. Ali, S. Waseem, Z. Bashir, S. Riaz and S. Naseem, Optimization of nanostructured Zr doped bismuth oxide (Bi2O4) thin films for physical and biological properties, Ceram. Int., 2024, 50(4), 6854–6869, DOI:10.1016/j.ceramint.2023.12.030.
- Y. M. Im, G. Palanisamy, S. Thangarasu, C. J. Raorane, S. C. Kim and T. H. Oh, Bi-functional activity of modified porous polysulfone membrane with Cu2O-GO nanostructures for ultrafiltration and organic pollutant degradation, J. Water Process Eng., 2024, 68, 106339, DOI:10.1016/j.jwpe.2024.106339.
|
| This journal is © The Royal Society of Chemistry 2025 |
Click here to see how this site uses Cookies. View our privacy policy here. 
 Open Access Article
 This Open Access Article is licensed under a Creative Commons Attribution-Non Commercial 3.0 Unported Licence
 *c
*c


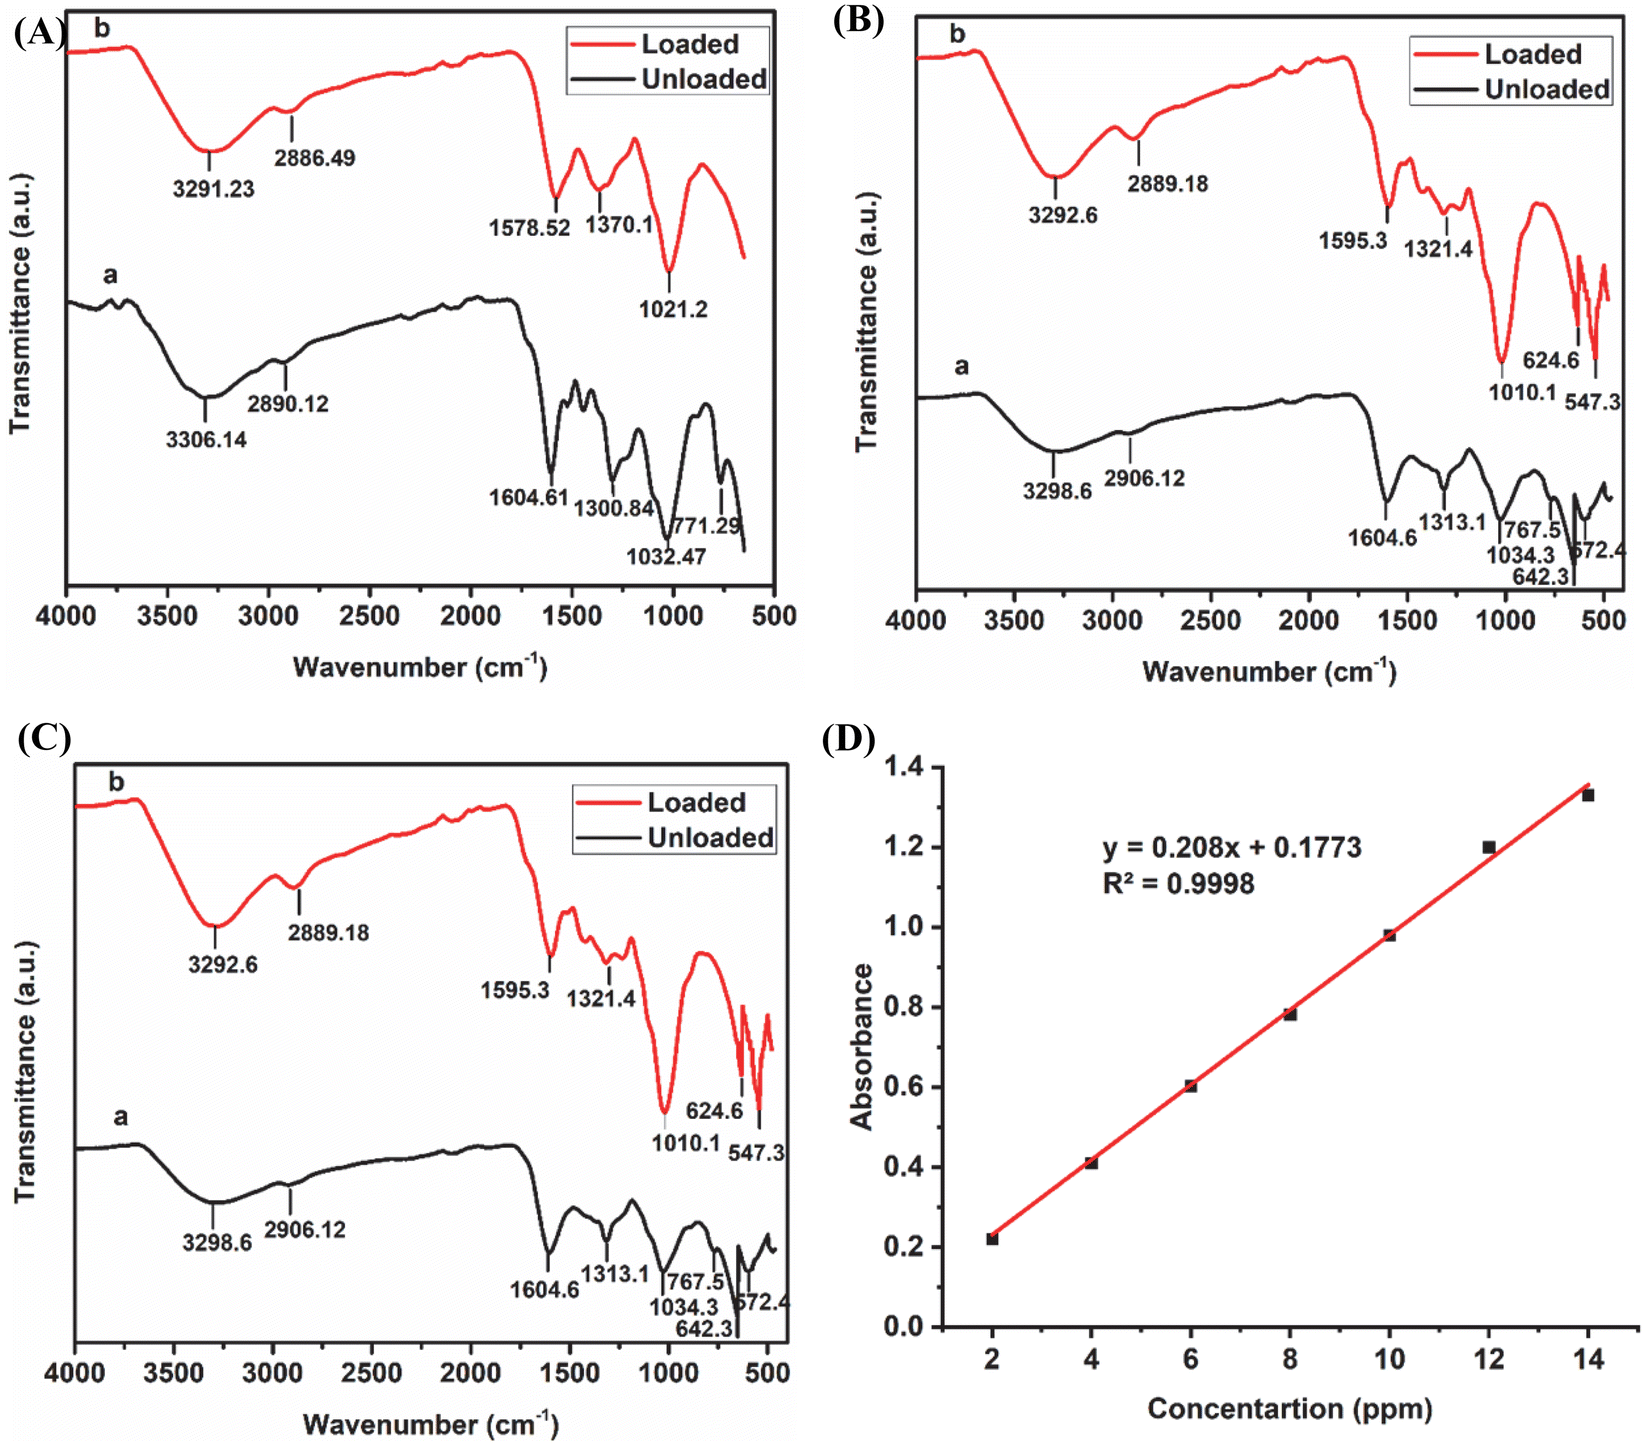


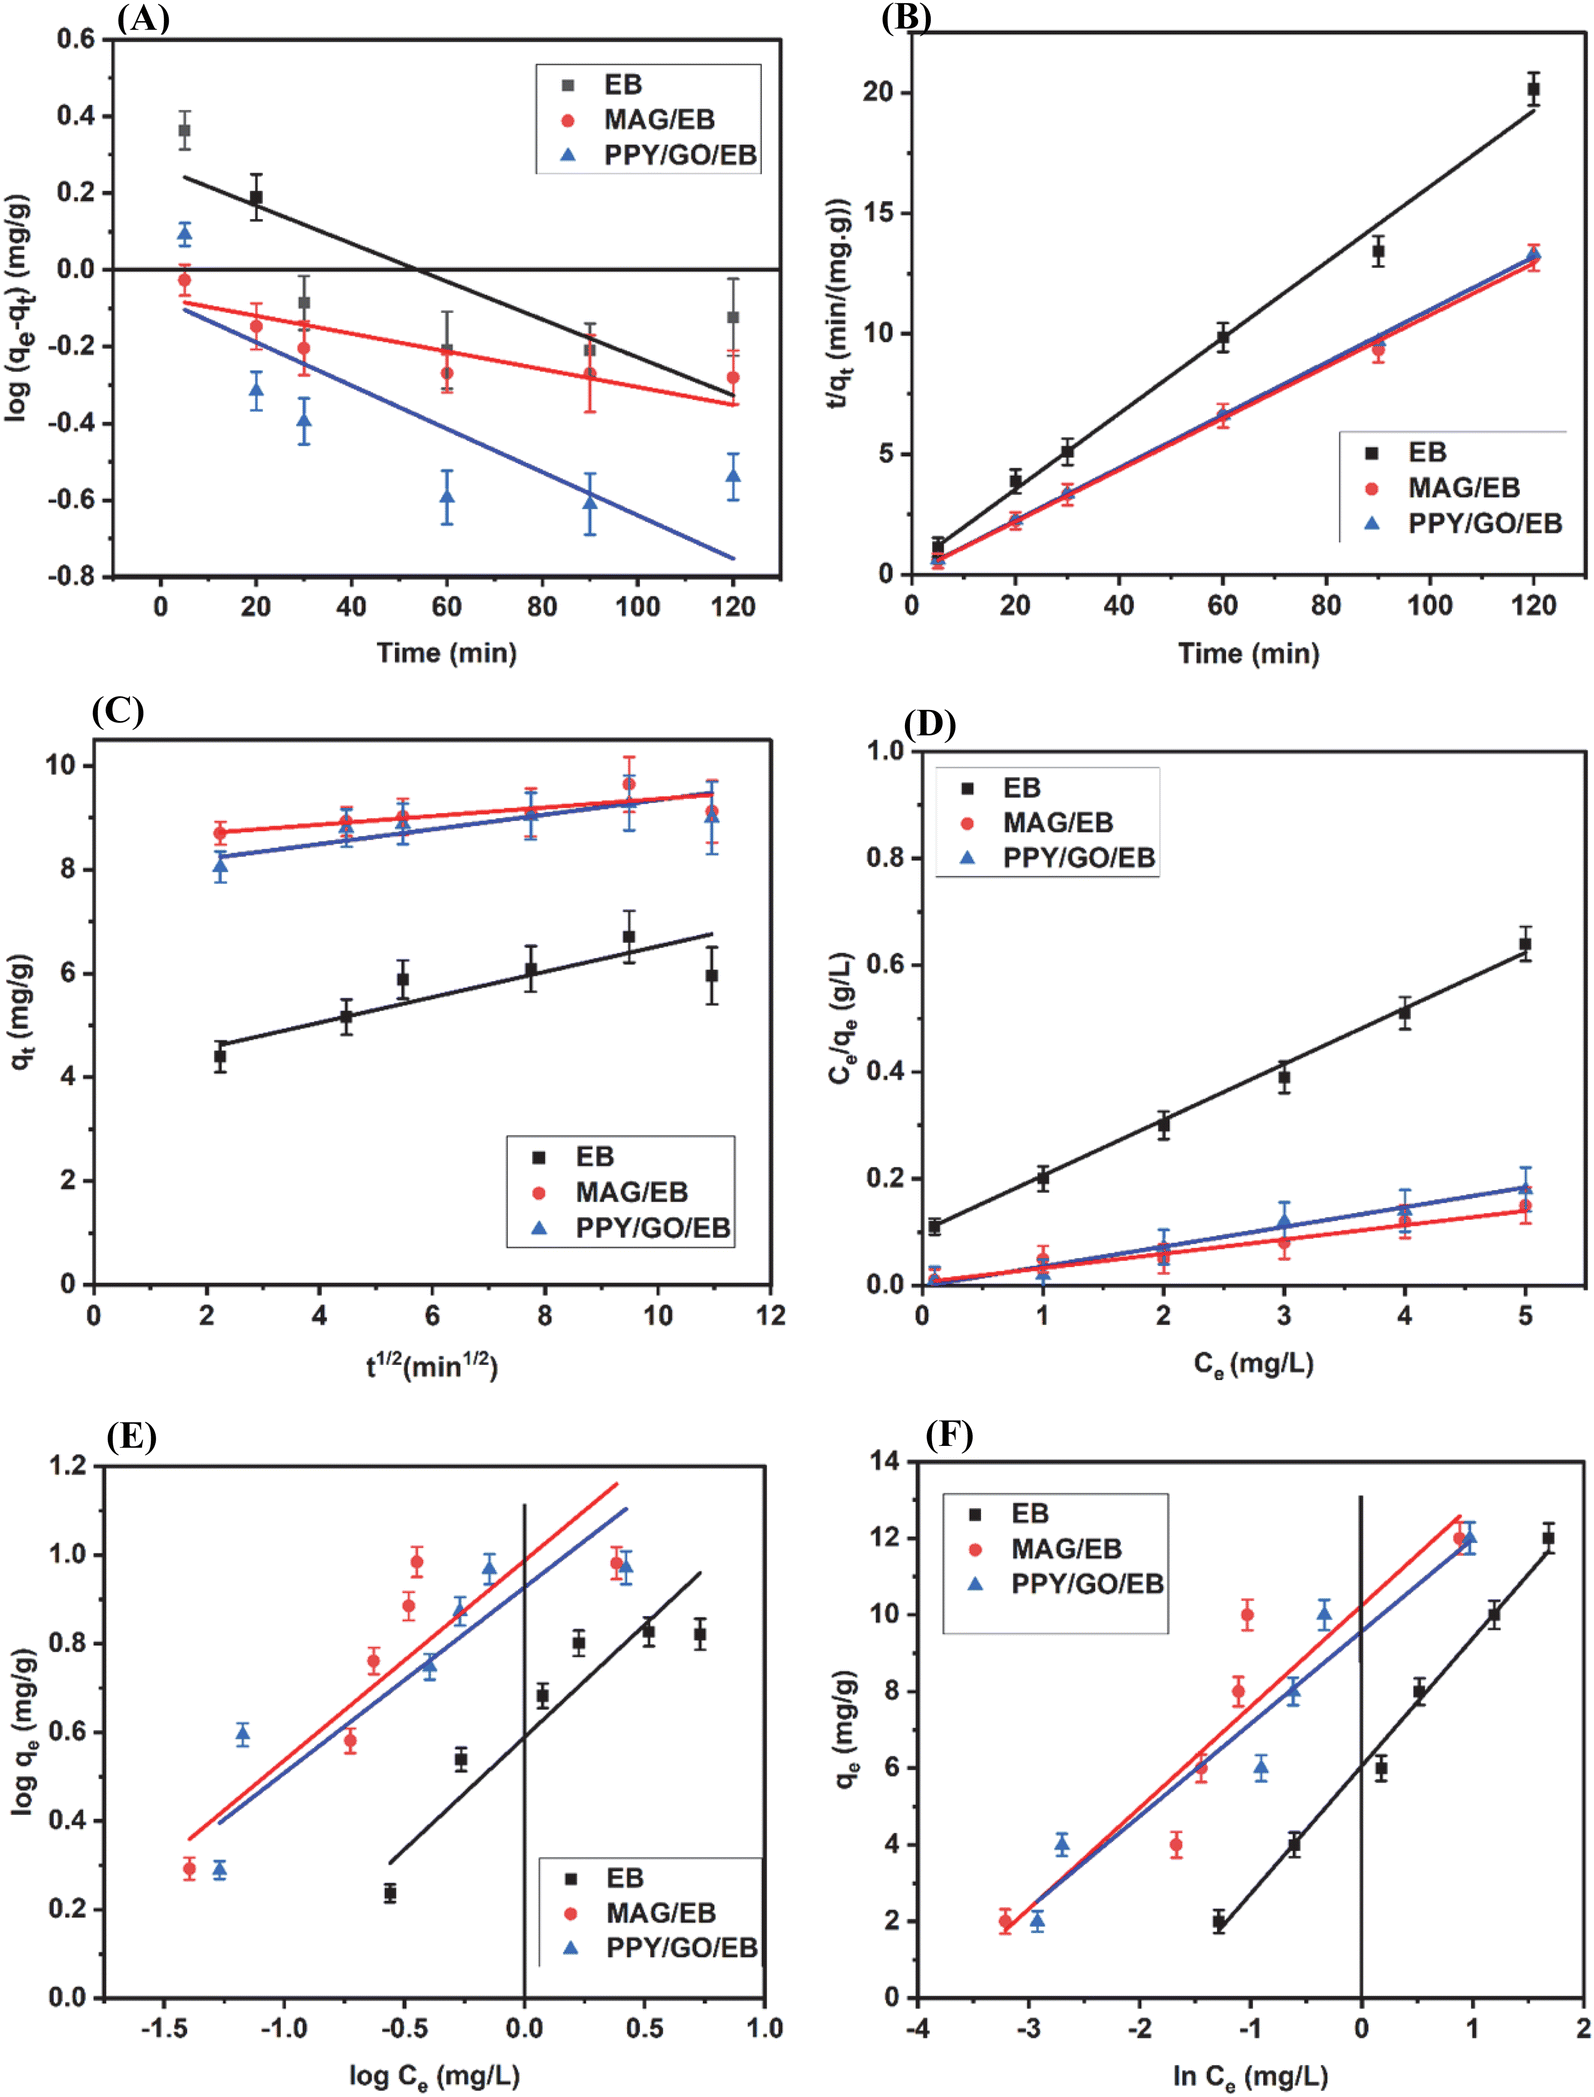
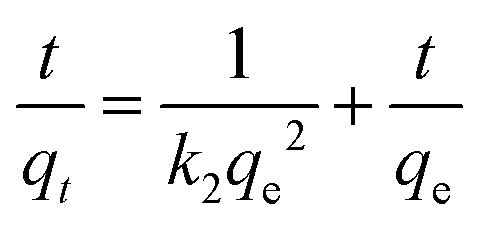
 (Fig. 9B). Given that the values of EB and its composites are very close to 1, this model was the best fit for the adsorption of BF on these adsorbents. The pseudo-second-order kinetic model demonstrated significantly stronger correlation (P < 0.05) with the adsorption data compared to the pseudo-first-order kinetic model, indicating that the adsorption process may be predominantly governed by chemisorption. Also, the experimental qe and theoretical qt values were detected to be close, i.e., there was a very small difference between the two, which also indicated the fitness of this model. The calculated kinetic parameters are presented in Table 2. These elucidated outcomes are consistent with the validated findings found in the literature.43