
 Open Access Article
 This Open Access Article is licensed under a Creative Commons Attribution-Non Commercial 3.0 Unported Licence
Effect of high filler loading on polymer/(reduced) graphene oxide nanocomposite coatings†
Bich Ngoc
Tran
a,
Yasemin
Fadil
 a,
Yin
Yao
b,
Vipul
Agarwal
*a and
Per B.
Zetterlund
*a
a,
Yin
Yao
b,
Vipul
Agarwal
*a and
Per B.
Zetterlund
*a
aCluster for Advanced Macromolecular Design (CAMD), School of Chemical Engineering, University of New South Wales, Sydney, NSW 2052, Australia. E-mail: agarwalvipul84@gmail.com; p.zetterlund@unsw.edu.au
bMark Wainwright Analytical Centre, University of New South Wales, Sydney, NSW 2052, Australia
First published on 3rd June 2025
Abstract
Synthesis of polymer/(reduced) graphene oxide (GO) nanocomposites based on copolymers of styrene/n-butyl acrylate and benzyl methacrylate/n-butyl acrylate at unusually high filler loadings of up to 45 wt% has been explored using aqueous emulsion-based approaches. Two approaches were investigated: (i) miniemulsion polymerization in the presence of GO, and (ii) physical mixing of aqueous GO with a polymer latex. Nanocomposite films were prepared from aqueous composite latexes at room temperature by drop casting, with conversion of GO to rGO via thermal treatment. The electrical conductivity reaches values of approximately 102 Sm−1 at high rGO contents in both systems, with higher values for physical mixing than miniemulsion at medium rGO loadings. The thermal conductivities increased with increasing rGO content with the highest values of approx. 0.4 W mK−1 – physical mixing systems gave higher thermal conductivities than miniemulsions. Increasing GO loading provided stronger but less flexible materials for both systems.
Introduction
Despite decades of research, polymer/graphene oxide (GO) nanocomposites continue to attract significant research and industry attention primarily driven by the versatility in application of these composites.1–6 One of the other reasons is the wide range of approaches developed to reduce GO in a composite to reduced graphene oxide (rGO) to restore the electrical conductivity, which is a pre-requisite in most applications.7,8 However, to manipulate the final properties of polymer/(r)GO composites, the primary methodology still relies on increasing the filler loading.9 To this end, melt mixing usually remains the approach of choice where a high glass transition polymer (Tg) is melted and mixed with varying amounts of GO/rGO in order to change final properties such as electrical conductivity and mechanical properties.4,10 In such composites, increasing the amount of filler typically leads to increased stacking of rGO sheets,4 which in turn requires a further increase in the filler loading to enhance for example the electrical conductivity.We have previously reported that in general, polymer/(r)GO composites prepared using emulsion-based nanocomposite synthesis techniques exhibit superior final properties (e.g. electrical conductivity) compared to melt mixing based composites.11 This could be due to the control over the arrangement and distribution of GO sheets within the nanocomposite when made into a coating, which can achieve percolation at significantly lower filler loadings.12,13 Furthermore, we have previously demonstrated that the electrical conductivity of nanocomposites synthesised using different emulsion-based nanocomposite techniques can be tuned by multiple orders of magnitude over a wide range of filler loadings.13 This extent of tuneability is traditionally unachievable in nanocomposites prepared by melt mixing and solution-based mixing approaches. However, exploring the upper limit of filler loading in emulsion-based nanocomposites remains challenging. To this end, several attempts have been reported in the literature, however despite using different emulsion-based approaches, studies have been limited to using surface functionalise GO and further employed compression moulding to prepare composite films,14–18 to the best of our knowledge. The reason for using functionalised GO has been to enhance the electrical conductivity of films. For example, Park et al.18 used 2-acrylamido-2-methyl-1-propanesulfonic acid (AMPS) modified rGO with concentrations from 5 to 30 wt% (relative to monomer) in miniemulsion polymerization of styrene and butyl acrylate ((St)/nBA) and compression moulded the obtained composite into sheets. They observed the highest electrical conductivity of 222 S m−1 at 20 wt% AMPS-rGO loading, while a further increase in the filler (AMPS-rGO) loading to 30 wt% lead to filler precipitation resulting in unreliable electrical conductivity measurements.
Given that nanocomposite films prepared using different emulsion-based synthesis strategies exhibit significantly different final properties, we set out to explore the upper limit of filler loading and if the difference in performance of coatings prepared using two different emulsion-based approaches remains at significant filler loading (5 to 50 wt%). In this systematic study, we investigated the impact of the emulsion-based synthesis methods miniemulsion and physical mixing on the final properties of polymer nanocomposite coatings with high filler loading (5–50 wt% relative to monomer). The copolymer was designed to undergo coating formation at ambient temperature. The colloidally stable nanocomposite latexes were dropcast to prepare coatings at ambient temperature and investigated for final electrical conductivity, mechanical properties and thermal conductivity.
Experimental
Materials
Styrene (St, Sigma Aldrich, 99%), benzyl methacrylate (BzMA, Sigma Aldrich, 99%) and n-butyl acrylate (nBA, Sigma Aldrich, 99%) were passed through a column of activated basic aluminium oxide (Ajax) to remove the inhibitor. Azobisisobutyronitrile (AIBN, Aldrich) was recrystallized in water. Hexadecane (HD, 99%, Sigma Aldrich) and sodium dodecyl sulfate (SDS, Ajax Finechem) were used as received. Graphene oxide (GO) (powder, 7 μm < size <28 μm) was purchased from Graphenea (Spain) and used as received. MilliQ water was used in all experiments.Miniemulsion polymerization
An aqueous GO dispersion was initially prepared by dispersing GO powder in 40 mL water. The amount of GO was calculated based on the miniemulsion recipe, in which the GO concentrations were 5, 10, 15, 20, 30 and 50 wt% relative to monomer (Table 1). The aqueous GO dispersion was subsequently ultrasonicated (Digital Sonifier, model 450, Branson) at 70% amplitude for 10 min. The organic phase was prepared in a separate vial comprising monomers (2.6 wt% rel. to the aqueous phase), HD (5 wt% rel. to monomer), AIBN (0.25 M rel. to monomer and HD) and SDS (3 wt% rel. to organic phase). The GO dispersion was then mixed with the organic phase, followed by magnetic stirring for 15 min before ultrasonication for 10 min. The obtained miniemulsion was subsequently degassed by nitrogen bubbling for 20 min. Polymerization was conducted in a sealed glass vial at 70 °C for 24 h under magnetic stirring. Miniemulsion polymerization of St/nBA was also conducted using the same procedure but without GO. Table 2 lists the recipe for P(St-stat-nBA) and P(St-stat-nBA)/GO fabricated via miniemulsion polymerization.| Exp | M0 | M1 | M2 | M3 | M4 | M5 | M6 |
|---|---|---|---|---|---|---|---|
| GO conc. in water (mg mL−1) | 0 | 1.3 | 2.6 | 3.9 | 5.3 | 7.9 | 13.1 |
Surfactant-free emulsion polymerization
Monomer (10 wt% rel. to the aqueous phase), KPS (0.25 M rel. to organic phase) and water (15 g) were added to a 25 mL glass vial. The resulting mixture was magnetically stirred for 30 min, followed by 20 min degassing with nitrogen. Polymerization was then carried out in a sealed vial at 70 °C for 6 h under magnetic stirring.Preparation of composite films using latex synthesized via miniemulsion polymerization
Composite films were prepared on two different substrates: (i) glass slide: drop-casting of 50 μL of latex onto a cleaned glass slide, followed by manual spreading into a square shape; (ii) silicon mould: drop-casting of 5 mL of latex into a 3 cm × 3 cm square-shaped silicone mould. The samples were left drying at ambient temperature until completely dried (normally 24 h for film on glass slide and a few days for film in silicone mould). The films on glass slide were subjected to electrical conductivity measurement, while the films on silicone mould were cut into 20 mm × 5 mm film stripes for mechanical and thermal measurements. The thickness of the films on glass slides ranged from 0.005 to 0.03 mm, whereas the film fabricated in silicone moulds were approximately 0.1 mm thick (same for the physical mixing systems below).Preparation of composite films via physical mixing
Prior to mixing, different amounts of GO powder (designed so that the final concentration of GO after mixing with polymer latex was 5, 10, 15, 20, 30 and 50 wt% relative to polymer) were used to prepare aqueous GO dispersions with the same concentrations as in Table 1, followed by ultrasonication at 70% amplitude for 10 min. Polymer latex (3 mL) prepared by surfactant-free emulsion polymerization was mixed with SDS (3 wt% rel. to polymer) and aqueous GO dispersion at different concentrations followed by magnetic stirring for 20 min. Films were prepared on glass slides and silicone moulds as described above.Thermal reduction of GO
Polymer/GO nanocomposite films prepared on glass slides for both miniemulsion and physical mixing systems were subjected to thermal treatment at 160 °C for 24 h to obtain polymer/rGO nanocomposite films.Dynamic light scattering (DLS)
The sizes of monomer droplets and polymer particles were measured using a Malvern ZetaSizer Nanoseries instrument with DTS software, operating a 4 mW He–Ne laser at 633 nm at a detector angle of 173° at 25 °C. For each measurement, a drop of the sample (∼200 μL) was diluted with MilliQ water (∼3 mL), and the results were obtained based on an average of three runs.Gravimetric analysis
To measure the monomer conversion after polymerization, gravimetric analysis was performed by weighing approximately 1.5 g of latex in a pre-weighed aluminium pan. Then, the pan was covered with perforated aluminium foil and placed in a vacuum oven at 35 °C for 24 h for evaporation of unreacted monomer and water. The overall monomer conversion was calculated based on the weight of the dry sample.Gel permeation chromatography (GPC)
Number-average (Mn) and weight-average (Mw) molecular weights and molecular weight distributions (MWD) of polymers were determined by GPC. The GPC system comprised a DGU-12A solvent degasser, an LC-10AT pump, a CTO-10A column oven, an ECR 7515-A refractive index detector, and a Polymer Laboratories 5.0 mm bead-size guard column (50 × 7.8 mm) followed by 300 × 7.8 mm linear Phenogel columns. The eluent was tetrahydrofuran (THF) at 40 °C at a flow rate of 1.0 mL min−1 with an injection volume of 100 μL. The system was calibrated against linear polystyrene standards ranging from 500 to 106 g mol−1. Samples were prepared by dissolving about 4 mg dried polymer in 2 mL of THF followed by centrifugation and filtration using a syringe filter (0.45 mm) to remove GO and impurities.Raman spectroscopy
Raman spectra were recorded using a Renishaw inVia Raman microscope equipped with an Ar laser (514 nm) at a laser power of 75.4 mV with 1800 lines per mm grafting. The standard mode of 1.5-micron laser spot size at adjustable 20× magnification was used. The characteristic D & G peaks of GO in the Raman spectrum were deconvoluted using Origin software and fitted with Lorentzian fitting to calculate the ID/IG ratio.Electrical conductivity
Two electrodes were prepared by coating 100 nm of gold (∼7 mm on each side) at two ends of each composite film on glass slide (approx. 2 mm width) using a Quorum Q300T D Plus sputter coater. Linear sweep voltammetry (LSV) measurement was then performed using an electrochemical workstation (Biologic VSP potentiostat) in a potential window from −1 to 1 V at 50 mV s−1 voltage scan rate. LSV measurement was conducted on two individual films for each sample and two measurements per film. Sheet resistance (Rsh) derived from the I/V curve obtained using LSV was used to calculate the electrical conductivity. In addition, the thickness of the films was measured using an Alpha-Step D-600 stylus profiler with the reference of the glass surface on both sides of the film. The electrical conductivity of the composite films was calculated using the equation σ = 1/(Rsht) which is based on sheet resistance and thickness of the films.Thermal conductivity
The thermal conductivity was calculated according to the equation k = α × Cp × ρ, where k, α, Cp and ρ represent thermal conductivity, thermal diffusivity, specific heat capacity and density, respectively. The thermal diffusivity of the nanocomposite films (∼0.1 mm thickness) was measured using a Netzsch Light/laser flash analyzer (LFA) 467 instrument. The standard and penetration thermal diffusivity models resulted in the best fits for analysis of physical mixing and miniemulsion samples, respectively. Specific heat capacities were measured using differential scanning calorimetry (DSC; Netzsch DSC204 F1 Phoenix based on the ASTM standard E1269) involving three scans: baseline scan with empty pan, standard scan with sapphire standard and sample scan. The densities of the nanocomposite films were calculated according to ρ = m/V, where ρ, m and V represent density, mass and volume, respectively.Tensile testing
Tensile testing equipment (Mark-10, ESM 303) was used to perform uniaxial tensile tests with a 25 N load cell and 20 mm min−1 loading rate at room temperature. The width, thickness and gauge length (the initial distance between the two clamps) of polymer/GO composite film strips were measured using a digital caliper before the measurement, and each sample was tested using three specimens. Young's modulus was calculated using the linear fitting of the axial stress–strain curve in the elastic region (data were accepted if the coefficient of determination R2 > 0.98). Data are presented as average ± standard deviation (SD). Neat polymer films (i.e. no GO) were also tested under the same conditions.Results and discussion
Nanocomposite films were prepared using the two different approaches of (i) miniemulsion polymerization19 and (ii) physical mixing.13 Miniemulsion polymerization entails generation of submicron size monomer droplets stabilized by GO sheets as well as the conventional surfactant SDS, followed by radical polymerization within the monomer droplets to convert these to polymer particles. Physical mixing involves preparation of a latex of polymer particles using surfactant-free emulsion polymerization, and subsequently mixing this latex with an aqueous dispersion of GO. In both cases, the final nanocomposite latexes are cast into silicone moulds and on glass slides and converted into films via water evaporation (film formation) at room temperature. The GO is finally reduced to rGO by heat treatment of the films.Miniemulsion polymerization
P(St-stat-nBA)/GO nanocomposites were prepared using a range of GO concentrations (wt% rel. to monomer) of 5 (M1), 10 (M2), 15 (M3), 20 (M4), 30 (M5) and 50 wt% (M6) by miniemulsion polymerization at 70 °C with SDS as an additional surfactant (Table 3 and Fig. 1). According to the Fox equation,20 the theoretical Tg of the resulting copolymer at 100% monomer conversion at St![[thin space (1/6-em)]](https://www.rsc.org/images/entities/char_2009.gif) :nBA = 1:1 weight ratio is 3 °C, thus enabling film formation at ambient temperature.21
:nBA = 1:1 weight ratio is 3 °C, thus enabling film formation at ambient temperature.21
| Exp | GO contenta before polymn (%) | Monomer conversion (%) | GO contentb in final film (%) | Before polymn. | After polymn. | M n (kg mol−1) | M w (kg mol−1) | ||
|---|---|---|---|---|---|---|---|---|---|
| Sizec (nm) | PdI | Sizec (nm) | PdI | ||||||
| a Wt% relative to monomer in polymerization recipe. b Wt% in final material (film) relative to total weight (incl. GO, polymer, SDS and HD), calculated based on monomer conversion. c Intensity average based on DLS. | |||||||||
| M0 | 0 | 80 | 0 | 44 | 0.21 | 102 | 0.04 | 404 | 780 |
| M1 | 5 | 91 | 4.8 | 225 | 0.33 | 80 | 0.16 | 126 | 385 |
| M2 | 10 | 88 | 9.4 | 235 | 0.94 | — | — | 182 | 449 |
| M3 | 15 | 89 | 13.4 | 233 | 0.79 | — | — | 112 | 342 |
| M4 | 20 | 73 | 19.8 | 280 | 0.69 | — | — | 134 | 341 |
| M5 | 30 | 59 | 30.9 | 267 | 0.66 | — | — | 126 | 325 |
| M6 | 50 | 54 | 44.6 | 290 | 0.97 | — | — | 117 | 447 |
 | ||
| Fig. 1 Polymer/GO latexes prepared via miniemulsion polymerization and physical mixing approaches. | ||
The polymer latexes were homogeneous after polymerization without noticeable coagulation, with relatively viscous latexes obtained at the higher GO concentrations (M4–M6; Fig. 1). The overall monomer conversions were markedly lower at these high GO concentrations, only reaching 54% at the highest GO concentration (Table 3). We have previously observed that when styrene is one of the comonomers (and in homopolymerization of styrene), the polymerization rate in miniemulsions in the presence of GO can be significantly reduced for reasons that remain to be fully elucidated.22,23 For the purpose of discussing the material properties of the films, the actual contents of GO in the final materials were calculated considering the monomer conversion, resulting in 4.8–44.6 wt% (Table 3).
Due to the presence of free GO sheets in the aqueous phase as well as GO-stabilized monomer droplets/polymer particles, estimation of particle size using DLS is fraught with error (DLS theory is based on spherical objects), and hence DLS data are only reported for M0 and M1. The GO loading of 5 wt% (M1) resulted in a particle size of 80 nm after polymerization (Table 3). A P(St-stat-nBA) latex was also synthesized in the absence of GO via miniemulsion polymerization as a control sample. All the latexes displayed molecular weights and molecular weight distributions within the anticipated range for a radical polymerization in miniemulsion (Table 3 and Fig. S1†). The polymerization without GO resulted in markedly higher molecular weight, consistent with the rate reducing effect of GO in these systems.
Physical mixing systems
Surfactant-free emulsion polymerization was performed to prepare P(BzMA-stat-nBA) using KPS as initiator at 70 °C for 6 h (Table 4 and Fig. 1), resulting in 96% conversion (Mn = 39000 g mol−1; Mw = 132000 g mol−1; Intensity-average particle size = 453 nm, PdI = 0.06). This polymer latex was used in all physical mixing systems. The monomers BzMA/nBA were chosen (as opposed to St/nBA for the miniemulsion polymerizations above) as we have previously found that this system gives higher electrical conductivity than St/nBA in physical mixing systems.24 Based on the Fox equation,20 the weight ratio of BzMA and nBA was set at 1:1 to achieve ambient temperature film formation (theoretical Tg ≈ −11 °C). SDS was added to aqueous GO dispersions (resulting in 3 wt% SDS relative to polymer in the final nanocomposite latex) at different GO concentrations (5 (PM1), 10 (PM2), 15 (PM3), 20 (PM4), 30 (PM5) and 50 (PM6) wt% relative to polymer in the final nanocomposite latex), followed by mixing with the polymer latex prepared by surfactant-free emulsion polymerization. The latexes with 20–50 wt% GO (PM4–6) were more viscous than for the lower GO concentrations, but all latexes were macroscopically homogeneous and stable after being left standing for several hours (Fig. 1). The GO contents in the final nanocomposite materials were 4.8–33 wt% (Table 4).
Electrical conductivity of polymer/rGO nanocomposite films
Nanocomposite films were prepared by casting the polymer latexes prepared via miniemulsion and physical mixing methods on glass slides at ambient temperature. The obtained films were subsequently subjected to heat treatment at 160 °C for 24 h to reduce GO to rGO, with the reduction confirmed by analysing the films using Raman spectroscopy. The films from both miniemulsion and physical mixing systems exhibited two characteristic peaks at 1353 cm−1 (D peak) and 1585 cm−1 (G peak) (Table S1†). The D peak has been assigned to structural defects in the carbon lattice, while the G peak represents sp2 hybridized carbon in the graphitic structure.25 The successful reduction of GO was confirmed by a decrease in the intensity ratio ID/IG (Fig. S2 and Table S1†) compared to the ID/IG ratio of neat GO being typically ∼1.0.8,26,27 In addition, the values in this work were similar to those reported previously for polymer/rGO films prepared using a similar method.13,28,29Linear sweep voltammetry (LSV) was performed to measure the electrical conductivity of the polymer/rGO nanocomposite films. Overall, the electrical conductivity increased with increasing GO loading in both systems (Fig. 2a and Table S2†). Note that in the final films, the GO has been reduced to rGO. In the miniemulsion systems, the electrical conductivity was 0.53 S m−1 at the lowest rGO content of 4.8 wt%, then gradually increasing with increasing rGO content as expected and eventually reaching the highest value of 171.55 S m−1 at 44.6 wt% (the rGO contents refer to the wt% relative to total weight of material in the final films). The increase in electrical conductivity can be ascribed to higher rGO content in nanocomposite films.13,30
 | ||
| Fig. 2 (a) Electrical conductivity data of the polymer/rGO nanocomposite films with different contents of rGO (wt% relative to total material) prepared via miniemulsion and physical mixing approaches. (b) Comparison of electrical conductivity of this work with other studies (data for polymer/rGO composites prepared via both emulsion-based and non-emulsion-based techniques; details of the references in ESI† Table S3). M stands for miniemulsion and PM stands for physical mixing. | ||
In the physical mixing systems, the polymer matrix P(BzMA-stat-nBA) was chosen instead of P(St-stat-nBA) due to higher electrical conductivity results of the former observed in our previous work.24 The electrical conductivity in the physical mixing systems also increased with increasing rGO content (Fig. 2a and Table S2†). The lowest conductivity was 3.24 S m−1 at 4.8 wt% rGO, with the highest value of 127.22 S m−1 at the highest rGO content of 33 wt%. Both the miniemulsion and the physical mixing systems exhibited a very similar overall trend with the electrical conductivity increasing with increasing rGO content. However, notably higher values of electrical conductivity were achieved in physical mixing systems than in miniemulsion systems in the medium range of rGO loadings. We postulate that the observed lack of difference in electrical conductivity between the physical mixing and miniemulsion films at higher filler loading (>20 wt%) can be due to a combination of potential factors – (a) similar extent of stacking of rGO sheets within films, and (b) the loss of control over the arrangement of rGO sheets compared to what has been previously observed by us at 5 wt% filler loading.13
Compared to the literature over the last two decades,11,13,24,30–39 the electrical conductivity values in the present work are among the highest values reported for polymer/rGO composites (Fig. 2b and Table S3†). The highest values of electrical conductivity reported in previous studies were typically obtained using either an electrically conductive polymer or chemically modified GO/rGO. Meanwhile, achieving high electrical conductivity for polymer/rGO nanocomposites prepared via emulsion-based techniques remains challenging, particularly at high rGO content (>10 wt%). In the present work, very high rGO contents were successfully incorporated into polymer/rGO nanocomposites, resulting in electrical conductivity values that are at least an order of magnitude higher than most values reported for emulsion-based approaches. Hence, these nanocomposite materials are highly promising for a variety of electrical applications.40,41
Thermal conductivity
Reduced GO possesses high thermal conductivity and is as such an attractive filler for potential applications such as thermal management, electronics, and energy storage systems where nanocomposite thermal conductivity is of importance. Thermal diffusivities as a function of temperature over the range 20–180 °C were measured using the method of laser-flash for the nanocomposite films prepared using both miniemulsion polymerization and physical mixing. In the laser flash method, the sample surface is irradiated using a short energy (laser) pulse. A thermal wave travels through the sample and the resulting temperature rise is measured on the rear side of the sample. The laser flash method assumes ideal conditions which are not met in most actual experiments. Therefore, correction methods have been developed to account for e.g. heat loss, energy pulse penetration and finite pulse width. In the present work, the “penetration single layer model” resulted in the best fit for miniemulsion samples with 0/4.8/9.4/13.4 wt% rGO, whereas the “standard model” resulted in the best fit for physical mixing samples with 0/4.8/9.1 wt% rGO. The remainder of the miniemulsion and physical mixing samples did not result in satisfactory fits regardless of model used, and thus no further analyses were conducted for these samples. The thermal conductivity at a given temperature was calculated from the thermal diffusivity (Fig. S3†) via the density and the heat capacity as outlined in the experimental section.In the case of the miniemulsion systems, two immediate observations can be made: (i) the thermal conductivity increases with increasing rGO content, and (ii) the thermal conductivity remains relatively constant over the temperature range investigated, although there is a slight general decrease in conductivity with increasing temperature, especially for the highest rGO content (Fig. 3a). At 20 °C, the thermal conductivity of the blank sample (without rGO) is 0.12 W mK−1, to be compared with 0.35 for 13.4 wt% rGO, i.e. an increase by approximately a factor of 3. At the highest rGO content of 13.4 wt%, the thermal conductivity decreased from 0.35 to 0.29 (21%) as the temperature was increased from 20 °C to 180 °C.
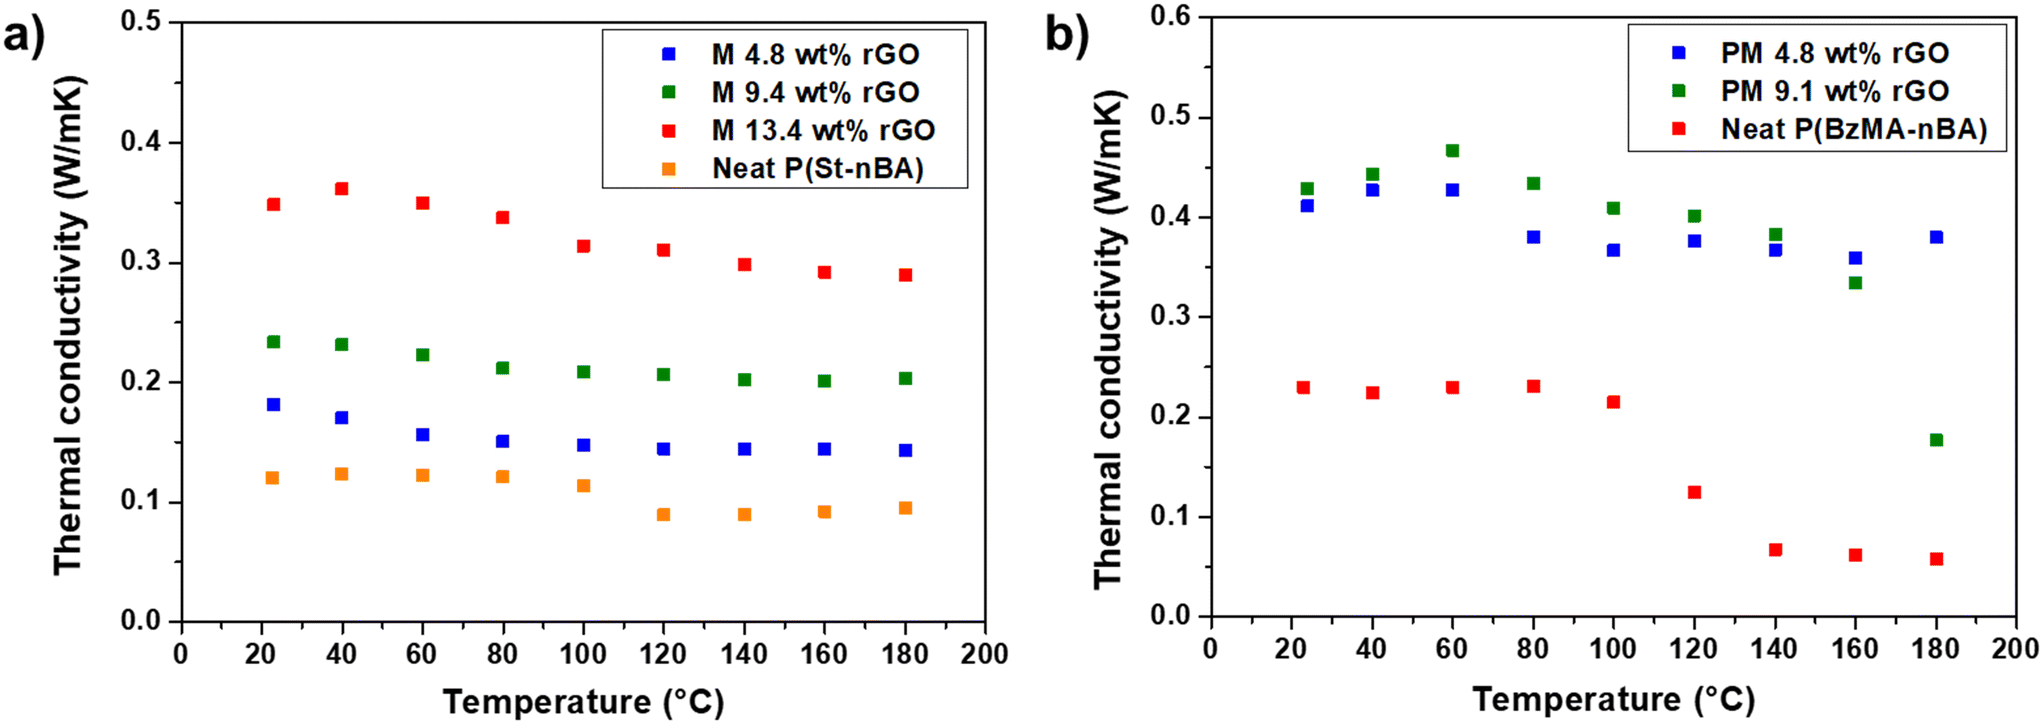 | ||
| Fig. 3 Thermal conductivity data of the polymer/rGO nanocomposite films with different contents of GO prepared via (a) miniemulsion and (b) physical mixing methods. | ||
For the physical mixing systems, we observed a relative increase in the thermal conductivity with increasing rGO content although the difference between the two nanocomposite coatings (4.8 wt% and 9.1 wt%) remains quite low until 160 °C (Fig. 3b). The effect of temperature is however less clear, and for the sample with 9.1 wt% rGO there is a significant decrease in thermal conductivity in the temperature range 140–180 °C. The highest thermal conductivity value recorded was for 9.1 wt% rGO at 60 °C at 0.47 W mK−1. Comparing the physical mixing systems with the miniemulsion systems, it is clear that the physical mixing systems give higher thermal conductivity values. For example, at 9.1 wt% rGO at 60 °C the physical mixing system gives 0.47 W mK−1, to be compared with 0.22 W mK−1 for the corresponding miniemulsion system. We have previously reported that the GO (rGO) distribution within the polymer matrix is dramatically affected by the process for emulsion-based techniques.13 Physical mixing leads to self-aligned domains of GO sheets into relatively thick well-defined domains, unlike miniemulsion systems where GO sheets located at the interface of the polymer particles presumably prevent GO sheets from self-assembling, instead leading to a GO network of a high number of small pathways. In our previous work, it was demonstrated that physical mixing resulted in markedly higher electrical conductivities than the miniemulsion-based techniques, where in both cases the high rGO loadings mean the percolation threshold is exceeded. It can be speculated that similar factors are at play in terms of dictating the thermal conductivities in the present work, creating efficient pathways for heat transfer in the physical mixing systems, although factors such as phonon scattering at the interfaces between the rGO sheets and the matrix material must also be considered. The obtained thermal conductivity values are similar to previous reports.42 In that study conducted on polymer/GO nanoparticles prepared by an emulsion-based approach, the low thermal conductivity was reasoned to be the presence of air pockets. However, it is to be noted that the thermal conductivity investigation of nanocomposite films prepared using emulsion-based approaches remains widely unexplored. A comparison with thermal conductivity data reported in the literature for nanocomposites comprising polymer and graphene derivatives prepared by various techniques reveals that the present results are at the lower end (Fig. S4†). The reasoning behind the low thermal conductivity in nanocomposite films prepared using emulsion-based techniques is not entirely clear and requires further work. It is proposed that perhaps agglomeration or stacking of GO sheets at such high GO loadings when using emulsion-based approaches could compromise thermal conductivity of resulting nanocomposite films. Perhaps future work can explore (i) the use of functionalised GO to mitigate widespread agglomeration of GO sheets within the nanocomposite film, and (ii) different polymer types with more targeted interactions with GO sheets aiding in their distribution while restricting their agglomeration.
Mechanical properties
Tensile testing of the polymer/GO nanocomposite films (i.e. before reduction of GO to rGO) from the miniemulsion and physical mixing systems was performed to explore the mechanical properties. It was not possible to prepare films from the miniemulsion latexes containing the three highest GO concentrations (M4, M5, M6; 19.8, 30.9 and 44.6 wt% GO relative to total weight in the final material) using a silicone mould due to crack formation on drying. The mechanical properties of the films are displayed in Fig. 4 (miniemulsion) and Fig. 5 (physical mixing).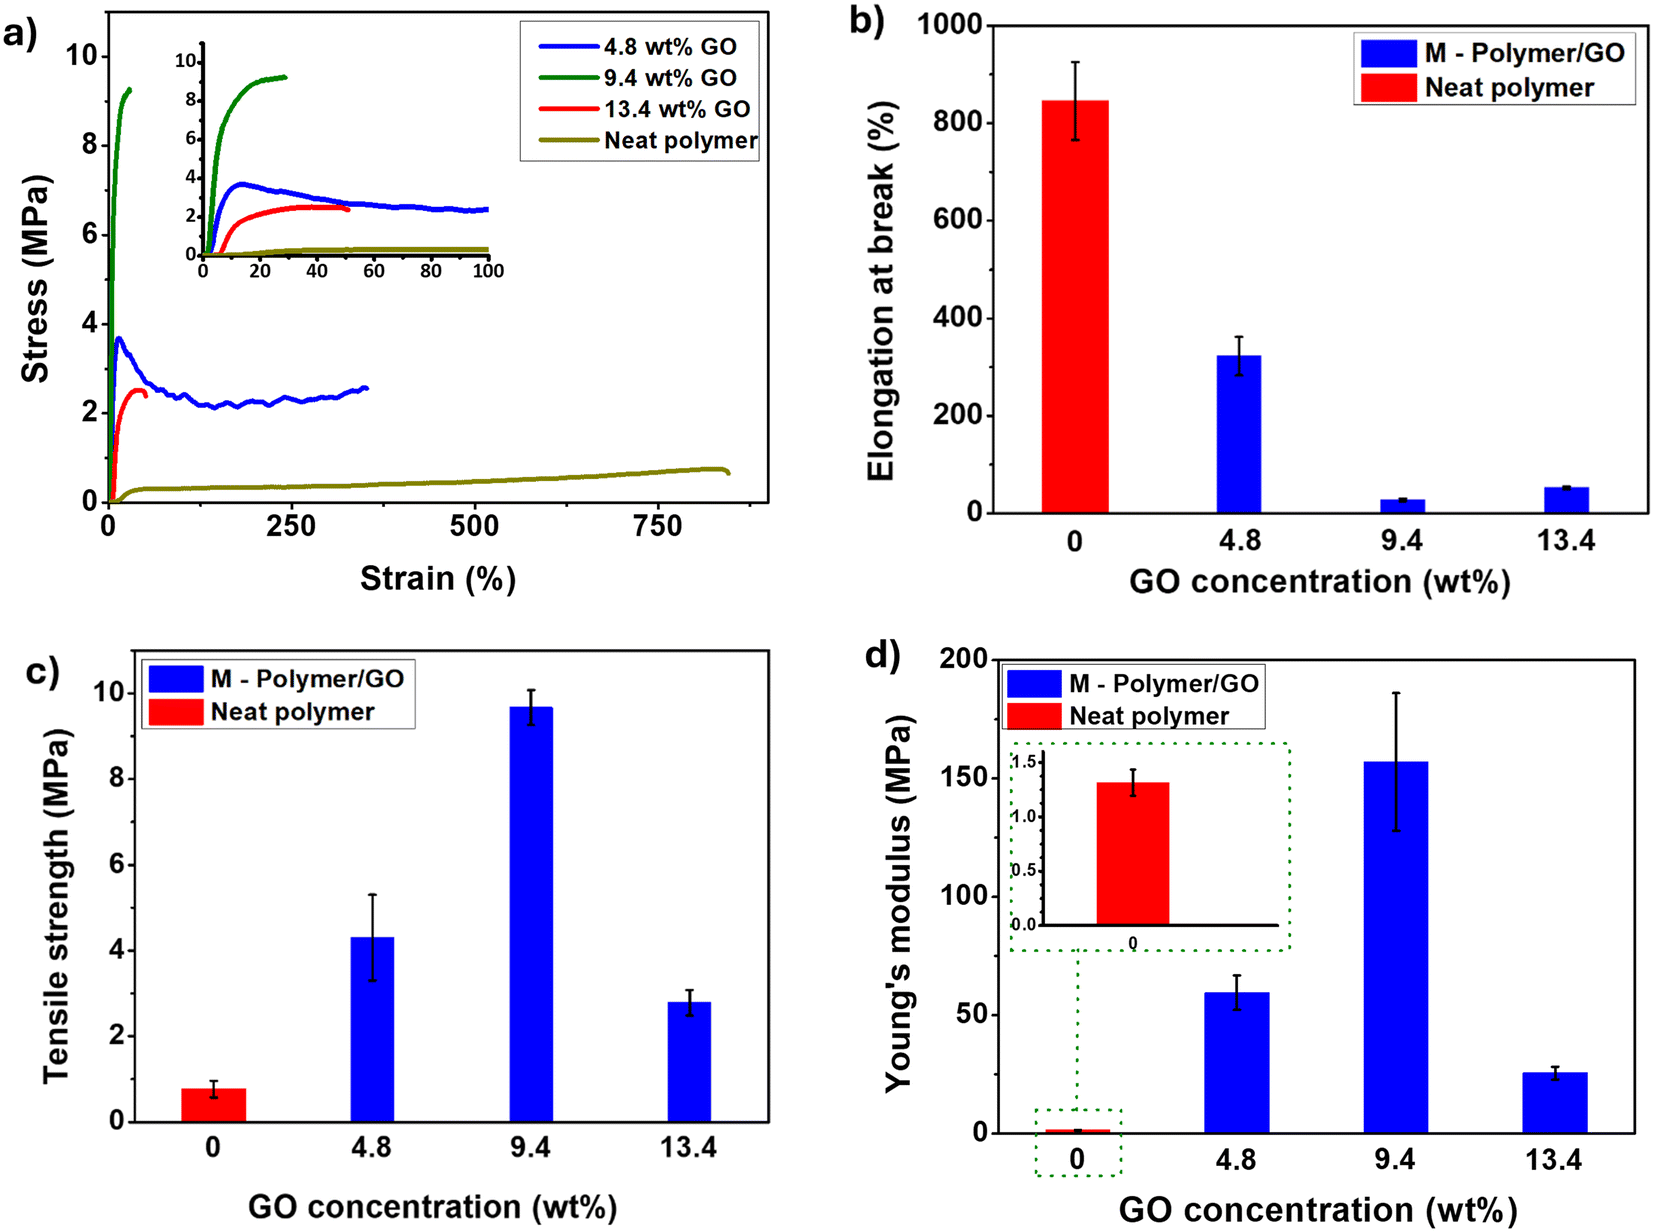 | ||
| Fig. 4 Mechanical properties of P(St-stat-nBA)/GO nanocomposite films containing different GO concentrations for miniemulsion systems; (a) stress–strain curves; (b) elongation at break; (c) tensile strength; (d) Young's modulus. | ||
 | ||
| Fig. 5 Mechanical testing of P(BzMA-stat-nBA)/GO nanocomposite films containing different concentrations of GO for physical mixing systems; (a) stress–strain curves; (b) elongation at break; (c) tensile strength; (d) Young's modulus. | ||
For the miniemulsion systems (Fig. 4), the neat polymer film exhibited the highest elongation at break at 845%, but the tensile strength (stress at break) and Young's modulus (corresponding to the initial linear portion of the stress–strain curve) were relatively low at 0.77 MPa and 1.3 MPa, respectively (Table S5†). Generally, the incorporation of GO resulted in harder and more brittle films with a considerable enhancement in mechanical strength. The ductility of all polymer/GO nanocomposite films was markedly lower than that of neat polymer film. The highest tensile strength and Young's modulus were obtained at 9.4 wt% GO concentration at 9.7 MPa and 157 MPa, respectively (Table S5†), with a further increase in GO content leading to significantly lower values. It is well established that increasing the GO concentration usually improves the mechanical properties of polymer/GO nanocomposite materials; however, the reinforcing effect of GO can be diminished when reaching a critical concentration.43,44 It should be noted that all miniemulsion samples contain hexadecane (to minimize Ostwald ripening during the polymerization), which leads to softer materials.45
Similar results were obtained for the P(BzMA-stat-nBA)/GO physical mixing systems (Fig. 5 and Table S5†). The neat polymer film P(BzMA-stat-nBA) exhibited the highest ductility with 1054% elongation at break, but the lowest tensile strength (2 MPa) and Young's modulus (0.6 MPa). At 4.8 wt% GO concentration, the increase in tensile strength and Young's modulus was relatively small (2.6 MPa and 21.6 MPa, respectively), but a significant increase was observed in the composite films at higher GO concentrations compared to the corresponding neat polymer. Overall, both tensile strength and Young's modulus increased with increasing GO loading, with the highest values of 14.5 MPa (16.6 wt%) and 283.8 MPa (22.9 wt%), respectively (Table S5†). Similarly to what was observed for the miniemulsion systems, when the GO loading increased past a certain point, both the tensile strength and Young's modulus began to decrease, presumably for similar reasons. The cross-sectional SEM imaging of films with 15 wt% GO prepared using both miniemulsion and physical mixing exhibited layered stacks of GO sheets which can be postulated to the widespread stacking of GO sheets with films at high GO loading (Fig. S5†). Previous reports of mechanical properties of polymer/GO nanocomposites have mainly focused on the use of relatively low GO concentrations (below 10 wt%), which can probably be attributed to the difficulties in sample preparation which makes mechanical testing challenging at high GO concentrations. Beyond this critical concentration (>10 wt%), the potential widespread agglomeration/stacking of GO sheets can lead to reducing ability to dissipate force (stress) through the nanocomposite film or material when stretched thus diminishing their (film) mechanical properties (strength and flexibility).
Conclusions
The use of unusually high filler levels of up to 45 wt% (relative to total material) of GO (rGO) has been explored for preparation of nanocomposite polymer materials using aqueous emulsion based syntheses based on copolymers of styrene/n-butyl acrylate and benzyl methacrylate/n-butyl acrylate. The specific copolymer formulations were designed to enable drop casting for film formation directly from nanocomposite latexes. Two distinct approaches were investigated: (i) conducting miniemulsion polymerization in the presence of graphene oxide (GO) and (ii) physically blending aqueous GO dispersions with a polymer latex. Nanocomposite films were prepared at ambient temperature by casting from aqueous latexes, followed by the thermal reduction of GO to rGO.Electrical conductivity measurements of the nanocomposite films revealed that the values continue to increase with increasing rGO content for both miniemulsions and physical mixing systems. There was however a notable difference in that the physical mixing systems exhibited higher conductivity than the miniemulsion systems at moderate rGO levels. The thermal conductivity improved with increasing rGO content as anticipated, reaching values of approximately 0.4 W mK−1, with the physical mixing approach yielding somewhat higher thermal conductivity compared to the miniemulsion process. The GO (rGO) distribution within the polymer matrix is known to be strongly influenced by the process for emulsion-based techniques. Our earlier work has demonstrated that physical mixing resulted in markedly higher electrical conductivities than the miniemulsion-based techniques – it is presumed that similar factors are at play in terms of dictating both the electrical- and thermal conductivities in the present work. The mechanical properties revealed that as anticipated, increasing GO loading led to stronger but less flexible materials for both systems. Notably, film formation from the miniemulsion latexes of GO concentrations above approximately 20 wt% GO (in the final film) was not possible due to crack formation during drying.
Overall, the results highlight the attractiveness of environmentally friendly and easily scalable aqueous emulsion based synthesis methodology, applicable also at very high filler levels. The electrical conductivities are generally among the highest values reported for polymer/rGO composites, although further research is required to understand and improve the thermal conductivities to levels reported for other preparation methods.
Data availability
The data supporting this article have been included as part of the ESI.†Conflicts of interest
There are no conflicts to declare.References
- X. Fu, J. Lin, Z. Liang, R. Yao, W. Wu, Z. Fang, W. Zou, Z. Wu, H. Ning and J. Peng, Graphene oxide as a promising nanofiller for polymer composite, Surf. Interfaces, 2023, 37, 102747 CrossRef CAS.
- C. Maignan, J. G. Alauzun, E. Flahaut, L. Monconduit and B. Boury, Graphene oxide Composites: A versatile material used as protective layer, solid-state electrolyte, and gel electrolyte in metal batteries, Chem. Eng. J., 2024, 485, 149616 Search PubMed.
- G. J. Adekoya, A. C. Ezika, O. C. Adekoya, E. R. Sadiku, Y. Hamam and S. S. Ray, Recent advancements in biomedical application of polylactic acid/graphene nanocomposites: An overview, BMEMat, 2023, 1(4), e12042 CrossRef.
- Z. Shahryari, M. Yeganeh, K. Gheisari and B. Ramezanzadeh, A brief review of the graphene oxide-based polymer nanocomposite coatings: preparation, characterization, and properties, J. Coat. Technol. Res., 2021, 18(4), 945–969 CrossRef CAS.
- N. Fatima, U. Y. Qazi, A. Mansha, I. A. Bhatti, R. Javaid, Q. Abbas, N. Nadeem, Z. A. Rehan, S. Noreen and M. Zahid, Recent developments for antimicrobial applications of graphene-based polymeric composites: A review, J. Ind. Eng. Chem., 2021, 100, 40–58 CrossRef CAS.
- Y. Yu, L. C. X. De Andrade, L. Fang, J. Ma, W. Zhang and Y. Tang, Graphene oxide and hyperbranched polymer-toughened hydrogels with improved absorption properties and durability, J. Mater. Sci., 2015, 50(9), 3457–3466 Search PubMed.
- N. Maslekar, Y. Fadil, P. B. Zetterlund and V. Agarwal, Maintaining Colloidal Stability of Polymer/Reduced Graphene Oxide Nanocomposite Aqueous Dispersions Produced via In Situ Reduction of Graphene Oxide for the Preparation of Electrically Conductive Coatings, ACS Appl. Nano Mater., 2023, 6(7), 5177–5186 CrossRef CAS.
- V. Agarwal and P. B. Zetterlund, Strategies for reduction of graphene oxide-A comprehensive review, Chem. Eng. J., 2020, 127018 Search PubMed.
- H. Kim, Y. Miura and C. W. Macosko, Graphene/Polyurethane Nanocomposites for Improved Gas Barrier and Electrical Conductivity, Chem. Mater., 2010, 22(11), 3441–3450 CrossRef CAS.
- A. Tarhini and A. R. Tehrani-Bagha, Advances in Preparation Methods and Conductivity Properties of Graphene-based Polymer Composites, Appl. Compos. Mater., 2023, 30(6), 1737–1762 Search PubMed.
- Y. Fadil, S. C. Thickett, V. Agarwal and P. B. Zetterlund, Synthesis of graphene-based polymeric nanocomposites using emulsion techniques, Prog. Polym. Sci., 2022, 125, 101476 Search PubMed.
- V. Agarwal, Y. Fadil, A. Wan, N. Maslekar, B. N. Tran, R. A. Mat Noor, S. Bhattacharyya, J. Biazik, S. Lim and P. B. Zetterlund, Influence of Anionic Surfactants on the Fundamental Properties of Polymer/Reduced Graphene Oxide Nanocomposite Films, ACS Appl. Mater. Interfaces, 2021, 13(15), 18338–18347 CrossRef CAS PubMed.
- Y. Fadil, L. N. Dinh, M. O. Yap, R. P. Kuchel, Y. Yao, T. Omura, U. A. Aregueta-Robles, N. Song, S. Huang and F. Jasinski, Ambient-temperature waterborne polymer/rGO nanocomposite films: effect of rGO distribution on electrical conductivity, ACS Appl. Mater. Interfaces, 2019, 11(51), 48450–48458 CrossRef CAS PubMed.
- G. George, S. M. Simon, V. P. Prakashan, M. S. Sajna, M. Faisal, R. Wilson, A. Chandran, P. R. Biju, C. Joseph and N. V. Unnikrishnan, Green and facile approach to prepare polypropylene/in situ reduced graphene oxide nanocomposites with excellent electromagnetic interference shielding properties, RSC Adv., 2018, 8(53), 30412–30428 Search PubMed.
- H. Li, S. Wu, J. Wu and G. Huang, A facile approach to the fabrication of graphene-based nanocomposites by latex mixing and in situ reduction, Colloid Polym. Sci., 2013, 291(10), 2279–2287 CrossRef CAS.
- L. Wei, W. Zhang, J. Ma, S.-L. Bai, Y. Ren, C. Liu, D. Simion and J. Qin, π-π stacking interface design for improving the strength and electromagnetic interference shielding of ultrathin and flexible water-borne polymer/sulfonated graphene composites, Carbon, 2019, 149, 679–692 CrossRef CAS.
- G. Zheming, Z. Ling and L. Chunzhong, Emulsion Polymerization: A New Approach to Prepare Graphite Oxide Coated with Polyaniline, J. Macromol. Sci., Part B:Phys., 2009, 48(2), 226–237 CrossRef.
- N. Park, J. Lee, H. Min, Y. D. Park and H. S. Lee, Preparation of highly conductive reduced graphite oxide/poly (styrene-co-butyl acrylate) composites via miniemulsion polymerization, Polymer, 2014, 55(20), 5088–5094 CrossRef CAS.
- J. M. Asua, Miniemulsion polymerization, Prog. Polym. Sci., 2002, 27(7), 1283–1346 CrossRef CAS.
- T. G. Fox and P. J. Flory, The glass temperature and related properties of polystyrene. Influence of molecular weight, J. Polym. Sci., 1954, 14(75), 315–319 Search PubMed.
- Y. Fadil, S. C. Man, F. Jasinski, H. Minami, S. C. Thickett and P. B. Zetterlund, Formation of homogeneous nanocomposite films at ambient temperature via miniemulsion polymerization using graphene oxide as surfactant, J. Polym. Sci., Part A: Polym. Chem., 2017, 55(14), 2289–2297 Search PubMed.
- S. H. C. Man, S. C. Thickett, M. R. Whittaker and P. B. Zetterlund, Synthesis of polystyrene nanoparticles "armoured" with nanodimensional graphene oxide sheets by miniemulsion polymerization, J. Polym. Sci., Part A:Polym. Chem., 2013, 51(1), 47–58 Search PubMed.
- S. H. C. Man, N. Y. M. Yusof, M. R. Whittaker, S. C. Thickett and P. B. Zetterlund, Influence of Monomer Type on Miniemulsion Polymerization Systems Stabilized by Graphene Oxide as Sole Surfactant, J. Polym. Sci., Part A:Polym. Chem., 2013, 51(23), 5153–5162 Search PubMed.
- B. N. Tran, Y. Fadil, S. C. Thickett, V. Agarwal and P. B. Zetterlund, Correction to “Influence of Polymer Matrix on Polymer/Graphene Oxide Nanocomposite Intrinsic Properties”, ACS Appl. Polym. Mater., 2024, 6(9), 5585–5585 CrossRef CAS.
- A. C. Ferrari, J. C. Meyer, V. Scardaci, C. Casiraghi, M. Lazzeri, F. Mauri, S. Piscanec, D. Jiang, K. S. Novoselov, S. Roth and A. K. Geim, Raman Spectrum of Graphene and Graphene Layers, Phys. Rev. Lett., 2006, 97(18), 187401 Search PubMed.
- C. S. Andrade, A. P. S. Godoy, M. A. G. Benega, R. J. Andrade, R. C. Andrade, W. M. Silva, J. M. d. O. Cremonezzi, W. A. d. A. Macedo, P. L. Gastelois and H. Ribeiro, Micro scalable graphene oxide productions using controlled parameters in bench reactor, Nanomaterials, 2021, 11(8), 1975 CrossRef CAS PubMed.
- S. Bose, T. Kuila, A. K. Mishra, N. H. Kim and J. H. Lee, Dual role of glycine as a chemical functionalizer and a reducing agent in the preparation of graphene: an environmentally friendly method, J. Mater. Chem., 2012, 22(19), 9696–9703 Search PubMed.
- B. N. Tran, S. Bhattacharyya, Y. Yao, V. Agarwal and P. B. Zetterlund, In Situ Surfactant Effects on Polymer/Reduced Graphene Oxide Nanocomposite Films: Implications for Coating and Biomedical Applications, ACS Appl. Nano Mater., 2021, 4(11), 12461–12471 Search PubMed.
- M. G. Saborio, N. Maslekar, Y. Yao, P. B. Zetterlund and V. Agarwal, Ionic–Electronic Conductivity in Ternary Polymer/Reduced Graphene Oxide/Polyelectrolyte Nanocomposite Coatings for Potential Application in Energy Storage, ACS Appl. Nano Mater., 2023, 6(4), 2413–2420 CrossRef CAS.
- Y. Fadil, V. Agarwal, F. Jasinski, S. C. Thickett, H. Minami and P. B. Zetterlund, Electrically conductive polymer/rGO nanocomposite films at ambient temperature via miniemulsion polymerization using GO as surfactant, Nanoscale, 2019, 11(14), 6566–6570 Search PubMed.
- S. Che Man, S. C. Thickett, M. R. Whittaker and P. B. Zetterlund, Synthesis of polystyrene nanoparticles “armoured” with nanodimensional graphene oxide sheets by miniemulsion polymerization, J. Polym. Sci., Part A: Polym. Chem., 2013, 51(1), 47–58 Search PubMed.
- D. Zheng, G. Tang, H.-B. Zhang, Z.-Z. Yu, F. Yavari, N. Koratkar, S.-H. Lim and M.-W. Lee, In situ thermal reduction of graphene oxide for high electrical conductivity and low percolation threshold in polyamide 6 nanocomposites, Compos. Sci. Technol., 2012, 72(2), 284–289 Search PubMed.
- C. Gonçalves, I. C. Gonçalves, F. D. Magalhães and A. M. Pinto, Poly (lactic acid) composites containing carbon-based nanomaterials: A review, Polymers, 2017, 9(7), 269 CrossRef.
- A. J. Marsden, D. Papageorgiou, C. Valles, A. Liscio, V. Palermo, M. Bissett, R. Young and I. Kinloch, Electrical percolation in graphene–polymer composites, 2D Mater., 2018, 5(3), 032003 Search PubMed.
- B. Alemour, M. Yaacob, H. Lim and M. R. Hassan, Review of Electrical Properties of Graphene Conductive Composites, Int. J. Nanoelectron. Mater., 2018, 11(4), 371–398 Search PubMed.
- M. Li, C. Gao, H. Hu and Z. Zhao, Electrical conductivity of thermally reduced graphene oxide/polymer composites with a segregated structure, Carbon, 2013, 65, 371–373 Search PubMed.
- V. Eswaraiah, K. Balasubramaniam and S. Ramaprabhu, One-pot synthesis of conducting graphene–polymer composites and their strain sensing application, Nanoscale, 2012, 4(4), 1258–1262 Search PubMed.
- H. Tang, G. J. Ehlert, Y. Lin and H. A. Sodano, Highly efficient synthesis of graphene nanocomposites, Nano Lett., 2012, 12(1), 84–90 Search PubMed.
- S. Ye and J. Feng, A new insight into the in situ thermal reduction of graphene oxide dispersed in a polymer matrix, Polym. Chem., 2013, 4(6), 1765–1768 Search PubMed.
- K. K. Sadasivuni, D. Ponnamma, J. Kim and S. Thomas, Graphene-based polymer nanocomposites in electronics, Springer, 2015 Search PubMed.
- S. Stankovich, D. A. Dikin, G. H. Dommett, K. M. Kohlhaas, E. J. Zimney, E. A. Stach, R. D. Piner, S. T. Nguyen and R. S. Ruoff, Graphene-based composite materials, Nature, 2006, 442(7100), 282–286 Search PubMed.
- M. Hu, D. Wang, G. Kokogiannakis, J. Darkwa, Y. Li, L. Wang, Q. Xu and W. Su, Enhancement of thermal and mechanical properties of microencapsulated phase change materials with graphene oxide, Chem. Eng. J., 2024, 479, 147855 CrossRef CAS.
- H. Koduru, L. Bruno, Y. Marinov, G. Hadjichristov and N. Scaramuzza, Mechanical and sodium ion conductivity properties of graphene oxide–incorporated nanocomposite polymer electrolyte membranes, J. Solid State Electrochem., 2019, 23(9), 2707–2722 Search PubMed.
- S. I. Abdullah and M. Ansari, Mechanical properties of graphene oxide (GO)/epoxy composites, HBRC J., 2015, 11(2), 151–156 Search PubMed.
- L. N. Dinh, B. N. Tran, V. Agarwal and P. B. Zetterlund, Synthesis of highly stretchable and electrically conductive multiwalled carbon nanotube/polymer nanocomposite films, ACS Appl. Polym. Mater., 2022, 4(3), 1867–1877 CrossRef CAS.
Footnote |
| † Electronic supplementary information (ESI) available. See DOI: https://doi.org/10.1039/d5lf00078e |
| This journal is © The Royal Society of Chemistry 2025 |