
 Open Access Article
 This Open Access Article is licensed under a
 Creative Commons Attribution 3.0 Unported Licence
Development of a novel point-of-care device to monitor arterial thrombosis
Christopher A.
Bresette
 *a,
Viviana
Claveria
b and
David N.
Ku
*b
*a,
Viviana
Claveria
b and
David N.
Ku
*b
aGeorgia Institute of Technology, Department of Biomedical Engineering, USA. E-mail: christopher.bresette@me.gatech.edu
bGeorgia Institute of Technology, GWW School of Mechanical Engineering, USA. E-mail: david.ku@me.gatech.edu
First published on 30th April 2025
Abstract
Arterial thrombosis is a leading cause of heart attacks and strokes, representing a significant global health challenge. Microfluidic research studies have identified high shear stress, a thrombotic surface, and the presence of von Willebrand factor (vWF) and platelets as key conditions necessary for formation of arterial thrombi, termed shear-induced platelet aggregation (SIPA). However, current point-of-care (POC) assays of platelet function fail to incorporate these conditions, often relying on artificial agonists alone for stimulation. This study introduces a novel POC device designed to replicate high shear arterial thrombosis to create large platelet-rich clots reliably with small blood samples. The device was tested with blood from 10 healthy donors, with and without treatment with antiplatelet agents ASA, 2MeSAMPS and eptifibatide. The POC endpoint was compared with the PFA-100 to demonstrate novelty. A novel POC was successfully developed that can run with 5 mL of blood, had an intra-patient variability <15% and could distinguish differences in the healthy subjects tested. The POC was sensitive to antiplatelet agents acetyl-salicylic acid, 2-MeSAMPS and eptifibatide, showing an increase in end volume, a proxy for occlusion time, after treatment (p < 0.001). The novel POC device provides a unique endpoint that is uncorrelated with PFA-100 results. The ability of the novel POC to differentiate individual's thrombotic potential underscores its utility for clinical applications such as diagnosing platelet dysfunction, quantifying thrombotic risk, and optimizing antiplatelet therapies. This novel approach bridges the gap between research assays and practical clinical tools, offering a significant advancement in personalized cardiovascular care.
Introduction
Arterial thrombosis
Major adverse cardiovascular events (MACE) remain the leading cause of death in developed nations, despite significant advances in their treatment and prevention.1,2 MACE includes occlusive clots, such as myocardial infarctions, strokes, pulmonary embolisms or deep vein thrombosis.3 A large proportion of these events are categorized as ischemic, characterized by reduced blood flow to tissues and subsequent cellular damage.4 If the ischemic event occurs in an artery, the process of clot formation is called arterial thrombosis. Clots that form in the high shear environments of the artery are distinct from those that form through the coagulation cascade. Instead of being red blood cell and fibrin-rich, arterial thrombi or “white clots” are lighter in color and platelet rich.5 Virchow's triad traditionally describes the factors contributing to coagulation; however, an alternative triad better captures the unique conditions underpinning arterial thrombosis.6 According to the alternative triad, arterial thrombi are created by the combination of platelets and von Willebrand factor, high shear stresses, and a thrombogenic surface. White clots would therefore be expected to form in scenarios such as: primary hemostasis where high shear flow out of an injured vessel passes tissue (thrombogenic surface), ischemic stroke where a ruptured atherosclerotic plaque provides both high shear flow and a thrombogenic surface, or in high shear regions of mechanical pumps. In these situations, von Willebrand factor (vWF) plays a particularly important role as a shear stress sensor.7 Under typical physiological flow conditions, vWF exists in a globular configuration. However, under shear stresses where the force on vWF exceeds 21 pN, it unfolds, becomes elongated and platelet binding domains become exposed and activated.8 Forces greater than 21 pN may be experienced when shear stress exceeds 720 dyne per cm2 (18![[thin space (1/6-em)]](https://www.rsc.org/images/entities/char_2009.gif) 000 s−1), such as in a left ventricular assist device (LVAD) or a stenotic coronary artery.9,10 Recent work also suggests these three components of white clot formation—platelets, vWF, and high shear stress—also contribute to hemostatic clot formation in arterial bleeds, indicating a shared mechanism between arterial thrombosis and hemostasis.11
000 s−1), such as in a left ventricular assist device (LVAD) or a stenotic coronary artery.9,10 Recent work also suggests these three components of white clot formation—platelets, vWF, and high shear stress—also contribute to hemostatic clot formation in arterial bleeds, indicating a shared mechanism between arterial thrombosis and hemostasis.11
Following endothelial damage, extracellular collagen is exposed providing a thrombogenic surface. Elongated vWF can bind to the exposed collagen and initiate a process known as shear induced platelet aggregation (SIPA).12,13 SIPA is separated into two phases, distinguished by the rate at which platelets are captured. During the initial phase, known as lag time, the platelet capture rate is low.14 Elongated vWF in the plasma binds to a prothrombotic surface, such as collagen. Elongated vWF can also start wrapping around platelets in flow, forming small aggregates which get captured by immobilized vWF.15 Once captured, platelets activate and release vWF from their alpha granules creating a locally high concentration of vWF.16 Platelet activation initiates the second phase of SIPA called rapid platelet accumulation (RPA).17 Platelet activation during SIPA can occur through exposure of platelets to high shear stresses, and is therefore not dependent on exogenous activation factors such as ADP or epinephrine.18 vWF release from platelets kicks off a positive feedback loop where billions of platelets are captured within a matter of minutes, quickly forming an occlusive, stable clot.6 A point-of-care assay for arterial thrombosis should aim to recapitulate these two phases of SIPA in order to accurately reflect the processes of thrombosis and hemostasis.
Anti-platelet drugs
The current standard for managing arterial thrombosis formation is through the administration of anti-platelet drugs, which prevent platelet activation or inhibit platelet–vWF bonds. Common anti-platelets include aspirin, clopidogrel and GPIIb/IIIa inhibitors such as eptifibatide.Aspirin irreversibly inactivates the enzyme cyclooxygenase (COX), which prevents the formation of thromboxane A2 (TXA2), a molecule that promotes platelet activation and aggregation. This reduction in TXA2 slightly inhibits platelet activation and thrombosis.
Clopidogrel is transformed in the liver into an active metabolite which irreversibly inhibits the P2Y12 receptor on platelets. This receptor is part of a signaling pathway linking increased extracellular ADP concentration to platelet activation. As a result, platelet activation from ADP is inhibited. 2-Methylthioadenosine 5′-monophosphate triethylammonium salt hydrate (2MeSAMP), a direct P2Y12 inhibitor, can mimic the effect of clopidogrel in vitro.
Eptifibatide, a small peptide derived from a protein found in the venom of the south-eastern pygmy rattlesnake, reversibly binds to the GPIIb/IIIa receptor on platelets, and prevents it from forming a bond with vWF. Since these bonds are essential to forming a strong bond between activated platelets and vWF, GPIIb/IIIa inhibition has a strong effect on preventing large, occlusive thrombi.
A POC device for arterial thrombosis should measure platelet function generally and therefore be able to detect platelet inhibition from any of the above pathways. The resulting assay could then be used to measure a patient's sensitivity to a specific drug and provide guidance on the optimal dose required to minimize thrombosis risk.
POC devices
Many factors can affect thrombus growth, such as platelet activation, vWF concentration, antiplatelet therapies, and blood viscosity.19–21 Instead of testing each factor individually, a functional test for thrombosis formation would be useful in diagnosing the risk of ischemic events, bleeding dysfunctions in trauma patients and tailoring anti-platelet therapies for individuals. To recreate SIPA, all aspects of the alternative triad need to be incorporated: platelets/vWF, high shear stresses, and thrombotic surface. Existing assays are either missing at least one of these conditions (TEG, ROTEM, GTT), use chemical agonists to artificially stimulate platelets to aggregate (LTA, PFA-100, TEG, ROTEM), or fail to create stable, occlusive clots (T-TAS) (Table 1).| Assay | Assay feature | ||||
|---|---|---|---|---|---|
| High shear | Thrombogenic surface | Platelets/vWF | No chemical agonists | Clots are stable, occlusive | |
| VerifyNow | + | ||||
| PFA-100 | + | + | + | + | |
| T-TAS | + | + | + | + | |
| TEG/ROTEM | + | + | |||
| GTT | + | + | + | ||
| Novel POC device | + | + | + | + | + |
Light transmission aggregometry (LTA) is one of the oldest methods for measuring platelet function. With this method, chemical agonists are added to plasma, causing aggregates to form and settle, increasing the transmittance of the plasma. Chemical activation of platelets differentiates LTA from SIPA. Additionally, LTA experiments are performed in the absence of flow, so these assays fail to have the high shear stresses required for vWF elongation. One of the more common platelet function assays, VerifyNow, works in a similar manner to LTA. In the VerifyNow cartridge, ADP causes platelets to aggregate around fibrinogen coated beads and the light transmittance of the solution changes as a result. VerifyNow runs into the same limitations as LTA; platelet activation is precipitated by chemical agonists and the test is performed in static conditions.22
Platelet function analyzer-100 (PFA-100) is a platelet assay that measures the amount of time required for blood to occlude a collagen-coated hole in a membrane. The shear conditions are not precise as the hole in the cellulose membrane has rough edges. Thus, the high shear conditions are highly variable as shear is proportional to diameter cubed. Prior to flow, blood is activated in the PFA-100 cartridges by the addition of either ADP or epinephrine. The addition of chemical agonists to the blood makes the PFA-100 a useful biochemical platelet activation assay but limits its use as a general SIPA assay.23
Total-thrombosis assessment system (T-TAS) is a newer thrombosis assay resembling a straight channel microfluidic device used in thrombosis research. In the T-TAS, high shear stress causes platelet-rich thrombi to form on a collagen surface. Thrombi occlude multiple parallel channels in the microfluidic device, leading to an increase in fluidic resistance measured as an increase in upstream pressure. The two limitations of T-TAS as a SIPA assay are that 1) a constant flow system drives the blood, so pressures on the clot can reach unphysiologically high values (60 kPa or ∼450 mmHg) and cause the thrombus to cycle between breaking and reforming,24 and 2) the test section dimensions are small enough that surface-adhesion of platelets rivals platelet–platelet growth.25 Additionally, in a system with parallel channels, a constant flow condition can lead to extremely high shear rates in some channels, while others may have close to stagnant conditions as flow is diverted from occluded channel. This means the flows through each of the test channels are not independent and occlusion of one channel can hinder the formation of a stable SIPA clot in a channel that remains patent. The most common T-TAS endpoints are the time to reach a pressure of 10 or 60 kPa and the area under the pressure vs. time curve, neither of which are directly analogous to clinical pathology.
Other clotting assays currently in use are thromboelastography (TEG) and rotational thromboelastometry (ROTEM). TEG/ROTEM works by measuring the force transmitted to a sensor from a rotating cup through a blood sample to identify coagulopathies without the creation of platelet thrombi.22 Coagulation is initiated chemically, and these assays lack the high shear stresses or thrombotic surface required for a SIPA assay.
Other platelet function tests exist, such as the global thrombosis test (GTT). With the GTT a correlation with predicting secondary MACE after a primary event has been demonstrated, but the device forms clots through an unclear mechanism.26 The GTT uses flow over ceramic beads and has been promoted primarily for fibrinolysis measurement.27,28
The goal is to create a functional test for platelet aggregation by incorporating the three critical parameters for SIPA: whole blood, thrombotic surface, and high shear flow.6 The assay had additional design inputs discussed below to ensure that the final product can be used practically. These include geometrical constraints that ensure the formation of occlusive thrombi that are representative of bulk thrombus growth, do not require more than a set maximum amount of blood, and minimize clot embolization to reduce the noise of the assay. By developing a POC test with these features, the aim to create a unique assay of arterial thrombosis that can be used in a variety of clinical situations, such as tailoring antiplatelet therapies to individual patients, stratifying patients into different risk levels for ischemic events, or identifying trauma patients with platelet dysfunctions (Fig. 1).
 | ||
| Fig. 1 SIPA mechanism and novel POC assay. A: Overview of shear induced platelet aggregation. A damage to an atherosclerotic plaque creates a region of high shear with exposed collagen (purple). vWF (yellow) can bind to platelets (white) and adhere to the exposed collagen, forming occlusive thrombi. B: Components of the novel thrombosis assay left: the entire assay with a cartridge inserted and an extra 5 mL vacutainer for scale. Middle: POC cartridge next to glass test section for scale right: glass capillary tube used as test section for thrombus formation. | ||
Design rationale
The type of thrombus that forms in an assay is strongly governed by the device geometry and pump parameters. For platelet aggregation, shear stress must be high enough to create the conditions for vWF to elongate and gather billions of platelets. Shear rate is derived from the velocity profile at the wall and can vary over three orders of magnitude, so is the critical variable. Most historical literature on platelets use shear rate, so we follow this convention. Shear stress is the physically relevant parameter as it relates to the force/unit area on vWF and platelets. Shear stress can be calculated by multiplying the shear rate (s−1) times 0.04 (dyn s cm−2) to get shear stress (dyn cm−2), assuming the viscosity of blood is relatively constant at ∼4 cP. It has been demonstrated that that platelets primarily bind to vWF above 1300 s−1 shear rate.29 The geometric cross-sectional area, flow rate or differential pressure through the test section define the initial shear rate and are therefore critical design inputs.Test section geometry
An important design consideration when developing an occluding test section is the size of the region where clots grow. This parameter will affect many other variables, including the composition of the clot, amount of blood required to form an occlusive clot, the pressures required to achieve sufficient flow, and the test run time. Choosing an appropriate test section size is fundamental to building a point-of-care device for arterial thrombosis. This study focused on circular cross-sections because of the availability of glass tubes in a wide range of sizes.To determine the lower limit for test section radii, work previously published on the geometric design of microfluidic chambers was used.25 Platelets interactions within a thrombus are divided into two categories: platelet–surface interactions that adhere a thrombus to the thrombotic surface and platelet–platelet interactions that form the bulk of a thrombus. One design constraint was that the occlusive thrombi should formed to be primarily composed of platelet–platelet interactions to be representative of large thrombi. The percentage of platelets, Pc, involved in platelet–platelet interactions for a circular cross section is given by eqn (1) assuming that platelets are spherical.25
 | (1) |
 | (2) |
An upper limit for the test section radius is defined by the maximum volume of blood that can be processed by the POC device. A standard venipuncture technique easily allows the collection of 5 mL of blood. Setting a limit of 1 mL per test section enables up to four tests to be conducted in parallel using a single 5 mL vacutainer. Using a computational model of thrombus growth rates, the total volume required to occlude a circular tube of diameter D was calculated.14 For these simulations, it was assumed that flow is driven by a constant pressure head such that the initial shear rate is 10000 s−1. Blood volume necessary for occlusion can be calculated by using the thrombus growth model to compute the change in radius base on the shear stress in the test section, then updating the geometry and iterating.
Driving flow
In addition to test section size, the other main parameter which affects shear rate is the flow rate. One of the main goals in creating a POC device that mimics arterial thrombosis is to generate high shear stresses in the blood similar to those present in an arterial stenosis.6 While shear stress is the force that causes vWF to elongate, shear rate is widely used with the assumption of an average blood viscosity of 3.5 cP for all modeling, appropriate for simple geometries, like with circular cross section.30 Shear rates around an atherosclerotic plaque can span multiple orders of magnitude from ∼1000 s−1 to ∼100000 s−1. However, clot growth occurs fastest in the range of 10000 to 30000 s−1, so the shear rate through the entire test section was designed to stay within this range.31 Unlike the microfluidic device previously used by the lab, the POC test section does not have a constriction to limit growth to a certain location. Our prior work in a variety of microfluidic dimensions found the primacy of shear rate magnitude over shear rate gradients.32
With the current design, flow is driven using a constant pressure system. This was chosen based on a review of current platelet function tests and research microfluidics. In these systems, devices that drive flow using a constant flow system have a difficult time forming large occlusive, stable clots. As a clot forms, pressures on the clot can increase to unphysiologically high levels and cause the clot to blow out. The embolization is a stochastic, noisy process and impedes the formation of an occlusive clot. In contrast, with a constant pressure system as the clot forms and resistance increases in the POC device, the flow rate decreases. To ensure consistent pressures, a vacuum pump was used and pressure measurements were taken during tests where water and blood were drawn through the test section of the device.
When forming clots in the 200 μm diameter glass tube, it was observed that while platelet aggregation occurs throughout the length of the tube, the occlusive clot is typically in the first 1 mm section at the entrance of the tube. The system can therefore be simplified into a model with two fluid resistors in series where one is variable (representing the occlusive portion of the test section) and the other is fixed (representing the remainder of the test section). As the resistance of the variable resistor increases, the total resistance of the system also increases, though at a slower rate. This results in a rise in shear rate within the variable resistance section. The magnitude of this increase depends on the ratio of the variable resistance to the fixed resistance. To investigate this behavior, a previously described computational model of arterial thrombosis was adapted to simulate a constant pressure system with two resistors in series.14 The model numerically calculates thrombus evolution assuming uniform growth. Briefly, the model calculates the shear through a circular test section, estimates the thrombus growth rate from an equation fit to empirical data, and updates the geometry at each 0.1 ms time step. At each time step the model can provide the current wall shear rate, flow rate and thrombus height.
Choosing an assay end point
The research assay that forms the basis of the novel POC device has an intra-assay variability of ∼10%. To improve intra-assay variability, outcomes from multiple test sections can be averaged. To determine how many test sections to include in a single cartridge, a variability analysis was run. Accordingly, a Monte-Carlo simulation was performed to estimate the impact of the number of test sections on cartridge variability.Choice of endpoint plays a large role in intra-assay variability. In the microfluidic assay, mass flow rates through the stenotic sections were determined using mass balances. This mass measurement is a noisy endpoint and impractical for the flow rates used in the novel POC cartridge. Instead, a new endpoint was developed, called end volume (EV). EV is defined as the total amount of blood which passes through the test section prior to occlusion. Unlike mass flow rates, measuring EV does not require constant monitoring; a test can be started and then read any time after flow has ceased. Additionally, by providing markings on the transparent cartridge, EV can be simply read off by the user. To validate that EV is a good proxy for occlusion time, data from the microfluidic assay was used to calculate the fit between the two.33
Experimental methods
Device construction
The device was constructed from four test sections (straight glass capillary tubes (Accu-Glass), collagen coated (Chrono-log)), a 3D printed cartridge that collects the blood passed through the test sections and connects the test sections to the vacuum pump (Elegoo Mars, Clear Elegoo Resin), and a custom-built, reusable vacuum pump. Test sections were assessed both individually and as part of a final cartridge.Capillary diameter measurements
Diameter of glass capillary tubes was measured using a dissecting microscope (Zeiss STEMI 2000-C), a microscope stage micrometer and ImageJ. After taking images down the lumen of 25 capillary tubes, ImageJ was used to determine the diameter of a circle which best approximated the dimensions of the capillary tube lumen.Device vacuum measurements
Vacuum strength of the point of care device was measured using a built-in pressure sensor (BMP180). After turning the POC device on, pressure measurements were recorded as the desired vacuum was created. The test cartridge was kept out of the solution for roughly 30 seconds to determine vacuum stability in air, then it was placed in either blood or a 40% glycerol solution for at least 90 seconds.Blood draw and handling
Blood was drawn from healthy adult volunteers using standard venipuncture techniques under a Georgia Institute of Technology Institutional Review Board (IRB) approved protocol (H17315). All experiments were performed in accordance with the guidelines of the Georgia Institute of Technology IRB and experiments were approved by the IRB at Georgia Institute of Technology. Informed consent was obtained from all human participants of this study. Using a ¾′′ 21G needle (BD), blood was slowly drawn into a 50 mL syringe containing 3.5 IU mL−1 sodium heparin (Fisher Bioreagents).32 Additional blood was collected into a separate 2 mL vacutainer containing EDTA (BD) for running the complete blood count (CBC). All experiments were performed within 4 h of the blood draw.Antiplatelet effects
Up to 16 individual test sections were tested simultaneously using tubing to connect the test sections to a single vacuum pump. Four test sections were placed in a single 15 mL conical vial containing 10 mL of blood. Five conditions were tested to measure the spread of endpoints in the healthy population and determine the assay's sensitivity to antiplatelet therapies known to reduce MACE. For each of 10 individuals, 12 test sections were run on untreated whole blood. For antiplatelet treatments, acetyl-salicylic acid (ASA) and 2-methylthioadenosine 5′-monophosphate triethylammonium salt hydrate (2MeSAMP) were used to model aspirin and clopidogrel, while eptifibatide was used as a positive control. All antiplatelet drugs were sourced from Fisher Scientific. Antiplatelet drugs were added through the addition of 0.1 mL of concentrated solution to 9.9 mL of whole blood to achieve a final concentration of 0.02 mg mL−1 ASA, 50 μM 2MeSAMP or 2 μM eptifibatide. 2MeSAMP and eptifibatide concentrations were chosen based on previous literature and the ASA concentration was chosen to mimic a realistic clinical dose.34,35 All antiplatelet treatments were allowed to incubate in the blood for 40 minutes, a time based on the reaction half-life of ASA in blood. Additionally, to account for any effects of dilution or the time from the blood draw to testing, a 10 mL sample of whole blood diluted with 0.1 mL PBS was run at the same time as all antiplatelet treatments. The total volume of blood drawn through the test section prior to occlusion was defined as the End Volume. Test sections that did not occlude with >1.6 mL of blood were stopped.Comparison with PFA-100
For comparison with the PFA-100 (Siemens Healthcare), control novel POC test sections were run on the setup described above. The collagen/ADP and collagen/epinephrine PFA-100 assays (Siemens Healthcare) were performed per manufacturer instructions. Each assay was repeated until 2 measurements were taken for each type of assay. The comparison study was run using a sample of 6 human subjects.Statistics
Statistical analyses were performed to assess differences in end volume (EV) measurements, evaluate correlations between the novel POC device and PFA-100, and analyze the impact of antiplatelet agents. The control population's EV distribution was assessed for skewness using the Fisher–Pearson coefficient to evaluate deviations from normality. Because of the skewed distribution of the control population, comparisons of mean EV values between the control and antiplatelet conditions were conducted using a non-parametric Wilcoxon test, with a Bonferroni correction. When comparing untreated controls and antiplatelet agents, normalized EV values were also used to account for inter-individual variability.Linear correlation analysis was used to evaluate the relationship between EV measurements obtained from the novel POC device and PFA-100 assays, with r2 values reported.
Statistical significance was set at p < 0.0125 for all analyses, and variability between assays was expressed as coefficients of variation.
Design results
Test section geometry
To ensure that 90% of platelet interactions within the formed thrombus are platelet–platelet interactions (Pc of 0.9), the test section diameter should be at least 78 μm (Fig. 2A). From computational modeling it was determined that a test section with a diameter of 228 μm is expected to require 1.0 mL of blood to form an occlusive clot. The combination of these two limits provides a relatively narrow window of ideal diameters for a test section forming large, occlusive, stable thrombi: from 78–228 μm (Fig. 2A). | ||
| Fig. 2 Geometric constraints for cylindrical occluding test sections. A: Creation of bulk thrombi (>90% platelet–platelet interactions, solid line) with <1 mL of blood (total blood used, dashed line) constrains the potential diameters of the test section to a narrow window, 78–228 μm. B: Manufactured glass capillary tubes have a tight range of inner diameters which fits within the defined window of acceptable diameters. | ||
Capillary tubes with a diameter of 200 μm were chosen to be used in the POC test section. The capillary tubes were made of glass, known to absorb collagen and create a surface that promotes vWF attachment and arterial thrombosis.36,37 The diameters of the capillary tubes was verified to be within 199.5 and 202.5 μm using optical measurements with an average of 200.90 ± 0.61 μm (Fig. 2B).
Pressure system
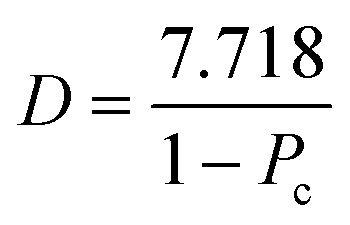
The vacuum device was observed to reach and maintain a vacuum pressure of ∼−70 hPa (−52 mmHg) within 10 seconds and maintain vacuum pressure when either air, glycerol or blood was drawn through the test section (Fig. 3A).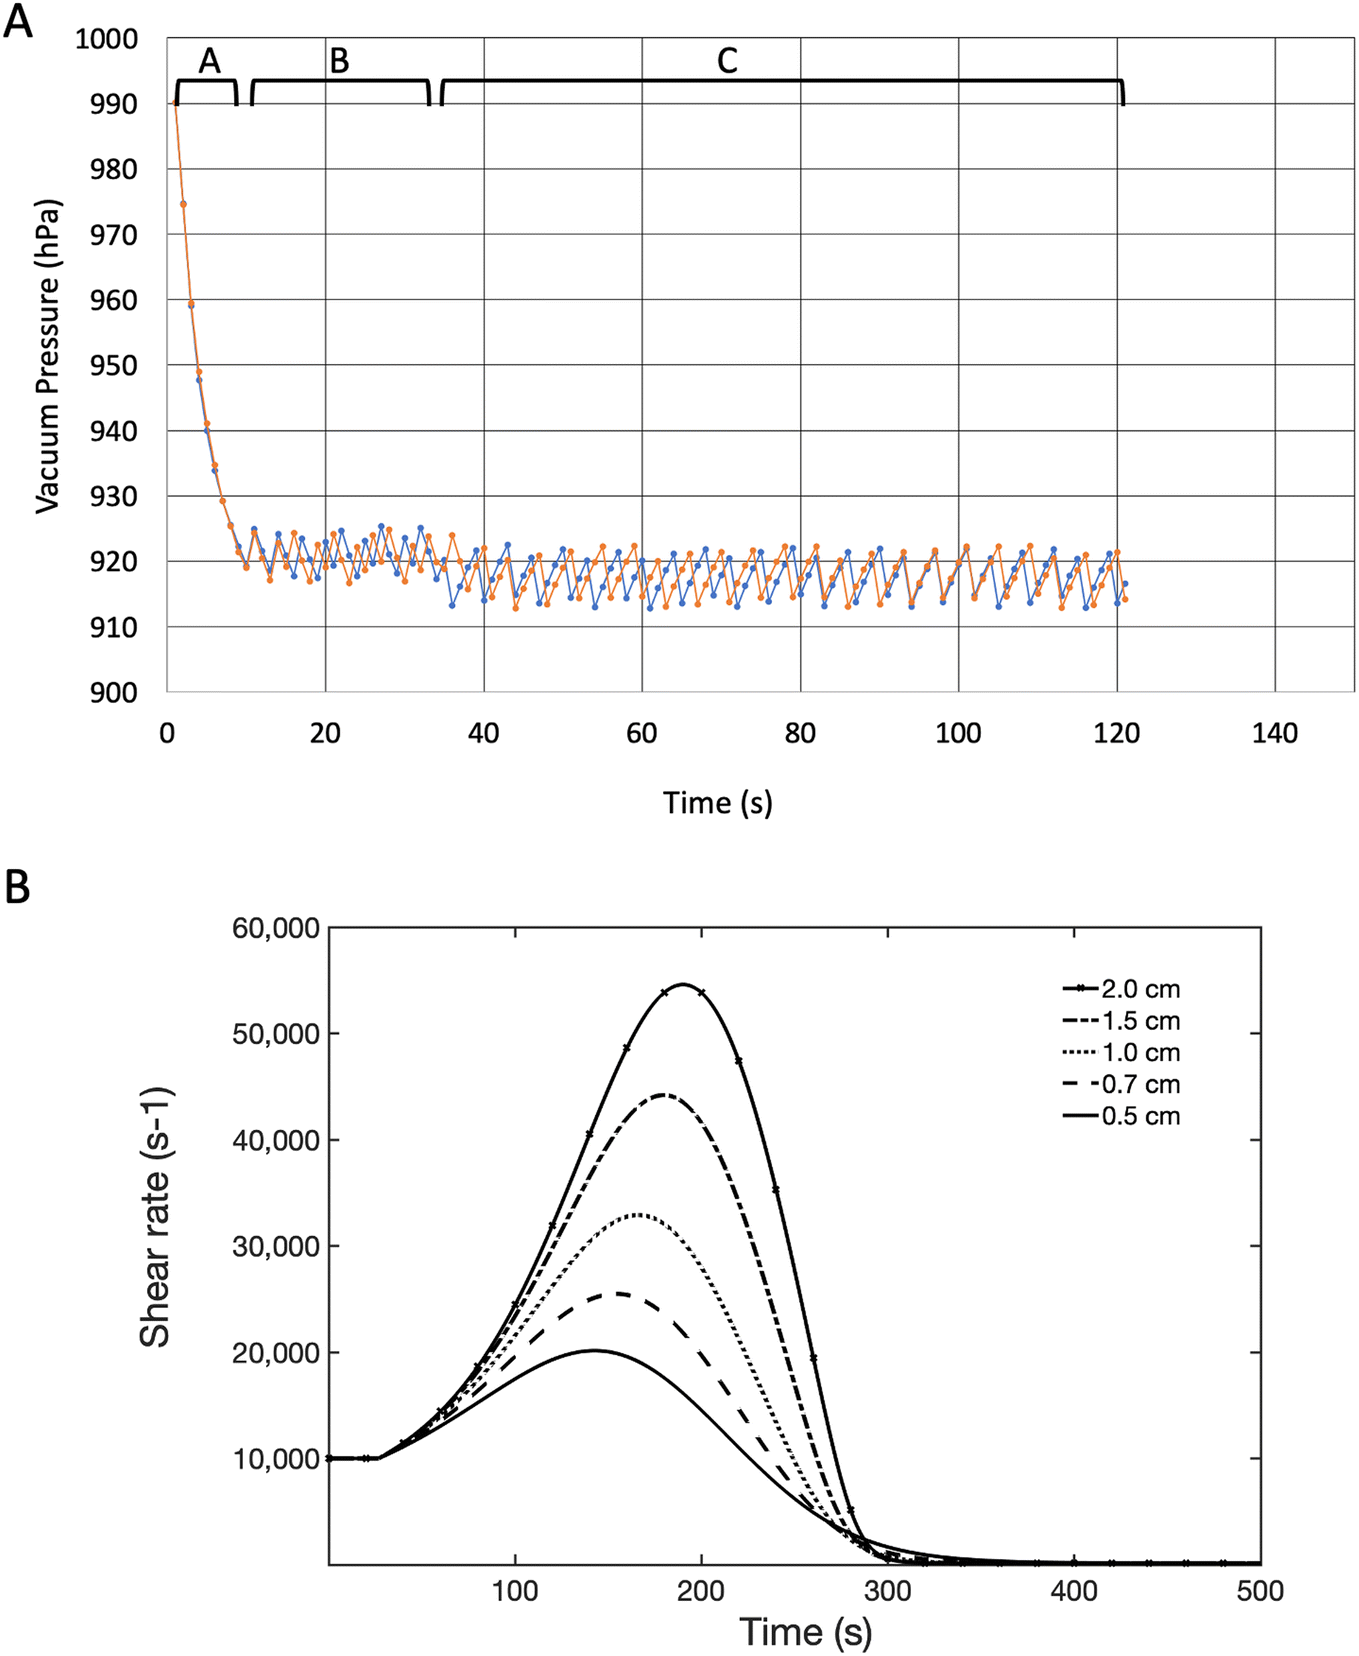 | ||
| Fig. 3 Achieving proper shear rate. A: Pressure dynamics during vacuum creation, with region A showing the time required to achieve a −70 hPa vacuum, region B showing pressure variability when the test section is in air, and region C displaying pressure measurements when the test section is filled with liquid. Measurements with blood (blue trace) and a 40% glycerol solution (orange trace) confirm acceptable levels of pressure variability. B Using computational modelling to predict shear rate evolution in a glass tube with a 1 mm section where the occlusive clot forms. By shortening test sections, the peak in shear rates (and associated shear stresses) on the forming clot is reduced because the increase in resistance from clotting has a higher effect on the total resistance of the system. The legend represents the total length of the circular test section. | ||
Test section length
In a 2.0 cm long test section where the occlusive clot forms in the first 1 mm, shear rates in the clotting section can reach 5× their initial value, outside of the ideal range of 10000 to 30000 s−1. Previous work suggests a minimum test length of 100 μm is necessary for SIPA.15 Using the clot growth model described above, the peak in shear rates observed in a constant pressure system are reduced when the total length of the glass test section is shortened (Fig. 3B). Therefore, tubes were cut to a length of 0.7 cm to keep shear rates between 10000–30000 s−1.
Assay endpoint
From a Monte-Carlo simulation, a significant decrease in intra-assay variability is seen by incorporating 4 test sections, but there are diminishing improvements in intra-assay variability after adding more than 4 sections (Fig. 4A). Since blood volume scales linearly with the number of test sections, the cartridge was designed to incorporate 4 test sections. | ||
| Fig. 4 Generating a consistent end point. A: Given the initial assessment of 10% variability within individual test sections, including 4 test sections significantly reduces inter-assay variability. B: Using data from the research microfluidic chip, a high correlation between occlusion time and end volume measurements is observed (y = 379.6x + 12, r2 = 0.883, n = 83). | ||
When graphing occlusion time (OT) vs. end volume (EV), the r2 value for the correlation is 88.3%, indicated a strong correlation between EV and OT (Fig. 4B). This justifies moving forward with using End Volume as an endpoint for arterial thrombosis.
Experimental results
Control population
Normal values for individual test section end volumes (EV) ranged from 0 to 1.8 mL (N = 120) with a median value of 0.54 mL and an IQR of 0.29 mL. The distribution skewed towards higher values with a Fisher–Pearson coefficient of skewness of 1.399. Because of these high values, the population could be modelled as a mix of two binomial distributions, one with a mean of 0.48 mL, a standard deviation of 0.12 mL and a probability of 0.62 and another with a mean of 0.92, a standard deviation of 0.39 and a probability of 0.38 (Fig. 5). Despite the wide range of normal values, none of the individuals tested reported having known bleeding or clotting problems. | ||
| Fig. 5 Control end volume distribution. Distribution of the control endpoints is bimodal, with the bulk of individuals having an average EV of 0.48 mL. Some individuals presented with higher end volumes, roughly twice as high with an average of 0.92 mL. | ||
Comparison with PFA-100
To verify that the novel point-of-care device provides a unique measurement compared to existing platelet function tests, results of PFA-100 cartridges were compared to results of the novel assay. For 6 donors, 12× novel POC test sections, 2× PFA-100 collagen/ADP cartridge (Col/ADP) and 2× PFA-100 collagen/epinephrine (Col/Epi) tests were performed. Average and standard deviations of the tests are then compared. For both Col/ADP and Col/Epi, r2 values were less than 0.15, indicating that there is no strong correlation between the PFA-100 values and the novel POC device (Fig. 6). The average PFA-100 variability was 11% and 15% for the Col/ADP (Fig. 6A) and Col/Epi cartridges respectively (Fig. 6B), whereas, the novel POC variability was 13%. | ||
| Fig. 6 Comparison with PFA-100. A: Col/ADP measurements and novel POC EV measurements are not correlated, r2 = 0.06. B: Col/EPI measurements and novel POC EV measurements are not correlated, r2 = 0.14. | ||
Antiplatelet effects
The point-of-care device can detect changes in high-shear platelet aggregation. Changes in end volume (EV) after dosing the blood with ASA, 2MeSAMP and eptifibatide were measured. ASA and 2MeSAMP were chosen to mimic the effects of common antiplatelet drugs aspirin and clopidigrel, respectively. Following treatment with ASA, average end volumes increased 36% from 0.651 mL to 0.888 mL (p < 0.0001). With 2MeSAMP the average end volume was 52% higher than the control at 0.987 mL (Fig. 7A, p < 0.0001). The majority of tests run with eptifibatide did not occlude during the experiment, using the entire 8 mL of blood (p < 0.0001). To separate out the effect of antiplatelets on each patient, EVs for ASA and 2MeSAMP for each patient were normalized by their control average EV. ASA led to a 57% increase in end volume and 2MeSAMP led to a 65% increase in EV (Fig. 7B, p < 0.0001). | ||
| Fig. 7 Effect of antiplatelet agents on assay endpoints. A: End volume measurements for all testing conditions. ASA and 2MeSAMP show 36% and 52% increases in EV respectively. With eptifibatide, a majority of assays did not occlude and ran out of blood around 1.75–2 mL. B: Effect of ASA and 2MeSAMP on EV, highlighted by normalizing antiplatelet EVs to each individual's average control EV. ASA mean is 57% higher than control and the 2MeSAMP mean is 65% higher than control (* p < 0.0001). | ||
Discussion
A new point-of-care assay for occlusive thrombosis was designed to recreate the arterial thrombosis triad of a high shear condition, a thrombotic surface, and presence of platelets and vWF. A test section with a radius between 78–228 μm and a length between 100 μm and 1 cm formed large, stable clots on fibrillar collagen without the need for biological agonists. The constant pressure system provided well-defined initial shear rates ranging from 10000–30000 s−1 and the novel endpoint of end volume (EV) was shown to be intuitive and robust. The assay was shown to detect variations in a healthy population, as indicated by the bimodal distribution, and may correspond to sub-pathological populations. This separation of populations may allow clinicians to identify high-risk individuals prior to a primary event. Additionally, significant increases in EV with ASA and 2MeSAMP and the inability of clots to form with eptifibatide shows that the assay was sensitive to antiplatelet use. The clinical information provided by the POC is different from the PFA-100, with a lack of correlation between PFA-100 and EV measurements (r2 < 0.15).
Potential clinical uses
Since thrombosis plays a critical role in thrombosis and bleeding, multiple populations are expected to benefit from the novel POC test. One potential use case is in determining an individual's response to antiplatelet therapy. As in the experiment above, a patient's blood could be dosed with antiplatelets such as aspirin and 2MeSAMP to determine the appropriate dose for each patient. This could identify patients who respond to ASA or Plavix. Non-responders could then avoid these treatments and not expose themselves to the risks of major bleeding. The novel POC device could be used to predict the risk of secondary MACE after a primary event. The assay could stratify patients into different risk levels and identify a subpopulation that require additional antiplatelet/anti-vWF therapies to reduce the risk of MACE. Other patients with increased risk of thrombosis, such as patients with peripheral arterial disease or AV fistulas may benefit from similar testing.Another population that could benefit from screening with the novel device is trauma patients. Arterial bleeding involves high shear rates and untreated hemostatic clots likely form through a hemodynamic process similar to arterial thrombosis.11 Trauma patients often have platelet dysfunctions leading to bleeding pathologies.38 Using the assay to determine whether a platelet dysfunction exists and in coordination with coagulation assays, may help guide physicians on which blood products (platelets, cryoprecipitate) to give patients. This population may also have significantly altered blood due to resuscitation fluids and testing the sensitivity of the novel assay to blood dilution would be important for a future study.
The novel assay is different from other commercially available platelet assays. It has previously been shown that platelet-rich thrombi aggregate by elongated vWF under high shear conditions at a very high rate of growth that correlates with clinical thrombosis.39 As noted above, this study's results do not correlate with the PFA-100 and this is likely due to both differing geometries and the absence of chemical agonists in the novel POC. The assay was designed to avoid issues with previous platelet function assays by avoiding chemical activation, ensuring high shear conditions, and designing test section geometry to model large, stable, occlusive clots.
Limitations
This initial study in a control population highlights that a healthy population can include people with a wide range of thrombotic tendencies, likely due to variations in vWF. While a small sample from a healthy population is appropriate for a proof-of-concept study, future studies are necessary to investigate typical EV values for diverse and pathological populations. The normal population naturally exhibits a wide spread of values for collagen LTA and vWF:Ag, both with a population coefficient of variation (CV) of ∼40%.40,41 The large population CV measured with the novel assay may lead to a large overlap between healthy and pathological ranges, and make defining a “good” cutoff value for the endpoint of EV difficult. This would decrease the sensitive and specificity of the assay. However, large effects on thrombus formation are still distinguishable. For example, one could interpret that trauma patients with EV values below 1.2 mL maintain functioning platelets that can protect against traumatic hemorrhage while large high EV would suggest that uncontrolled bleeding despite normal PT and PTT values, may be from poor platelet aggregation. Another use may be to titrate anti-platelet therapies to an EV level of >2 mL. Patients with naturally occurring EV values greater than 1.2 mL may not benefit from additional anti-platelet therapy given the attendant risk of major bleeding. Additionally, when measuring the effect of antiplatelet drugs, normalizing to an untreated control from the same patient could address the variability in normal population endpoints. Clinical trials for each of these populations are the next steps towards proving the usefulness of the novel POC. Future studies may also incorporate additional clinical characteristics such as vWF:Ag levels, history of thrombotic events, and age into a combined thrombosis score to stratify patients and improve cutoff thresholds. Finally, we note that the comparator used in this study, the PFA-100, is not used at the point-of-care. Thus, in the future, it will be useful to compare the performance of the technique introduced here with commercially available tools that are used at the POC, like VerifyNow or TEG.Conclusion
This paper documents the transformation of a complex research laboratory microfluidic test into a simple POC assay that could be used in a clinical setting. The test section, method of driving flow, and the measured endpoint were all redesigned to become a scalable POC test. By basing the novel assay on the triad for SIPA formation, arterial thrombi were formed without the need for exogenous chemical activation. Choosing a properly-sized test section ensured that the resulting clot is representative of larger clots while minimizing blood volume requirements. A constant pressure system and a short test section reduced end point variation. The resulting assay provides a new measurement of SIPA thrombosis potential from whole blood in minutes. This system was validated by characterizing thrombogenicity in a healthy population, without and with antiplatelet treatment.Data availability
Data for this article are available at the GT Digital Repository at https://hdl.handle.net/1853/76724.Author contributions
C. A. B.: conceptualization, methodology, investigation, formal analysis, writing – original draft. V. C.: conceptualization, methodology, investigation, writing – review & editing. D. N. K.: conceptualization, methodology, writing – review & editing, supervision.Conflicts of interest
C. A. B., V. C., and D. N. K. are listed as inventors on a patent application related to the technology described in the manuscript, PCT/US2024/027245.Acknowledgements
This research was supported by Lawrence P. Huang Funds from the Georgia Institute of Technology. This work was supported by Georgia Tech's Institute for Matter and Systems Micro/Nano Fabrication Facility.References
- A. N. Nowbar, M. Gitto, J. P. Howard, D. P. Francis and R. Al-Lamee, Mortality from ischemic heart disease: Analysis of data from the world health organization and coronary artery disease risk factors from NCD risk factor collaboration, Circ. Cardiovasc. Qual. Outcomes, 2019, 12(6), 1–11, DOI:10.1161/CIRCOUTCOMES.118.005375.
- X. Jiaquan, L. M. Sherry, D. K. Kenneth and A. Elizabeth, Deaths: Final Data 2019, Natl. Vital Stat. Rep., 2021, 70(8), https://www.cdc.gov/nchs/data/nvsr/nvsr70/nvsr70-09-508.pdf%0Ahttps://www.cdc.gov/nchs/nvss/leading-causes-of-death.htm#publications Search PubMed.
- K. E. Kip, K. Hollabaugh, O. C. Marroquin and D. O. Williams, The Problem With Composite End Points in Cardiovascular Studies. The Story of Major Adverse Cardiac Events and Percutaneous Coronary Intervention, J. Am. Coll. Cardiol., 2008, 51(7), 701–707, DOI:10.1016/j.jacc.2007.10.034.
- S. Sidney, C. P. Quesenberry, M. G. Jaffe, M. Sorel, A. S. Go and J. S. Rana, Heterogeneity in national U.S. mortality trends within heart disease subgroups, 2000-2015, BMC Cardiovasc. Disord., 2017, 17(1), 1–10, DOI:10.1186/s12872-017-0630-2.
- O. M. Mereuta, R. Rossi and A. Douglas, et al., Characterization of the ‘White’ Appearing Clots that Cause Acute Ischemic Stroke, J. Stroke Cerebrovasc. Dis., 2021, 30(12), 1–8, DOI:10.1016/j.jstrokecerebrovasdis.2021.106127.
- L. D. C. Casa, D. H. Deaton and D. N. Ku, Role of high shear rate in thrombosis, J. Vasc. Surg., 2015, 61(4), 1068–1080, DOI:10.1016/j.jvs.2014.12.050.
- J. P. Möller, S. Mielke and A. Löf, et al., Force sensing by the vascular protein von Willebrand factor is tuned by a strong intermonomer interaction, Proc. Natl. Acad. Sci. U. S. A., 2016, 113(5), 1208–1213, DOI:10.1073/pnas.1516214113.
- H. Fu, Y. Jiang, D. Yang, F. Scheiflinger, W. P. Wong and T. A. Springer, Flow-induced elongation of von Willebrand factor precedes tension-dependent activation, Nat. Commun., 2017, 8, 324, DOI:10.1038/s41467-017-00230-2.
- B. P. Selgrade and G. A. Truskey, Computational Fluid Dynamics Analysis to Determine Shear Stresses and Rates in a Centrifugal Left Ventricular Assist Device, Artif. Organs, 2012, 36(4), 89–96, DOI:10.1111/j.1525-1594.2011.01416.x.
- J. Strony, A. Beaudoin, D. Brands and B. Adelman, Analysis of shear stress and hemodynamic factors in a model of coronary artery stenosis and thrombosis, Am. J. Physiol., 1993, 265(5), H1787–H1796, DOI:10.1152/ajpheart.1993.265.5.h1787.
- A. A. Yakusheva, K. R. Butov and G. A. Bykov, et al., Traumatic vessel injuries initiating hemostasis generate high shear conditions, Blood Adv., 2022, 6(16), 4834–4846, DOI:10.1182/bloodadvances.2022007550.
- D. M. Wootton, C. P. Markou, S. R. Hanson and D. N. Ku, A mechanistic model of acute platelet accumulation in thrombogenic stenoses, Ann. Biomed. Eng., 2001, 29(4), 321–329, DOI:10.1114/1.1359449.
- H. Schmid-Schonbein, J. V. Gosen, G. Heinich, H. Klose and E. Volger, A Counter-Rotating “Rheoscope Chamber” for the Study of the Microrheology of Blood Cell Aggregation by Microscopic Observation and Microphotometry, Microvasc. Res., 1973, 6, 366–376 CrossRef CAS PubMed.
- M. Mehrabadi, L. D. C. Casa, C. K. Aidun and D. N. Ku, A Predictive Model of High Shear Thrombus Growth, Ann. Biomed. Eng., 2016, 44(8), 2339–2350, DOI:10.1007/s10439-016-1550-5.
- Z. L. Liu, C. Bresette, C. K. Aidun and D. N. Ku, SIPA in 10 milliseconds: VWF tentacles agglomerate and capture platelets under high shear, Blood Adv., 2022, 6(8), 2453–2465, DOI:10.1182/bloodadvances.2021005692.
- P. J. Wellings and D. N. Ku, Mechanisms of Platelet Capture Under Very High Shear, Cardiovasc. Eng. Technol., 2012, 3(2), 161–170, DOI:10.1007/s13239-012-0086-6.
- D. A. Kim, K. J. Ashworth, J. Di Paola and D. N. Ku, Platelet α-granules are required for occlusive high-shear-rate thrombosis, Blood Adv., 2020, 4(14), 3258–3267, DOI:10.1182/bloodadvances.2020002117.
- H. Shankaran, P. Alexandridis and S. Neelamegham, Aspects of hydrodynamic shear regulating shear-induced platelet activation and self-association of von Willebrand factor in suspension, Blood, 2003, 101(7), 2637–2645, DOI:10.1182/blood-2002-05-1550.
- L. D. C. Casa, S. E. Gillespie, S. L. Meeks and D. N. Ku, Relative Contributions of von Willebrand Factor and Platelets in High Shear Thrombosis, J. Hematol. Thromboembolic Dis., 2016, 4(4), 4–11, DOI:10.4172/2329-8790.1000249.
- L. Herfs, F. Swieringa and N. Jooss, et al., Multiparameter microfluidics assay of thrombus formation reveals increased sensitivity to contraction and antiplatelet agents at physiological temperature, Thromb. Res., 2021, 203, 46–56, DOI:10.1016/j.thromres.2021.04.014.
- A. P. Spann, J. E. Campbell and S. R. Fitzgibbon, et al., The Effect of Hematocrit on Platelet Adhesion: Experiments and Simulations, Biophys. J., 2016, 111(3), 577–588, DOI:10.1016/j.bpj.2016.06.024.
- R. Paniccia, R. Priora, A. A. Liotta and R. Abbate, Platelet Function tests: A Comparative Review, Vasc. Health Risk Manage., 2015, 11, 133–148, DOI:10.2147/VHRM.S44469.
- D. A. Gorog and Y. H. Jeong, Platelet function tests: Why they fail to guide personalized antithrombotic medication, J. Am. Heart Assoc., 2015, 4(5), 1–9, DOI:10.1161/JAHA.115.002094.
- R. Al Ghaithi, J. Mori and Z. Nagy, et al., Evaluation of the Total Thrombus-Formation System (T-TAS): application to human and mouse blood analysis, Platelets, 2019, 30(7), 893–900, DOI:10.1080/09537104.2018.1535704.
- L. D. C. Casa and D. N. Ku, Geometric design of microfluidic chambers: Platelet adhesion versus accumulation, Biomed. Microdevices, 2014, 16(1), 115–126, DOI:10.1007/s10544-013-9811-7.
- S. Saraf, C. Christopoulos, S. I. Ben, D. J. Stott and D. A. Gorog, Impaired Endogenous Thrombolysis in Acute Coronary Syndrome Patients Predicts Cardiovascular Death and Nonfatal Myocardial Infarction, J. Am. Coll. Cardiol., 2010, 55(19), 2107–2115, DOI:10.1016/j.jacc.2010.01.033.
- J. Yamamoto, N. Inoue, K. Otsui, H. Ishii and D. A. Gorog, Global Thrombosis Test (GTT) can detect major determinants of haemostasis including platelet reactivity, endogenous fibrinolytic and thrombin generating potential, Thromb. Res., 2014, 133(5), 919–926, DOI:10.1016/j.thromres.2014.02.018.
- R. Kanji, J. Kubica, E. P. Navarese and D. A. Gorog, Endogenous fibrinolysis—Relevance to clinical thrombosis risk assessment, Eur. J. Clin. Invest., 2021, 51(4), 1–11, DOI:10.1111/eci.13471.
- W. P. M. Houdijk, P. G. De Groot, P. F. E. M. Nievelstein, K. S. Sakariassen and J. J. Sixma, Subendothelial Proteins and Platelet Adhesion: von Willebrand Facotr and Fibronectin, Not Thrombospondin, Are Involved in Platelet Adhesion to Extracellular Matrix of Human Vascular Endothelial Cells, Arterioscler. Thromb. Vasc. Biol., 1985, 6(1), 24–33 Search PubMed.
- S. J. Hund, M. V. Kameneva and J. F. Antaki, A Quasi-Mechanistic Mathematical Representation for Blood Viscosity, Fluids, 2017, 2(1), 10, DOI:10.3390/fluids2010010.
- D. L. Bark, A. N. Para and D. N. Ku, Correlation of thrombosis growth rate to pathological wall shear rate during platelet accumulation, Biotechnol. Bioeng., 2012, 109(10), 2642–2650, DOI:10.1002/bit.24537.
- M. T. Griffin, D. Kim and D. N. Ku, Shear-induced platelet aggregation: 3D-grayscale microfluidics for repeatable and localized occlusive thrombosis, Biomicrofluidics, 2019, 13(5), 054106, DOI:10.1063/1.5113508.
- M. T. Griffin, High Shear Arterial Thrombosis: Microfluidic Diagnositics and Nanotherapeutics, PhD Thesis, Georgia Institute of Technology, 2020 Search PubMed.
- M. Li, N. A. Hotaling, D. N. Ku and C. R. Forest, Microfluidic Thrombosis under Multiple Shear Rates and Antiplatelet Therapy Doses, PLoS One, 2014, 9(1) DOI:10.1371/journal.pone.0082493.
- A. N. Para, Preventing Rapid Platelet Accumulation Under Very High Shear Stress, PhD Thesis, Georgia Institute of Technology, 2012 Search PubMed.
- F. I. Pareti, Y. Fujimura, J. A. Dent, L. Z. Holland, T. S. Zimmerman and Z. M. Ruggeri, Isolation and characterization of a collagen binding domain in human von Willebrand factor, J. Biol. Chem., 1986, 261(32), 15310–15315, DOI:10.1016/s0021-9258(18)66869-3.
- B. P. Nuyttens, T. Thijs, H. Deckmyn and K. Broos, Platelet adhesion to collagen, Thromb. Res., 2011, 127(SUPPL. 2), S26–S29, DOI:10.1016/S0049-3848(10)70151-1.
- P. Vulliamy, S. J. Montague and S. Gillespie, et al., Loss of GPVI and GPIbα contributes to trauma-induced platelet dysfunction in severely injured patients, Blood Adv., 2020, 4(12), 2623–2630, DOI:10.1182/bloodadvances.2020001776.
- L. D. C. Casa, D. H. Deaton and D. N. Ku, Role of high shear rate in thrombosis, J. Vasc. Surg., 2015, 61(4), 1068–1080, DOI:10.1016/j.jvs.2014.12.050.
- M. V. Chan, M. H. Chen and T. Barwari, et al., Platelet reactivity in individuals over 65 years old is not modulated by age, Circ. Res., 2020, 127(3), 394–396, DOI:10.1161/CIRCRESAHA.119.316324.
- Z. Wang, M. Dou, X. Du, L. Ma, P. Sun, H. Cao, S. Ye, P. Jiang, F. Liu, F. Lin, R. Zhang and C. Li, Influences of ABO blood group, age and gender on plasma coagulation factor VIII, fibrinogen, von Willebrand factor and ADAMTS13 levels in a Chinese population, PeerJ, 2017, 30(5) DOI:10.7717/peerj.3156.
| This journal is © The Royal Society of Chemistry 2025 |