DOI:
10.1039/D4LC00968A
(Paper)
Lab Chip, 2025,
25, 2620-2631
Vascular architecture-on-chip: engineering complex blood vessels for reproducing physiological and heterogeneous hemodynamics and endothelial function†
Received
17th November 2024
, Accepted 24th February 2025
First published on 5th March 2025
Abstract
Human circulation exhibits significant diversity and heterogeneity of blood vessel shapes. The complex architecture of these vessels may be physiological or pathological resulting in unique hemodynamics and endothelial cell phenotypes that may determine the regulation and alteration of cell signaling pathways and vascular function. While human microphysiological systems of blood vessels (vessel-chips) have mimicked several aspects of vascular pathophysiology, engineering of these tools is still limited to the fabrication of homogeneous tubular structures, especially when living endothelial cell culture is also included. Here, a common unifying approach based on gravitational lumen patterning (GLP) is presented to create non-uniform, living 3D and closed vascular lumens embedded in a collagen matrix and lined with endothelial cells, resulting in reproduction of the architecture of straight vessels, stenosis, bifurcations, aneurysms and tortuous vessels. Upon blood perfusion, these systems reveal the nature of altered flow dynamics and corresponding endothelial cell morphology. These vessel-chips closely mimic the structural variations and resulting endothelial responses often observed in vivo and may be used to investigate vascular complications like aortic and cerebral aneurysm, arterial tortuosity syndrome, atherosclerosis, carotid artery disease, etc., where architecture plays a crucial role in disease onset and progression.
Introduction
The human vascular system is a network of a variety of distinct vessels that include arteries, capillaries, and veins.1 These vascular structures display significant diversity in shape and architecture. For example, within the vasculature, vessels also exhibit heterogeneous architectures such as stenosis, branching, tortuosity, and aneurysm, either in a state of health or pathology2–5 (Fig. 1A). The complex structures of these vessels are correlated with unique hemodynamics and influence on the flow parameters including velocity, flow resistance, pressure, shear stress, etc.3,4 These altered flow behaviors directly affect local mechanobiology and cell morphologies resulting in significant and distinct endothelial cell phenotypes,6–8 including activation, coagulation and innate immune responses that are spatially heterogeneous.
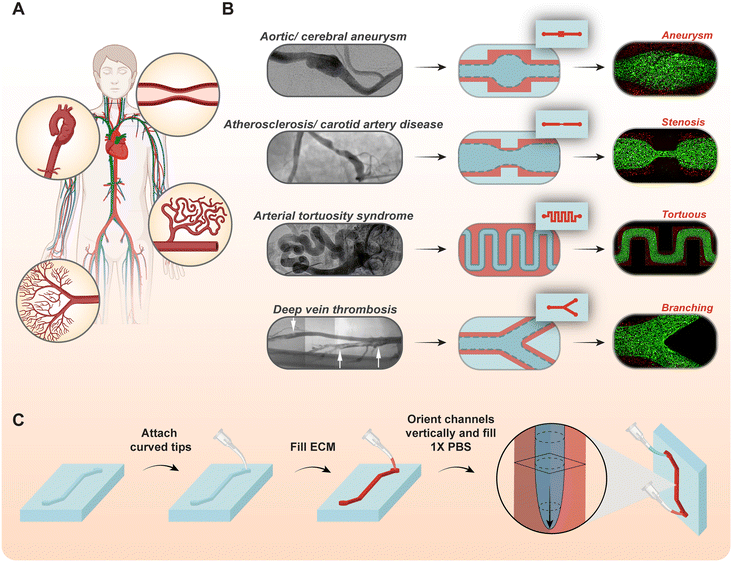 |
| | Fig. 1 Engineering complex vascular structures that recapitulate pathophysiological anatomies. (A) The human vascular system exhibits significant diversity in vessel architectures and sizes, which are most prominently witnessed in cardiovascular complications like atherosclerosis, cerebral aneurysms, etc. (B) In vivo images of complex vessels reproduced from prior literature: cerebral aneurysm,9 stenosis,10 arterial tortuosity,11 and deep vein thrombosis12 (left), and modeled vascular architecture when GLP is performed using non-uniform microfluidic channel geometries (right). (C) Schematic of the GLP biofabrication procedure that utilizes surface tension, gravitational and pressure driven forces to pattern lumen embedded in the extracellular matrix. | |
To understand the endothelial pathophysiology that is architecture-dependent, existing model systems are either poorly developed or have much difficulty allowing specific assessment of underlying biological principles. For example, while animal models have been extensively used to study human physiology and diseases,13–15 it is extremely difficult to isolate complex microvascular architectural features and perform a spatial analysis of hemodynamics and endothelial functions at these sites. As an alternative, recently engineered organ-on-chips (OOCs) that are contemporary in vitro technology may be used to recapitulate the physiological environment of human organ systems in a physiologically relevant manner. Commonly used organ-on-chip devices are composed of polydimethylsiloxane (PDMS) microfluidic channels with a rectangular cross-section.16–18 Approaches to engineer round vessel-chips also exist. For example, gravitational lumen patterning (GLP) is a biofabrication technique that has been employed in vascular organ-chips to embed the inner surfaces of their microfluidic channels with collagen or other viscous extracellular matrix (ECM) proteins. GLP is a biofabrication strategy that utilizes the interplay of surface tension, gravity and fluidic pressure forces between two fluids, with significantly different levels of viscosity, to form a cylindrical lumen within microfluidic channels; however its application to generate more complex vessel structures hasn't existed19,20 (Fig. 1C). GLP is based on the physics of viscous finger patterning, but this process incorporates gravitational force to act along the vessel's axial direction during patterning, which prevents the buoyant effect of light fluid being pushed toward the upper surface of the microfluidic channel.21,22 In contrast, this technique enables the generation of a more cylindrical cross-section with a uniform distribution of collagen, as shown by us in previous studies.19 A major limitation of the existing collagen-embedded vessel chips is the lack of spatial relevance to study diverse vessels with complex architectures. Microfluidic devices with branches, stenosis and aneurysm exist, but there is no unifying and easy approach to rapidly create the architectural complexity of microvessels, including the integration of living endothelial cell culture and blood flow.23–25
Here, we use the GLP as a unifying and foundational approach to achieve spatial intricacy of engineered vessels. The lumen patterning is governed by the shape and size of pre-GLP microfluidic channels through the local changes in pressure experienced by the two different fluids used to induce viscous fingering, hence creating complex lumens with varying shapes and sizes (Fig. 1B). Using this unifying approach, we fabricate vessels with varying cylindrical diameters followed by stenosis, aneurysms, bifurcations and tortuous features where size and dimensional complexity can be easily controlled and modulated. We then demonstrate that these vessels can be functionalized and cultured with human endothelial cells allowing them to function as living pathological vessel surrogates, incorporating blood flow and unique hemodynamic patterns. These easily engineered but complex vessel-chips reveal flow-mediated endothelial functional heterogeneity. For example, endothelial cells exhibit dysfunctional morphological characteristics and abnormal cell alignment depending on hemodynamics. These complex architecture-inclusive vessel-chips may serve as microphysiological systems of preclinical vascular disease discovery, innovations in localized drug delivery and mechanisms of cell–cell and cell–drug interactions.
Materials and methods
Complex vessel designs and 3D mold production
Complex microfluidic channels, inspired by clinically observed vascular malformations, were designed to model bifurcations, tortuosity, stenosis, and aneurysms. Each pathological vessel was designed with multiple variations by adjusting angles, tortuosity levels, degrees of stenosis, or extents of expansion respectively using computer aided design (CAD) in Autodesk Fusion360. Briefly, bifurcation channels were designed using 500 μm × 500 μm channels that branched into two 350 μm × 500 μm channels, with 30°, 60°, and 90° bifurcation angle variations. Tortuous channels were designed using 500 μm × 500 μm straight channels with peak-to-peak heights of 1.5 mm, 2 mm, and 3 mm. Stenosis models were designed using 500 μm × 500 μm cross-section channels, containing three equally spaced constrictions of 25%, 50%, and 75% widths. Similarly, aneurysm channels were designed using 500 μm × 500 μm channels containing 200% or 400% expansion of the cross-sectional widths. All channels were designed to have an end-to-end length of 2 cm. CAD designs for all vessel variations were exported as STL files and were finally printed using an Asiga Max SLA printer and clear resin (audioprint® GR-10). After printing, molds were sonicated in 100% isopropyl alcohol (IPA) for 30 minutes to remove excess uncured resin, followed by UV treatment in an inert, N2 environment to complete resin curing.
Microfluidic device fabrication
Microfluidic channels were patterned using the designed molds via the standard polydimethylsiloxane (PDMS; Dow Sylgard™ 184 Silicone Encapsulant Clear Kit, Ellsworth Adhesives) soft lithography.26,27 Briefly, PDMS prepolymers were mixed with the curing agent in a 10![[thin space (1/6-em)]](https://www.rsc.org/images/entities/char_2009.gif) :1 ratio. The prepared PDMS mixtures were poured into the molds, followed by degassing in a vacuum desiccator to remove traces of air. PDMS containing molds were then placed in a 70 °C oven for at least two hours to complete curing. Once the polymerization process was completed, PDMS stamps were carefully peeled off from the molds. Inlet and outlet ports were created at the ends of each channel using a 1 mm biopsy punch (Miltex-Integra). Excess PDMS were trimmed and the PDMS stamps were bonded to PDMS coated glass slides using 75 watts oxygen plasma at 0.80 mbar for 30 seconds. Once bonded, devices were stored in a 70 °C oven overnight under weighted conditions to complete the bonding process, resulting in irreversibly bonded, completely sealed channels.
:1 ratio. The prepared PDMS mixtures were poured into the molds, followed by degassing in a vacuum desiccator to remove traces of air. PDMS containing molds were then placed in a 70 °C oven for at least two hours to complete curing. Once the polymerization process was completed, PDMS stamps were carefully peeled off from the molds. Inlet and outlet ports were created at the ends of each channel using a 1 mm biopsy punch (Miltex-Integra). Excess PDMS were trimmed and the PDMS stamps were bonded to PDMS coated glass slides using 75 watts oxygen plasma at 0.80 mbar for 30 seconds. Once bonded, devices were stored in a 70 °C oven overnight under weighted conditions to complete the bonding process, resulting in irreversibly bonded, completely sealed channels.
Chemical pretreatment
Fabricated microfluidic channels were chemically pretreated to enhance bonding of the extracellular matrix (ECM) and PDMS. Briefly, microfluidic channels were first oxygen plasma treated to activate the PDMS surfaces. Once treated, the devices were immediately injected with a 10% v/v solution of 3-aminopropyltriethoxysilane (APTES; Thermo scientific) in 200 proof ethanol. Channels were incubated for 15 minutes at room temperature before thorough rinsing with 100% and 70% ethanol solutions, respectively. Channels were completely dried using an air gun to remove any traces of fluid and channels were then incubated in a 70 °C oven for 30 minutes. Channels were then injected with a 2.5 % v/v solution of glutaraldehyde (Sigma-Aldrich) in PBS (Lonza), followed by incubation at room temperature for 30 minutes. Channels were then extensively washed with 100% and 70% ethanol solutions to remove any traces of leftover glutaraldehyde. Channels were allowed to dry overnight in an oven and then degassed in a vacuum desiccator for at least two hours prior to collagen patterning.
Gravitational lumen patterning
Collagen solutions were prepared according to the manufacturer's protocol. The collagen stock (rat tail type 1; 8.50 mg mL−1, Corning; 10 mg mL−1, Ibidi) was reconstituted to a concentration range of 5 to 7.5 mg mL−1, with the pH adjusted to 7.5 using sodium bicarbonate (7.5%, Gibco), sodium hydroxide (Thermo Fisher), and HEPES (1 M, Gibco) (Method S1†). For lumen visualization studies, the PBS solution was mixed with red fluorescent microbeads and was used in place of plain 1× PBS. Collagen mixtures were prepared on ice to prevent premature cross-linking of collagen solutions. GLP was then pursued as per our previously reported methods.19,28 Briefly, prior to injecting collagen solutions into microfluidic channels, 200 μL pipette tips (P200) were bent to nearly 135° roughly 7 mm into the tip length. Individual bent tips were pushed into the outlet ports of the channel till tips reached the top of the microfluidic channels, except for bifurcated channels, where two curved tips were employed due to the binary splitting. Using a 20 μL pipette, ice-cold collagen was injected into the microfluidic channels until the levels of collagen were roughly equal between the inlet and outlet. Collagen was allowed to equilibrate for 15 seconds after which inlet tips were carefully removed. Simultaneously, another bent P200 tip was loosely connected to a 200 μL pipette and 40 μL of 1× PBS was aspirated. Tips were loosely attached to facilitate easy removal from the pipette once pushed into the inlet ports of the channels as well as to limit excessive pressures that could affect the patterning process. Devices were then held vertically with the outlet ports at the bottom, and PBS containing bent tips were connected to the inlet (Fig. 1B). 40 μL of PBS was used for fabricating all vessels, except for straight channels where 10 μL, 20 μL, and 40 μL of PBS were used for fabricating vessels with varying diameters. Once tips with PBS were pushed in the respective inlets, devices were immediately moved to a 5% CO2 37 °C humidified incubator while holding devices vertically. Devices were incubated for 7 minutes, after which devices were brought back to biosafety cabinets. The outlet tips were gently removed first followed by inlet tips. Tips were removed using a rotating motion to prevent the rupturing of the collagen layer. Patterned channels were filled with PBS and incubated again in the 37 °C incubator for at least an hour to complete the polymerization of collagen.
Fluorescent microbead coating for lumen visualization
For lumen visualization studies, green fluorescent microbeads (Fluoro-Max™, Thermo Scientific) in a 1× PBS solution were injected in the patterned channels. The fluid levels in the inlet and outlet tips were balanced and channels were incubated at 37 °C inside a humidified 5% CO2 incubator for an hour to allow beads to coat the bottom half of the lumen. After an hour, devices were rotated upside down and incubated for another hour to coat the top half of the vessels. After incubation, patterned channels were gently washed with fresh 1× PBS to remove excess floating microbeads while preventing the beads on the lumen surface from detaching.
Preparation of the diluted RBC suspension
Whole human blood was mixed with equal parts 1× PBS and centrifuged at 400g for 10 minutes. The supernatant was discarded, and the process was repeated twice to remove any trace of residual plasma. The presence of plasma would initiate clotting due to the interaction with collagen within the GLP lumen and hence it was deemed necessary to remove plasma clotting factors. Finally, the pelleted RBCs were diluted to achieve a hematocrit content of 2–4% prior to addition to the vessels and perfused through the GLP vessels at 40 μL min−1 using a syringe pump (Harvard Apparatus).
Endothelial cell culture
Patterned vessels were filled with endothelial cell growth medium 2 (EGM-2, PromoCell) and incubated at 37 °C in a humidified 5% CO2 incubator overnight to diffuse the cell media into the embedded ECM and create a favorable environment for endothelial cell attachment. Human umbilical vein endothelial cells (HUVECs, PromoCell) were cultured in standard T75 flasks until 75–80% confluence. HUVECs were then lifted from flasks using Accutase (Thermo Fisher) and centrifuged to collect as a pellet. The supernatant was aspirated, and the cell pellet was resuspended in 1 mL EGM-2 for cell counting. After cell counting, cells were centrifuged again, and supernatant was aspirated. The cells were finally resuspended in EGM-2 at a concentration of 10 million per mL. 20 μL of the prepared cell suspension was injected into the patterned vessels, and devices were loaded on a custom rotator that rotates at 2 rpm inside a 37 °C humidified 5% CO2 incubator for approximately two hours to allow an even coating of endothelial cells to the lumen surface. After the two-hour incubation, vessels were carefully washed with fresh EGM-2 to remove excess cells. The seeded vessels were incubated at 37 °C in a humidified 5% CO2 incubator for 24 hours under hydrostatic flow conditions to allow the cells to become confluent within the channel.
Cell staining
After the shear exposure, endothelial cells were fixed with 4% paraformaldehyde (PFA) for 15 minutes at room temperature. Vessels were then permeabilized with a 0.1% solution of Triton X-100 in blocking buffer (2% BSA/DPBS) for 30 minutes at room temperature. For VE-cadherin staining, mouse anti-human VE-cadherin primary antibody (R&D Systems) was diluted in blocking buffer at a 1:200 ratio. 20 μL of the primary antibody solutions were injected into each vessel and incubated at 4 °C overnight. After incubation, the primary antibody solutions were washed with blocking buffer solution and then a 1:200 solution of secondary rabbit anti-mouse antibody (R&D Systems) in blocking buffer was incubated within the vessels for 2 hours at room temperature. Vessels were then washed with blocking buffer thoroughly. To stain nuclei, Hoechst 33342 (Thermo Fisher) was mixed with PBS in a 1:2000 ratio. 20 μL of the staining solution was injected into the vessel and incubated for 30 minutes at room temperature before rinsing with PBS. The stained vessels were filled with fresh PBS and stored at 4 °C overnight.
Data collection and processing
To visualize the 3D GLP channels, a confocal microscope (Fluoview FV3000, Olympus) was used with a UPLSAPO objective (Olympus), and the pinhole size was set to 131.0 μm. The wavelengths of the two lasers were 405 nm and 488 nm with the emission wavelengths set at 480 nm and 586 nm, respectively, and the excitation wavelengths set at 420 nm and 526 nm, respectively. 3D z-stack images of the patterned lumen were collected with a range of 5–10 μm step size. For tortuous and aneurysm vessels, z-stack imaging was coupled with ‘xy’ tiled imaging to capture the entire region of interest. The collected images were exported and processed in ImageJ. The maximum intensity z-projection was applied to the stack of images to create a top view of the GLP channels. Quantification of important characteristics of each vessel type was performed in ImageJ using the projected images with three replicates. ‘xz’ and ‘yz’ projections were also created using the stack reslice command in ImageJ and reported as maximum intensity projections. 3D visualization was managed in Imaris.
Orientation and morphological analysis
Once fluorescence staining images of VE-cadherin structures were obtained, we manually outlined the boundaries of 20 cells in each region of interest using ImageJ, and the cell area and perimeter of each cell were measured.| |  | (1) |
The cell shape index (CSI) was calculated using eqn (1). Angles were computed for the major axis of cells with respect to flow directions and plotted as polar plots of angular distribution using a python code.
3D CAD reconstruction and CFD analysis
3D z-stack images of the vessels were imported in Autodesk Fusion 360 and 3D representations of each vessel with all variations were produced. The 3D files were exported in the STEP file format which were then imported into COMSOL Multiphysics®. Once imported, we used the laminar flow module to model the hemodynamic flow, and a cardiac cycle waveform was used as the inlet pressure boundary condition. The period of the waveform was 1 second and we used a Fourier series approximation for the cardiac cycle given by Pinlet = 80 + 18.6cos(2πt − 1.67) + 8.6cos(4πt − 2.25) + 5.1cos(6πt − 2.61) + 2.9cos(8πt − 3.12) + 1.3cos(10πt − 2.91) + 1.4cos(12πt − 2.81) + 1.2cos(14πt + 2.93).| |  | (2) |
| |  | (3) |
| |  | (4) |
| |  | (5) |
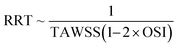
In our computational model, blood was simulated as a Newtonian fluid with a viscosity of 3.5 cP, and we used a no-slip boundary condition along all exterior walls. A temporal simulation was then performed after discretizing and meshing the 3D vessel domains and ancillary variables like time averaged wall shear stress (TAWSS) and relative residence time (RRT) were calculated using eqn (2) and (5), respectively, where T is the time period and  is instantaneous WSS, and eqn (4) was approximated as eqn (5) by applying eqn (2) and (3) and rearranging the terms. TAWSS and RRT were calculated for the entire length of vessels, and not just in the target regions such as stenosis or aneurysm. The calculated TAWSS was normalized with respect to the TAWSS values obtained by applying the same boundary conditions across a simple, cylindrical lumen with the same inlet diameter and end-to-end length as that of the respective vessel variation analyzed. The calculated RRT was normalized in the same manner as TAWSS.
Statistical analysis
All data are reported as mean ± SEM. All experiments were performed in triplicate (n = 3) unless otherwise stated. Statistical comparisons were made using two-way ANOVA, repeated measures two-way ANOVA, Student's t-test or Pearson correlation test in GraphPad Prism ver. 9. Differences were considered significant for p < 0.05. Multiple testing correction was performed using the Tukey test in GraphPad Prism ver. 10.
Results and discussion
Engineering vascular architecture-on-a-chip: cylinders, aneurysm, stenosis, bifurcations and tortuosity
We began by exploring if variations of our GLP biofabrication process may produce complex vascular architectures that are often sites of endothelial activation, aberrant hemodynamics, aneurysms, atherosclerosis and thrombosis.
Cylindrical vessel-chips with varying lumen sizes.
We first engineered simple, uniform vessels by modulating the pressure head during the GLP process. When we performed GLP in straight microfluidic channels filled with reconstituted collagen and layered different amounts of PBS, we observed that there is an increase in vessel diameter as the pressure head increases (Fig. 2A and B). Using pressure heads that can be applied easily in these devices, we were able to form vessel-chips of diameters in the range of 150–300 μm.
 |
| | Fig. 2 Architecture of complex vessel-chips. Cylindrical vessel-chips: (A) uniform cylindrical vessels formed using GLP with 30, 60 and 90 Pa pressure heads respectively (red: collagen; green: lumen; scale bar: 250 μm). (B) Cylindrical lumen diameters. Aneurysm-chips: (C) aneurysm vessels in 1 mm and 2 mm expansion channels (scale bar: 500 μm). (D) Maximum widths of the aneurysm. Stenosis-chips: (E) stenotic vessels formed in 25, 50 and 75% constriction channels (scale bar: 500 μm). (F) Minimum widths of stenosis. (G) Vessel recovery after stenosis. (H) Length of the stenosis sections. Bifurcation-chips: (I) bifurcating vessels in 30, 60 and 90° bifurcating channels (scale bar: 500 μm). (J) Linear regression analysis between the bifurcation angles of pre-GLP and post-GLP lumens. (K) Pre-bifurcation lumen diameters. (L) Post-bifurcation lumen diameters. Tortuous vessel-chips: (M) tortuous vessels in 1.5, 2 and 2.5 mm peak-to-peak tortuous channels (scale bar: 500 μm). (N) Lumen tortuosity index. (O) Linear regression analysis between the tortuosity index of pre-GLP and post-GLP tortuous vessels (n = 3 experiments; *p < 0.05; **p < 0.005; ns: not significant). | |
Aneurysms-on-chip.
We next set out to explore if our technique may be used to engineer complex living shapes of vessel-chips. We introduced shape variations in the microfluidic channels encasing patterned vessels to form more complex geometries. As a first case study, to engineer the architecture of fusiform aneurysms, we constructed microfluidic channels with 1 mm (200%) and 2 mm (400%) expansions and executed patterning.29 We observed that the pre-GLP microfluidic device shape regulates the ensuing lumen patterning as we observed the sudden increase in the microchannel widths resulting in lumen expansions in a proportional manner (Fig. 2C), confirmed by quantifying the widths of the vessels at their maximum expansions (Fig. 2D). The extents of aneurysms also followed the trend of their pre-GLP microchannels as each variation yielded aneurysms with nearly ∼200% and 400% of the pre-aneurysm diameters (Fig. 2D). While we presented two variations of the lumen expansion model, a wide range of aneurysm vessels can be engineered in accordance with observations in in vivo studies.
Stenosis-on-chip.
Unlike aneurysms, stenosis consists of vessels with sudden constriction. This time, we constructed microfluidic channels with constrictive features representative of stenosis of various degrees and performed the GLP in these variations. Here, we observed differential extents of stenosis using 25, 50 and 75% constriction channels (Fig. 2E and F). Quantification of the stenosis regions of the different variations confirmed that the extent of lumen stenosis follows the same trend as that of the microfluidic constrictions (Fig. 2F). In our method, when we calculated the ratio of post- and pre-stenosis diameters, termed as lumen recovery, we observed that the vessel diameters were conserved and there was no loss of lumen integrity either pre-constriction or post-constriction (Fig. 2G). We then quantified the lengths of stenosis which was defined as the length along the axial direction of the stenosed section (Fig. 2H). Like width, we observed that the actual stenosis lengths achieved by our approach followed trends as the length of constrictions of their pre-GLP channels. These results suggest that using various length and width combinations of constriction regions within the microfluidic channels, GLP can be modulated to create a range of stenosed vessels that are observed in vivo. Although we have chosen 25, 50 and 75% constricted microchannels with corresponding lengths, other dimensions can also be engineered as informed by in vivo observations to model the time dependent stenosis, for example in atherosclerosis.30
Bifurcation-on-chip.
Bifurcations are a common feature in the vascular trees and are often sites of abnormal cell phenotypes due to the increased oscillatory flow patterns observed in their vicinity.31,32 Developmentally, bifurcations are also sites of lymphatic and venous valvulogenesis as vessels try to withstand and dampen the amplified flow oscillations.33 This motivated us to create bifurcating vessels using GLP with varying extents of bifurcations i.e., 30°, 60° and 90°, producing bifurcating structures with varying angles (Fig. 2I). When we quantified the bifurcation angles of the lumen and performed a regression analysis of the angles before and after GLP, we achieved high correlation (R2 = 0.99), suggesting that bifurcating vessels effectively mimic the angle of their pre-GLP microchannels (Fig. 2J). Furthermore, the size of the bifurcated lumen was reduced relative to the major vascular lumen due to the decreased cross-section of the encapsulating microchannel after the bifurcation point (Fig. 2K and L, and S1†). The reduction in post-GLP lumen diameter was typically 23%, and the reduction in the width of the pre-GLP microchannel was 30%.
Tortuous vessel-chips.
Finally, we engineered vessels with tortuous architectures using the GLP method. We constructed tortuous microchannels with three different extents of tortuosity with the peak-to-peak distances for each variation being 1.5, 2 and 2.5 mm respectively. As expected, GLP resulted in the development of lumens that followed the trend of their pre-GLP channel by exhibiting similar levels of tortuosity index, defined as a ratio of the vessel length along the path to the straight-line distance between the two end points (Fig. 2M and N). To confirm our observation, we also performed regression analysis on the tortuosity index before and after GLP and achieved high correlation (R2 = 0.99), which implied that the GLP process mimicked the spatial variations that were present in the pre-GLP microchannels (Fig. 2O). Tortuosity with low amplitude and high frequency is more commonly observed in smaller vessels, and higher amplitude is frequently seen in larger vessels. By demonstrating the ability to control the amplitude of tortuous vessels along with diameter variance previously confirmed in straight channels, we establish a powerful platform that can model a large spectrum of vessel tortuosity found in vivo.34
Endothelialization and orientation analysis of the complex vessel-chips
In the next phase, we challenged these devices to endothelial cell culture to form a confluent lumen and a 3D living cell structure.
Cylindrical vessel-chips.
First, to validate our cell culture method in a straight configuration as has been published before,19 we cultured endothelial cells (ECs) in a typical arteriolar sized cylindrical design and observed that the cells created a confluent vascular lumen covered with cells on all sides (Fig. 3A(i)). The cells displayed alignment along the axial flow directions and conserved their barrier function, assessed by analyzing the orientation of VE-cadherin and gaps (Fig. 3A(i) and (ii), Movie S1†).
 |
| | Fig. 3 Endothelialization and orientation analysis of complex vessel-chips. (A) Cylindrical vessel-chips: (i) fluorescence confocal micrograph of ECs cultured in the vessel-chip (green: VE-cadherin; blue: nuclei; scale bar: 250 μm); (ii) analysis of EC orientation along the axis. (B) Aneurysm-chips: (i) fluorescence confocal micrographs of ECs cultured in the vessel-chip (green: VE-cadherin; blue: nuclei; scale bar: 500 μm); analysis of EC orientation in the pre- (ii), intra- (iii), and post-aneurysm (iv) sections; (v) CSI of ECs in pre-, intra-, and post-aneurysm regions. (C) Stenosis-chips: (i) fluorescence confocal micrograph of ECs cultured in the 50% stenosed vessel (scale bar: 250 μm); analysis of EC orientation in the pre- (ii), within (iii), and post-stenosis (iv) sections; (v) CSI of ECs in pre-, intra-, and post-stenosis regions. (D) Bifurcation-chips: (i) fluorescence confocal micrograph of ECs cultured in the 60° bifurcation vessel (scale bar: 500 μm); analysis of EC orientation in the pre- (ii), within (iii), and post-bifurcation (iv) sections; (v) CSI of ECs in pre-, intra-, and post-bifurcation regions. (E) Tortuous vessel-chips: (i) fluorescence confocal micrographs of ECs cultured in the 1.5 mm peak-to-peak tortuous vessel (scale bar: 500 μm); analysis of EC orientation in the pre- (ii), within (iii), and post-tortuous (iv) sections; (v) CSI of ECs in pre-, intra-, and post-tortuous regions. | |
Aneurysms-on-chip.
To form living human aneurysm-chips, we cultured ECs in these geometries and found that these vessel-chips form a confluent lumen within 24 hours in the same manner as straight cylindrical vessel-chips. Although the barrier function was conserved as we did not see any visible gaps (Movie S2†), we observed that cells cultured in the normal and straight portion of the vessel were axially aligned, but the aneurysm regions of the vessel had abnormal and random orientation and morphologies (Fig. 3B(i)). In the post-aneurysm sections, when the vessels regained their original structure, the endothelial cells showed recovery of cellular orientation (Fig. 3B(ii)–(iv)). We also calculated the cell shape index (CSI) in each region, which revealed that the cells at the aneurysm exhibit a more rounded shape compared to the pre- and post-aneurysm sections of the vessel (Fig. 3B(v)). These results suggest that the sudden increase in the lumen diameter results in significant flow disruptions at the aneurysm zone and cells that are unable to align themselves to the axial position undergo morphological change, in contrast to cells in the pre- and post-aneurysm regions of the vessel (Fig. 3C(ii)–(v)).
Stenosis-on-chip.
We then cultured the engineered stenosis-chips with ECs in the 50% stenosis variations (Fig. 3D(i), Movie S3†). Interestingly, we observed that cells in the pre-stenosis and stenosis regions show alignment along the direction of flow, also confirmed by quantifying the angles of cell boundaries in these regions (Fig. 3D(ii) and (iii)). Similar to the aneurysm section of the living aneurysm-chip, we observed that in the post-stenosis section, endothelial cells were not as aligned to flow in relation to the pre-stenosis region, consistent with observations in in vivo models.35 When we calculated the CSI of cells in each region, however, we observed that cell morphology was maintained throughout all regions (Fig. 3C(v)). These results suggest that disturbed flow in the post-stenosis region causes misalignment of cells, but it is insufficient to induce alteration in cell morphology.
Bifurcation-on-chip.
Like our stenosis and aneurysm-chips, we also cultured endothelial cells in the luminal side of the ECM layer in bifurcation geometries and observed that the barrier was conserved throughout the entire vessel (Fig. 3D(i), Movie S4†). When visualized via VE-cadherin imaging of endothelial cells, we observed that altered cell alignments begin at the point of vessel separation and do not fully recover in the post-bifurcation sections of the vessel (Fig. 3C(ii)–(iv)). The calculated CSI values also reveal that cells at the site of bifurcation display a much more rounded shape compared to those in the pre- and post-bifurcation regions (Fig. 3C(v)). These results suggest that when the fluid flow encounters obstacles (in the form of bifurcations), it becomes disturbed and as a result, the endothelial cells sense and acquire a pathological phenotype in the vicinity of the branches and may take a thromboinflammatory phenotype. The engineering of such endothelialized in vitro vascular bifurcations may, therefore, provide a model to investigate the specific localized and heterogeneous effects of cells, molecules and drugs in these systems.
Tortuous vessel-chips.
Lastly, we also tested cell culture in these vessels with tortuous architecture (Fig. 3E(i), Movie S5†) and observed that cells within the tortuous region did not align along the axial direction of flow unlike the pre-tortuous part of the vessel (Fig. 3E(ii) and (iii)). The calculated CSI also reveals that the cell morphology becomes more rounded in the tortuous section, and this can be explained by the presence of helical flow patterns due to tortuous features, consistent with in vivo literature.36 The normal orientation of the endothelial cells was regained after the vessel recovery in the post-tortuous region (Fig. 3E(iv)).
Hemodynamic analysis of the complex vessels
Complex vascular architecture also results in spatially heterogeneous shear stress distribution among these structures that may result in unique endothelial responses to flow. Therefore, we also introduced blood in these structures and prepared a shear stress distribution atlas using computational predictions useful for future structure–function studies.
Cylindrical vessel-chips.
We first exposed the cylindrical vessel-chips under the perfusion of red blood cells (RBCs) for approximately half an hour, and did not observe any loss in lumen integrity (Fig. 4A(i), Movie S6†). Since microphysiological flows are mostly laminar, we could apply well-established computational algorithms to predict hemodynamics in these vessels and validate flow patterns. As expected for a uniform flow in a cylinder, our computations predicted a uniformly distributed time-averaged wall shear stress (TAWSS) for all diameter variations of the vessel-chips. The TAWSS increased linearly as the vessel diameter increased (Fig. 4A(ii) and (iii)). Consequentially, the average relative residence time (RRT) of simulated blood cells (for example, leukocytes) decreased as the vessel diameter increased (Fig. 4A(iv)). This was expected as larger vessels will allow more effective and faster fluid transport due to less fluidic resistance as compared to smaller vessels. This is also observed in vivo as usually larger arteries have higher shear stress values compared to smaller arterioles and capillaries.37
 |
| | Fig. 4 Hemodynamic assessment of complex vessel-chips. (A) Cylindrical vessel-chips: (i) brightfield micrographs showing flow of RBCs in a uniform vessel (magnification: 10× (top) and 20× (bottom)); time averaged wall shear stress (TAWSS) normalized with respect to the 30 Pa condition as a distribution heatmap (ii) and compared between vessel diameters (iii); (iv) normalized residence time (RRT) compared between vessel diameters. (B) Aneurysm-chips: (i) brightfield micrographs showing flow of RBCs in the 2 mm aneurysm vessel (magnification: 5× (top) and 20× (bottom)); TAWSS normalized with respect to cylindrical lumens as a distribution heatmap (ii) and compared between maximum channel widths (iii); (iv) normalized RRT values compared between maximum channel widths. (C) Stenosis-chips: (i) brightfield micrographs showing flow of RBCs in the 50% stenosed vessel (magnification: 10× (top) and 20× (bottom)); TAWSS normalized with respect to cylindrical lumens as a distribution heatmap (ii) and compared between percent stenoses (iii); (iv) normalized RRT values compared between percent stenoses. (D) Bifurcation-chips: (i) brightfield micrographs showing flow of RBCs in the 60° bifurcation vessel (magnification: 10× (top) and 20× (bottom)); TAWSS normalized with respect to cylindrical lumens as a distribution heatmap (ii) and compared between bifurcation angles (iii). (E) Tortuous vessel-chips: (i) brightfield micrographs showing flow of RBCs in the 1.5 mm vessel variation (magnification: 5× (top) and 20× (bottom)); (ii) TAWSS normalized with respect to cylindrical lumens as a distribution heatmap (ii) and compared between tortuosity indices (iii); (iv) normalized RRT values compared between tortuosity indices (scale bars: 500 and 200 μm respectively; **p < 0.005). | |
Aneurysms-on-chip.
Aneurysms are typically characterized by stagnation and reduced flow at the extremities.38 To test if the adhered ECM within our engineered structures supports the flow of RBCs and validate the reduced hemodynamics at the extreme sections in our aneurysm-chip, we exposed the aneurysm-chips under perfusion and observed that RBCs in the extremes of the aneurysms moved slower in comparison to those in the middle (Fig. 4B(i), Movie S7†). This experimental observation was supported by our computational analysis which also revealed a significantly reduced flow in the extremes of aneurysms (Fig. 4B(ii)). This was consistent with the in vivo findings where extremely low TAWSS values have been reported along with fluid recirculation.39 We also observed that the range of TAWSS values was more spread out in vessels with higher aneurysm extents and the average TAWSS over the entire vessel also decreased as expansion of the lumen increased (Fig. 4B(iii)). Consequently, quantification of the residence time validated that the vessel with larger aneurysm had a higher susceptibility to retain blood cells for a longer duration (Fig. 4B(iv)). These results suggest that aneurysms formed using this approach have the potential to model the pathological hemodynamics that are witnessed in vivo and can model the shear dependent changes that are prevalent in aneurysms.40 Overall, our aneurysm-chips may provide an in vitro model to reproduce clinically relevant hemodynamics, blood–endothelial interactions and immune cell migration behaviors that are observed clinically.41
Stenosis-on-chip.
We next introduced RBCs within the stenosed vessels and these stenosed sections supported perfusion for half an hour without any change in dimensions (Fig. 4C(i), Movie S8†). To validate the influence of stenosed geometry on flow, we also performed fluid dynamics simulations under physiological flow conditions assuming a cardiac pressure waveform and calculated the TAWSS (Fig. 4C(ii)) and observed that increasing extents of stenosis had increasing TAWSS values in the stenosis regions (Fig. 4C(ii)). The TAWSS values decreased in the pre- and post-stenosis regions as the extent of stenosis increased due to more resistance to fluid flow and hence lower flow rates in these regions. We also observed that the range of TAWSS values was more spread out in vessels with higher stenosis and that average TAWSS over the entire vessel decreased as stenosis increased (Fig. 4C(iii)), suggesting more complex and possibly pathogenic hemodynamics in vessels with high stenosis. When we quantified the relative residence time (RRT) of blood cells within these variations, we observed that higher stenosis vessels had a propensity to retain particles for a longer duration (Fig. 4C(iv)), suggesting a possibly prolonged and pathological endothelial–blood cell interactions within these model systems. These results suggest that stenosed vessels formed using GLP have the potential to model the hemodynamic alterations that are observed in vivo in conditions like atherosclerosis and coronary artery disease, where significant shear activation and leukocyte accumulation is observed in the stenosed and post-stenosed regions of arteries.42
Bifurcation-on-chip.
Upon RBC perfusion, we observed that the adhered ECM of the bifurcation-chips supported fluid flow and that the flow is evenly divided among the two post-bifurcation sections (Fig. 4D(i), Movie S9†). The computational analysis on bifurcation-chips revealed that as the angle of bifurcation increased, the region around the bifurcation witnessed higher TAWSS values (Fig. 4D(ii) and (iii)), as wider angles imply the presence of more fluidic resistance and hence fluid flow disruption may be enhanced. These results suggest that bifurcations consisting of a physiologically-relevant ECM layer have the potential to recapitulate the pathological hemodynamic conditions that are witnessed in vivo and can model the shear dependent changes that are prevalent in bifurcating vessels, specifically at sites of vessel separation.
Tortuous vessel-chips.
Finally, we also perfused RBCs through the tortuous vessels to confirm that the embedded ECM layer can support perfusion and to validate the effect of tortuous architecture on flow. We observed slower movement of cells in the outermost corners of the lumen (Fig. 4E(i), Movie S10†). This was further supported through CFD studies where the outermost corners of vessels had lower TAWSS levels across all variations; however the severity of reduction diminished as the tortuosity increased (Fig. 4E(ii)). Longer tortuous channels also resulted in an overall lower average TAWSS as compared to vessels with a shorter flow path (Fig. 4E(iii)). The CFD studies confirm the clinically observed linkage between severe tortuosity and resulting low shear stress, which is associated with a higher risk of disease development and progression.43,44 Longer channels consequently also had a longer residence time of particles owing to the increased length (Fig. 4E(iv)).
Conclusion
In summary, by regulating and controlling our gravitational lumen patterning (GLP) method, we engineered spatially intricate 3D vascular models. We show that the shape and size of a patterned lumen can be modulated with the structure of their external microfluidic channels. Although we show some representative structures and their variations, this procedure can be extended to model pathological structures for a wide range of vessels observed in human circulation (Fig. 1B). There are several advantages of using these complex architecture vessel-chips as model systems to understand cell–cell interactions under flow and to discover drug–cell interactions in health or diseased states. First, complex geometry introduces variations in hemodynamics that may directly influence transport phenomena of blood and its components that may be essential to some vascularized organ-chip models. Secondly, an important consequence of reproducing complex hemodynamics and transport phenomena in these vessel-chips is that they model the endothelial cell responses to the localized shear conditions more faithfully. Therefore, these engineered vessels with various architectures can serve as platforms to investigate vascular complications strongly associated with the structure of vessels such as aneurysm, fibromuscular dysplasia, and atherosclerosis. There are still some limitations of these systems that have not been fully realized or resolved. For example, blood vessels are compliant and contract or relax depending upon changes in physical hemodynamic cues or biochemical signaling. So far, we have not engineered compliant vessel-chips, even though this work offers architectural modulation. In the future, this approach can be used to dissect spatially heterogeneous cell signaling. One of the opportunities would be to incorporate surrounding stromal cells like smooth muscle cells, pericytes, etc., into the ECM to produce more physiological in vitro vessel models and advance our understanding of atherosclerosis.19,20,45 The analysis of blood–endothelial crosstalk and cross-correlation with hemodynamics is an expected future work using our vessel-chips. Due to their ability to alter the physiological flow patterns, these models also hold great promise in allowing the investigation of more complex, developmental processes like venous or lymphatic valve formation in response to flow oscillations.46 Development of therapeutic strategies that not only target the molecular and cellular processes that occur in vivo, but also can limit or reverse pathological flow behavior can then be studied with these modalities to evaluate alternate, less invasive treatment strategies that focus on flow correction. With the possibility of future incorporation of patient specific vascular architecture and cellular systems, personalized therapeutic drug testing and development could be enabled.
Data availability
The data supporting the findings of this study are available at: https://doi.org/10.18738/T8/FR0HRZ, https://doi.org/10.18738/T8/IUM5PK, and https://doi.org/10.18738/T8/IUTRS6.
Author contributions
J. D. L., A. K., T. M. and A. J. designed the study. J. D. L. and A. K. fabricated and processed 3D printed molds. J. D. L. performed device fabrication, surface modification, GLP, fluorescent bead imaging and shape analysis. T. M. and J. D. L. performed cell culture experiments, and J. D. L. and A. K. performed immunofluorescence imaging. A. K. and J. D. L. performed cell orientation analysis and image post-processing. J. D. L., T. M., and A. J. wrote the manuscript.
Conflicts of interest
A. J. currently holds equity and is an advisor of Osciflex LLC; and was the scientific founder of Revi Life Sciences.
Acknowledgements
This material is based upon work supported by the US Army Medical Research (USAMRAA) Contract No. HT94252410432; NASA, BARDA, NIH, and USFDA, under Contract No. 80ARC023CA002; NHLBI of NIH under Award Number R01HL157790; NSF CAREER Award number 1944322; and TAMU Office of Innovation Translational Investment Funds to A. J. The authors acknowledge the assistance of the Integrated Microscopy and Imaging Laboratory at Texas A&M College of Medicine. RRID:SCR_021637.
References
- M. K. Pugsley and R. Tabrizchi, The vascular system. An overview of structure and function, J. Pharmacol. Toxicol. Methods, 2000, 44(2), 333–340 CrossRef CAS PubMed.
- M. Syed and M. Lesch, Coronary artery aneurysm: A review, Prog. Cardiovasc. Dis., 1997, 40(1), 77–84 CrossRef CAS PubMed.
- R. N. Pralhad and D. H. Schultz, Modeling of arterial stenosis and its applications to blood diseases, Math. Biosci., 2004, 190(2), 203–220 CrossRef CAS PubMed.
- G. Dougherty and J. Varro, A quantitative index for the measurement of the tortuosity of blood vessels, Med. Eng. Phys., 2000, 22(8), 567–574 CrossRef CAS PubMed.
- A. Otero-Cacho, M. Aymerich, M. T. Flores-Arias, M. Abal, E. Álvarez and V. Pérez-Muñuzuri,
et al., Determination of hemodynamic risk for vascular disease in planar artery bifurcations, Sci. Rep., 2018, 8(1), 2795 CrossRef PubMed.
- T. Ishii, E. Warabi and G. E. Mann, Mechanisms underlying unidirectional laminar shear stress-mediated Nrf2 activation in endothelial cells: Amplification of low shear stress signaling by primary cilia, Redox Biol., 2021, 46, 102103 Search PubMed.
- N. Ohura, K. Yamamoto, S. Ichioka, T. Sokabe, H. Nakatsuka and A. Baba,
et al., Global analysis of shear stress-responsive genes in vascular endothelial cells, J. Atheroscler. Thromb., 2003, 10(5), 304–313 Search PubMed.
- G. Garin and B. C. Berk, Flow-mediated signaling modulates endothelial cell phenotype, Endothelium, 2006, 13(6), 375–384 CrossRef CAS PubMed.
- G. Dabus, E. Lin and I. Linfante, Endovascular treatment of fusiform intracranial vertebral artery aneurysms using reconstructive techniques, J. NeuroInterventional Surg., 2014, 6(8), 589–594 CrossRef PubMed.
- F. Bernardini, M. Gelfusa, M. Celeski, F. Coletti, A. Nusca and D. De Stefano,
et al., Beyond the Calcium Score: What Additional Information from a CT Scan Can Assist in Cardiovascular Risk Assessment?, Appl. Sci., 2023, 13(1), 241 CrossRef CAS.
- A. Cubero, J. Ayala, G. Hamzeh, A. Cortes, J. Udaondo and J. I. Aramendi, Severe Arterial Tortuosity, World J. Pediatr. Congenit. Heart Surg., 2017, 8(2), 231–234 CrossRef PubMed.
- A. Ono, K. Murase, T. Taniguchi, O. Shibutani, S. Takata and Y. Kobashi,
et al., Deep venous thrombosis: Diagnostic value of non-contrast-enhanced MR venography using electrocardiography-triggered three-dimensional half-fourier FSE, Magn. Reson. Med., 2010, 64(1), 88–97 CrossRef PubMed.
- N. R. Madamanchi, A. Vendrov and M. S. Runge, Oxidative stress and vascular disease, Arterioscler., Thromb., Vasc. Biol., 2005, 25(1), 29–38 CrossRef CAS PubMed.
- N. Shobeiri, M. A. Adams and R. M. Holden, Vascular calcification in animal models of CKD: A review, Am. J. Nephrol., 2010, 31(6), 471–481 Search PubMed.
- E. Okamoto, T. Couse, H. De Leon, J. Vinten-Johansen, R. B. Goodman and N. A. Scott,
et al., Perivascular inflammation after balloon angioplasty of porcine coronary arteries, Circulation, 2001, 104(18), 2228–2235 CrossRef CAS PubMed.
- S. Kim, W. Kim, S. Lim and J. S. Jeon, Vasculature-On-A-Chip for In Vitro Disease Models, Bioengineering, 2017, 4(1), 8 CrossRef PubMed.
- P.-A. Vidi, T. Maleki, M. Ochoa, L. Wang, S. M. Clark and J. F. Leary,
et al., Disease-on-a-chip: mimicry of tumor growth in mammary ducts, Lab Chip, 2014, 14(1), 172–177 Search PubMed.
- F. F. Ouali, G. McHale, H. Javed, C. Trabi, N. J. Shirtcliffe and M. I. Newton, Wetting considerations in capillary rise and imbibition in closed square tubes and open rectangular cross-section channels, Microfluid. Nanofluid., 2013, 15(3), 309–326 Search PubMed.
- A. Selahi, T. Fernando, S. Chakraborty, M. Muthuchamy, D. C. Zawieja and A. Jain, Lymphangion-chip: a microphysiological system which supports co-culture and bidirectional signaling of lymphatic endothelial and muscle cells, Lab Chip, 2022, 22(1), 121–135 RSC.
- A. Selahi, S. Chakraborty, M. Muthuchamy, D. C. Zawieja and A. Jain, Intracellular calcium dynamics of lymphatic endothelial and muscle cells co-cultured in a Lymphangion-Chip under pulsatile flow, Analyst, 2022, 147(13), 2953–2965 Search PubMed.
- L. L. Bischel, E. W. K. Young, B. R. Mader and D. J. Beebe, Tubeless microfluidic angiogenesis assay with three-dimensional endothelial-lined microvessels, Biomaterials, 2013, 34(5), 1471–1477 Search PubMed.
- L. L. Bischel, S.-H. Lee and D. J. Beebe, A Practical Method for Patterning Lumens through ECM Hydrogels via Viscous Finger Patterning, J. Lab. Autom., 2012, 17(2), 96–103 Search PubMed.
- M. Tsai, A. Kita, J. Leach, R. Rounsevell, J. N. Huang and J. Moake,
et al., In vitro modeling of the microvascular occlusion and thrombosis that occur in hematologic diseases using microfluidic technology, J. Clin. Invest., 2012, 122(1), 408–418 Search PubMed.
- E. Westein, A. D. van der Meer, M. J. E. Kuijpers, J.-P. Frimat, A. van den Berg and J. W. M. Heemskerk, Atherosclerotic geometries exacerbate pathological thrombus formation poststenosis in a von Willebrand factor-dependent manner, Proc. Natl. Acad. Sci. U. S. A., 2013, 110(4), 1357–1362 Search PubMed.
- N. Kaneko, T. Mashiko, K. Namba, S. Tateshima, E. Watanabe and K. Kawai, A patient-specific intracranial aneurysm model with endothelial lining: a novel in vitro approach to bridge the gap between biology and flow dynamics, J. NeuroInterventional Surg., 2018, 10(3), 306–309 Search PubMed.
- B. K. Walther, N. K. Rajeeva Pandian, K. A. Gold, E. S. Kiliç, V. Sama and J. Gu,
et al., Mechanotransduction-on-chip: vessel-chip model of endothelial YAP mechanobiology reveals matrix stiffness impedes shear response, Lab Chip, 2021, 21(9), 1738–1751 RSC.
- B. Saha, T. Mathur, K. F. Handley, W. Hu, V. Afshar-Kharghan and A. K. Sood,
et al., OvCa-Chip microsystem recreates vascular endothelium–mediated platelet extravasation in ovarian cancer, Blood Adv., 2020, 4(14), 3329–3342 Search PubMed.
-
A. Jain, T. Mathur, N. K. R. Pandian and A. Selahi, Chapter 9 - Organ-on-a-chip and 3D printing as preclinical models for medical research and practice, in Precision Medicine for Investigators, Practitioners and Providers, ed. J. Faintuch and S. Faintuch, Academic Press, 2020, pp. 83–95 Search PubMed.
- T. Mizutani, Y. Miki, H. Kojima and H. Suzuki, Proposed Classification of Nonatherosclerotic Cerebral Fusiform and Dissecting Aneurysms, Neurosurgery., 1999, 45(2), 253 CrossRef CAS PubMed.
- S. R. Botts, J. E. Fish and K. L. Howe, Dysfunctional Vascular Endothelium as a Driver of Atherosclerosis: Emerging Insights Into Pathogenesis and Treatment, Front. Pharmacol., 2021, 12, 787541 Search PubMed.
- H. S. Lew, The role of flow bifurcation in creating an oscillatory flow in capillary blood vessels, J. Biomech., 1972, 5(2), 231–238 Search PubMed.
- L. Genuardi, Y. S. Chatzizisis, C. Chiastra, G. Sgueglia, H. Samady and G. S. Kassab,
et al., Local fluid dynamics in patients with bifurcated coronary lesions undergoing percutaneous coronary interventions, Cardiol. J., 2021, 28(2), 321–329 CrossRef PubMed.
- T. Kume, Lymphatic vessel development: fluid flow and valve-forming cells, J. Clin. Invest., 2015, 125(8), 2924–2926 Search PubMed.
- S. Ciurică, M. Lopez-Sublet, B. L. Loeys, I. Radhouani, N. Natarajan and M. Vikkula,
et al., Arterial Tortuosity, Hypertension, 2019, 73(5), 951–960 Search PubMed.
- J. Zhou, P.-L. Lee, C.-S. Tsai, C.-I. Lee, T.-L. Yang and H.-S. Chuang,
et al., Force-specific activation of Smad1/5 regulates vascular endothelial cell cycle progression in response to disturbed flow, Proc. Natl. Acad. Sci. U. S. A., 2012, 109(20), 7770–7775 CrossRef CAS PubMed.
- P. J. Kilner, G. Z. Yang, R. H. Mohiaddin, D. N. Firmin and D. B. Longmore, Helical and retrograde secondary flow patterns in the aortic arch studied by three-directional magnetic resonance velocity mapping, Circulation, 1993, 88(5 Pt 1), 2235–2247 CrossRef CAS PubMed.
- B. J. Ballermann, A. Dardik, E. Eng and A. Liu, Shear stress and the endothelium, Kidney Int., Suppl., 1998, 67, S100–S108 CrossRef CAS PubMed.
- S. Abou Sherif, O. Ozden Tok, Ö. Taşköylü, O. Goktekin and I. D. Kilic, Coronary Artery Aneurysms: A Review of the Epidemiology, Pathophysiology, Diagnosis, and Treatment, Front. Cardiovasc. Med., 2017, 4, 24 Search PubMed.
- D. M. Sforza, C. M. Putman and J. R. Cebral, Hemodynamics of Cerebral Aneurysms, Annu. Rev. Fluid Mech., 2009, 41, 91–107 Search PubMed.
- T. Tanoue, S. Tateshima, J. P. Villablanca, F. Vinuela and K. Tanishita, Wall shear stress distribution inside growing cerebral aneurysm, AJNR Am. J. Neuroradiol., 2011, 32(9), 1732–1737 Search PubMed.
- A. C. Marquez-Sanchez and E. K. Koltsova, Immune and inflammatory mechanisms of abdominal aortic aneurysm, Front. Immunol., 2022, 13, 989933 Search PubMed.
- M. Zhou, Y. Yu, R. Chen, X. Liu, Y. Hu and Z. Ma,
et al., Wall shear stress and its role in atherosclerosis, Front. Cardiovasc. Med., 2023, 10, 1083547 CrossRef CAS PubMed.
- J. F. LaDisa, L. E. Olson, R. C. Molthen, D. A. Hettrick, P. F. Pratt and M. D. Hardel,
et al., Alterations in wall shear stress predict sites of neointimal hyperplasia after stent implantation in rabbit iliac arteries, Am. J. Physiol., 2005, 288(5), H2465–H2475 CAS.
- S. Morlacchi, B. Keller, P. Arcangeli, M. Balzan, F. Migliavacca and G. Dubini,
et al., Hemodynamics and In-stent Restenosis: Micro-CT Images, Histology, and Computer Simulations, Ann. Biomed. Eng., 2011, 39(10), 2615–2626 CrossRef PubMed.
- G. L. Basatemur, H. F. Jørgensen, M. C. H. Clarke, M. R. Bennett and Z. Mallat, Vascular Smooth Muscle Cells in Atherosclerosis, Nat. Rev. Cardiol., 2019, 16(12), 727–744 CrossRef PubMed.
- E. Solari, C. Marcozzi, D. Negrini and A. Moriondo, Lymphatic Vessels and Their Surroundings: How Local Physical Factors Affect Lymph Flow, Biology, 2020, 9(12), 463 Search PubMed.
Footnotes |
| † Electronic supplementary information (ESI) available. See DOI: https://doi.org/10.1039/d4lc00968a |
| ‡ Present address: Now at Revi Life Sciences Inc, Austin, TX, USA. |
|
| This journal is © The Royal Society of Chemistry 2025 |
Click here to see how this site uses Cookies. View our privacy policy here. 
 Open Access Article
 This Open Access Article is licensed under a Creative Commons Attribution-Non Commercial 3.0 Unported Licence
 a,
Ankit
Kumar
a,
Tanmay
Mathur‡
a,
Ankit
Kumar
a,
Tanmay
Mathur‡


 is instantaneous WSS, and eqn (4) was approximated as eqn (5) by applying eqn (2) and (3) and rearranging the terms. TAWSS and RRT were calculated for the entire length of vessels, and not just in the target regions such as stenosis or aneurysm. The calculated TAWSS was normalized with respect to the TAWSS values obtained by applying the same boundary conditions across a simple, cylindrical lumen with the same inlet diameter and end-to-end length as that of the respective vessel variation analyzed. The calculated RRT was normalized in the same manner as TAWSS.


