
 Open Access Article
 This Open Access Article is licensed under a
 Creative Commons Attribution 3.0 Unported Licence
Evaluating the feasibility of LA-ICP-TOF-MS for the analysis of environmental particle collections†
Benjamin T.
Manard
 *a,
Sarah E.
Szakas
a,
Jordan S.
Stanberry
a,
Brian W.
Ticknor
a,
Leslie
O'Brien
b,
Mark
Boris
b,
Joshua T.
Hewitt
b,
Paula
Cable-Dunlap
b and
Hunter B.
Andrews
*c
*a,
Sarah E.
Szakas
a,
Jordan S.
Stanberry
a,
Brian W.
Ticknor
a,
Leslie
O'Brien
b,
Mark
Boris
b,
Joshua T.
Hewitt
b,
Paula
Cable-Dunlap
b and
Hunter B.
Andrews
*c
aChemical Sciences Division, Oak Ridge National Laboratory, Oak Ridge, TN 37830, USA. E-mail: manardbt@ornl.gov
bNuclear Nonproliferation Division, Oak Ridge National Laboratory, Oak Ridge, TN 37830, USA
cRadioisotope Science and Technology Division, Oak Ridge National Laboratory, Oak Ridge, TN 37830, USA. E-mail: andrewshb@ornl.gov
First published on 26th March 2025
Abstract
Laser ablation-inductively coupled plasma-time-of-flight-mass spectrometry (LA-ICP-TOF-MS) was employed to rapidly analyze environmental particle samples collected using aerosol contaminate extractors (ACE). The ACE particle collectors were placed at various distances (0.5, 1.3, and 4.5 km) from a source that released Ru-bearing particles. Samples for measurement were then generated (as sub-samples) from the ACE collection plates via particle “lift off” with gunshot residue (GSR) tabs. The LA-ICP-TOF-MS method was employed such that 10+ samples could be analyzed in a single unattended analytical session. A 3 × 1 mm area of individual GSR tab samples were analyzed in less than 30 minutes. This provided spatially resolved elemental and isotopic measurements of the particulate content and confirmed the presence of Ru-bearing particles within the complex background environmental particle loading. As anticipated, measurements showed collectors closest to the source had the highest concentration of the released Ru-bearing particles, while all collectors, regardless of distance, contained similar levels of background particles (e.g., Fe and Sr). Sequential scanning electron microscopy – automated particle analysis (SEM-APA) and LA-ICP-TOF-MS analysis was employed for method validation and a demonstration of the multi-modal approach. The same 2-dimensional region was analyzed by both methods and the particles identified via SEM-APA were also detected using LA-ICP-TOF-MS, with 100% accuracy. Overall, LA-ICP-TOF-MS demonstrated its utility for rapid elemental and isotopic particle analysis from environmental air samples.
Introduction
Airborne particulate matter (PM) is universal to the environment,1 having both natural and anthropogenic origins. Examples of natural PM stem from events releasing volatile organic compounds,2 volcanic eruptions,3 and wildfires.4 Human-made PM can be generated through various mechanisms including vehicles,5 mining,6 and industrial emissions.7 Such particles can be toxic and harmful if ingested and are targeted by the Occupational Safety and Health Administration (OSHA) and the World Health Organization (WHO) for their potential role in respiratory problems,8 neurological effects,9 and an increased cancer risk10 from continued exposure. PM has also been linked with climate change11 by impacting sunlight interactions in the atmosphere12 as well as contributes to ecological damage from particle acidity and toxicity in soil and waterways.13 Development of in-field particle collectors allows for the collection, and subsequent characterization, of PM in environmental samples. These technologies include cascade impactors,14,15 high-gradient magnetic force fields,16 aerosol contaminate extractors (ACE),17 and many other types of collectors.Once the particulate matter is collected, analytical techniques can be used to characterize the collected PM, with the specific technique(s) used dependent on the information needed. A recent review by Ogrizek et al.,18 describes these techniques in detail. The gold-standard analysis for trace elements includes inductively coupled plasma-mass spectrometry (ICP-MS) which may require extensive sample preparation steps including hot plate and/or microwave digestions. Other techniques, including X-ray fluoresce microscopy and scanning electron microscopy with energy dispersive X-ray spectroscopy (SEM/EDS), are often employed for nondestructive direct analysis of the collected particles. An alternative approach proposed by Ogrizek et al.,18 which could allow for direct sample analysis (i.e., no sample preparation/pre-treatment) is laser-based sampling (i.e., laser ablation, LA) coupled to ICP-MS. LA-ICP-MS offers unique advantages such as direct analysis of a solid sample by focusing a high energy, pulsed laser at its surface. Upon this laser–sample interaction, a small plasma is formed which vaporizes a portion of the PM present in each location. A carrier gas, typically helium, then transports the vaporized material into the ICP-MS. Sample preparation steps, such as digestion, can dilute the analyte concentration in the sample, resulting in decreased analytical signal. Digestion also homogenizes particle elemental and isotopic information of the sample, which can also reduce sensitivity. Since LA-ICP-MS directly analyzes the surface (i.e. digestion is not needed), sensitivity can be higher, and individual particle elemental and isotopic information can be retained.
Recent efforts have demonstrated the advantages of LA-ICP-MS for the analysis of PM. Van Elteren et al.19 employed LA-ICP-MS for the direct analysis of particles collected on a micro-orifice uniform deposit impactor (MOUDI). This work successfully demonstrated the ability to provide rapid and sensitive analysis, with mapping directly on the surface of the MOUDI filters. Limbeck et al.20 applied LA-ICP-MS for characterizing the elemental content of size-separated particles within a multi-stage low pressure impactor. The authors utilized dried-droplet standards for improved quantification and fixed the particles within glycerol prior to analysis to prevent analyte loss. This analysis was ultimately compared with traditional bulk-digestion ICP-MS approach with good agreement and improved sensitivity. Regarding airborne particulate matter, Ogrizek et al.,21 studied the effects of 213 nm LA as an affordable approach within the realm of LA-ICP-MS.
The work presented here demonstrates efforts to directly analyze particles sampled from an aerosol contaminate extractor (ACE),17,22 which was originally developed at Savannah River National Laboratory (Aiken, SC, USA). The ACE collection device operates by employing electrostatic forces to deposit aerosol particles directly onto a conductive substrate. This substrate was sub-sampled with a carbon – sticky tab (commonly termed gunshot residue tab or GSR tab) for rapid screening via LA-ICP-MS. The primary particles of interest for the technique presented here were ruthenium (Ru) particles which were intentionally aerosolized for field studies. Differing from previous LA-sampling studies, this work investigated the use of a time-of-flight (TOF) mass analyzer to provide improved isotopic determinations of the Ru particles, while also allowing for simultaneous quantification of all nuclides ranging from 7Li–242Pu. This offers the added benefit of non-targeted detection of other particles collected on the surface of the GSR tab without any prior knowledge. In addition, the developed method included an automated-sampling approach in which more than ten samples could be measured unattended. The method was then validated and compared with the more traditional approach of SEM-EDS.
Experimental
Collection of samples
The sample collection and analysis plan are shown in Fig. 1. Samples were collected as part of a field campaign at Idaho National Laboratory (Idaho Falls, ID, USA). In brief, a controlled release of Ru-bearing particles (∼1 μm) was sent through a ventilation stack. Particles were collected, at various distances (0.5, 1.3, and 4.5 km), by the ACE collector,22 onto high purity Si plates. These plates are prepared from 600–700 μm thick, single side polished (SSP), 1–100 Ω cm, Si wafers, cut into 45 × 89 mm pieces. Background samples were collected prior to release of Ru-bearing particles. Post collection, the Si plates were shipped back to Oak Ridge National Laboratory (ORNL, Oak Ridge, TN, USA) for analysis. The plates were then subsampled via carbon-tabs (Forensic field sampler, with adhesive carbon conductive tab, Ted Pella, Redding, CA) on 12.7 mm SEM pin mounts. These “lift-off” samples were then analyzed by SEM-EDS and/or LA-ICP-MS. An example optical image of the lift-off can be seen in ESI† (Fig. S1).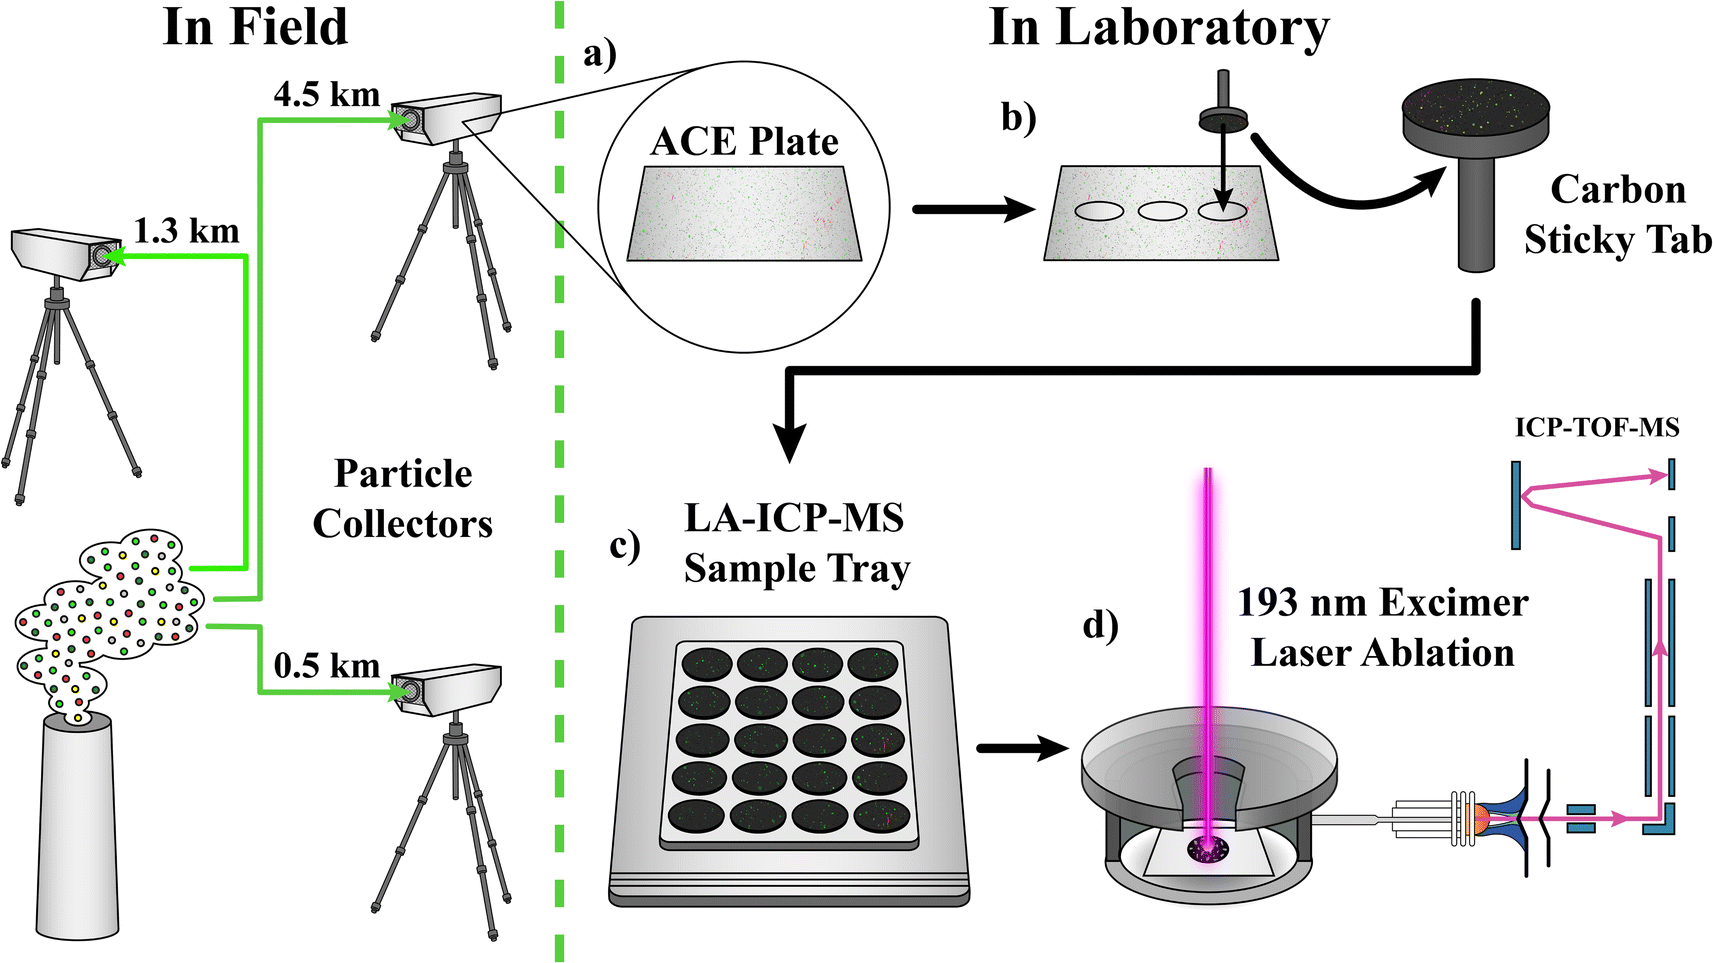 | ||
| Fig. 1 Particle collection (in field) and analysis plan consisting of (a) removing ACE plate from collector, (b) sub-sampling with carbon sticky tab, (c) loading samples into sample tray for (d) subsequent analysis by LA-ICP-TOF-MS. | ||
Scanning electron microscopy/energy dispersive X-ray spectroscopy (SEM/EDS)
Automated Particle Analysis (APA) was performed on a Tescan Mira3 FE-SEM (Tescan Group, Czech Republic) equipped with four (4) EDAX Element EDS detectors (Ametek Inc., USA) and utilized NIST DTSA-II software. APA was performed with an accelerating voltage of 20 kV, beam current of 1 nA, and a working distance of 15 mm. EDS acquisition time was 0.6 seconds. Using copper and carbon as upper and lower reference points, brightness and contrast thresholds were set to target bright, high-Z (high-atomic number) particles with the BSE (backscattered electron) detector. Within a pixel intensity range of 0–255, the software was seeking particles with a brightness of 96 or higher (carbon = 16, copper = 240). To do this, the stage moved in a randomized pattern over the designated analytical area using a 256 μm field of view (FOV), searching for particles that met the BSE threshold conditions and when found, collected an EDS spectrum as well as a small thumbnail BSE image of the analyzed particle. A maximum of 500 particles per FOV and a maximum of 10![[thin space (1/6-em)]](https://www.rsc.org/images/entities/char_2009.gif) 000 particles per sample were analyzed, encompassing >3 h. This leads to only portions of a sample being analyzed if this particle threshold is met prior to complete scanning of the sample.
000 particles per sample were analyzed, encompassing >3 h. This leads to only portions of a sample being analyzed if this particle threshold is met prior to complete scanning of the sample.
After the APA run, fiducial images and coordinates were collected at various magnifications to be used for relocation of particles of interest post analysis. In this case, fiducials were pieces of snipped Cu wire 1–2 mm in length that were placed approximately 120° apart around the edge of the stub. The raw data was processed using NIST Graf software to manually identify element peaks in the EDS spectra. Particles of interest were filtered by composition, and their locations were mapped on the stub for relocation.
Optical imaging
Subsample stubs were imaged using the Zeiss light optical microscope (Axioscope 5, Carl Zeiss Microscopy GmbH, Germany) with an Axiocam 712 12-megapixel camera after APA (nondestructive), and again after laser ablation (destructive). The EC EP 5× objective and the EC DPN 10× objective lenses were used to obtain the desired magnification. Images were taken in both darkfield (DF) and differential interference contrast (DIC) modes. To image the entire 12.5 mm stub, a tiled image was collected using Zeiss Zen Core v3.3 software. Images were modified by cropping, rotating, and applying transparency to ensure proper alignment when overlaying with SEM images and laser ablation maps.Laser ablation-inductively coupled plasma-mass spectrometry
Laser ablation was performed utilizing an excimer-based 193 nm laser (Elemental Scientific Lasers, ESL, Bozeman, MT, USA) imageGEO. The laser delivery was focused through an XYR beam aperture (providing square ablation spots) into a helium (ultra-high purity, 99.994%, Airgas, Radnor, PA, USA)-purged (1000 mL min−1) two-volume (TwoVol3) ablation chamber. The ablated particles were then delivered to a DCI2 injector (ESL) through polyvinyl chloride tubing (Tygon Formulation B-44-4X, 1/8′′ i.d.). In all experiments, the laser was delivered to the sample through a 10 × 10 μm square aperture with a fluence of ∼2 J cm2, at a frequency of 200 Hz. The sample was rastered at 200 μm s−1 providing an effective resolution of 1 μm (horizontally) × 10 μm (vertically).Two different ICP-MS instruments were utilized in this study. The first is a triple quadrupole (TQ)-based ICP-MS (Thermo Scientific iCAP TQ, Bremen, Germany). This detection platform was tuned for optimum sensitivity of 238U, via ablation of National Institute of Standards (NIST) glass 610. For this set-up, the sample gas was tuned to 700 mL min−1, and with 5 mm sampling depth. In addition to tuning for optimum sensitivity, the washout characteristic of the TV3 cell was tuned to 20 ms, by monitoring the 238U signal from a single pulse (10 × 10 μm) on NIST 610 glass. Data was collected such that the total duty cycle for the measurement of 57Fe, 88Sr, 101Ru, 102Ru, and 238U was 20 ms.
A TOF-based ICP-MS (icpTOF R, TOFWERK AG, Thun, Switzerland) was also employed to compare detection platforms. For this analysis (LA-ICP-TOF-MS), the entire sample introduction was mimicked from the LA-ICP-TQ-MS set up, including DCI2 injector, tubing length, and washout times. Regarding ICP-TOF-MS measurements, 20 ms was used for the acquisition times. All data (ICP-TQ-MS and ICP-TOF-MS) was processed in iolite 4.23
Results and discussion
Comparison of ICP-TQ-MS and ICP-TOF-MS for Ru isotopic determination
Differences in quadrupole and TOF-based mass analyzers are well-characterized in the realm of single particle (SP) and laser ablation (LA) – based sampling mechanisms. ICP-TOF-based platforms offer unique advantages including quasi-simultaneous measurement of all nuclides, with fast acquisition rates, which makes it a beneficial platform for fast-transient measurements including LA and SP introductions. For SP-based introduction, particle transient time is typically 200–500 μs,24–26 which makes the fast acquisition rates and lack of settling time of the TOF-based instruments an ideal platform for multi-nuclide detection. Here, collected Ru-bearing particles on ACE plates (0.5 km collection) were subsampled and subjected to both LA-ICP-TQ-MS (which could be considered advantageous when needing measurement sensitivity) and LA-ICP-TOF-MS (which could be considered advantageous when needing faster acquisition times, and full nuclide coverage). An example transient of the 101Ru and 102Ru signal from an ablated Ru particle from both instrument methods can be seen in ESI† (Fig. S2). This signal transient mimics the transient of a typical washout from a single pulse-ablation “destructive” washout experiment (50+ ms), and does not mimic work previously found with “nondestructive” laser sampling (<0.5 ms) by Thibaut et al.27 This is most likely due to different laser energies and particle compositions. Both factors have been previously shown to cause different sample–laser interactions which, in turn, can affect the mechanism of material lift-off as well as the amount of material ablated.When exploring the isotopic determination of the 101Ru/102Ru pair, as a function of mass analyzer, a clear improvement in precision is observed with the TOF-based platform compared to the TQ-based platform, as depicted in Fig. 2.
 | ||
| Fig. 2 Isotope plots generated from LA-ICP-MS analysis of collected Ru particles for ICP-TQ-MS (●) and ICP-TOF-MS (▲) as a function of 101Ru and 102Ru counts (left) and 101Ru/102Ru versus102Ru counts (right). The natural isotopic ratio is shown in all plots as the dashed line. | ||
The precision of Ru isotopic ratio is improved (>3× in % RSD) due to simultaneously measuring both isotopes in the material vaporized from a single particle. This has been demonstrated in the field of LA-ICP-MS for particle measurements,28 as well as SP-ICP-MS.29 In addition to the improved isotopic determination, the ICP-TOF offers the ability to perform both targeted and untargeted analysis by way of detecting all nuclides quasi-simultaneously. This is beneficial for complex environmental samples and offers an advantage over the TQ-based technique, which is essentially limited in the number of detectable nuclides by settling, dwell, and washout times. One consideration when using TOF-platforms is the % relative difference from the expected isotopic ratio, which was −5.7% for the ICP-TOF data. Bauer et al.,30 observed a similar trend in LA-ICP-TOF-MS where the RD was <0.7% for a quadrupole-based and <4% for the TOF-based platforms. Fortunately, any mass biases can be corrected for using standards, although this was not performed in the current study. With these considerations, the ICP-TOF-MS was employed as the primary detection platform throughout this text.
Automated ICP-TOF-MS for analysis of particle collects
Automated sample analysis is well established for solution-based ICP-MS measurements and SP-based measurements31 but has been minimally utilized in the realm of LA-ICP-MS, with some exceptions.32,33 A primary reason is due to sample size limitations (2-dimensionally), but recent developments in automated sample exchanges have allowed for greater sample throughput. Here, we presented a sequence and sampling approach in which 13 samples were analyzed unattended. The sample tray for the method (depicted in Fig. 1) contained instrument calibration standards, along with 13 samples to be measured. In this instance, a sequence was generated (in the AV2 software, ESI) such that the following queue was processed: carbon-tab blank (1), 0.5 km background (1), 0.5 km release (3×), 1.3 km background (1), 1.3 km release (3×), 4.5 km background (1), and 4.5 km release (3×). Regarding the replicates, these are replicate lift-offs, from the same ACE plate (i.e., subsample). Each sample was analyzed in a 3 × 1 mm area and analysis time for each sample was <30 min and the entire sequence was <7 h. These sequences were analyzed on two separate days (new locations within the samples). For each mapped area, collected particles were distinguished from the GSR substrate using a particle identification tool in iolite 4.34 This tool used an auto contours algorithm with user defined thresholds, based on background and particle signal. The average nuclide counts from the cumulative particle regions of interest were normalized to their maximum values within each sequence for ease in comparison. Note, the uncertainties on each bar can exceed unity due to this scaling. These normalized ICP-TOF-MS intensities are compiled in Fig. 3. | ||
| Fig. 3 Nuclide counts (101Ru, 88Sr, and 57Fe) normalized to their respective maximum value within each sequence from LA-ICP-TOF-MS analysis. | ||
The 88Sr and 57Fe are indicative of background, “bkg”, particles that are present in the collection environment. To reiterate, the ICP-TOF-MS permits the quasi-simultaneous detection of nuclides which provides a more holistic understanding of these environmental collections; while 88Sr and 57Fe are shown as the selected background analytes, many other elements were available. The “GSR blank” should not have any particles present on the surface, and as shown by Fig. 2, no counts of the three nuclides selected were detected. The different locations sampled may have variable numbers of background particles, even before the release of Ru particles, but their composition should be equivalent. This is evident in the respective “bkg” samples that have similar levels of Sr and Fe. Paired T-tests between background samples and release samples within each sequence found there to be no statistical differences in 88Sr and 57Fe counts at a 95% confidence interval. There was a noticeable trend in the detection of Ru particles between the 0.5, 1.3, and 4.5 km collects. On average, there was 1.8 ± 0.7× greater Ru particle loading detected on the 0.5 km collector plate in comparison to the 1.3 km location, and no detected particles at 4.5 km distance. There were no noticeable differences in 101Ru/102Ru isotope ratio with averages of 0.518 ± 0.0150 and 0.526 ± 0.0523 for the 0.5 and 1.3 km samples, respectively, which could be indicative that they came from the same source. These results were also constructed in a 2-dimensional (2D) isotopic map, and example(s) from the GSR blank, 0.5 km – background, 0.5 km release, and 1.3 km release are presented in Fig. 4. While the same trend is evident, the 2D image provides context to the spatial location of the Ru particles in comparison to the background (Fe/Sr).
 | ||
| Fig. 4 2-D isotopic maps generated from LA-ICP-TOF-MS data for the GSR-blank, 0.5 km background, 0.5 km release, and 1.3 km release. | ||
SEM-EDS combined with LA-ICP-TOF-MS for method validation
The ability to integrate these LA-ICP-MS measurements with other analytical techniques was used for multi-modal analysis. The LA samples were also analyzed with fiduciary components, such that the data and images could be aligned. This process was achieved by placing 0.3 mm (diameter) copper wire, 2 mm (length) onto the GSR tab in a triangular fashion. These fiducial locations were optically located by each instrument (SEM and LA system), which allows for easy transcription of coordinates to ensure maps and images were properly overlayed. Herein, the SEM automated particle analysis (APA) was employed to target Ru-bearing particles. The results generated with APA, can be seen in Fig. 5 (SEM Particle Finder) where 12 Ru particles were detected in the analyzed area. It should be noted that the entire GSR-tab is not analyzed, but rather, random sections are mapped until the total particle count (of all particles) does not exceed 10000 particles. The sample was then transferred from the SEM-APA instrument, into the LA-chamber and a targeted region was identified, as indicated by the rectangle in Fig. 5. In this selected region, SEM-APA located 4 Ru particles. LA-ICP-TOFMS of this area of interest was performed under conditions identical to those previously described. Within the region measured, the LA-ICP-TOF-MS approach was able to correctly identify all four APA located particles and two additional particles.
 | ||
| Fig. 5 Workflow and analysis from SEM-APA and subsequent LA-ICP-TOF-MS for Ru-bearing particle mapping. All red scale bars represent 1 μm. The SEM-APA searched regions are superimposed on the LA-ICP-TOF-MS map with the checkered areas. | ||
The Ru particles detected by the SEM-APA method clearly demonstrate the collection of agglomerates (e.g., P1 = 3, P2 = 1, P3 = 10+, and P5 = 3) on the surface of the GSR-tab. While these may not show up as multiple resolved signal spikes, further investigation utilizing the particle analysis tool34 corroborates the presence of these agglomerates through signal intensity. The largest integrated signals detected, 6.2 × 10⁴ and 2.5 × 10⁴ counts, corresponds with P3 and P5, respectively. Note: the large appearance of P2 is due to differences in magnification between the images.
Conclusions
An automated, high throughput, sensitive, and accurate characterization of elemental and isotopic content of environmental PM was achieved via LA-ICP-TOF-MS. Ru particles released into the environment through a ventilation stack were collected at three different standoff distances using aerosol contaminate extractor(s) (ACE). Once collected, the plates containing the particles were sub-sampled by “lift-off” with GSR-tabs mounted on a typical SEM-stub. These stubs were analyzed via laser-based sampling, into an ICP-TOF-MS detection platform. In all, these samples (10+) were analyzed in under 7 hours, unattended. The results from the LA-ICP-TOF-MS method revealed more Ru particles at the collections closest to the source, while the environmental particles (i.e., Fe, and Sr) remained relatively uniform through the collections at any distances pre- and post-release. The method was also combined with SEM-APA to provide validation of the method, compare the detected number of detected particles, and to showcase the spatial integrity of particle data from the LA-ICP-TOF-MS method. The method, presented here, provides a unique approach to rapid particle screening. One could envision this method being implemented into two workflows for the analysis of particle collects in the field. Firstly, it could be used as a pre-screening/down selecting tool to aid in further decision making. If particles of interest are detected within the sub-sampled GSR-lift off, the collection plate could still be interrogated by bulk-digestion-based ICP analysis, or other analytical approaches. Secondly, if particles of interest are identified by the SEM-APA approach, LA-ICP-TOF-MS could be implemented to isotopically map the respective area and provide isotopic context to the particles of interest.Data availability
The authors are happy to provide data upon request.Conflicts of interest
There are no conflicts to declare.Acknowledgements
This work was supported by the Laboratory Directed Research and Development Program of Oak Ridge National Laboratory, managed by UT-Battelle, LLC, for the United States Department of Energy, under contract DE-AC05-000R22725. The authors would like to also acknowledge Jacquelyn DeMink (ORNL) for the assistance with graphics. The US government retains and the publisher, by accepting the article for publication, acknowledges that the US government retains a nonexclusive, paid-up, irrevocable, worldwide license to publish or reproduce the published form of this manuscript, or allow others to do so, for US government purposes. DOE will provide public access to these results of federally sponsored research in accordance with the DOE Public Access Plan (http://energy.gov/downloads/doe-public-access-plan).References
- M. F. Hochella Jr, D. W. Mogk, J. Ranville, I. C. Allen, G. W. Luther, L. C. Marr, B. P. McGrail, M. Murayama, N. P. Qafoku and K. M. Rosso, Science, 2019, 363, eaau8299 Search PubMed.
- M. Odabasi, O. Ongan and E. Cetin, Atmos. Environ., 2005, 39, 3763–3770 CrossRef.
- J. L. Stith, P. V. Hobbs and L. F. Radke, J. Geophys. Res.:Oceans, 1978, 83, 4009–4017 CrossRef.
- U. Makkonen, H. Hellén, P. Anttila and M. Ferm, Sci. Total Environ., 2010, 408, 644–651 CrossRef PubMed.
- T. Grigoratos and G. Martini, Environ. Sci. Pollut. Res., 2015, 22, 2491–2504 CrossRef PubMed.
- J. Kasongo, L. Y. Alleman, J.-M. Kanda, A. Kaniki and V. Riffault, Sci. Total Environ., 2024, 175426 Search PubMed.
- B. Grobéty, R. Gieré, V. Dietze and P. Stille, Elements, 2010, 6, 229–234 Search PubMed.
- J. K. Nagar, A. Akolkar and R. Kumar, Int. J. Environ. Sci., 2014, 5, 447–463 Search PubMed.
- H. Kim, W.-H. Kim, Y.-Y. Kim and H.-Y. Park, Front. Public Health, 2020, 8, 575330 Search PubMed.
- A. Valavanidis, K. Fiotakis and T. Vlachogianni, J. Environ. Sci. Health C, 2008, 26, 339–362 Search PubMed.
- G. Myhre, C. L. Myhre, B. Samset and T. Storelvmo, Nature Education Knowledge, 2013, 4, 7 Search PubMed.
- B. Zhang, Journal of Geoscience and Environment Protection, 2020, 8, 55 Search PubMed.
- S. Yousuf, A. Donald and A. Hassan, MOJ Ecology & Environmental Sciences, 2022, 7, 1–5 Search PubMed.
- K. May, J. Sci. Instrum., 1945, 22, 187 Search PubMed.
- K. L. Rubow, V. A. Marple, J. Olin and M. A. McCawley, Am. Ind. Hyg. Assoc. J., 1987, 48, 532–538 Search PubMed.
- M.-D. Cheng, B. L. Murphy, J.-W. Moon, G. M. Lutdka and P. R. Cable-Dunlap, J. Aerosol Sci., 2018, 120, 22–31 CrossRef.
- P. Cable-Dunlap, L. Trowbridge, D. Bostick, D. Lee, B. Anderson, A. Harter, R. Kapsimalis, L. Sexton, J. De Gange and D. Radford, J. Radioanal. Nucl. Chem., 2013, 296, 943–949 CrossRef.
- M. Ogrizek, A. Kroflič and M. Šala, Trends Environ. Anal. Chem., 2022, 33, e00155 CrossRef.
- M. S. Robinson, I. Grgić, V. S. Šelih, M. Šala, M. Bitsui and J. T. Van Elteren, Atmos. Meas. Tech., 2017, 10, 1823–1830 Search PubMed.
- S. Rovelli, W. Nischkauer, D. M. Cavallo and A. Limbeck, Anal. Chim. Acta, 2018, 1043, 11–19 CrossRef PubMed.
- M. Ogrizek, A. Kroflič and T. Vaculovič, et al. , Air Qual., Atmos. Health, 2023, 16, 1227–1237 Search PubMed.
- D. C. Carlson, J. J. Degange and P. Cable-Dunlap, US Pat., US6964189, 2005 Search PubMed.
- C. Paton, J. Hellstrom, B. Paul, J. Woodhead and J. Hergt, J. Anal. At. Spectrom., 2011, 26, 2508–2518 Search PubMed.
- M. Resano, M. Aramendía, E. García-Ruiz, A. Bazo, E. Bolea-Fernandez and F. Vanhaecke, Chem. Sci., 2022, 13, 4436–4473 RSC.
- M. D. Montaño, J. W. Olesik, A. G. Barber, K. Challis and J. F. Ranville, Anal. Bioanal. Chem., 2016, 408, 5053–5074 Search PubMed.
- J. W. Olesik and P. J. Gray, J. Anal. At. Spectrom., 2012, 27, 1143–1155 Search PubMed.
- T. Van Acker, A. Rua-Ibarz, F. Vanhaecke and E. Bolea-Fernandez, Anal. Chem., 2023, 95, 18579–18586 Search PubMed.
- F. Pointurier, A.-C. Pottin and A. Hubert, Anal. Chem., 2011, 83, 7841–7848 CrossRef CAS PubMed.
- X. Tian, H. Jiang, M. Wang, W. Cui, Y. Guo, L. Zheng, L. Hu, G. Qu, Y. Yin and Y. Cai, Anal. Chim. Acta, 2023, 1240, 340756 CrossRef CAS PubMed.
- O. B. Bauer, O. Hachmöller, O. Borovinskaya, M. Sperling, H.-J. Schurek, G. Ciarimboli and U. Karst, J. Anal. At. Spectrom., 2019, 34, 694–701 Search PubMed.
- B. T. Manard, V. C. Bradley, C. D. Quarles, L. Hendriks, D. R. Dunlap, C. R. Hexel, P. Sullivan and H. B. Andrews, Nanomaterials, 2023, 13, 1322 Search PubMed.
- K. Löhr, O. Borovinskaya, G. Tourniaire, U. Panne and N. Jakubowski, Anal. Chem., 2019, 91, 11520–11528 Search PubMed.
- P. Vermeesch, M. Rittner, E. Petrou, J. Omma, C. Mattinson and E. Garzanti, Geochem. Geophys. Geosyst., 2017, 18, 4096–4109 Search PubMed.
- H. B. Andrews, C. D. Quarles Jr, V. C. Bradley, T. L. Spano, J. A. Petrus, B. Paul, N. A. Zirakparvar, D. R. Dunlap, C. R. Hexel and B. T. Manard, Microchem. J., 2024, 196, 109605 Search PubMed.
Footnote |
| † Electronic supplementary information (ESI) available. See DOI: https://doi.org/10.1039/d5ja00009b |
| This journal is © The Royal Society of Chemistry 2025 |