
A Gaussian spot overlap ablation model for prediction of aluminium alloy spectral peak intensity in high pulse repetition frequency LIBS
Dongming
Qu
ab,
Bohao
Su
ab,
Zhongshu
Bai
c,
Biye
Liu
d,
Xueying
Jin
ab,
Guanyu
Chen
ab,
Yuting
Fu
ab,
Tingwen
Gu
ab,
Guang
Yang
 *ab and
Qingkai
Li
*ab
*ab and
Qingkai
Li
*ab
aCollege of Instrumentation and Electrical Engineering, Jilin University, Changchun 130061, P. R. China. E-mail: yangguang_jlu@163.com; liqk@jlu.edu.cn
bJilin Provincial Key Laboratory of Trace Analysis Technology and Instruments, Changchun, 130061, Jilin, P. R. China
cChangchun New Industries Optoelectronics Tech. Co., Ltd, Changchun, 130103, Jilin, P. R. China
dBeijing Orient Institute of Measurement&Test, Beijing, P. R. China
First published on 7th November 2024
Abstract
The use of microjoule high pulse repetition frequency (PRF) lasers as excitation sources is an important direction in the miniaturisation of laser-induced breakdown spectroscopy (LIBS) instruments. However, high PRF LIBS is sensitive to experimental parameters, and the relationship between the experimental parameters and the spectral intensity of high PRF LIBS is less studied. In this work, we present a model based on Gaussian spot overlapping ablation with aluminium alloys as samples. After the index values have been collected in the non-motion state, the model derivation formula can be used to calculate the intensity of the spectral peaks under any proposed experimental parameters in the motion state. The experimental results show that the mean relative error (MRE) between the measured and predicted values of spectral peak intensity is ≤0.15 under different experimental parameters, and this result proves the validity of the model in predicting the spectral peak intensity. Meanwhile, we used 5 standard aluminium alloy samples to construct the standard curves of measured and predicted values under different experimental parameters. The experimental results show that the MRE between the measured and predicted values is ≤0.15, and the two standard curves fitted with the measured and predicted values have a high similarity with an average R2 ≥ 0.85. This study is expected to provide a universally applicable and efficient method for the quantitative analysis of high PRF LIBS in different application scenarios.
1 Introduction
Laser-induced breakdown spectroscopy (LIBS) is a rapid elemental analysis technique, which has the advantages of simple operation, rapid real-time analysis, and simultaneous multi-element detection.1,2 In order to meet the demand for portable and real-time testing instruments in various fields, researchers have worked on miniaturization of experimental setups, making them as portable as possible since the 90s.3,4Laser is an important part of LIBS systems. One of the primary goals of LIBS instrument portability is to miniaturize the laser.5 At present, the existing commercial handheld LIBS instruments can be divided into two categories according to the characteristics of the laser.6,7 The first type of instrument has a laser with a single pulse energy of 1–50 mJ and a pulse repetition frequency (PRF) of 1–200 Hz, represented by the Z series products produced by SciAps Co., Ltd. This instrument is capable of analysing the most common metal elements and can be combined with a built-in Ar gas purging device to achieve quantitative analysis of the C element in carbon steel.8 The second type of instrument has a laser single pulse energy of 1–200 μJ and a laser PRF of 1–10 kHz. Representative instruments include the Nano LIBS series produced by B&W Tek. The instrument is equipped with a highly stable micro-laser and an ultra-high-speed spectrometer that can detect most light elements. At the same time, the instrument provides an Ar gas purge function to enhance the spectral signal.9
In terms of market share, low-energy high-frequency lasers as excitation sources are the mainstream of handheld LIBS instruments.7 Compared with the low-frequency excitation source, the high PRF LIBS system excites the sample to produce plasma at a high frequency, which can significantly improve the spectral collection speed of LIBS technology in practical applications.10 At the same time, more representative spectral data of the surface line region of the sample can be acquired in the motion acquisition, which is unique to high PRF LIBS systems.11
In recent years, high PRF LIBS has attracted the attention of researchers due to its unique properties. Gabriele Cristoforetti et al. used an electronically Q-switched Nd:YAG mini-laser with a repetition frequency of 8 kHz as the excitation source to validate the potential of high PRF LIBS for applications in the quantitative analysis of alloys, while observing the morphology of the ablation crater after ablating the same region with thousands of pulses.6 Tetsuhiko Matsuda et al. used a Q-switched Nd:YAG laser with a repetition frequency of 1 kHz to collect the spectral data of the moving samples and investigated and analysed the effect of repetition frequency and motion speed on the spectral data, as well as summarising the effect of experimental parameters on the morphology of ablation grooves.4 Enlai Wan et al. combined LIBS with single particle aerosol mass spectrometer (SPAM) technology to detect aerosols generated during the soldering process, achieving online monitoring of changes in carbon concentration under atmospheric conditions, while using specific molecular structures to complete semi-quantitative analyses of Pb and Sn in fumes from tin filaments.12,13 In a recent study, Zhiying Xu et al. used a fibre laser tunable in the range of 30–60 kHz as an excitation source and constructed a mathematical model of motion ablation based on the repeated ablation area of ablation craters, deriving and proving the functional correlation between the spectral intensity and the single point pulse number (SPPN).10 However, the high-frequency ablation effect of high PRF LIBS on the same point of the sample surface in fixed acquisition mode (non-motion state) is not negligible, and there are relatively few studies involving the relationship between motion and fixed acquisition modes.
In studies involving laser–sample interactions, since Laser Ablation-Inductively Coupled Plasma Mass Spectrometry (LA-ICP-MS) uses laser ablation to generate aerosols in which the density of the aerosol needs to be tightly controlled, the process of laser ablation of samples has been intensively investigated by researchers in the field.14 As early as 1998, S. M. Eggins et al. used aluminosilicate glass as a sample and used scanning electron microscopy (SEM) to observe the cross-section and the edge of the ablation crater formed by 2400 pulsed laser ablation at the same point, and revealed the phenomenon of narrowing aperture diameter as the depth of the ablation crater increases.15 In 2016, H. Nováková et al. compared the differences between aerosols formed by point ablation and motion ablation in terms of particle concentration and particle volume and observed the deposited particles around the ablation crater on the nanoscale, and the study proved the advantages of motion ablation in terms of stability.16 In 2024, M. Holá et al. constructed a model for describing ablation crater overlap under motion ablation and photographed the morphology of ablation grooves formed at different rates of overlap using SEM, which demonstrated that the particle concentration generated decreased as the overlap of the ablation crater increased.17 Although there are fewer direct observations of the plasma formed by laser ablation in LA-ICP-MS, its research on laser–sample interactions has guiding significance for LIBS technology.
In this work, based on the constructed microjoule high PRF LIBS experimental platform with 5 aluminium alloy standard samples, we have thoroughly studied the effect of the motion acquisition mode on the spectral data under different experimental parameters. The study combines the spectral acquisition results in the fixed acquisition mode and builds a model of overlapping ablation based on Gaussian spots, which can fit the spectral intensity of the microjoule high PRF LIBS under any experimental parameters, so as to better guide the rapid online monitoring of alloy samples in different application scenarios.
2 Experimental
2.1 Experimental setup
We constructed a multifunctional LIBS system based on a frequency-tunable microjoule high pulse repetition frequency (PRF) laser (MPL-H-1064, Changchun New Industries Optoelectronics Technology Co., Ltd) with a single-pulse energy of 100 μJ, a repetition frequency tuning range of 0.5–2.5 kHz, a divergence angle of the laser of <1.5 mrad and M2 < 1.5. The laser frequency was controlled by the external input pulse, and we used a self-developed signal synchronous controller to control the repetition frequency of the laser. We incorporated a high-speed photodetector (818-BB-21, 1.2 GHz, Newport) into the LIBS system to verify that the laser output frequency matches the signal synchronous controller output frequency.The laser pulse is focused onto the sample surface through a plano-convex lens with a focal length of 50 mm at an angle of 90°. The sample stage is an electric displacement X stage (TSA30-C, Zolix, China) with a travel distance of 30 mm, a maximum speed of 10 mm s−1, and an accuracy of 0.625 μm. We place an industrial intensified charge-coupled device (ICCD) camera (iStar DH-334T, AndorTech.) in front of the sample stage to ensure that the upper surfaces of all samples were at the same height when changing samples and to photograph the plasma. The plasma is collected by a focusing lens (focal length 50 mm) with an angle of 45° to the sample surface and transmitted through an optical fibre to a mini fiber optic spectrometer (AvaSpec-Mini, Avantes). The spectrometer has a spectral resolution of 0.20–0.29 nm in the 220–400 nm wavelength range. The experimental setup of LIBS in this work is shown schematically in Fig. 1.
 | ||
| Fig. 1 Schematic diagram of the experimental setup for the high PRF LIBS system. The displacement stage carries the sample, which is moved horizontally while the laser ablates the sample, the output signals from the photodetector and synchronous controller are simultaneously input to an oscilloscope, and the ICCD corrects the height of the upper surface of the sample and photographs the plasma. | ||
2.2 Sample
Five standard industrial aluminium alloys of type 6063 (Chinese industrial standard) were selected as experimental samples. The experimental samples are shown in Fig. 2. Since the heights of the samples were slightly different, an ICCD combined with a displacement stage was used to align the upper surfaces of all the samples at the same height. The contents (%) of the main components of all aluminium alloys are shown in Table 1. | ||
| Fig. 2 Standard aluminium alloy samples used in the experiment. | ||
| No | Fe | Cu | Mg | Mn | Zn | Ti | Cr |
|---|---|---|---|---|---|---|---|
| 1# | 0.459 | 0.016 | 0.219 | 0.207 | 0.201 | 0.0042 | 0.0047 |
| 2# | 0.352 | 0.053 | 0.390 | 0.151 | 0.144 | 0.0098 | 0.010 |
| 3# | 0.258 | 0.103 | 0.606 | 0.099 | 0.090 | 0.050 | 0.050 |
| 4# | 0.150 | 0.149 | 0.817 | 0.051 | 0.047 | 0.112 | 0.101 |
| 5# | 0.045 | 0.188 | 1.010 | 0.010 | 0.010 | 0.153 | 0.150 |
3 Results and discussion
3.1 Effect of experimental parameters
In this work, we focus on the effect of laser repetition frequency and motion speed on the spectral data. The experimental parameters that can be controlled in the motion acquisition mode of the PRF LIBS system include: laser repetition frequency (0.5–2.5 kHz), motion speed (0.5–3.5 mm s−1), and integration time. We first collected the spectral data of sample 1# under the conditions of a motion speed of 1 mm s−1 and a laser repetition frequency of 1 kHz. In order to ensure that the collected spectral data do not exceed the spectrometer integration limit, we set the integration time to 10 ms.11 At the same time, we removed the spectral data collected during acceleration and deceleration to ensure that the spectral data are not affected by the change of the motion speed, and the spectrum after averaging 50 acquisitions is shown in Fig. 3. | ||
| Fig. 3 The average spectra were collected at a motion speed of 1 mm s−1, a laser repetition frequency of 1 kHz, and an integration time of 10 ms. | ||
According to the spectra shown in Fig. 3, compared with conventional high-energy LIBS, when the aluminium alloy samples are ablated using the microjoule high PRF LIBS, the spectra contain a large number of ionic emission lines such as Mg II 279.55 nm and Mn II 260.56 nm, which have the highest peak spectral intensity, in addition to the conventional atomic emission lines such as Al I 237.31 nm and Mg I 285.21 nm. However, compared to the highest concentration of Al element in aluminium alloy samples, the self-absorption of the spectral lines of trace elements is weaker, which is more suitable for the quantitative analysis of elemental concentration.18 At the same time, relevant studies have shown that the ionic lines play an important role in analysing the concentration of trace elements as well as the hardness of the alloy samples,19,20 and therefore we have finally selected the four representative atomic/ion lines for further studies, including Mn I 257.55 nm, Mn II 260.56 nm, Mg I 285.21 nm, and Mg II 280.27 nm, as shown in the 4 spectral lines labelled in Fig. 3.
We increase the motion speed from 0.5 mm s−1 to 3.5 mm s−1 with an accuracy of 1 mm s−1. At the same time, we increase the laser repetition frequency from 0.5 kHz to 2.5 kHz with an accuracy of 0.5 kHz at each motion speed (equivalent stepping within the controllable range). In order to ensure the completeness of the spectral peak as much as possible (the spectral peak intensity does not exceed the integration limit of the spectrometer), we set the integration time of the spectrometer to 10 ms to collect the spectral data of sample 1# under these 24 combinations of parameters and extracted 4 spectral lines. The variation curves of the spectral peak intensities versus the experimental parameters are shown in Fig. 4.
 | ||
| Fig. 4 Spectral peak intensity versus laser repetition frequency curves at 4 motion speeds: (a) motion speed 0.5 mm s; (b) motion speed 1.5 mm s; (c) motion speed 2.5 mm s; (d) motion speed 3.5 mm s−1. | ||
According to Fig. 4 we can intuitively observe that when the motion speed is the same, the spectral peak intensity is enhanced with the increase of the laser repetition frequency, but the two are not linearly related, and the fluctuation of the spectral peak intensity is the strongest when the motion speed is 0.5 mm s−1.
In order to study the effect of laser repetition frequency on the spectra in the motion ablation mode in more detail, we controlled the motion speed to be 0.5 mm s−1, and took images of ablation craters on the surface of the samples at lower laser repetition frequencies (5 Hz and 10 Hz) as well as at 0.5 kHz and 2.5 kHz, as shown in Fig. 5.
 | ||
| Fig. 5 Sample surface ablation craters after ablating the sample with different laser repetition frequencies at a motion speed of 0.5 mm s−1. (a) Laser repetition frequency of 5 Hz; (b) laser repetition frequency of 10 Hz; (c) laser repetition frequency of 0.5 kHz; (d) laser repetition frequency of 2.5 kHz. | ||
According to the experimental results in Fig. 5, the ablation craters on the surface of the sample gradually become denser and form ablation grooves with the increase of the laser frequency at the same movement speed. By comparing Fig. 5c and d, we speculate that the ablation grooves formed at higher repetition frequencies are deeper. Related research has shown that when the number of lasers ablating the same region of the sample increases, the ablation space formed at the bottom of the ablation crater becomes narrower as the crater becomes deeper.15 Therefore, we speculate that in the motion ablation mode, the ablation volume of the sample does not increase linearly with the increase of the overlap rate of the ablation craters, and that there will be fluctuations in the radiation intensity of the formed plasma.
At the same time, we photographed the plasma using an ICCD in order to exclude interactions between adjacent plasmas generated by the laser. We set the single exposure time of the ICCD to 200 ns and photographed the plasma at 5 μs, 10 μs, 15 μs, and 20 μs after plasma generation. The experimental results are shown in Fig. 6.
 | ||
| Fig. 6 Time-resolved plasma images of a single laser pulse. The gate width of the ICCD is 200 ns. (a) Delay time of 5 μs; (b) delay time of 10 μs; (c) delay time of 15 μs; (d) delay time of 20 μs. | ||
The experimental results show that compared with the plasma generated by the high-energy laser with a longer lifetime,21,22 the plasma generated by the microjoule laser dissipates faster, and the lifetime is about 20 μs. Therefore, when the laser frequency does not exceed 5 kHz, there will be no interaction between the adjacent plasmas.
In combination with the ablation groove image of Fig. 5, we re-analysed the experimental results presented in Fig. 4. The diameter of the ablation craters formed by a single pulsed laser beam is about 70 μm as measured by the resolution plate, and the morphology between the ablation craters is roughly the same. We therefore speculate that the overlap between ablation craters is denser when the motion speed is slower and the laser repetition frequency is higher. Due to the limited range of laser repetition frequencies (0.5–2.5 kHz), theoretically the richest ablation state will be achieved when the motion speed is 0.5 mm s−1, including separate ablation crater, sparse ablation crater overlap, and dense ablation crater overlap. This is the reason why Fig. 4a shows a large fluctuation.
In this section, we traverse the experimental parameters in the high PRF LIBS system while taking ablation crater images. By comparing the ablation morphology under different parameters, we speculate that the overlapping state of the ablation craters is the central cause of the spectral peak intensity. Therefore, in the next section, we construct an ablation model that includes motion speed, laser repetition frequency, ablation crater diameter, ablation crater overlap rate, and spectrometer integration time to clearly explain the effects of experimental parameters on spectral data in motion acquisition mode.
3.2 Construction of the ablation model
 | ||
| Fig. 7 (a) Spectral peak intensity of the plasma produced by each laser beam ablating the sample. (b) Plasma image of the 1st laser; (c) plasma image of the 100st laser; (d) plasma image of the 200st laser; (e) plasma image of the 300st laser; (f) plasma image of the 400st laser. | ||
The curve illustrated in Fig. 7a shows a very distinctive fluctuation, where the peak spectral intensity rapidly increases and then rapidly decreases from the 1st to the 150th laser ablation. The peak spectral intensity increases a second time as the laser continues from the 150th to the 300th ablation, and the peak spectral intensity finally decreases until it tends to be close to 0 a.u. after the 300th ablation.
We propose a possible explanation for this phenomenon in conjunction with related studies of laser–sample interactions. As the number of times the laser repeatedly ablates a point on the surface of the sample increases, the ablation crater in that region will form an inverted conical structure that has been demonstrated.15 Meanwhile, in existing studies of millijoule LIBS systems, researchers have demonstrated that as the number of ablations increases, a ‘self-hole’ will form in this region, and that the formation of spatial confinement within the hole can enhance the spectral intensity when the hole is shallower.23 To explain this phenomenon more deeply, we took plasma images using an ICCD when the 1st, 100th, 200th, 300th, and 400th laser beams ablated a fixed point on the sample surface, and the image results are shown in Fig. 7b–f.
The laser used in the manuscript has a single pulse energy of 100 μJ, which is much smaller than the lasers used in conventional LIBS systems (50–100 mJ), and therefore the single pulse ablates less of the sample, which results in the ablation crater deepening more slowly in the vertical direction, thus observing the effect of the depth of the ablation crater on the spectral intensities with much smaller precision.
When the 1st laser beam ablates the surface-flattened sample, the plasma formed is the largest (Fig. 7b) and the spectrum is the strongest. Combining the spectral data at the early stage of ablation (1st to 150th laser beams) and the plasma demonstrated in Fig. 7c, we speculate that the ‘self-hole’ formed on the sample surface is in a shallow state, and the spatial confinement effect cannot be formed in this morphology, but instead, the plasma becomes smaller due to the focusing optical path being out of focus. When the ablation crater gradually deepens, its ‘self-hole’ is in the intermediate layer state (150th to 300th laser beams), and in this morphology the hole wall to confine the plasma gradually forms, and the plasma becomes larger (Fig. 7d and e), thus enhancing the spectral intensity. As the hole depth increases, the laser focusing and collection paths become more defocused, resulting in the formation of progressively smaller plasma (Fig. 7f) with the peak spectral intensity diminishing to unobservable.
We use all the spectral data in Fig. 7a as an index to construct a model of overlapping ablation in the motion acquisition mode. For example, when the laser ablates a fresh area on the sample surface, the y-value of x = 1 in Fig. 7a is taken as the spectral intensity; when the laser ablates the same area 2 times, the y-value of x = 2 in Fig. 7a is taken as the spectral intensity. By analogy, the peak spectral value of the laser repeatedly ablating the same area can be obtained.
1. Integration time (dt): the integration time dt during which the spectrometer can effectively collect plasma radiation;
2. Motion speed (v): the velocity of motion of the sample relative to the laser;
3. Ablation crater radius (r): we assume that each laser pulse ablates the sample to produce a uniform ablation crater shape, a circle with radius r;
4. Laser repetition frequency (f): the repetition frequency of the laser.
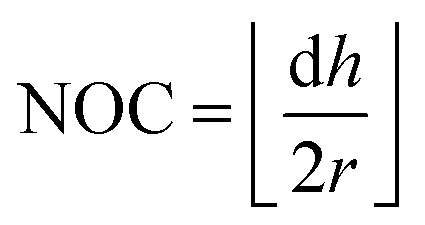
In addition to the experimental parameters described above, we defined a parameter to describe the overlap rate of ablation craters – the number of overlaps in a single crater (NOC) and the ablation crater spacing (dh). As shown in Fig. 8, we approximate the ablation craters as circles; if the ablation craters do not overlap with each other (Fig. 8a), NOC = 1; when the laser repetition frequency is increased or the speed is decreased, the craters begin to overlap each other (Fig. 8b), and NOC = 2; if we continue to increase the laser repetition frequency or the speed is decreased, the ablation craters overlap intensively (Fig. 8c); at this time, NOC = 5.
 | ||
| Fig. 8 Schematic of the number of overlaps in a single crater (NOC) and the ablation crater spacing (dh). (a) Ablation craters are independent, NOC = 1; (b) two ablations are present in a single ablation crater, NOC=2; (c) five ablations are present in a single ablation crater, NOC = 5. | ||
We can use the experimental parameters to construct a mathematical formula describing the NOC, as follows:
 | (1) |
 | (2) |
In order to show more intuitively the effect of overlapping ablation craters on the spectral intensity, this study constructs an ablation model based on the NOC parameter, and we show the model details for NOC = 4 in Fig. 9. With the relative motion of the laser and the sample, in the ablation direction, the laser will continuously ablate fresh craters on the sample surface, as indicated by the red circle in Fig. 9.
 | ||
| Fig. 9 Schematic of the ablation model. The red circle represents the ablation crater formed by the last laser beam, and the four coloured areas represent the four overlapping ablation states. | ||
However, only a portion of the red circle is fresh (S1), and the rest will overlap with the already ablated regions (S2, S3, and S4), so we split the ablation crater formed by a single beam pulse into four regions. We construct eqn (3) for the intensity of the plasma spectral radiation produced by this single laser pulse:
 | (3) |
In order to further calculate the spectral peak intensity (INOC=4) of a single plasma, we derive eqn (3) with the help of the equal circular overlapping area formula, which is as follows:
 | (4) |
Since the distance between each ablation crater is dh at a stable laser repetition frequency, the area equations for S1−4 in Fig. 9 can be derived:
| S1 = Sc − S_ovlp(dh) | (5) |
| S2 = S_ovlp(dh) − S_ovlp(2·dh) | (6) |
| S4 = S_ovlp(3·dh) | (7) |
To facilitate subsequent calculations, we define
| Sc = S_ovlp(0) | (8) |
We substitute the expression for S1−4 into eqn (3) and collate to obtain
 | (9) |
Based on the above derivation process, we can extend the special case of NOC = 4 to any NOC, and the generalised formula is
 | (10) |
When the motion ablation is stabilised, the ablation craters produced by each laser beam are similar, which means that the intensity of the plasma radiation formed by each laser beam under the conditions of stable experimental parameters is approximately equal, and the spectral peak intensities collected by the spectrometer are also approximately equal. Therefore, the expression of the spectral peak intensities of all plasmas collected by the spectrometer during the integration time dt is as follows:
 | (11) |
The generalised eqn (10) is substituted into eqn (11), thus enabling the calculation of the intensity of the collected spectral peaks under any experimental parameters:
 | (12) |
According to eqn (11) and the index value shown in Fig. 7a, we calculated the spectral peaks of Mn I, Mn II, Mg I and Mg II when the laser repetition rate increases from 0.5 kHz to 2.5 kHz at a moving speed of 0.5 mm s−1. A comparison between the four predicted values and the four measured values in Fig. 5a is shown in Fig. 10.
 | ||
| Fig. 10 The comparison between the predicted value and the measured value of spectral peak intensity. The motion speed is 0.5 mm s−1, the integration time is 10 ms, and the laser repetition rate increases from 0.5 kHz to 2.5 kHz with an accuracy of 0.5 kHz: (a) Mn I 257.55 nm; (b) Mn II 260.56 nm; (c) Mg I 285.21 nm; (d) Mg II 280.27 nm. | ||
The experimental results show that when the laser repetition frequency is 0.5 kHz, the spectral peak intensity derived from eqn (12) is approximately the same as the measured value, and when the laser repetition frequency is greater than 0.5 kHz, the error between the predicted value and the measured value increases gradually and tends to disperse.
In fact, in the LIBS system without beam shaping, the focused spot of the laser exhibits Gaussian characteristics, with higher energy density at the centre of the spot and lower energy density at the edges of the spot.24,25 Therefore, we have optimised the physical model presented in Fig. 9 by combining the Gaussian characteristics of the laser, and the optimised schematic is shown in Fig. 11.
 | ||
| Fig. 11 Schematic of the optimised ablation model. | ||
Considering the generality of the ablation model, we constructed a simple Gaussian curve function based on the radius of the ablation crater, which is used to assist the calculation of the new model. In this model, the ablation crater radius is 35 μm, and thus we take μ = 0, σ = 11 so that the Gaussian curve matches the ablation crater radius. The curve of the Gaussian function is shown in Fig. 12 and the mathematical expression is as follows:
 | (13) |
 | ||
| Fig. 12 Curves of the custom Gaussian function. | ||
Instead of calculating the area of the overlap region, the model represents the proportion of laser energy by the integral value of the Gaussian curve over the overlap region. Therefore, based on the above derivation process, we have adapted the generalised formula (eqn (10).) for calculating the intensity of individual plasma spectra as follows:
 | (14) |
We substituted eqn (14) into eqn (12) (the expression for the spectral peak intensity of all plasma collected by the spectrometer during the integration time dt) to obtain the calculation formula:
 | (15) |
We have recalculated the predicted values of the spectral peak intensities of Mn I 257.55 nm, Mn II 260.56 nm, Mg I 285.21 nm and Mg II 280.27 nm according to eqn (15) in combination with the index values demonstrated in Fig. 7a at a motion speed of 0.5 mm s−1 and the laser repetition frequency from 0.5 to 2.5 kHz, and the results of the recalculated curves compared with the 4 curves of the species in Fig. 10 are shown in Fig. 13. The experimental results show that the peak spectral intensity predicted by the Gaussian spot overlap ablation model is closer to the measured value than that of the initial model and does not show a tendency to diverge within the selected experimental parameter variation range.
 | ||
| Fig. 13 Comparison of the predicted and measured spectral peak intensities of the initial model and optimized model. Prediction value 1 is the initial model; prediction value 2 is the optimized model. The motion speed is 0.5 mm s−1, the integration time is 10 ms, and the laser repetition rate increases from 0.5 kHz to 2.5 kHz with an accuracy of 0.5 kHz: (a) Mn I 257.55 nm; (b) Mn II 260.56 nm; (c) Mg I 285.21 nm; (d) Mg II 280.27 nm. | ||
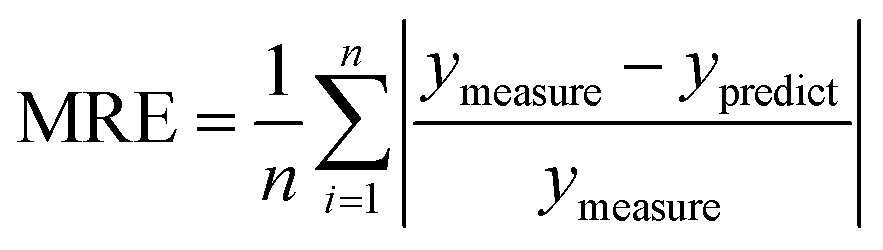
In order to further validate the predictive ability of the models for the peak spectral intensity, we controlled the laser repetition frequency to increase from 0.2 kHz to 2.4 kHz with an accuracy of 0.2 kHz at the same motion speed (0.5 mm s−1) and collected the spectral data of the samples under each experimental parameter (the measured value). At the same time, two models were used to predict the spectral peak intensity under each experimental parameter, and the mean absolute error (MAE) and mean relative error (MRE) were used to evaluate the predictive ability of the model.26,27 The experimental results are shown in Fig. 14 and Table 2. The formulae for MAE and MRE are as follows:
 | (16) |
 | (17) |
 | ||
| Fig. 14 Comparison of the predicted and measured spectral peak intensities of the initial model and optimized model. Prediction value 1 is the initial model; prediction value 2 is the optimized model. The motion speed is 0.5 mm s−1, the integration time is 10 ms, and the laser repetition rate increases from 0.2 kHz to 2.4 kHz with an accuracy of 0.2 kHz: (a) Mn I 257.55 nm; (b) Mn II 260.56 nm; (c) Mg I 285.21 nm; (d) Mg II 280.27 nm. | ||
| Spectral peak | Predicted value 1 | Predicted value 2 | ||
|---|---|---|---|---|
| MAE | MRE | MAE | MRE | |
| Mn I 257.55 nm | 1701.22 | 0.3048 | 808.82 | 0.1528 |
| Mn II 260.56 nm | 754.25 | 0.4289 | 137.98 | 0.1147 |
| Mg I 285.21 nm | 814.48 | 0.3740 | 292.89 | 0.1486 |
| Mg II 280.27 nm | 1993.77 | 0.3799 | 530.99 | 0.1261 |
According to the experimental results presented in Fig. 14 and Table 2, the average MRE of the initial model is 0.3719 and the average MRE of the optimised model is 0.1335. Although the Gaussian spot overlap ablation model is not able to predict the spectral peak intensities under each experimental parameter completely accurately, the model is significantly better at predicting the spectral peak intensities compared to the initial constructed model.
3.3 Quantitative analysis
In order to verify the applicability of the model for quantitative analysis, we collected spectral data of 5 aluminium alloy standard samples under two different experimental parameters and predicted the spectral peak intensities of the 5 samples under the two experimental parameters according to the model. Experimental parameter 1: motion speed is 0.5 mm s−1 and laser repetition frequency is 1 kHz; experimental parameter 2: motion speed is 1 mm s−1 and laser repetition frequency is 1 kHz.Without any data preprocessing, we constructed standard curves of peak spectral intensities and concentrations of the measured and predicted values for each of the 4 selected element spectral lines.28,29 We also calculated the MAE, MRE, and R-squared (R2) of the fitted curves for the predicted and measured values. The experimental results are shown in Fig. 15 and 16, and Tables 3 and 4.
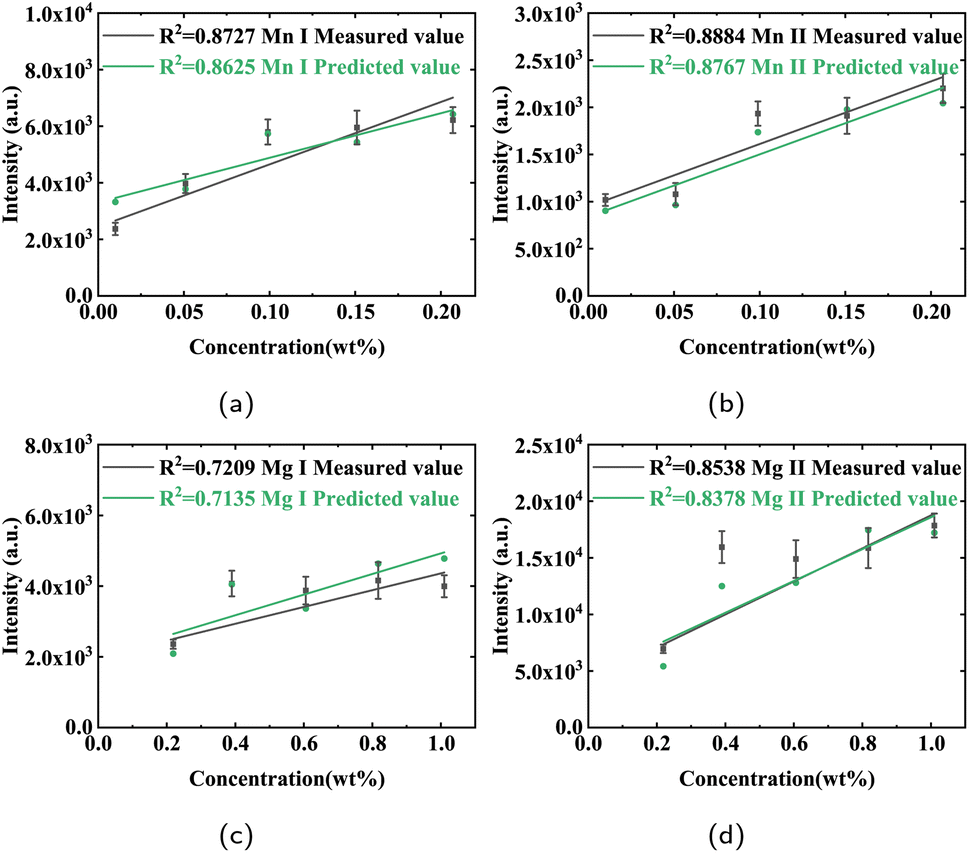 | ||
| Fig. 15 Calibration curves of the four spectral peaks, with measured values in black and predicted values in green. Experimental parameters: motion speed: 0.5 mm s−1 and laser repetition frequency: 1 kHz. (a) Mn I 257.55 nm; (b) Mn II 260.56 nm; (c) Mg I 285.21 nm; (d) Mg II 280.27 nm. | ||
 | ||
| Fig. 16 Calibration curves of the four spectral peaks, with measured values in black and predicted values in green. Experimental parameters: motion speed: 1 mm s−1 and laser repetition frequency: 1 kHz. (a) Mn I 257.55 nm; (b) Mn II 260.56 nm; (c) Mg I 285.21 nm; (d) Mg II 280.27 nm. | ||
| Spectral peak | Measured value R2 | Predicted value | ||
|---|---|---|---|---|
| R 2 | MAE | MRE | ||
| Mn I 257.55 nm | 0.8727 | 0.8625 | 385.59 | 0.1161 |
| Mn II 260.56 nm | 0.8884 | 0.8767 | 130.86 | 0.0860 |
| Mg I 285.21 nm | 0.7209 | 0.7135 | 410.82 | 0.1119 |
| Mg II 280.27 nm | 0.8538 | 0.8378 | 1864.88 | 0.1431 |
| Spectral peak | Measured value R2 | Predicted value | ||
|---|---|---|---|---|
| R 2 | MAE | MRE | ||
| Mn I 257.55 nm | 0.8719 | 0.9313 | 630.75 | 0.0771 |
| Mn II 260.56 nm | 0.9606 | 0.9723 | 113.64 | 0.0565 |
| Mg I 285.21 nm | 0.7445 | 0.7443 | 295.99 | 0.0551 |
| Mg II 280.27 nm | 0.8099 | 0.9156 | 1845.43 | 0.0959 |
In terms of predicting the spectral peak intensities, the model was relatively accurate in predicting the spectral peak intensities of the 5 samples when the experimental parameters were changed. In addition, when the motion speed increased, the MRE of the 4 selected spectral lines significantly decreased. We speculate that when the motion speed increases, the number of overlapping ablations in the same region will be reduced and the ablation grooves on the sample surface will become shallower, according to the ablation groove images shown in Fig. 5c and d and the NOC mentioned in the model. As a result, the focusing and collecting optical paths of the LIBS system are less defocused and the laser ablation is more stable, which finally leads to a smaller error between the predicted value and the measured value, and the phenomenon also illustrates the theoretical practicability of the constructed model.
In terms of the quantitative results of the 5 samples, the standard curves obtained by linear fitting of the measured and predicted values were not satisfactory. From the results presented in Fig. 15 and 16, the spectral line Mg I 285.21 nm is poorly fitted, and we speculate that the reason for the poor fit in the manuscript is the low sensitivity of this line.30,31 In addition, another more significant problem is the large deviation of all fitted standard curves from the coordinate origin. We speculate that the main reason for this problem is the high background noise.
Conventional LIBS systems can usually optimise the spectrometer delay time to remove bremsstrahlung and background noise.32,33 However, in the high PRF LIBS system, hundreds of plasma emissions are all collected during a single acquisition time (10 ms) of the spectrometer, which results in unavoidable bremsstrahlung as well as background noise in the spectra and is also responsible for the existence of a large number of ionic spectral lines in the spectra. As shown in the spectra illustrated in Fig. 2, the intensity of the background noise is about 1000 a.u.
From the experimental results, we found that the high PRF LIBS system can quantify elements with strong spectral peak intensities or high concentrations, but its high background noise makes it difficult to accurately analyse elements with weak spectral peak intensities or low concentrations. This is also a temporary and unavoidable problem brought about by high PRF LIBS while significantly improving the acquisition efficiency. In the subsequent work, we will develop a background noise deduction algorithm suitable for high PRF LIBS and increase the number of samples with concentration gradients to improve the quantitative analysis method.
4 Conclusions
In summary, we constructed a model that can predict the peak intensity of spectra under different experimental parameters for the motion acquisition mode of high PRF LIBS. The model is based on the theory of overlapping ablation of Gaussian spots, and the spectral data obtained from each ablation at the same position are used as index values. The calculation process includes experimental parameters such as motion speed, laser repetition frequency, spectrometer integration time, and ablation crater diameter. We compared the spectral peak change curves of the measured and predicted values of the 4 spectral lines (Mn I 257.55 nm, Mn II 260.56 nm, Mg I 285.21 nm, and Mg II 280.27 nm) and calculated the MAE and MRE, and the results showed that the model can effectively predict the spectral peak intensity under different experimental parameters.At the same time, we used 5 standard aluminum alloys as samples and established the standard curves of the measured and predicted values of the 4 spectral lines without any spectral preprocessing. The experimental results show that when the experimental samples are changed, the model is still able to predict the spectral peak intensities under different experimental parameters. However, the quantitative analyses of the standard curves were not satisfactory, in terms of both measured and predicted values. We speculate that the main reason is the unavoidable background noise in high PRF LIBS, which leads to a high deviation of the standard curve from the origin of the coordinates. However, the average R2 of the constructed standard curve is greater than 0.85, which is capable of guiding the efficient, rapid, and accurate analysis of aluminium alloys to a certain extent.
Data availability
Data underlying the results presented in this paper are not publicly available at this time but may be obtained from the authors upon reasonable request.Conflicts of interest
There are no conflicts to declare.Acknowledgements
The authors are grateful to the National Key Research & Development Program of China [Grant No. 2023YFF0714103].Notes and references
- Y. Xiang, L. Yang, X. Li, W. Sun, C. Pan, J. Dong, M. Xu, J. Chen and R. Lu, J. Anal. At. Spectrom., 2024, 39(6), 1470–1481 RSC.
- X. Jin, G. Yang, X. Sun, D. Qu, S. Li, G. Chen, C. Li, D. Tian and L. Yao, J. Anal. At. Spectrom., 2022, 38(1), 243–252 RSC.
- A. M. Popov, T. F. Akhmetzhanov, S. M. Zaytsev, A. N. Drozdova, I. A. Kalko and T. A. Labutin, J. Anal. At. Spectrom., 2022, 37(10), 2144–2154 RSC.
- T. Matsuda and K. Wagatsuma, ISIJ Int., 2019, 59(10), 1838–1845 CrossRef CAS.
- S. K. Hussain Shah, J. Iqbal, P. Ahmad, M. U. Khandaker, S. Haq and M. Naeem, Radiat. Phys. Chem., 2020, 170, 108666 CrossRef CAS.
- G. Cristoforetti, S. Legnaioli, V. Palleschi, A. Salvetti, E. Tognoni, P. Alberto Benedetti, F. Brioschi and F. Ferrario, J. Anal. At. Spectrom., 2006, 21(7), 697–702 RSC.
- G. S. Senesi, R. S. Harmon and R. R. Hark, Spectrochim. Acta Part B, 2021, 175, 106013 CrossRef CAS.
- A. Erler, D. Riebe, T. Beitz, H. G. Löhmannsröben and R. Gebbers, Sensors, 2020, 20(2), 418 CrossRef CAS.
- G. S. Senesi, D. Manzini and O. De Pascale, Appl. Geochem., 2018, 96, 87–91 CrossRef CAS.
- Z. Xu, B. Xu, X. Peng, Y. Qin, X. Yan, X. Liao, N. Zhang, Q. Lai, J. Li and Q. Zhang, J. Anal. At. Spectrom., 2021, 36(11), 2501–2508 RSC.
- D. Qu, G. Yang, X. Jin, G. Chen, Z. Bai, C. Li and D. Tian, Spectrochim. Acta Part B, 2023, 209, 106794 CrossRef CAS.
- Y. Fei, J. Feng, J. Zhu, G. Xing and Y. Liu, At. Spectrosc., 2023, 44, 178–190 CrossRef CAS.
- E. Wan, Q. Zhang, L. Li, Q. Xie, X. Li and Y. Liu, Opt Laser. Eng., 2024, 174, 107974 CrossRef.
- M. Gäckle and D. Merten, Spectrochim. Acta Part B, 2005, 60, 1517–1530 CrossRef.
- S. M. Eggins, L. P. J. Kinsley and J. M. G. Shelley, Appl. Surf. Sci., 1998, 127, 278–286 CrossRef.
- H. Nováková, M. Holá, M. Vojtíšek-Lom, J. Ondráček and V. Kanický, Spectrochim. Acta Part B, 2016, 125, 52–60 CrossRef.
- M. Holá, Z. Salajková, F. Gregar, J. Ondráček, D. Pavliňák, P. Šperka, A. Hrdlička, J. Kaiser and V. Kanický, Spectrochim. Acta Part B, 2024, 219, 106999 CrossRef.
- Z. Abdel-Salam, M. Abdelhamid, S. M. Khalil and M. A. Harith, AIP Conf. Proc., 2009, 1172(1), 49–52 CrossRef CAS.
- D. Diaz and D. W. Hahn, Spectrochim. Acta Part B, 2020, 166, 105795 CrossRef CAS.
- Y. Xu, Z. Hu, F. Chen, D. Zhang, J. Nie, W. Kou, W. Wang, F. Li and L. Guo, J. Anal. At. Spectrom., 2022, 37(2), 351–357 RSC.
- Y. Ikeda and J. K. Soriano, Talanta, 2023, 7, 100172 CrossRef.
- J. Liu, Z. Hou and Z. Wang, J. Anal. At. Spectrom., 2023, 38, 2571–2580 RSC.
- J. Lin, Z. Hao, J. Yang, C. Che and X. Lin, Anal. Methods, 2023, 15, 6656–6665 RSC.
- V. N. Lednev, S. M. Pershin, A. F. Bunkin, A. A. Samokhvalov, V. P. Veiko, S. I. Kudryashov and A. A. Ionin, Spectrochim. Acta Part B, 2016, 124, 47–55 CrossRef CAS.
- J. W. Jia, H. B. Fu, Z. Y. Hou, H. D. Wang, Z. B. Ni, Z. Wang, F. Z. Dong and Z. R. Zhang, J. Phys. D Appl. Phys., 2019, 52(40), 405102 CrossRef CAS.
- H. Sun, C. Song, X. Lin and X. Gao, Spectrochim. Acta Part B, 2022, 194, 106456 CrossRef CAS.
- S. Zhao, W. Song, Y. Zhao, Z. Hou and Z. Wang, Microchem. J., 2022, 183, 107986 CrossRef CAS.
- C. Pan, X. Du, N. An, Q. Zeng, S. Wang and Q. Wang, Appl. Spectrosc., 2016, 70(4), 702–708 CrossRef CAS PubMed.
- J. Li, X. Liu, X. Li, Q. Ma, N. Zhao, Q. Zhang, L. Guo and Y. Lu, Opt Laser. Eng., 2020, 124, 105834 CrossRef.
- M. Helmi, M. S. Aziz and J. Ali, in AIP Conference Proceedings, American Institute of Physics Inc., 2017, vol. 1824 Search PubMed.
- Z. Hou, M. S. Afgan, S. Sheta, J. Liu and Z. Wang, J. Anal. At. Spectrom., 2020, 35, 1671–1677 RSC.
- Y. Nosrati, S. H. Tavassoli, M. M. Hassanimatin and A. Safi, Phys. Plasmas, 2020, 27(2), 023301 CrossRef CAS.
- Z. Lin, J. Wu, F. Sun and S. Gong, Appl. Opt., 2010, 49(13), 80–86 CrossRef.
| This journal is © The Royal Society of Chemistry 2025 |