
 Open Access Article
 This Open Access Article is licensed under a Creative Commons Attribution-Non Commercial 3.0 Unported Licence
Closed-loop chemical recycling of polyethylene furan-2,5-dicarboxylate (PEF) under microwave-assisted heating†
Sean
Najmi
 a,
Dylan
Huang
ab,
Andrew
Duncan
c,
Daniel
Slanac
c,
Keith
Hutchenson
c,
James
Hughes
c,
Raja
Poladi
c and
Dionisios G.
Vlachos
*ab
a,
Dylan
Huang
ab,
Andrew
Duncan
c,
Daniel
Slanac
c,
Keith
Hutchenson
c,
James
Hughes
c,
Raja
Poladi
c and
Dionisios G.
Vlachos
*ab
aCenter for Plastics Innovation, 221 Academy St., Newark, DE 19716, USA
bDepartment of Chemical and Biomolecular Engineering, University of Delaware, Newark, DE 19716, USA. E-mail: vlachos@udel.edu
cCovation Biomaterials LLC, Newark, DE 19713, USA
First published on 15th April 2025
Abstract
Polyethylene furan-2,5-dicarboxylate (PEF) is a high-performance, bio-based analog to traditional petroleum-derived polyethylene terephthalate (PET). While the chemical recycling of PET has been well studied, PEF recycling studies are limited. This work investigated PEF depolymerization via heterogeneously catalyzed glycolysis using microwave-assisted heating. Various PEF polymers were characterized to understand how the molecular weight, crystallinity, and polymerization catalysts affect the depolymerization. The effects of the reaction temperature and PEF particle size were also studied. The glycolysis of PEF occurred at lower temperatures with faster overall kinetics compared with PET. Recovery of the PEF monomer, bis(2-hydroxyethyl) furan-2,5-dicarboxylate (BHEF), via crystallization was the slowest step in the overall recycling process. The recovered BHEF was repolymerized into virgin-like higher-performance PEF compared with the original material, demonstrating polymer circularity and a potential for upcycling.
Green foundation1. Our work advances the field of green chemistry by focusing on bio-based plastics as a sustainable alternative to fossil fuel-derived plastics such as PET. We have developed a method for the closed-loop recycling of a bio-based polyester, PEF, utilizing microwave-assisted heating, which can be powered by renewable energy. Our study highlights the recovery of monomers and provides a detailed approach to achieving effective chemical recycling.2. We achieved a recycling rate of 880 g PEF per g catalyst per h at 175 °C, demonstrating the efficiency of our process. Notably, we are the first to show that ZnO is an effective catalyst for the glycolysis of PEF. Our approach also provides a comprehensive recycling process, including the recovery of monomers, which are then recycled back into PEF, closing the loop on the material's lifecycle. 3. While we have demonstrated full circularity, further research into optimizing monomer recovery could substantially reduce energy costs and enhance overall recycling efficiency. |
Introduction
The production of plastic has grown exponentially since 1950, with projections estimating the presence of 12 billion tons of plastics waste in landfills or the environment by 2050.1 Less than 9% of plastics are recycled, mainly using mechanical recycling owing to its process simplicity and low cost. Mechanical recycling entails sorting, shredding, and melting plastic into new products. However, plastics are typically degraded via discoloration and a decrease in molecular weight,2 and as a result, they are often recycled only once. Chemical recycling, in contrast, can break down plastics waste into monomers that can be re-polymerized into a virgin-quality product.3 Considering its potential to handle mixed plastics and multilayer films, chemical recycling has emerged as the most versatile approach to cope with feedstock complexity. Polyethylene terephthalate (PET), a versatile plastic used in consumer single-use beverage bottles and textile fibers, represents an excellent example material for chemical recycling owing to its easy-to-cleave ester bonds.4 It is nearly the only polymer that can be recycled back into its monomer form with a high yield to enable a circular economy.Sustainability demands more than just a circular economy. Because of the lack of perfect carbon atom efficiency in depolymerization and polymer recycling, some of the original carbon of plastic waste is lost in each cycle as a byproduct into waste streams. Thus, new carbon is needed. The use of renewable carbon to make plastics would fulfil this need while minimizing or eliminating the need for fossil fuel-derived carbon products. In this strategy, carbon dioxide is captured from the atmosphere via photosynthesis and is converted into biomass. The biomass can then be converted into renewable monomers and polymerized into bioplastics (renewable plastics). While bioplastics are an enticing proposition, their end-of -life management (recycling) is important. Finally, chemical recycling and bioplastic product manufacturing must be performed sustainably to avoid converting the carbon in plastics into atmospheric carbon dioxide using excessive energy for reactions and subsequent separation. This, in turn, requires decarbonization of chemical processing via electrification. Meeting all these requirements is crucial for ensuring sustainable practices. The enhanced recycling (>80%) of bioplastics constitutes the most sustainable plastic management strategy.5,6
Despite efforts to produce bioplastics, very little is known about their recyclability. Recycling bioplastics could lead to carbon-negative systems if the recycling is performed sustainably. Among bioplastics, renewable polyesters have attracted significant interest for their inherent recyclability and large market share.7 One example is polyethylene furan-2,5-dicarboxylate (PEF), which can be synthesized from 2,5-furan dicarboxylic acid (FDCA), produced via oxidizing 5-hydroxymethylfurfural (HMF),8 a compound that can be easily synthesized from fructose or glucose.9,10 A detailed review on the synthesis and properties of PEF can be found elsewhere.11 PEF has the potential to reduce greenhouse gas (GHG) emissions unlike PET12 while possessing improved gas-barrier properties toward oxygen and carbon dioxide,13,14 which can improve the shelf-life of products and reduce the amount of plastic needed.15,16 A similar strategy for PEF production using biowaste and industrial CO2 excitingly demonstrated a reduction in energy consumption by 40% relative to PET production.17 There are diverse approaches available for chemically recycling PEF, each with their own distinct chemistry. Agostinho et al. investigated the breakdown and repolymerization of PEF using an urea![[thin space (1/6-em)]](https://www.rsc.org/images/entities/char_2009.gif) :zinc acetate deep eutectic solvent.18 An approach involving the methanolysis of PEF using ionic liquids was also introduced.19 Recently, PET hydrolases were reported to convert PEF into FDCA at mild temperatures (65 °C), but the reaction time (72 h) was long.20 Long reaction times, harsh toxic conditions, and the challenges in catalyst/product separation motivated us to study PEF depolymerization using inexpensive, earth-abundant, nontoxic, heterogeneous catalysts.
:zinc acetate deep eutectic solvent.18 An approach involving the methanolysis of PEF using ionic liquids was also introduced.19 Recently, PET hydrolases were reported to convert PEF into FDCA at mild temperatures (65 °C), but the reaction time (72 h) was long.20 Long reaction times, harsh toxic conditions, and the challenges in catalyst/product separation motivated us to study PEF depolymerization using inexpensive, earth-abundant, nontoxic, heterogeneous catalysts.
This work reports the catalytic glycolysis (Scheme 1) of various PEF polymers using a heterogeneous catalyst (zinc oxide) in ethylene glycol solvent. Owing to the excellent microwave-absorbing properties of ethylene glycol21 and the economic scale-up potential of this system,22 we leveraged microwave-assisted heating as the primary energy source. Microwave-assisted heating has emerged as a crucial energy platform for meeting the 2050 decarbonization goals because of its use of green electricity23 and energy efficiency compared with traditional heating.24 Recent work by Enthaler and coworkers showed the potential of microwave-assisted heating for PEF methanolysis.25 Under mild temperatures, high yields of dimethyl 2,5-furandicarboxylate (>90%) were achieved. However, this study was performed using zinc acetate, a homogeneous catalyst, which poses separation challenges. Besides methanolysis, glycolysis represents a strategic depolymerization route because the recovered monomer, bis(2-hydroxyethyl) furan-2,5-dicarboxylate (BHEF), can be repolymerized to PEF in a single polycondensation step. Herein, we characterized PEF samples to reveal their thermal properties and molecular makeup and studied the effects of temperature, time, and particle size on their apparent depolymerization kinetics. We subsequently studied the isolation of BHEF from an ethylene glycol solution via crystallization. Lastly, the recovered BHEF was repolymerized to PEF, and the PEF was characterized and compared with virgin PEF. We show that it is possible to recycle lower-quality PEF into a higher-quality polymer. This, in essence, constitutes an upcycling strategy. Nevertheless, unlike other upcycling strategies that deconstruct polymers to fuels, lubricants, and other compounds, the polymer (PEF) synthesized using our strategy was chemically identical to the original material but with different properties, such as the degree of polymerization and microstructure.
 | ||
| Scheme 1 Glycolysis of PEF to BHEF using ethylene glycol as a solvent. | ||
Materials and methods
Polymer synthesis
Five lots encompassing varied grades of PEF were obtained from CovationBio upon setting a material transfer agreement. Two comparative lots of PET pellets were purchased from Indorama (product numbers 3301 (lower grade) and 1101 (higher grade)). The following amounts of ingredients were charged into a 500 mL three-neck glass reactor fitted with a nitrogen inlet, a condenser, and a mechanical stirrer: 2,5-furan dicarboxylate dimethyl ester (FDME) (0.2 kg, 1.09 mol) and ethylene glycol (0.121 kg, 1.96 mol). The mole ratio of ethylene glycol to FDME was 1.8. The flask was then placed in a metal bath, which was preheated to a set temperature of 160 °C. The reaction mixture was stirred at 180 rpm to obtain a homogeneous solution under a nitrogen atmosphere. The amount of the catalyst required was calculated as a ppm ratio between the weight of the metal present in the catalyst alone and the total theoretical weight of the polymer obtained. Consequently, <250 ppm of the total catalyst (esterification and polycondensation catalysts) was added to the mixture at this set temperature. Typical transesterification catalysts may include titanium alkoxide, organotitanates, organozirconates, and catalysts based on Ti, Sb, Co, and Mn in small amounts.15The metal bath temperature was programmed to reach 230 °C in 90 min to initiate the transesterification reaction, with the first drop of the condensed distillate collected noted as the start of the reaction (time zero). The reaction was continued at 230 °C for 30 min, in which time, most of the distillate (∼87 mL) could be collected, and the distillate rate significantly slowed down, indicating the reaction was almost complete. A vacuum ramp was started while stopping the nitrogen purge. The pressure was gradually decreased from atmospheric to a final low pressure of ∼0.4 mm Hg absolute over 30 min while raising the temperature to 260 °C. The polycondensation reaction was continued for 3 h at 260 °C. The polymer, after melt polymerization, was recovered and analyzed. A fully amorphous polymer was made via melting under an inert atmosphere and rapid quenching in an ice bath to prevent crystallization. PEF particles of various sizes were made via cryo-milling and subsequent sieving to the desired particle size ranges. The identities of the catalysts used in the synthesis have been withheld from this report for proprietary reasons.
Materials and catalyst preparation
EG (anhydrous, 99.8%), DMSO-d6 (99.9%), 1,1,1,3,3,3-hexafluoroisopropanol (HFIP, for synthesis), ZnO (<50 nm particle size (BET), >97%) and methanol (high-performance liquid chromatography (HPLC) grade) were purchased from Sigma Aldrich. Manganese oxide catalysts were synthesized via the precipitation of manganese nitrate in sodium carbonate and then calcined at 450 °C and 500 °C (denoted as MnOx SC-450 and SC-500); the synthesis details can be found elsewhere.26 Manganese heteroatom BEA-type zeolites were synthesized using a procedure described elsewhere.27 Lastly, a zinc–manganese mixed metal oxide was made by colloidal synthesis.Polymer characterization
Differential scanning calorimetry (DSC) was conducted using TA-instruments Discovery 250 at a heating rate of 10 °C min−1 and cooling rate of 1 °C min−1 with typically about 5–10 mg of the sample. Percent crystallinity was calculated by dividing the measured melting enthalpy by the theoretical limit at 100% crystallinity (137 J g−1).28 Thermogravimetric analysis (TGA) was carried out using TA Instruments Discovery 5500 at a heating rate of 10 °C min−1 under 40 sccm air or nitrogen flow. Attenuated total reflectance Fourier-transform infrared spectroscopy (ATR-FTIR) of the polymers was conducted using a Nicolet Nexus 640 spectrometer with a Smart Orbit Diamond ATR accessory. The X-ray diffraction patterns of the polymers were collected on Bruker D8 with Cu Kα radiation (λ = 1.54056 Å) at 40 kV and 40 mA.For size exclusion chromatography (SEC), 0.6 mg mL−1 solutions were prepared by dissolving the material as received in HFIP with 10 mM tetraethylammonium nitrate (TEAN) and agitating overnight at room temperature. Sample solutions were filtered with 0.22 μm Pall PTFE pipette tip filters prior to injection (7 μL) into the system. SEC was performed using a Waters APC® system, with a flow of HFIP with 10 mM TEAN at 0.25 mL min−1 at 50 °C through a set of Waters APC® XT 2 × 150 mm 450 Å–45 Å or Waters APC® XT 150 mm 900 Å–75 mm 200 Å–150 mm 45 Å columns in series and a detector (Waters Acquity UV spectrometer) set at 251 nm. The relative molecular weight was determined using a three-point linear calibration with broad standards. Data reduction was done in Empower 3 with auto integration. Sample set validation was performed by calibrating the first injection and quantifying a duplicate injection as the final run.
Microwave-assisted depolymerization of PET and product quantification
Depolymerization reactions were conducted in a 10 mL glass vial using an Anton Parr Monowave 450 microwave reactor. The temperature, time, power level, and stir rate were set and controlled using the 450-user interface. The temperature was monitored using an IR sensor within the reactor cavity. The stir rate was set to 600 rpm and the maximum power level was held at 100 W for each run. The desired temperatures were reached within a couple of minutes. Reactor contents consisted of PEF pellets, EG, and the catalyst. For catalyst screening and standard depolymerization, 0.5 g of PEF, 5 mL of EG, and 5 mg of the catalyst were used. These conditions were optimized based on a previous work.29After the reaction, the vial was cooled to room temperature, and the contents were vacuum-filtered. Using 100 mL of deionized water (18.2 MΩ cm−1), BHEF was separated from any of the remaining solids. The oligomers were collected on filter papers and eventually dried overnight. A 1 mL aliquot from the 100 mL BHEF solution was removed and diluted to 10 mL. HPLC was then used to quantify the BHEF concentrations using an Agilent 1260 Infinity system coupled with a UV detector and a Zorbax Eclipse Plus C8 column. The mobile phase contained equal volumes of methanol and ultrapure water at a flow rate of 0.6 mL min−1 with an injection volume of 10 μL. A BHEF calibration curve was constructed using the purified monomer. Conversions of the PEF and the yields of BHEF were calculated using the following equations:
 | (1) |
 | (2) |
 | (3) |
 | (4) |
The presence of BHEF in solution was confirmed through liquid chromatography-mass spectrometry (LCMS) and 1H/13C NMR spectroscopy. Thermo Fisher Scientific Q-extractive Orbitrap with an electrospray ionization-mass spectrometry (ESI-MS) setup was used for LCMS analysis with formic acid as the mobile phase. 1H and 13C NMR spectra were recorded with Bruker Neo operating at a 1H precession frequency of 400 MHz. The samples were diluted in DMSO-d6.
Monomer recovery and recycling
The monomer was recovered from the EG solutions via crystallization at −10 °C. ICP-MS and XRF were used to determine the amount of Zn metal present after the separation and washing of the recovered monomer. Briefly, measurements were carried out using an Agilent 7500cx series instrument. Samples were diluted in a solution of 80% nitric acid. Circular PEF, called hereafter rPEF, using BHEF produced by PEF chemical recycling, was synthesized using the same setup used for the virgin PEF synthesis. As BHEF is the transesterified product of FDME and EG, the polycondensation of BHEF was the only step. Herein, 30 g of BHEF charged to the same three-neck flask was brought under vacuum to 0.4 mmHg for 30 min while raising the temperature to 260 °C. Once the temperature was reached, the polycondensation was continued for 3 h before quenching and recovering the polymer. The method and catalysts used were consistent with CovationBio's original method to produce PEF Lot 1. The polymer was then recovered via cryogenic crystallization. For structural analysis of the polymers, 1H and 13C NMR spectra were recorded with a Bruker cryoprobe operating a 1H precession frequency of 600 MHz. The samples were diluted in an 80:20 solution of CD3Cl:TFA-d. The diethylene glycol (DEG) content was measured from the 1H NMR data using a method described elsewhere.30 The spectra were analyzed using TopSpin software from Bruker.
Results and discussion
Polymer characterization
The characterization data for the five PEF samples are presented in Fig. 1. The X-ray diffractograms of the different PEF lots (Fig. 1a) show the same peaks consistent with the α-crystal form of PEF obtained through cold crystallization.31 This ruled out any polymorphism in the samples. DSC thermograms indicated that the lots had varying thermal properties (Fig. 1b). The relatively lower glass transition temperature (Tg) for Lot 4 suggested that more diethylene glycol (DEG) units may exist in the polymer chains than in the other samples.32 Its melting point distribution was also the narrowest, while those of the other lots were much broader, with shoulders attributed to the melting of secondary and original crystals formed during isothermal crystallization.25 The PEF samples had higher Tg and lower Tm compared with PET. FTIR spectra show their similar molecular makeups (Fig. 1c). Furanic moiety contributions, such as the peak for ω(HC![[double bond, length as m-dash]](https://www.rsc.org/images/entities/char_e001.gif) CH) at 750 cm−1; ring breathing vibration at 1022 cm−1; and ring stretching bands at 1580, 1505, and 1390 cm−1 were present. The peak at 1340 cm−1 was correlated to the trans EG segments in the chain, ascribed to the crystalline regions of PEF.33 Lastly, a strong ν(CO) contribution at 1710 cm−1 due to the ester group was seen for all the samples.
CH) at 750 cm−1; ring breathing vibration at 1022 cm−1; and ring stretching bands at 1580, 1505, and 1390 cm−1 were present. The peak at 1340 cm−1 was correlated to the trans EG segments in the chain, ascribed to the crystalline regions of PEF.33 Lastly, a strong ν(CO) contribution at 1710 cm−1 due to the ester group was seen for all the samples.
 | ||
| Fig. 1 Polymer characterization. (a) XRD. (b) DSC. (c) ATR-FTIR. (d) SEC. (e) TGA under 40 sccm air at a ramp rate of 10 °C min−1; inset represents the degradation from 400 °C to 600 °C at low weight percent values. | ||
Fig. 1d displays the molecular weight distributions obtained via SEC. Generally, all the samples exhibited uniform peak distributions. TGA revealed a similar trend for all the samples, where their degradation began at 400 °C (Fig. 1e). This was consistent with PEF decomposition observed elsewhere.34 It was also found that the level of transesterification catalyst in the samples or impurities could result in subtle changes in the later degradation of the polymers (inset). This could explain why Lot 1, which had the lowest catalyst concentration, still had some mass left at 550 °C while the other samples did not. Lot 5 had the fastest degradation, while Lot 2 and Lot 3 followed similar overall patterns because the same catalyst in the same concentration was used in their synthesis. Table 1 summarizes the specific attributes of the polymer samples deduced from the DSC and SEC analyses. In the table, the column titled “Catalyst” indicates the polymerization catalyst used in the polymer synthesis, while the last column is the concentration.
| Lot # | T g (°C) | T m (°C) | Crystallinity % | M n (kg mol−1) | M w (kg mol−1) | Catalyst | Catalyst conc. (ppm) |
|---|---|---|---|---|---|---|---|
| 1 | 85 | 173 | 25 | 19.8 | 41.9 | A | 120 |
| 2 | 82 | 176 | 26 | 13.5 | 25.5 | B | 200 |
| 3 | 89 | 204 | 13 | 23.2 | 50.4 | B | 200 |
| 4 | 81 | 212 | 39 | 18.3 | 35.0 | C | 154 |
| 5 | 88 | 201 | 20 | 20.5 | 42.0 | D | 130 |
| PET 1 | 77 | 234 | 38 | 25.3 | 51.1 | E | — |
| PET 2 | 77 | 242 | 33 | 26.2 | 52.6 | F | — |
The impact of the molecular weight on polymer degradation was investigated. Lots 1, 2, 4, and 5 were chosen as their molecular weights ranged from 25.5 to 42.0 kg mol−1. Fig. 2a displays the TGA profiles of the four PEF samples at 300 °C, 325 °C, and 350 °C. The weight loss curve at each temperature showed a similar pattern. At 300 °C, the TGA profile was predominantly linear, with only a slight decrease in the sample mass. At 350 °C, the profiles exhibited sigmoidal-like shapes due to severe degradation. Lot 2 displayed an exponential degradation profile at 350 °C. The difference in degradation behaviors can be due to less water being initially present in the sample, fewer lower molecular weight fragments, or lower impurities.35 By fitting the linear regions across the same weight loss values for each sample, degradation rates (% s−1) were obtained.
 | ||
| Fig. 2 Polymer thermal stability. (a) Isothermal TGA profiles of various MW polymers under 40 sccm N2. (b) Eyring plots of the degradation of the polymers. (c) Standard enthalpy of degradation of the polymers as a function of MW. | ||
Eyring plots were performed to show the degradation rate at different temperatures (Fig. 2b). The data were fitted using the following equation,

Catalytic glycolysis
Fig. 3a displays depolymerization catalyst screening results for PEF (Lot 4) glycolysis using ZnO and Mn2O3, which were active catalysts for PET glycolysis,29,37 and Mn–BEA and Zn–Mn were mixed metal oxide catalysts. We assumed that the superior performance of ZnO over the other depolymerization catalysts, as shown in Fig. 3a, will translate to the other PEF lots. It is essential to note the role of polymerization catalysts on depolymerization, as discussed later. ZnO performed the best at 1 h of reaction. The morphology of ZnO was optimized in our previous work, where the particle size was shown to strongly control overall rates.29 The same catalyst was used in this study. The selectivity to the monomer was generally high unless noted otherwise. LCMS was used to verify the BHEF monomer (Fig. S1†). Trace amounts of dimers and trimers were also detected. Importantly, PEF recycling was feasible. Although the reaction was run at 175 °C, considerably below the melting temperature of Lot 4 (Table 1), depolymerization was relatively fast. The swelling of the plastic by EG and the volumetric heating of the pellets using microwaves enabled depolymerization below the melting temperature, similar to PET.37 | ||
| Fig. 3 Depolymerization of PEF. (a) Screening of heterogeneous catalysts using Lot 4. Conditions: 175 °C, 0.5 g of 2.36 mm pellets, 5 mL EG, and 5 mg catalyst. (b) Comparison of PEF and PET depolymerization. Conditions for each experiment: 175 °C, 30 min, 710–1000 μm particle size, 5 mg ZnO, and 5 mL EG. (c) PEF particle size effect on depolymerization. Conditions: 175 °C, 0.5 g PEF (Lot 4), 5 mL EG, 5 mg catalyst, and 60 min. (d) Catalyst (left) effects on depolymerization yields. Conditions: 175 °C, 0.5 g PEF (Lot 3), 710–1000 μm particle size, 5 mL EG, and 5 mg catalyst (indicated by ZnO at 15 min). Polymer crystallinity (right) effects on depolymerization yields. Conditions: 175 °C, 15 min, 0.5 g PEF (Lot 3), 710–1000 μm particle size, and 5 mL EG. | ||
Interestingly, the depolymerization of PEF and PET showed stark differences. Fig. 3b compares the monomer yield and polymer conversion of PEF and PET under the same conditions (175 °C but with a shorter reaction time of 30 min using smaller plastics pellets). PEF was converted much faster than PET under comparable conditions. The lower-grade MW PET sample (PET 1) only achieved a 16% conversion, while the higher-grade MW sample (PET 2) exhibited essentially no conversion. This exciting result demonstrated the upside potential of employing PEF over PET for the chemical recycling of consumer polyesters.
Fig. 3c displays the effect of the particle size of the starting polymer. The results indicated a strong mass-transfer effect in the depolymerization, with smaller particle sizes generating a higher monomer yield. The depolymerization mechanism followed a shrinking core-like mechanism, as reported in previous PET glycolysis studies.38 The apparent rate constant was inversely dependent on the radius (1/r), resulting in the smaller particles (180–300 μm) with a 2.4–5.5-times higher rate constant compared with the larger ones (710–1000 μm). The smaller particles’ higher surface area to volume ratio enhanced the diffusion of EG needed to break the bonds of the PEF network. While small particles depolymerized faster, they required more energy, and thus, energy and technoeconomic analyses will be needed to find the optimal size. Mechanical shredding followed by chemical recycling was demonstrated to produce high monomer yields for PET glycolysis.39
Next, the effect of the ZnO catalyst on depolymerization was investigated (Fig. 3d). The time-dependent depolymerization of PEF with and without the catalyst (ZnO) showed interesting behaviors (Fig. 3d, left). At 15 min without ZnO, the yields of monomers and solid oligomers were comparable. The conversion remained constant for up to 30 min, whereas the oligomers were converted to BHEF. This was due to the solvent swelling the solid particles, leading to rapid heating and homogeneous depolymerization, forming oligomers before they could further depolymerize into monomers.37 We believe that traces of the polymerization catalyst from the synthesis catalyst participated in this process. ZnO could catalyze C–O bond breaking of the oligomers and accelerate conversion with almost complete selectivity to BHEF, even at short times (15 min), by converting the oligomers to monomers and removing the system from this quasi-equilibrium.
Polymer crystallinity demonstrated a strong effect on product distribution (Fig. 3d, right). Rapid quenching of the PEF sample to 0 °C after melting in an inert atmosphere could ensure there was no crystallization, resulting in a fully amorphous sample. Under the glycolysis of amorphous PEF, no starting polymer was left, and mostly solid oligomers formed. This was in stark contrast to the semicrystalline PEF, where full conversion was not reached. The difference in conversion highlights how crystalline domains act as a barrier to diffusion,40 whereas amorphous domains enable EG diffusion.
The production of oligomers instead of monomers at short times without a depolymerization catalyst opens an exciting chemical recycling prospect, as the overall reaction time for depolymerization is shorter compared to producing monomers, and the separations are easier at room temperature (oligomers are solids at room temperature). The process may also not even need a depolymerization catalyst. Importantly, the oligomers can act as scaffolds for block copolymer synthesis.41 Furthermore, the solid oligomers recovered after the reaction exhibit an earlier onset of degradation than PEF and similar trends after 400 °C, as shown in the TGA (Fig. S2†). DSC also highlighted an interesting behavior (Fig. S3†), wherein under the first heating cycle, the oligomers melted around 135 °C, much lower than PEF (215 °C). The crystallization rate of PEF was much slower than PET, and the cooling rate was set to 1 °C min−1. Under cooling, the crystallization peak occurred at 175 °C, consistent with another work.42 GPC revealed a molecular weight value of 4300 Da, about 1/10th that of the original polymer. A similar finding for PET oligomer formation revealed the ratio of EG solvent:PET strongly controlled the yield of oligomers but did not affect the molecular weight.37 Under the same conditions, as time increased, the molecular weight remained the same and the yield of oligomers decreased. This was due to the successive depolymerization of the longer oligomers into monomers.
The remaining PEF samples after partial conversion revealed an interesting change. While the Tm and crystallinity % remained the same, the Tg post-reaction (Table S1†) was noticeably reduced consistent with a plasticization effect caused by EG seen in other polyesters.43 The Tg shift for the PET samples after the reaction was not as significant. The more dramatic Tg downshift in PEF vs. PET could be due to the enhanced sorption of EG within the PEF polymer matrix. PEF enhances the sorption of CO2 over PET owing to the greater interactions of CO2 with the polar carbonyls caused by the hindered ring flipping of the furanic moiety.14 Thus, it is plausible that EG sorption within PEF is more favored because of a similar effect, resulting in its faster dissolution to oligomers and depolymerization.
Next, kinetic investigations into the PEF glycolysis reaction were carried out for Lots 1–3 (Fig. 4). These specific samples were chosen to illustrate the effect of molecular weight (contrasting Lots 2 and 3) and the catalyst package (contrasting Lots 1 and 3). The red points (yield) closely trace but are below the black points (conversion), indicating a high monomer selectivity and the formation also of some oligomers. Fig. 4a depicts the depolymerization of Lot 2 at two temperatures and particle sizes. The time for depolymerization to be completed dropped from 60 to 8 min (∼8×) as the temperature increases from 160 °C to 175 °C for 180–300 μm particles and from 30 to 8 min (∼4×) at 175 °C with a lowering of the average particle sizes from 710–1000 to 180–300 μm. Clearly, both the temperature and particle size play a crucial role in the kinetics of glycolysis. The depolymerization times could be shortened at sufficiently higher temperatures with smaller particles due to the effective heating of EG by microwaves and the swelling of the particles, which promotes their rapid heating. Also, in practice, short processing times require less energy and would allow more plastic waste to be processed. These results also indicate there was a tradeoff in energy use between raising the temperature and applying milling (mechanical shredding) to generate smaller particles.
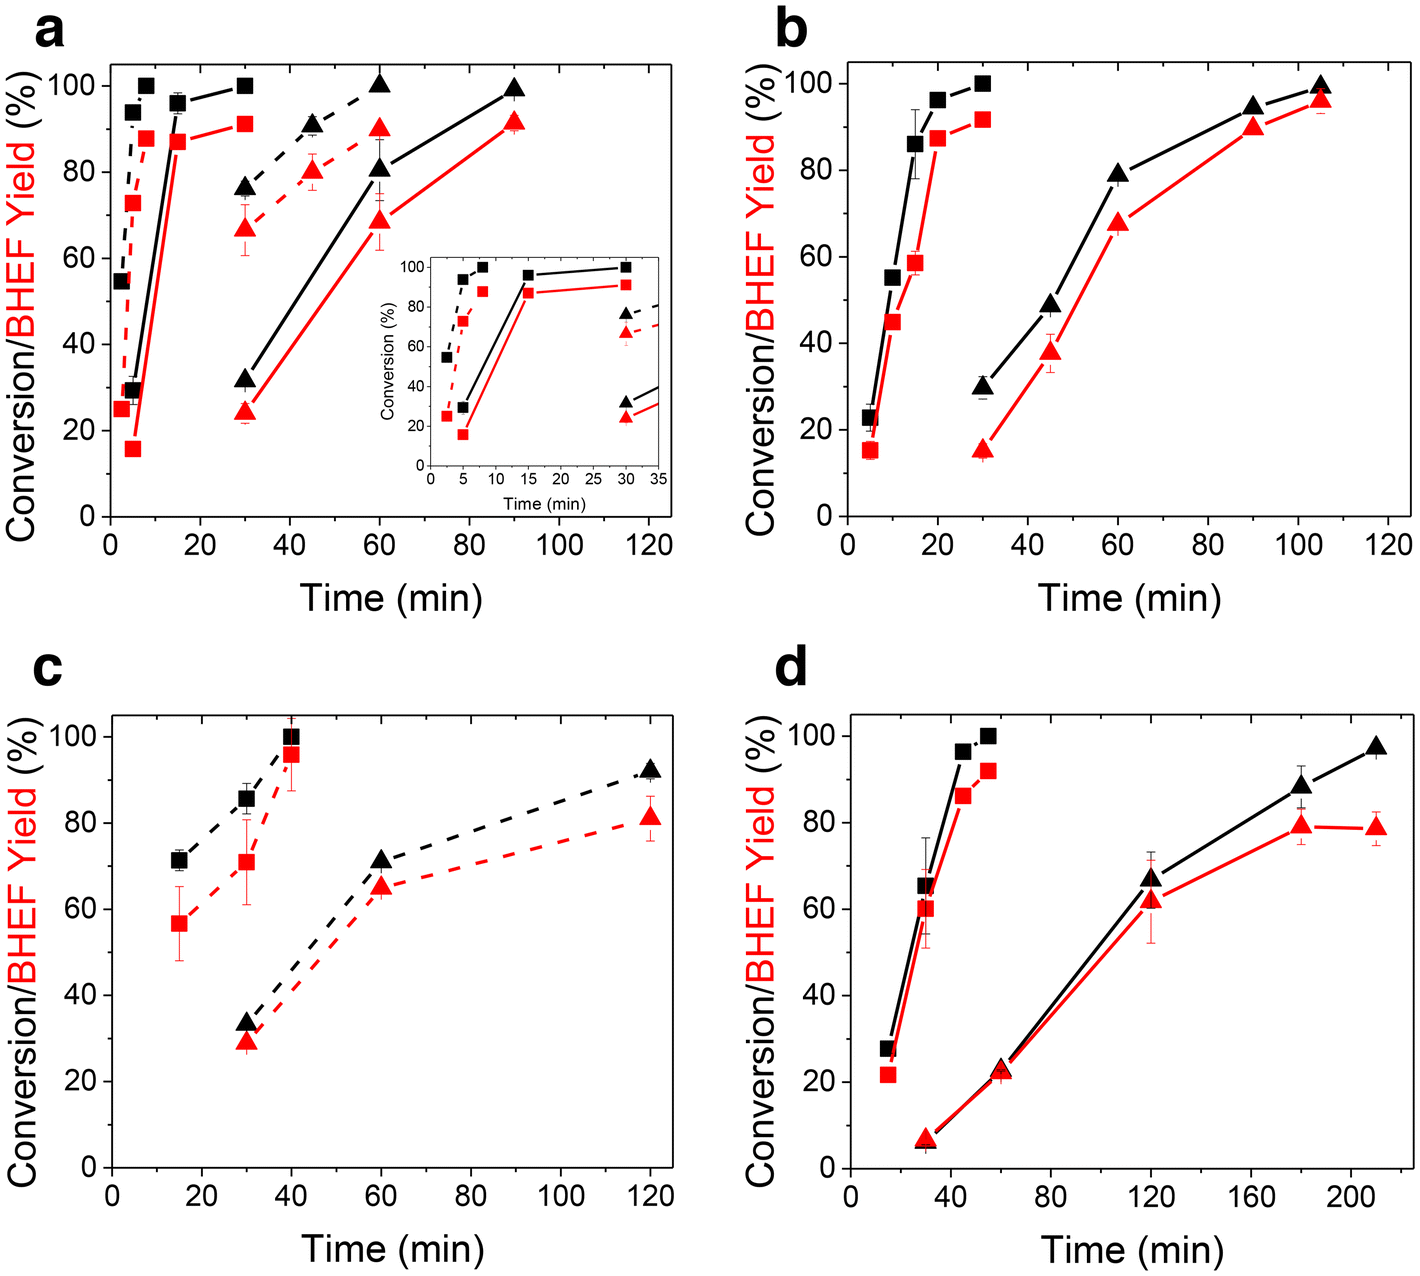 | ||
| Fig. 4 Kinetic depolymerization of PEF. (a) Lot 2 at 160 °C and 175 °C with 180–300 and 710–1000 μm sized particles; the inset is a zoomed-in image in the 0–35 min range. (b) Lot 3 at 160 °C and 175 °C with 710–1000 μm sized particles. (c) and (d) Lot 1 at 160 °C and 175 °C with 180–300 μm and 710–1000 μm sized particles, respectively. Conditions: 0.5 g PEF, 5 mL EG, and 5 mg ZnO. Squares represent 175 °C and triangles 160 °C. Solid lines are for 710–1000 μm particles and dashed lines for 180–300 μm particles. Error bars indicate the standard deviation from duplicate experiments wherever shown. | ||
Fig. 4b shows the depolymerization kinetics of Lot 3, which was a higher molecular weight polymer than Lot 2 (Fig. 4a) synthesized using the same transesterification catalyst and had sizes of 710–1000 μm. At 160 °C, full depolymerization was slightly longer (105 vs. 90 min), but at 175 °C, the depolymerization times for Lots 2 and 3 were comparable. Although higher MW PEF provides improved mechanical properties, it exhibits slower depolymerization kinetics, suggesting there is an optimum MW for achieving economically circular PEF.
Lastly, Fig. 4c and d depict the depolymerization of Lot 1 at two temperatures and sizes. Lot 1 had a similar molecular weight to Lot 3 but a lower catalyst concentration than Lots 2 and 3 (Table 1). At 160 °C, Lot 1 took more than twice as long as Lot 2 to achieve complete conversion (Fig. 4c), which was also slower than Lot 3. The slower rate was due to the lower catalyst concentration used in the PEF synthesis, although the higher crystallinity of Lot 1 may have also affected EG diffusion. As shown in Fig. 4d, the monomer yield started to plateau at 160 °C as the conversion increased. The HPLC trace showed increased amounts of the dimer, but the sample did not depolymerize further, indicating larger tetramers and trimers were still being broken down.
Taking all the data together, PEF depolymerization depends on the temperature, particle size, molecular weight, degree of crystallinity, and catalyst package. The production rate of BHEF varied tremendously, from 880 to 30 g BHEF per h per g catalyst over our conditions. While the monomer production rate is a key metric for assessing depolymerization, the aforementioned experimental factors (temperature, particle size) are crucial to evaluate the feasibility of the process (economic, life cycle, scale-up). The final amount of catalyst present in the polyester is also a key factor that should be considered. The catalyst used in the synthesis and the catalyst amount in the product are also key factors that should be considered. Thus, future work should include this information to properly assess which system and technology are the most attractive for chemical recycling.
Monomer recovery and recycling
The recycling of the BHEF monomer back into PEF is shown in Fig. 5. The concentration profile of the monomer in solution during the crystallization process is shown in Fig. 5a. The crystallization of BHEF was much slower than that of BHET in EG under the same conditions.29 This was consistent with the relatively slow crystallization kinetics of PEF vs. PET. Solids did not appear for the first 7 days, indicating that the primary nucleation to induce crystallization may have been hindered. Pi–pi stacking of the aromatic ring in the BHET monomer allows for rapid molecular alignment compared with the polar, asymmetric furan ring that cannot be oriented as easily. The equilibrium point for the monomer recovery approached ∼70%, suggesting a thermodynamic equilibrium has been reached. The crystallization kinetics followed the behavior of a modified Avrami equation44 of the form:| χc(t) = w1(1 − e−k1tn) + w2(1 − e−k2tn), |
 | ||
| Fig. 5 Recycling assessment. (a) Concentration of the monomer in solution during crystallization at −10 °C. (b) DSC scans of the new polymer and original polymer. (c) TGA thermogram of the new and original polymer under 40 sccm air/N2. (d) GPC data indicating molecular weight distribution. (e) Depolymerization kinetics of Lot 1 and rPEF. Conditions: 175 °C, 0.5 g PEF, 710–1000 μm particle size, 5 mL EG, and 5 mg ZnO. | ||
After isolating BHEF, we sought to recycle it back into PEF (referred to as rPEF) using the synthesis procedure with Lot 1. Some dimer was present in the isolated solids, as shown by the NMR (Fig. S4†). rPEF was recovered and analyzed to assess its inherent properties. The DSC scans of Lot 1 and (rPEF) are shown in Fig. 5b. The Tg of rPEF was 94 °C, which was higher than that for the Lot 1 sample (85 °C). Higher Tg values are desired as they show improved robustness and suppressed hydrolytic degradation.45 Using 1H NMR (Fig. S5†), we sought to measure the amount of DEG units present in both the virgin and recycled polymer, as lower Tg values have typically been tied to higher amounts of DEG units within polyesters.32 We observed a 1% reduction in the relative DEG content in the rPEF sample, which rationalized the increased Tg. Since rPEF was synthesized using a direct one-step polycondensation rather than a two-step transesterification followed by polycondensation, DEG formation was likely suppressed as EG dimerization to DEG can happen during transesterification.46 The enhanced Tg of rPEF is an attractive quality and points to another advantage with the chemical recycling of PEF. Lastly, the crystallinity of rPEF increased from 25% to 31% while Tm remained the same.
Further characterization of rPEF was conducted using TGA (Fig. 5c). The obtained thermograms indicated some solids were still present in rPEF at high temperatures. Besides this difference, the TGA profiles of Lot 1 and rPEF profiles were very similar. Lastly, the molecular weight of rPEF increased significantly compared with Lot 1 (MW 56.5 vs. 39.6 to kg mol−1) for a similar dispersion index (Đ) value (Fig. 5d). Gabirondo et al. studied the chemical recycling of PEF films using an organocatalyst; their rPEF had a moderate MW (38 kg mol−1) at high Đ (3.4).47 The higher MW and the increased Tg represent an exciting upcycling prospect for PEF chemical recycling.
Lastly, the depolymerization of rPEF was carried out and compared to that from Lot 1. As shown in Fig. 5e, the depolymerization of rPEF displayed slightly improved kinetics under the same conditions. Thus, the lifecycle of PEF was robust, demonstrating a high potential for circularity. Approximately 2/3 of the BHEF monomer could be recovered from the depolymerized rPEF solution in the same time (30 days). The upgraded properties of rPEF, its faster depolymerization kinetics, superior barrier properties of PEF relative to PET, and the renewable sourcing of PEF point to it being a highly advantageous polymer over traditional PET. While these are all exciting findings, the significantly slower monomer recovery due to crystallization is a drawback for fully realizing PEF chemical recycling. Enhancing the crystallization kinetics via seeding48 could be conducive to eliminating this challenge.
Conclusions
We characterized and investigated the glycolysis of various PEF polymers under microwave-assisted heating. Higher molecular weight polymers exhibited higher values for the enthalpy of degradation. ZnO displayed the highest activity for PEF glycolysis compared with other heterogeneous catalysts tested. Oligomers were initially formed without a depolymerization catalyst, probably owing to the catalyst used in the polymerization process, but they were rapidly depolymerized into BHEF by ZnO. A reduced polymer crystallinity, smaller particle size, and higher temperature enhanced oligomer formation and PEF conversion. The effect of the polymer's particle size on apparent kinetics indicated substantial mass-transfer limitations. Increasing the temperature from 160 °C to 175 °C enhanced the activity 4-fold in some cases. For the lowest MW polymer tested, we achieved a BHEF production rate of 880 g BHEF per h per g catalyst at 175 °C. The recovery of BHEF via crystallization was significantly slow and only reached 70% over 30 days. Recycling of the recovered BHEF yielded rPEF with an improved MW and Tg and favorable depolymerization kinetics. Thus, the circularity of PEF demonstrated herein offers an exciting opportunity for obtaining sustainable, recyclable plastics. Chemical recycling can also facilitate the synthesis of better quality polymers than the original ones, indicating the upside potential for upcycling.Author contributions
Sean Najmi: Conceptualization, methodology, investigation, formal analysis, and writing – original draft, review & editing. Dylan Huang: Methodology and investigation. Andrew Duncan: Formal analysis and writing – original draft, review & editing. Dan Slanac: Formal analysis and writing – original draft, review & editing. Keith Hutchenson: Formal analysis and writing – original draft, review & editing. James Hughes: Methodology and investigation. Raja Poladi: Methodology and investigation. Dionisios G. Vlachos: Writing – review & editing, project administration, and funding acquisition.Data availability
All data are available in the main text or ESI.† All of the data supporting the findings of this study are presented within the article and ESI.† All other data are available from the lead contact upon reasonable request.Conflicts of interest
Andrew Duncan, Dan Slanac, Keith Hutchenson, James Hughes, and Raja Pooladi are the employees of Covation Biomaterials LLC. The other authors claim no competing interests.Acknowledgements
This work was supported by the National Science Foundation under Grant No. OIA – 2119754. The use of the mass spectrometry facilities at the University of Delaware was supported by the Delaware COBRE program, with a grant from the National Institute of General Medical Sciences (NIGMS) (5 P30 GM110758-02) from the National Institutes of Health. The authors acknowledge the use of NMR facilities and instrumentation supported by the NIGMS under Award Numbers P20GM104316 and S10OD025185-01 from the National Institutes of Health and National Science Foundation Award CHE0421224.References
- R. Geyer, J. R. Jambeck and K. L. Law, Sci. Adv., 2017, 3, e1700782 CrossRef PubMed
.
- Z. O. G. Schyns and M. P. Shaver, Macromol. Rapid Commun., 2021, 42, 2000415 CrossRef CAS PubMed
- L. T. J. Korley, T. H. Epps, B. A. Helms and A. J. Ryan, Science, 2021, 373, 66–69 CrossRef CAS PubMed
- E. Barnard, J. J. Rubio Arias and W. Thielemans, Green Chem., 2021, 23, 3765–3789 RSC
- M. Bachmann, C. Zibunas, J. Hartmann, V. Tulus, S. Suh, G. Guillén-Gosálbez and A. Bardow, Nat. Sustainability, 2023, 6, 599–610 CrossRef
- F. Vidal, E. R. van der Marel, R. W. F. Kerr, C. McElroy, N. Schroeder, C. Mitchell, G. Rosetto, T. T. D. Chen, R. M. Bailey, C. Hepburn, C. Redgwell and C. K. Williams, Nature, 2024, 626, 45–57 CrossRef CAS PubMed
- X. Tang and E. Y. X. Chen, Chem, 2019, 5, 284–312 CAS
- B. Saha, S. Dutta and M. M. Abu-Omar, Catal. Sci. Technol., 2012, 2, 79–81 RSC
- V. Choudhary, S. H. Mushrif, C. Ho, A. Anderko, V. Nikolakis, N. S. Marinkovic, A. I. Frenkel, S. I. Sandler and D. G. Vlachos, J. Am. Chem. Soc., 2013, 135, 3997–4006 CrossRef CAS PubMed
-
S. J. Howard, K. A. Kreutzer, B. Rajagopalan, E. R. Sacia, A. Sanhorn and B. Smith, US10538499B2, 2020, https://patents.google.com/patent/US20180093961A1/en
- K. Loos, R. Zhang, I. Pereira, B. Agostinho, H. Hu, D. Maniar, N. Sbirrazzuoli, A. J. D. Silvestre, N. Guigo and A. F. Sousa, Front. Chem., 2020, 8, 1–18 CrossRef PubMed
- A. J. J. E. Eerhart, A. P. C. Faaij and M. K. Patel, Energy Environ. Sci., 2012, 5, 6407–6422 RSC
- S. K. Burgess, O. Karvan, J. R. Johnson, R. M. Kriegel and W. J. Koros, Polymer, 2014, 55, 4748–4756 CrossRef CAS
- S. K. Burgess, R. M. Kriegel and W. J. Koros, Macromolecules, 2015, 48, 2184–2193 CrossRef CAS
-
Y. Brun, A. M. Castagna, K.-H. Liao, F. Nederberg, E. Forrester McCord and C. J. Rasmussen, US Pat, WO/2015/168563, 2015 Search PubMed
-
A. Duncan and P. Fagan, US PatWO/2016/200653, 2016 Search PubMed
- L. Jiang, A. Gonzalez-Diaz, J. Ling-Chin, A. Malik, A. P. Roskilly and A. J. Smallbone, Nat. Sustainability, 2020, 3, 761–767 CrossRef
- B. Agostinho, A. J. D. Silvestre and A. F. Sousa, Green Chem., 2022, 24, 3115–3119 RSC
- X. Qu, G. Zhou, R. Wang, B. Yuan, M. Jiang and J. Tang, Green Chem., 2021, 23, 1871–1882 RSC
- V. Kumar, A. Pellis, R. Wimmer, V. Popok, J. D. C. Christiansen and C. Varrone, ACS Sustainable Chem. Eng., 2024, 12, 9658–9668 CrossRef CAS PubMed
- B. Rajasekhar Reddy, A. Malhotra, S. Najmi, M. Baker-Fales, K. Coasey, M. Mackay and D. G. Vlachos, Chem. Eng. Process., 2022, 182, 109202 CrossRef CAS
- Y. Luo, E. Selvam, D. G. Vlachos and M. Ierapetritou, ACS Sustainable Chem. Eng., 2023, 11, 4209–4218 CrossRef CAS
-
United States Department of Energy, Industrial Decarbonization Roadmap, 2023 Search PubMed
- S. Najmi, P. Bhalode, M. Baker-Fales, B. C. Vance, E. Selvam, K. Yu, W. Zheng and D. G. Vlachos, Nat. Chem. Eng., 2024, 1(9), 597–607 CrossRef
- C. Alberti, K. Matthiesen, M. Wehrmeister, S. Bycinskij and S. Enthaler, ChemistrySelect, 2021, 6, 7972–7975 CrossRef CAS
- M. Kang, E. D. Park, J. M. Kim and J. E. Yie, Appl. Catal., A, 2007, 327, 261–269 CrossRef CAS
- J. Pan, S. Shi, Y. Yuan and R. F. Lobo, ChemCatChem, 2022, 14, e202200907 CrossRef CAS
- G. Z. Papageorgiou, V. Tsanaktsis and D. N. Bikiaris, Phys. Chem. Chem. Phys., 2014, 16, 7946–7958 RSC
- E. Selvam, Y. Luo, M. Ierapetritou, R. F. Lobo and D. G. Vlachos, Catal. Today, 2023, 418, 114124 CrossRef CAS
- J. Wu, H. Xie, L. Wu, B. G. Li and P. Dubois, RSC Adv., 2016, 6, 101578–101586 RSC
- V. Tsanaktsis, D. G. Papageorgiou, S. Exarhopoulos, D. N. Bikiaris and G. Z. Papageorgiou, Cryst. Growth Des., 2015, 15, 5505–5512 CrossRef CAS
- A. S. Joshi, N. Alipourasiabi, Y. W. Kim, M. R. Coleman and J. G. Lawrence, React. Chem. Eng., 2018, 3, 447–453 RSC
- C. F. Araujo, M. M. Nolasco, P. J. A. Ribeiro-Claro, S. Rudić, A. J. D. Silvestre, P. D. Vaz and A. F. Sousa, Macromolecules, 2018, 51, 3515–3526 CrossRef CAS
- Z. Terzopoulou, E. Karakatsianopoulou, N. Kasmi, M. Majdoub, G. Z. Papageorgiou and D. N. Bikiaris, J. Anal. Appl. Pyrolysis, 2017, 126, 357–370 CrossRef CAS
-
R. B. Prime, H. E. Bair, S. Vyazovkhin, P. K. Gallagher and A. Riga, in Thermal Analysis of Polymers: Fundamentals and Applications, 2008, pp. 241–317 Search PubMed
- C. F. Gallin, W. W. Lee and J. A. Byers, Angew. Chem., Int. Ed., 2023, 62, e202303762 CrossRef CAS PubMed
- S. Najmi, B. C. Vance, E. Selvam, D. Huang and D. G. Vlachos, Chem. Eng. J., 2023, 471, 144712 CrossRef CAS
- T. Yoshioka, N. Okayama and A. Okuwaki, Ind. Eng. Chem. Res., 1998, 37, 336–340 CrossRef CAS
- T. Uekert, A. Singh, J. S. DesVeaux, T. Ghosh, A. Bhatt, G. Yadav, S. Afzal, J. Walzberg, K. M. Knauer, S. R. Nicholson, G. T. Beckham and A. C. Carpenter, ACS Sustainable Chem. Eng., 2022, 11, 965–978 CrossRef
- G. L. Wilkes, P. J. Makarewicz and H. D. Weigmann, J. Macromol. Sci., Part C, 1976, 15, 279–393 CrossRef
- J. Moncada and M. D. Dadmun, J. Mater. Chem. A, 2023, 11, 4679–4690 RSC
- G. Stoclet, G. Gobius Du Sart, B. Yeniad, S. De Vos and J. M. Lefebvre, Polymer, 2015, 72, 165–176 CrossRef CAS
- F. Hassouna, J. M. Raquez, F. Addiego, P. Dubois, V. Toniazzo and D. Ruch, Eur. Polym. J., 2011, 47, 2134–2144 CrossRef CAS
- R. Y. Wang, S. F. Zou, B. Y. Jiang, B. Fan, M. F. Hou, B. Zuo, X. P. Wang, J. T. Xu and Z. Q. Fan, Cryst. Growth Des., 2017, 17, 5908–5917 CrossRef CAS
- S. S. Hosseini, S. Taheri, A. Zadhoush and A. Mehrabani-Zeinabad, J. Appl. Polym. Sci., 2007, 103, 2304–2309 CrossRef CAS
-
T. Rieckmann and S. Völker, in Modern Polyesters: Chemistry and Technology of Polyesters and Copolyesters, John Wiley & Sons Ltd, 2004, pp. 29–115 Search PubMed
- E. Gabirondo, B. Melendez-Rodriguez, C. Arnal, J. M. Lagaron, A. Martínez De Ilarduya, H. Sardon and S. Torres-Giner, Polym. Chem., 2021, 12, 1571–1580 RSC
- F. Zhang, B. Shan, Y. Wang, Z. Zhu, Z. Q. Yu and C. Y. Ma, Org. Process Res. Dev., 2021, 25, 1496–1511 CrossRef CAS
Footnote |
| † Electronic supplementary information (ESI) available. See DOI: https://doi.org/10.1039/d5gc01583a |
| This journal is © The Royal Society of Chemistry 2025 |