
 Open Access Article
 This Open Access Article is licensed under a
 Creative Commons Attribution 3.0 Unported Licence
Investigating the suitability of sunflower press-cake proteins in formulated sports beverages†
Girotto
Francesca
 a,
Ceccanti
Costanza
b,
Narra
Federica
b and
Piazza
Laura
*a
a,
Ceccanti
Costanza
b,
Narra
Federica
b and
Piazza
Laura
*a
aDepartment of Environmental Science and Policy, Università degli Studi di Milano, Via Mangiagalli 25, 20133, Milano, Italy. E-mail: francesca.girotto@unimi.it; laura.piazza@unimi.it
bDepartment of Agriculture, Food and Environment, University of Pisa, Via del Borghetto 80, 56124, Pisa, Italy. E-mail: costanza.ceccanti@unipi.it; federica.narra@phd.unipi.it
First published on 17th February 2025
Abstract
In a context where whey proteins currently dominate the protein sports beverage sector and pea proteins are usually commercialized as protein sources, this study proposes using sunflower press-cake, which contains approximately 44% protein, as an alternative and sustainable protein source. After the extraction from the press-cake, sunflower proteins were dispersed in an aqueous medium with varying xanthan gum concentrations (0.2%, 0.4% and 0.6% w/v) to simulate protein-rich sports beverages. Their performance was compared to that of whey and pea proteins, each at a 10% concentration. To enhance protein dispersibility and align with the trends of alkaline beverages, a K–P buffer at pH 9 was used as the dispersion medium, and 0.2% caffeine was included for cognitive benefits. Pasteurized dispersions were tested for rheological behavior and physical stability at 4 °C. Sunflower proteins, with a total polyphenolic content (TPC) of 35.2 mgGAE gDB−1, outperformed whey (0.8 mgGAE gDB−1) and pea (2.8 mgGAE gDB−1) proteins. Sunflower dispersions exhibited a significantly lower volatile profile than those enriched with pea or whey proteins, reducing the need for odor-masking agents. Additionally, sunflower dispersions had a lower flow index than whey or pea dispersions, indicating easier processing. Despite the promising flow behaviour and optimal physical stability (stability index < 1.0), in vitro bioaccessibility analysis revealed a similar percentage of protein bioaccessibility between pea and whey dispersions, while sunflower ones had the lowest percentage. TPC bioaccessibility followed a similar trend. These findings highlight the feasibility of incorporating sunflower proteins into sports beverages, broadening options for formulators and promoting sustainability by repurposing agricultural by-products and adopting plant-based proteins.
1. Introduction
The global market for functional beverages, valued at approximately USD 175.5 billion in 2022, is projected to reach around USD 339.6 billion by 2030, growing at a compound annual growth rate of approximately 8.6% from 2023 to 2030.1 This growth reflects a growing consumer interest in health and wellness, as functional beverages not only provide hydration but also offer specific health benefits tailored to various lifestyles. In particular, athletes and active individuals increasingly prefer functional beverages due to their convenience and rapid consumption, especially during training or prolonged athletic exertion. Sports beverages are considered functional products specifically formulated to ensure proper hydration and nutrient intake before, during, and after physical activity. The development of new sports beverages is guided by several objectives, including benefits at both physical and cognitive levels, a short list of ingredients, and sustainable production practices.2 The evolution of sports beverages has seen a diverse range of products designed to meet various needs, including facilitating rapid fluid absorption, supplying carbohydrates for energy during exercise, and promoting post-workout recovery.3 Given that sports beverages are characterized by their specific functionalities tailored to different training phases, recent research has highlighted the importance of protein in these beverages, particularly post-exercise, for maintaining nitrogen balance and reducing amino acid oxidation.3 Originally intended for athletes, sports beverages have expanded beyond their niche market and are now embraced by a broader consumer base, fueled by the increasing demand for healthy and protein-rich diets worldwide. Companies are strategically developing and marketing a wide array of protein-rich beverages, typically with 6–10% protein content,4 capitalizing on the allure of the health claims associated with these products.The formulation of these beverages typically includes water, sweeteners, vitamins (particularly B-complex vitamins for energy metabolism), and antioxidants.4 Key fortifying ingredients such as omega-3 fatty acids, caffeine, and resveratrol are sought after for their cognitive health benefits.5 Regarding the protein source, protein supplementation in beverages initially stemmed from cost-effective by-products of oil and cheese manufacturing processes,3 such as whey, the residual liquid from cheese production, and soy protein isolates, extracted from soybeans typically after soy oil extraction. Nowadays, the preferred sports beverages by athletes are prepared using whey proteins.6 Egg proteins such as ovotransferrin, ovomucin, and ovalbumin with a complete amino acid profile are also being used in the development of ready-to-drink protein beverages for physical strength and muscle building.7 Aligned with concerns regarding food security, animal welfare, and low environmental impact, plant-derived proteins have shown promise for the production of high-quality beverages. Legumes, pulses, seeds, and nuts are often highlighted as great sources of protein, mainly oil industry by-products, like press-cakes, which are protein-rich, but still poorly explored as food.8 Nevertheless, just a few brands stand out promoting vegetable protein sources, mainly pea and soy proteins.
Unfortunately, a limitation of the inclusion of vegetable protein sources in protein-rich beverages is their lower bioaccessibility when compared to animal protein sources,9 as indicated by a protein digestibility-corrected amino acid score (PDCAAS) that can be as low as half that of animal sources.10 At the same time, the advantage of using a plant protein source is its well-known richness in phenolic compounds and other antioxidant molecules which enhance the beverage quality.11 For these reasons, researching new plant-based protein sources is again more important and stimulating.
Considering the sustainability objectives mentioned above, and as a follow-up to our previous research,12 the study aimed to investigate the potential upcycling of sunflower press-cake as a sustainable and allergen-friendly protein source into protein beverages. This study entailed comparing dispersions formulated with sunflower, pea, or whey protein concentrates using a concise list of ingredients consisting of soy lecithin, xanthan gum, sucralose, and salt. The dispersions were prepared in a buffer solution with pH 9, selected to enhance protein solubility and absorption within the human body.13 This alkaline environment is known to support optimal physiological functions, such as hydration, acid–base balance, and anaerobic exercise performance.14 Flow behaviour and physical stability responses were evaluated. Additionally, protein and polyphenol bio-accessibility was assessed, along with the sensory attributes of colour and odour measured through laboratory instrumentation. Flavour adaptation and sensory analysis were beyond the scope of the present study.
2. Materials and methods
2.1 Protein materials and chemical reagents
Dehulled sunflower press-cake (DSPC) was provided by Savi Italo Srl (Fiorenzuola d'Arda, Piacenza, Italy). Press-cake was collected after cold press oil expression (in a range between 30 and 40 °C) from dehulled seeds using a single helix screw press and stored under vacuum at room temperature. Whey and pea protein concentrates were kindly provided by Biovita Srl (Vicenza, Italy) and Cargill Incorporated (Minneapolis, USA), respectively. Ketrol® RD (xanthan gum) was provided by CP Kelco (Atlanta, USA). Soy lecithin, sucralose, and chemicals were purchased from Sigma-Aldrich (St Louis, USA), Fisher Scientific (Massachusetts, USA), and Merck KGaA (Darmstadt, Germany).2.2 Protein extraction from dehulled sunflower press-cake
Micronization, a process commonly achieved through mechanical means that reduces the average diameter of a solid material's particles to enhance the surface area, was applied to DSPC through a KMX-500 ultra-fine milling device (Separ Microsystem, Brescia, Italy) operating at a frequency of 70 Hz. This technique produced micronized flour with particles with a diameter smaller than 700 μm, effectively breaking down plant cell walls to improve access to intracellular proteins for extraction.15Sunflower proteins were extracted at their isoelectric point using the method of Zaky et al.16 Micronized DSPC was mixed with distilled water at a meal to solvent ratio of 1![[thin space (1/6-em)]](https://www.rsc.org/images/entities/char_2009.gif) :10 (w/v). The pH of the mixture was adjusted to 9.5 by using 1 N NaOH and stirred for 2 h at room temperature. Subsequently, the mixture was centrifuged (10000g for 10 min at 4 °C). The supernatant was collected, and the pH was adjusted to 4 using 1 M HCl. After 30 min, the solution was centrifuged again (10000g for 10 min at 4 °C), the supernatant was discarded, and the precipitated proteins were collected and neutralized to pH 7 using 1 N NaOH. They were freeze-dried for 72 h using a LIO-5PDGT lyophilizer (5pascal S.r.l., Milano, Italy) and stored at room temperature until use.
:10 (w/v). The pH of the mixture was adjusted to 9.5 by using 1 N NaOH and stirred for 2 h at room temperature. Subsequently, the mixture was centrifuged (10000g for 10 min at 4 °C). The supernatant was collected, and the pH was adjusted to 4 using 1 M HCl. After 30 min, the solution was centrifuged again (10000g for 10 min at 4 °C), the supernatant was discarded, and the precipitated proteins were collected and neutralized to pH 7 using 1 N NaOH. They were freeze-dried for 72 h using a LIO-5PDGT lyophilizer (5pascal S.r.l., Milano, Italy) and stored at room temperature until use.
2.3 Chemical analysis of the protein concentrates: whey, pea, and sunflower
The total solids, ash, fat, and protein contents of whey, pea, and sunflower protein concentrates were determined according to the specific methods outlined by the AOAC.17 In particular, for protein quantification, the Kjeldahl method was employed, using a nitrogen-to-protein conversion factor of 6.36 for whey,18 5.4 for pea protein,19 and 5.6 for sunflower protein20 to accurately estimate the protein content.Total phenolic content (TPC) was measured using the Folin–Ciocalteu assay following the method outlined by Dewanto et al.21 with few modifications. Methanolic extracts were prepared by dispersing 1 g of protein concentrate into 20 mL of 70% (v/v) aqueous methanol. The mixtures were sonicated (Bandelin Sonorex RK31, GmbH & Co. KG, Berlin, Germany) for 30 min, followed by an additional 30 min of stirring. The extracts were then filtered using Whatman No. 4 filter paper and suitably diluted with 70% (v/v) methanol. To measure TPC, 0.5 mL of the diluted samples were mixed with 0.5 mL of the Folin–Ciocalteu reagent. After 3 min, 2 mL of 10% Na2CO3 and 7 mL of distilled water were added to the mixture. The resulting mixtures were shaken and stored in the dark for 90 min. Absorbance was read at 750 nm (Spectrophotometer V-650, Jasco, Japan). The data were compared to a gallic acid standard curve and TPC was calculated as mg gallic acid equivalents (GAE) per g of dry weight (DB). All measurements were carried out in triplicate.
2.4 Dispersion preparation
Considering the specific protein content of each ingredient, dispersions simulating protein-rich beverages were formulated incorporating whey, pea, or sunflower proteins, as detailed in Table 1. To align with the highest protein content typically found in commercial sports beverages, which ranges from 6 to 10 g of proteins per 100 g of product, the three protein concentrates under study were added to achieve a 10% (w/v) protein concentration within the beverage.| Ingredient | % (w/v) |
|---|---|
| Protein ingredient | 14.2 – sunflower proteins |
| 12.5 – pea proteins | |
| 10.4 – whey proteins | |
| Xanthan gum | 0.0–0.2–0.4–0.6 |
| Soy lecithin | 0.5 |
| Sucralose | 0.35 |
| Caffeine | 0.02 |
| Salt | 0.15 |
Instead of utilizing mineral water, protein concentrates were dispersed into a potassium–phosphate (K–P) buffer solvent at pH 9 (12.8 mM). To prepare the buffer, 1.74 g of KH2PO4 and 2.23 g of K2HPO4 were dissolved in approximately 900 mL of distilled water. The pH was adjusted to 9.0 with K2HPO4, and the final volume was adjusted to 1 L with distilled water. Soy lecithin (0.5% w/v) was added as an emulsifier to all samples. Moreover, to resemble the composition of commercial sports protein beverages, sodium chloride (0.15% w/v) was included in the formulations. Sucralose (0.35% w/v) was chosen as the sweetener due to its thermal stability, lack of calories, neutral taste, and its proven ability to enhance the bioavailability of polyphenols.22 Based on the regulatory limits set by the Food and Drug Administration on caffeine added to beverages, such as energy drinks, at a concentration of 0.02% and on the recommendation of the European Food Safety Authority to limit the daily intake of caffeine up to 400 mg, 0.02% caffeine concentration was incorporated in the protein dispersion under investigation.
For each protein type, three different formulations with varying xanthan gum (XG) concentrations were prepared, namely 0.2%, 0.4%, and 0.6% (w/v). XG is commonly added to commercial food products at concentrations of 0.05–0.5%,23 though higher levels have also been reported.24 Testing various concentrations allowed an evaluation of their effect on the viscosity and physical stability of the dispersions. The nine dispersions were mildly pasteurized at 58 °C for 30 min and then refrigerated at 4 °C for at least 3 h before analysis. The mild pasteurization step was conducted at 58 °C to avoid the onset of protein gelation (Tonset), as indicated by the preliminary temperature ramp data (ESI – Fig. S1†). Tonset was 61.2, 61.5, and 63.2 °C for sunflower, pea and whey dispersions, respectively.
Samples were labelled as follows: S-0.2x, S-0.4x, S-0.6x, P-0.2x, P-0.4x, P-0.6x, W-0.2x, W-0.4x, and W-0.6x; ‘S’ stands for sunflower, ‘P’ for pea, and ‘W’ for whey protein sources and the numbers indicate the percentages of xanthan gum (x) added to the dispersions. For example, S-0.2x represents a sunflower protein dispersion with 0.2% xanthan gum.
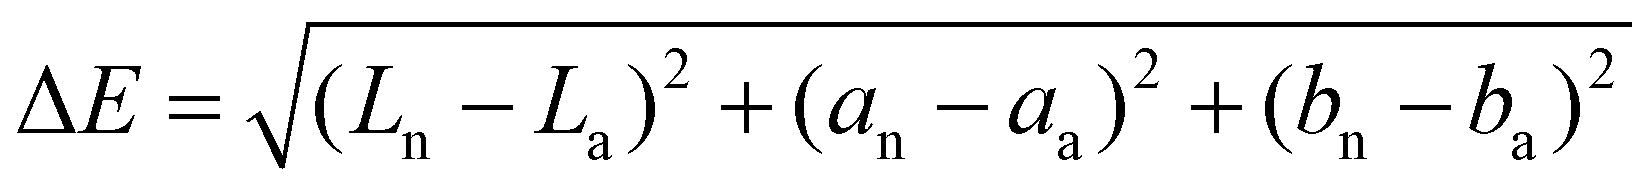
Eqn (1) was adopted to calculate the total colour difference (ΔE) of pea and sunflower protein dispersions compared to whey protein ones. Chroma (C*) and hue angle (h°) were calculated according to eqn (2) and (3), respectively.25
 | (1) |
| C\ast = (a\ast2 + b\ast2)1/2 | (2) |
 | (3) |
Reported results are the average of seven replicates for each sample.
| Sensor | Sensitive substances | Reference |
|---|---|---|
| S1 | Aromatic compounds | Toluene, 10 ppm |
| S2 | Broad range sensitivity, nitrogen oxides | NO2, 1 ppm |
| S3 | Ammonia, aromatic compounds | Benzene, 10 ppm |
| S4 | Mainly hydrogen | H2, 100 ppb |
| S5 | Alkanes, aromatic compounds, less polar compounds | Propane, 1 ppm |
| S6 | Methane, broad range sensitivity | CH3, 100 ppm |
| S7 | Sulphur compounds, H2S 0.1 ppm. Sensitive to terpenes and sulphur organic compounds, limonene, pyrazine | H2S, 1 ppm |
| S8 | Alcohols, partially aromatic compounds, ketones | CO, 100 ppm |
| S9 | Aromatic compounds, sulphur organic compounds | H2S, 1 ppm |
| S10 | Reacts at high concentrations >100 ppm, methane | CH3, 100 ppm |
Since the pasteurized dispersions simulate a refrigerated product, the analysis was conducted at 4 °C. After being left overnight at 4 °C to allow the headspace to equilibrate with the volatile compounds, the measurement started. The headspace air, carrying the volatiles, was pumped over the sensor surfaces for 60 s (injection time) at a flow rate of 300 mL min−1; the sensor signals were taken at their maximum value. After sample analysis, the sensors were purged for 600 s with filtered air (purge time) and then, before the next sample injection, the sensor baselines were re-established for 5 s. Reported results are the average of seven replicates for each sample.
η = k×![[small gamma, Greek, dot above]](https://www.rsc.org/images/entities/i_char_e0a2.gif) n−1 n−1 | (4) |
is the shear rate (s−1) and n is the flow index. While n = 1 is characteristic of Newtonian fluids, values of n < 1 indicate shear-thinning behaviour, where the viscosity decreases with increasing shear rate, and values of n > 1 signify shear-thickening behaviour, where the viscosity increases as the shear rate increases, leading to enhanced resistance to flow.
An additional parameter evaluated was the yield stress, derived by fitting the stress versus shear rate curves (ESI – Fig. S2†) according to the Casson model (eqn (5)):28
| τ0.5 = τ00.5 + (ηp×)0.5 | (5) |
is the shear rate (s−1).
All tests were conducted at 4 °C. Data were elaborated through software TRIOS 3.0.2.
For each sample, an aliquot of about 20 mL was placed into flat-bottomed cylindrical glass vials (27.5 mm diameter, 70 mm height), avoiding air bubble formation. The analysis was carried out at 4 °C for a period of 3 days (acquiring backscattering light spectra every 3 min for the first 4 h, every 6 min for the following 8 h, every 11 min for the next 24 h, and every 30 min until the end of the testing period).
The Stability Index (SI) was calculated by applying the following formula (eqn (6)):
 | (6) |
2.4.5.1 Simulated gastrointestinal digestion. The in vitro digestion process was conducted following the standardized protocol established by the INFOGEST consensus method, as described by Brodkorb et al.,32 with few modifications. In vitro digestion was simulated on sunflower, pea, and whey protein dispersions characterized by 10% of protein content and prepared as described in paragraph 2.4, without the addition of xanthan gum. All the digestions were carried out in triplicate. The in vitro digestion method involved the use of simulated salivary fluid (SSF), simulated gastric fluid (SGF), and simulated intestinal fluid (SIF) that were prepared using different amounts of stock electrolyte solutions, previously prepared, to replicate the environments of the three main consecutive steps; oral, gastric and intestinal phases. An amount of 2.5 g of each protein dispersion was mixed with an equal volume of SSF in a 1
:1 (v/v) ratio. The mixture was then incubated at 37 °C for 2 min with continuous shaking to simulate the chewing process. The resultant mixture from the oral phase (oral bolus) was subsequently combined with SGF in a 1:1 (v/v) ratio, and the pepsin enzyme (2000 U ml−1) was added to the mixture. The pH of the oral bolus was adjusted to 3 using 1 M HCl and then incubated at 37 °C for 2 h with continuous shaking to replicate the conditions of gastric digestion. Consequently, the gastric chyme resulting from the gastric phase was combined with SIF in a 1:1 (v/v) ratio, to which the pancreatic enzyme mixes (100 U ml−1), and bile salts (10 mM) were added and the pH was adjusted to 7 with 1 M NaOH. The samples were then incubated under the same conditions described in the previous gastric step to simulate the environment and conditions of intestinal digestion. After completing the intestinal phase, the digestion mixtures were centrifuged at 14000g for 15 min and the supernatants were collected and freeze-dried for 48 h. After freeze-drying, the digested protein samples were ground to a powder that was subsequently used for bioaccessibility analyses of TPC and protein content.
2.4.5.2 Determination of in vitro bioaccessibility. Digested samples were analyzed for their protein content and TPC to assess their in vitro bioaccessibility. The protein content was determined as described for the undigested samples in paragraph 2.3. TPC was assessed using the Folin–Ciocalteu assay as reported by Dewanto et al.21 with few modifications as reported in paragraph 2.3. TPC was calculated as mg of GAE per g of fresh basis (FB), considering the different appropriate dilutions between digested and undigested samples.
Bioaccessibility percentage was calculated as follows (eqn (7)):
 | (7) |
2.5 Statistical analysis
Data represent the mean of replicate analyses ± their standard deviation. JMP 5.0 software (SAS Institute Cary NC, USA) was used for the statistical analysis of chemical composition and the colour results of sunflower, pea, and whey protein concentrates and dispersions by one-way analysis of variance (ANOVA) with Tukey–Kramer HSD with the level of significance set up at p < 0.05 value. E-nose data were elaborated by Principal Component Analysis (PCA) using the R studio ©2009–2024 Posit Software, PBC. The statistical analysis of bioaccessibility results was performed by two-way ANOVA considering digestion and different protein matrices as variability factors using the Least Significant Difference (LSD) post-hoc test with the level of significance set up at p < 0.05 value. The percentage of bioaccessibility was analysed by one-way ANOVA with the LSD post-hoc test with the level of significance set up at p = 0.05 value. GraphPad software (GraphPad, La Jolla, CA, USA) was used for the statistical analysis of bioaccessibility data.3. Results and discussion
Considering the saturation of the market with sports beverages made from whey proteins and the growing presence of vegan brands offering pea protein-based alternatives, this study focused on promoting another vegan protein source derived from the upcycling of sunflower press-cake. The tested formulations account for consumer preference for sucralose over other sweeteners in protein beverages,33 and the use of a K–P buffer not only aligns with dietary recommendations for a balanced intake of essential minerals but also offers additional benefits, such as supporting optimal physiological functions, due to the alkaline environment it creates.13 Furthermore, caffeine was incorporated for its well-known advantages for athletes, including enhanced endurance, improved focus, and heightened alertness during physical activity.Dispersions without xanthan gum were subjected to colour measurement, protein and total phenolic content (TPC) bioaccessibility testing, and e-nose analysis. This approach enabled a focused investigation into the impact of each specific protein source on the colour and odour properties of the dispersions, as well as their bioaccessibility. In contrast, the flow behaviour and physical stability of the protein-rich dispersions were compared using three different concentrations of xanthan gum (0.2–0.4–0.6% w/v), allowing for an evaluation of how varying thickener levels affect the overall texture and stability of the formulations.
Despite the differences in processing methods, freeze-drying for extracted sunflower proteins, and spray-drying for commercial whey and pea proteins, the primary goal of this research was to assess the feasibility of incorporating sunflower proteins into a protein-rich drink formulation. The employed mild pasteurization is well-suited for products intended for refrigeration or immediate consumption, as these typically have a shorter shelf-life. Therefore, rheological and physical stability tests, along with e-nose analysis, were performed at 4 °C to simulate the conditions of refrigerated beverages.
3.1 Characterization of protein concentrates
The gross composition and TPC of the three investigated protein concentrates are summarized in Table 3. Samples exhibited protein contents ranging between 72.6% and 87.0%. The remarkably low moisture content of sunflower proteins (1.01%) confirmed the effectiveness of the freeze-drying process. With respect to previous studies, the TPC of the tested pea and whey proteins aligned with values reported by Sawicki et al.34 and Thongzai et al.,35 respectively. The significantly high TPC observed in sunflower proteins (35.20 ± 1.11 mgGAE gDB−1) is of particular note, with chlorogenic acid (CGA) identified as the main phenolic compound in a previous work.12 This abundance of phenolic compounds was previously assessed by Weisz et al.36 and represents an opportunity to enhance the nutritional profile and health-promoting benefits of protein drinks, particularly for athletes who seek to reduce oxidative stress and inflammation associated with intense physical activity.37| Protein type | Total solids | Ashes | Proteins | TPC |
|---|---|---|---|---|
| g per 100 g | g per 100 gDB | g per 100 gDB | mgGAE gDB−1 | |
| Data are expressed as the mean of three replicates ± S.D. DB = dry basis; TPC = total polyphenol content. Means within a column with different letters (a corresponding to the highest value) are significantly different (p < 0.05). | ||||
| Sunflower | 98.99 ± 0.03 a | 3.87 ± 0.09 b | 72.61 ± 0.66 c | 35.20 ± 1.11 a |
| Pea | 93.53 ± 0.16 b | 5.31 ± 0.07 a | 78.95 ± 1.54 b | 2.79 ± 0.04 b |
| Whey | 93.67 ± 0.23 b | 2.95 ± 0.08 c | 87.03 ± 0.73 a | 0.76 ± 0.04 c |
3.2 Instrumental sensory analysis of protein dispersions: colour and e-nose
The colour analysis of the protein dispersions revealed distinct characteristics among sunflower, pea, and whey matrices (Table 4). Sunflower protein dispersions exhibited a marked green component (a* = −18.9 ± 0.4) and a slight blue component (b* = −1.6 ± 0.5), whereas pea and whey protein dispersions were characterized by pronounced yellowness. The formation of green-coloured complexes through CGA–protein interactions is the primary reason why defatted sunflower proteins have not been widely utilized by the food industry.38 However, these findings should represent an opportunity for beverage formulation, especially in highlighting the unique colour profile offered by sunflower proteins. The development of beverages with visually striking green hues may particularly appeal to consumers seeking innovative and environmentally sustainable beverage options.39 Additionally, the presence of a subtle blue component contributes to the complexity and depth of the colour profile, further enhancing the visual appeal of the beverage. The duller appearance of sunflower protein dispersions compared to whey protein dispersions (C* = 18.99 vs. C* = 31.71) suggested a softer and more subdued colour intensity. This can also be advantageous in beverage formulation, as it allows for the creation of beverages with more subtle and nuanced colours associated with the idea of healthiness.40| Dispersion type | L* | a* | b* | C* | h° | ΔE |
|---|---|---|---|---|---|---|
| Data are expressed as mean ± S.D. Means within a column with different letters (a corresponding to the highest value) are significantly different (p < 0.05). | ||||||
| Sunflower proteins | 47.2 ± 0.6 c | −18.9 ± 0.4 c | −1.6 ± 0.5 c | 18.99 | 192.2 | 41.8 |
| Pea proteins | 58.1 ± 0.5 b | 4.4 ± 0.2 a | 18.3 ± 0.8 b | 18.79 | 0.61 | 17.6 |
| Whey proteins | 67.1 ± 0.7 a | −2.8 ± 0.2 b | 31.6 ± 0.6 a | 31.71 | 179.8 | — |
The electronic nose was utilized to discern the differences among the olfactory imprints provided by the three distinct protein sources. Using an array of non-specific or partially specific gas sensors that mimic human olfactory perception, the e-nose was able to detect the volatile components in the protein-rich dispersions. This capability was crucial for assessing changes in the aroma profile according to the different protein sources. The collected sensor signals are displayed in Fig. 1. Differences were revealed among the volatile profiles of the samples specifically for sensors S7 and S9, which are sensitive to aromatic and sulphur-containing organic compounds. In particular, whey protein dispersions were grouped in the negative part of PC1 (82.22% explained variance) (Fig. 1B) and discriminated by the W2W and W1W sensors (Fig. 1A). Sunflower protein samples were positioned in the positive part of PC1 and characterized by the least intense aromatic profile. The aromatic fingerprint of the pea protein samples was located at the centre of the plot, exhibiting the same peaks as whey samples but with lower intensity. From the radar chart in Fig. 1A, it can be inferred that sunflower proteins have a much subtler scent than whey proteins, whose generally recognized mild aroma profile is well-documented.41 Overall, sunflower proteins should be preferred over pea proteins due to their significantly lower need for odour-masking agents in product formulations.
 | ||
| Fig. 1 Radar chart of electronic nose sensors (A) and PCA score plot PC1 × PC2 (B) of sunflower, pea, and whey protein dispersions. | ||
3.3 Flow behaviour assessment
The viscograms presented in Fig. 2 illustrate viscosity as a function of shear rate for all samples. At a shear rate of 50 s−1, typically associated with swallowing, the viscosity of sunflower protein dispersions closely resembled that of whole whey yogurt drinks42 when xanthan gum was added at a concentration of 0.2%, as observed in the W-6x sample (Table 5). Conversely, the viscosity at 50 s−1 approached that of skim whey yogurt drinks42 when 0.4% xanthan gum concentration was present. S-6x exhibited a viscosity similar to that of 71 Brix degrees (°Bx) pear juice concentrate at approximately 12 °C.43 Regarding pea protein dispersions, it is worth noting that their viscosity was significantly higher (at least 3-fold) compared to sunflower and whey protein dispersions, even at equivalent xanthan gum concentrations. Among the samples, P-6x exhibited the highest ηa,50, again comparable to that of refrigerated 71 °Bx pear juice concentrate;43 conversely, W-2x displayed the lowest ηa,50, similar to that of refrigerated 50 °Bx pear juice concentrate. All samples exhibited a non-Newtonian pseudoplastic trend, a common characteristic of commercial juices and protein-rich beverages. Evidenced by a decrease in the flow index (Table 5), the pseudoplasticity of dispersions increased with rising concentrations of xanthan gum across the protein types such as whey, pea, and sunflower. The dispersion exhibiting the highest degree of pseudoplasticity was S-6x, with a flow index of 0.202. Among the formulations with equal concentrations of xanthan gum, pea protein dispersions showed the least pseudoplastic behaviour, while those containing sunflower proteins exhibited the highest. On the other side, increasing the concentration of xanthan gum resulted in a notable augmentation in yield stress for all protein sources, suggesting enhanced structural integrity and resistance to flow, which could contribute to improved mouthfeel and suspension stability in the final product. Based on the yield stress of S-6x (16.9 Pa), incorporating a xanthan gum concentration of 0.6% into the final product appears adequate for producing a squeezable protein drink. Meanwhile, for pea protein drinks, a concentration of 0.4% would be adequate (P-4x: 18.4 Pa). This formulation would enable the drink to be easily packed into tubes deformable by hand-pumping, as recommended by Dapčević et al.44 for foods with comparable yield stress values. Such a feature might be attractive for a product formulated for athletes who require convenient, portable nutrition options while on the go. | ||
| Fig. 2 Flow curves of sunflower (S), pea (P), and whey (W) protein dispersions at different xanthan gum (x) concentrations (0.2–0.4–0.6%). | ||
| Xanthan gum (%) | Dispersion type | |||
|---|---|---|---|---|
| Sunflower proteins | Pea proteins | Whey proteins | ||
| η a,50 (Pa s) | 0.2 | 0.252 | 0.802 | 0.025 |
| 0.4 | 0.477 | 1.305 | 0.094 | |
| 0.6 | 0.689 | 1.853 | 0.268 | |
| n | 0.2 | 0.320 | 0.385 | 0.416 |
| 0.4 | 0.246 | 0.298 | 0.279 | |
| 0.6 | 0.202 | 0.241 | 0.230 | |
| Yield stress (Pa) | 0.2 | 3.427 | 7.661 | 0.206 |
| 0.4 | 8.404 | 18.423 | 1.358 | |
| 0.6 | 16.91 | 31.797 | 4.808 | |
Notably, pea proteins are recognized for their lower cross-linking ability due to their limited reactive side groups,45 whereas whey proteins are acknowledged for forming stable protein networks that, in our samples, contribute to micro- or mesoscale structural interactions, enhancing the dispersion's stability and ultimately influencing the samples’ ability to resist coalescence or phase separation. Even though the extraction process may alter the protein composition, sunflower proteins are known to primarily comprise 2S albumins and 11S globulins.46 These proteins can form stable protein networks and have a good water-binding capacity, partly due to their high TPC, which facilitates water binding through hydrogen bonding.46 Additionally, depending on the seed origin, some sunflower proteins contain sulfhydryl groups (–SH) that can begin forming disulphide bridges (–S–S–) at heating temperatures above 50 °C,47 particularly with prolonged heating durations. This process can enhance the stability of the protein network,48 thereby improving the stabilization of the continuous phase in the beverage systems. Besides, it is known that both pH and ionic strength influence the denaturation temperatures of proteins. As reported by Molina et al.,49 an alkaline pH decreases the denaturation temperature of sunflower proteins, making them more susceptible to structural changes at relatively low heating temperatures. This correlation between thermal conditions, pH, and sulfhydryl–disulphide exchange reactions provides valuable insight for optimizing industrial-scale processing.
3.4 Physical stability
The physical stability of the nine different protein dispersions was evaluated by measuring the intensities of backscattering light signals (ΔBS) along the height of the vials containing the samples. This analysis allowed for the identification of instability phenomena within the dispersions and, consequently, the quantification of the stability index (SI) of the products. The exceptional stability of all samples, as demonstrated in Fig. 3 and corroborated by SI values close to 0 and minimal particle migration velocities (less than 0.1% per day) (Table 6), underscores the effectiveness of the protein–stabilizer combinations in inhibiting common destabilization mechanisms such as sedimentation, creaming, clarification, and flocculation. In the basic pH environment where the proteins were dispersed, electrostatic stabilization was facilitated as the proteins acquired a charge, leading to repulsive forces among them. This phenomenon is particularly notable for globulins and albumins,13 the primary constituents of sunflower, pea, and whey proteins, which exhibit a strong net negative charge on their side chains at a pH higher than their isoelectric point (pI; ∼4). Soy lecithin further bolstered the prevention of particle aggregation through steric stabilization, forming a protective layer at the interface, reducing interfacial tension, and stabilizing the dispersion.50 Additionally, xanthan gum contributed to physical stability by increasing the viscosity of the continuous phase, minimizing the dispersed particles’ motion. This balance prevents phase separation and maintains a homogeneous dispersion throughout the storage period.51 | ||
| Fig. 3 Backscattering profiles of the protein-rich dispersions during their cold storage (4 °C) of 3 days: sunflower protein dispersions at different xanthan gum concentrations 0.2% (A), 0.4% (B), and 0.6% (C); pea protein dispersions at different xanthan gum concentrations 0.2% (D), 0.4% (E), and 0.6% (F); whey protein dispersions at different xanthan gum concentrations 0.2% (G), 0.4% (H), and 0.6% (I). | ||
| Sample name | SI | Creaming/clarification layer | Average testing alteration rate | Alteration after 4 and a half days |
|---|---|---|---|---|
| mm | %/d | % | ||
| S-0.2x | 0.459 | 2.31 | 0.110 | 0.49 |
| S-0.4x | 0.402 | 1.92 | 0.072 | 0.32 |
| S-0.6x | 0.393 | 0.49 | 0.051 | 0.23 |
| P-0.2x | 0.287 | 0.77 | 0.082 | 0.37 |
| P-0.4x | 0.351 | 1.09 | 0.099 | 0.44 |
| P-0.6x | 0.344 | 0.96 | 0.098 | 0.44 |
| W-0.2x | 0.283 | — | 0.043 | 0.19 |
| W-0.4x | 0.314 | — | 0.047 | 0.21 |
| W-0.6x | 0.244 | — | 0.039 | 0.18 |
Despite their remarkable stability, imperceptible instability phenomena may still be noticed. Both S-0.4x and S-0.6x dispersions initially exhibited a very light creaming phenomenon, characterized by 7.2% and 9.3% ΔBS at the liquid surface, respectively. Nevertheless, the shape and colour gradient of those observed peaks appear to be more attributable to surface tension effects on the walls of the vials than an actual creaming process.
3.5 Bioaccessibility of protein content and TPC from sunflower, pea, and whey protein dispersions
Fig. 4 shows the protein content (Fig. 4A) and the TPC (Fig. 4C) of the sunflower, pea, and whey protein dispersions before and after the in vitro digestion with the relative percentage of bioaccessibility of both nutrients (Fig. 4B for the protein content and Fig. 4D for the TPC). | ||
| Fig. 4 Protein content (A) and total phenolic content (TPC; C) of the protein dispersion from sunflower, pea, and whey matrices with the relative percentage of bioaccessibility (B for proteins and D for the TPC). Closed bars in A and B represent results obtained from undigested samples, whilst open bars represent results obtained from digested samples. In A and C, different letters for the factors (matrices; M and digestion; Dig), or their interaction, indicate significant differences at p < 0.05 using the post-hoc LSD test. **: p > 0.01; ***: p < 0.001. In B and D, different letters on the bars indicate significant differences at p = 0.05 using the post-hoc LSD test. | ||
Whey protein dispersions showed the highest bioaccessibility (Fig. 4B); however, sunflower proteins exhibited a similar percentage of protein bioaccessibility to pea ones (Fig. 4B). Studies indicate that plant protein bioaccessibility tends to be lower compared to whey proteins9 mainly because of the protein structure and the presence of antinutritional factors in plant proteins that can hinder digestion and absorption.52 In sunflower, for example, the presence of phytates can reduce protein bioaccessibility.53 Girotto et al.12 reported a phytate content of 5 g per 100 g in the micronised dehulled press cake used in the current study.
Regarding the TPC in the dispersions before simulated gastrointestinal digestion (Fig. 4C), sunflower dispersions had the highest content and whey ones the lowest, according to the TPC results on freeze-dried samples (Table 3). However, the bioaccessibility of TPC was similar across all protein dispersions after in vitro digestion, measured in mgGAE gFB−1. There was an 84.3% reduction in sunflower and increases of 45.4% and 77.3% in pea and whey, respectively, compared to the undigested samples. Physicochemical changes in the gastrointestinal tract, such as variations in temperature, pH, and enzyme activity, influence the bioaccessibility of antioxidants like phenolic compounds. Polyphenols are particularly sensitive to alkaline conditions, which can alter their structure and reduce their chemical properties and biological activity,54 as seen in the sunflower protein dispersions in this study. Additionally, polyphenols can interact with other plant cell components, such as minerals, fiber, or proteins during digestion, leading to a loss of these phytochemicals.54 Several studies have found varying results regarding TPC bioaccessibility in plant matrices. Some have reported reduced TPC bioaccessibility, such as Silva et al.55 who observed significant decreases in TPC content in digested leaves and inflorescence of Amaranthus viridis (by 30% and 58%, respectively) and Juániz et al.56 who noted reduced polyphenol bioaccessibility in raw or processed cardoon. Conversely, other studies have reported increased TPC bioaccessibility in plant samples like onions,57 similar to the results for pea dispersions in this study. Given the low initial TPC in pea and whey dispersions, the high TPC found in these digested matrices resulted in unexpectedly high bioaccessibility percentages (Fig. 4D). Cattivelli et al.57 suggested that bioaccessibility exceeding 100% could be due to the presence of gastrointestinal interfering products absent during the extraction with a solvent aqueous solution from undigested samples. This phenomenon is evident in the bioaccessibility percentages of TPC for whey and pea dispersions. Thus, despite the low values, the TPC bioaccessibility of sunflower dispersions appears to be the most reliable among the matrices analyzed in this experiment.
4. Conclusions
The comparative analysis of sunflower proteins versus pea and whey proteins in dispersions simulating sports beverages has revealed several advantages. Sunflower formulations exhibited higher phenolic content, higher pseudoplasticity behaviour and a lower volatile profile compared to pea formulations. These attributes make sunflower proteins an attractive plant-based choice for manufacturers aiming to produce stable, innovative, and health-promoting protein drinks. The in vitro bioaccessibility analysis indicated that sunflower protein dispersions were rich in antioxidant molecules and that their protein intake was comparable to that of pea protein dispersions in terms of bioaccessibility percentage, making sunflower a promising source of both proteins and antioxidants. Incorporation of a xanthan gum concentration of 0.6% into the formulation, which resulted in the highest degree of pseudoplasticity (flow index = 0.202), was shown to be suitable for producing squeezable protein drinks (yield stress = 16.9 Pa), particularly convenient for athletes. The colloidal stability of sunflower protein dispersions, demonstrated by stability index values close to 0 and minimal particle migration velocities (0.05–0.11% d−1), underscored their effectiveness in preserving beverage quality and stability, making them a suitable choice for protein beverages. By leveraging these advantages and emphasizing their distinct colour profile, manufacturers can enhance product appeal, market differentiation, and competitiveness. Future research should explore thermal treatments, ultrasound applications, and enzyme treatments (e.g. phytase or polysaccharide-degrading enzymes like amylase and cellulase for fibre-associated proteins and protein-associated polyphenols) as viable options to increase the bioaccessibility of sunflower proteins.Author contributions
Francesca Girotto: conceptualization, visualization, resources, methodology, data curation, investigation, formal analysis, writing – original draft, and writing – review & editing; Costanza Ceccanti: resources, methodology, validation, data curation, investigation, formal analysis, and writing – review & editing; Federica Narra: resources, methodology, validation, data curation, investigation, formal analysis, and writing – review & editing; Laura Piazza: conceptualization, methodology, funding acquisition, project administration, visualization, resources, formal analysis, and writing – review & editing.Data availability
The data that support the findings of this study are available upon reasonable request from Francesca Girotto, Università degli Studi di Milano (francesca.girotto@unimi.it).Conflicts of interest
The authors declare that they have no known competing financial interests or personal relationships that could have appeared to influence the work reported in this paper.Acknowledgements
This project was funded under the National Recovery and Resilience Plan (NRRP), Mission 4 Component 2 Investment 1.3 - Call for Tender No. 341 of 15 March 2022 of the Italian Ministry of University and Research funded by the European Union – NextGenerationEU; Project code PE00000003, Concession Decree No. 1550 of 11 October 2022 adopted by the Italian Ministry of University and Research, CUP D93C22000890001, Project title “ON Foods - Research and Innovation Network on Food and Nutrition Sustainability, Safety and Security – Working ON Foods”.References
- M. Howard, Global functional beverages market: size, share, emerging trends, market dynamics, and future prospects - a comprehensive market research analysis. Functional Beverages Market Size & Share Analysis - Growth Trends & Forecasts (2024–2029), 2024, Available at: https://www.mordorintelligence.com/industry-reports/functional-beverage-market Search PubMed.
- D. O. Kennedy and E. L. Wightman, Mental performance and sport: Caffeine and co-consumed bioactive ingredients, Sports Med., 2022, 52(Suppl 1), 69–90 CrossRef PubMed.
- G. A. Galaz, An Overview on the history of sports nutrition beverages, in Nutrition and enhanced sports performance, 2019, pp. 231–237 Search PubMed.
- F. Girotto and L. Piazza, Bevande funzionali per sportivi fortificate con proteine vegetali: tendenze, sfide tecnologiche e nutrizionali, Chiriotti Editori, Ingredienti Aliment., 2025, 24(138), 17–21 Search PubMed.
- I. Dini, An overview of functional beverages, in Functional and medicinal beverages, 2019, pp. 1–40 Search PubMed.
- S. Harrington, What Brands are Athletes Eating? The Top-20 of 2020, Available at: https://blog.notemeal.io/what-brands-are-athletes-eating/.
- A. Gupta, N. Sanwal, M. A. Bareen, S. Barua, N. Sharma, O. J. Olatunji and J. K. Sahu, Trends in functional beverages: Functional ingredients, processing technologies, stability, health benefits, and consumer perspective, Food Res. Int., 2023, 113046 CrossRef CAS PubMed.
- C. T. Arbach, I. A. Alves, M. R. Serafini, R. Stephani, Í. T. Perrone and J. de Carvalho da Costa, Recent patent applications in beverages enriched with plant proteins, npj Sci. Food, 2021, 5(1), 28 CrossRef PubMed.
- L. Day, J. A. Cakebread and S. M. Loveday, Food proteins from animals and plants: Differences in the nutritional and functional properties, Trends Food Sci. Technol., 2022, 119, 428–442 CrossRef CAS.
- I. Berrazaga, V. Micard, M. Gueugneau and S. Walrand, The role of the anabolic properties of plant-versus animal-based protein sources in supporting muscle mass maintenance: a critical review, Nutrients, 2019, 11(8), 1825 CrossRef CAS PubMed.
- E. D. N. S. Abeyrathne, K. Nam, X. Huang and D. U. Ahn, Plant-and animal-based antioxidants’ structure, efficacy, mechanisms, and applications: A review, Antioxidants, 2022, 11(5), 1025 CrossRef CAS PubMed.
- F. Girotto, M. Merlino, G. Giovanelli, C. Condurso and L. Piazza, Unveiling the potential of micronized dehulled sunflower press–cake: a breakthrough in sustainable plant–based protein–rich sport beverages, Int. J. Food Sci. Technol., 2024, 59(7), 4784–4796 CrossRef CAS.
- L. Grossmann and D. J. McClements, Current insights into protein solubility: A review of its importance for alternative proteins, Food Hydrocolloids, 2023, 137, 108416 CrossRef CAS.
- J. Chycki, A. Kurylas, A. Maszczyk, A. Golas and A. Zajac, Alkaline water improves exercise-induced metabolic acidosis and enhances anaerobic exercise performance in combat sport athletes, PLoS One, 2018, 13(11), e0205708 CrossRef PubMed.
- K. Rommi, U. Holopainen, S. Pohjola, T. K. Hakala, R. Lantto, K. Poutanen and E. Nordlund, Impact of particle size reduction and carbohydrate-hydrolyzing enzyme treatment on protein recovery from rapeseed (Brassica rapa L.) press cake, Food Bioprocess Technol., 2015, 8, 2392–2399 CrossRef CAS.
- A. A. Zaky, A. S. Hussein, S. Mostafa and A. M. Abd El-Aty, Impact of sunflower meal protein isolate supplementation on pasta quality, Separations, 2022, 9(12), 429 CrossRef CAS.
- AOAC, Official methods of analysis of the association of official analytical chemists international, AOAC International, Rockville, 22nd edn, 2023. Methods: 934.01, 923.03, 920.39, 954.01 Search PubMed.
- J. L. Maubois and D. Lorient, Dairy proteins and soy proteins in infant foods nitrogen-to-protein conversion factors, Dairy Sci. Technol., 2016, 96, 15–25 CrossRef CAS PubMed.
- F. M. Guillin, C. Gaudichon, L. Guérin-Deremaux, C. Lefranc-Millot, G. Airinei and N. Khodorova, et al., Real ileal amino acid digestibility of pea protein compared to casein in healthy humans: a randomized trial, Am. J. Clin. Nutr., 2022, 115(2), 353–363 Search PubMed.
- S. A. Slabi, C. Mathe, M. Basselin, X. Framboisier, M. Ndiaye, O. Galet and R. Kapel, Multi-objective optimization of solid/liquid extraction of total sunflower proteins from cold press meal, Food Chem., 2020, 317, 126423 Search PubMed.
- V. Dewanto, X. Wu, K. K. Adom and R. H. Liu, Thermal processing enhances the nutritional value of tomatoes by increasing total antioxidant activity, J. Agric. Food Chem., 2002, 50, 3010–3014 Search PubMed.
- V. Agulló, C. García-Viguera and R. Domínguez-Perles, The use of alternative sweeteners (sucralose and stevia) in healthy soft-drink beverages, enhances the bioavailability of polyphenols relative to the classical caloric sucrose, Food Chem., 2022, 370, 131051 CrossRef PubMed.
- M. P. Ostrowski, S. L. La Rosa, B. J. Kunath, A. Robertson, G. Pereira, L. H. Hagen and E. C. Martens, Mechanistic insights into consumption of the food additive xanthan gum by the human gut microbiota, Nat. Microbiol., 2022, 7(4), 556–569 CrossRef CAS PubMed.
- V. V. Matabura and L. M. Rweyemamu, Effects of xanthan gum on rheological properties of Aloe vera-Moringa leaf juice blends, Tanz. J. Sci., 2021, 47(2), 583–596 CrossRef.
- R. Sardão, R. A. Amaral, E. M. Alexandre, J. A. Saraiva and M. Pintado, Effect of high-pressure processing to improve the safety and quality of an Quercus acorn beverage, LWT–Food Sci. Technol., 2021, 149, 111858 CrossRef.
- J. Iskakova, J. Smanalieva and F. J. Methner, Investigation of changes in rheological properties during processing of fermented cereal beverages, J. Food Sci. Technol., 2019, 56, 3980–3987 CrossRef CAS PubMed.
- J. J. X. Ong, C. M. Steele and L. M. Duizer, Challenges to assumptions regarding oral shear rate during oral processing and swallowing based on sensory testing with thickened liquids, Food Hydrocolloids, 2018, 84, 173–180 CrossRef CAS PubMed.
- A. Jokar and M. H. Azizi, Formulation and production of persimmon milk drink and evaluation of its physicochemical, rheological, and sensorial properties, Food Sci. Nutr., 2022, 10(4), 1126–1134 CrossRef CAS PubMed.
- M. Ramezani, G. Ferrentino, K. Morozova and M. Scampicchio, Multiple Light Scattering Measurements for Online Monitoring of Milk Fermentation, Foods, 2021, 10(7), 1582 CrossRef CAS PubMed.
- I. Polowczyk, A. Bastrzyk, T. Koźlecki and Z. Sadowski, Stability of three-phase water-particle-oil systems, Chem. Eng. Technol., 2015, 38, 715–720 CrossRef CAS.
- C. S. Wu, J. H. Guo and M. J. Lin, Stability evaluation of pH-adjusted goat milk for developing Ricotta cheese with a mixture of cow cheese whey and goat milk, Foods, 2020, 9(3), 366 CrossRef CAS PubMed.
- A. Brodkorb, L. Egger, M. Alminger, P. Alvito, R. Assunção and S. Ballance, et al., INFOGEST static in vitro simulation of gastrointestinal food digestion, Nat. Protoc., 2019, 14(4), 991–1014 CrossRef CAS PubMed.
- M. N. Parker, K. Lopetcharat and M. A. Drake, Consumer acceptance of natural sweeteners in protein beverages, J. Dairy Sci., 2018, 101(10), 8875–8889 CrossRef CAS PubMed.
- T. Sawicki, M. Jabłońska, A. Danielewicz and K. E. Przybyłowicz, Phenolic Compounds Profile and Antioxidant Capacity of Plant-Based Protein Supplements, Molecules, 2024, 29(9), 2101 CrossRef CAS PubMed.
- H. Thongzai, N. Matan, P. Ganesan and T. Aewsiri, Interfacial properties and antioxidant activity of whey protein-phenolic complexes: Effect of phenolic type and concentration, Appl. Sci., 2022, 12(6), 2916 CrossRef CAS.
- G. M. Weisz, D. R. Kammerer and R. Carle, Identification and quantification of phenolic compounds from sunflower (Helianthus annuus L.) kernels and shells by HPLC-DAD/ESI-MSn, Food Chem., 2009, 115(2), 758–765 CrossRef CAS.
- M. Finkler, D. Lichtenberg and I. Pinchuk, The relationship between oxidative stress and exercise, J. Basic Clin. Physiol. Pharmacol., 2014, 25(1), 1–11 CrossRef CAS PubMed.
- S. R. Wildermuth, E. E. Young and L. M. Were, Chlorogenic acid oxidation and its reaction with sunflower proteins to form green–colored complexes, Compr. Rev. Food Sci. Food Saf., 2016, 15(5), 829–843 CrossRef CAS PubMed.
- I. Vermeir and G. Roose, Visual design cues impacting food choice: A review and future research agenda, Foods, 2020, 9(10), 1495 CrossRef PubMed.
- I. Tijssen, E. H. Zandstra, C. de Graaf and G. Jager, Why a ‘light'product package should not be light blue: Effects of package colour on perceived healthiness and attractiveness of sugar-and fat-reduced products, Food Qual. Prefer., 2017, 59, 46–58 CrossRef.
- E. R. Filho, A. A. Prestes, M. H. Canella, E. S. Prudencio, M. Q. Freitas, T. C. Pimentel and A. G. da Cruz, Sensory Attributes of Liquid Milk Products, in Sensory Profiling of Dairy Products, 2023, pp. 81–102 Search PubMed.
- N. J. Gonzalez, K. Adhikari and M. F. Sancho-Madriz, Sensory characteristics of peach-flavored yogurt drinks containing prebiotics and synbiotics, LWT–Food Sci. Technol., 2011, 44(1), 158–163 CrossRef CAS.
- P. Rai, G. C. Majumdar, S. DasGupta and S. De, Prediction of the viscosity of clarified fruit juice using artificial neural network: a combined effect of concentration and temperature, J. Food Eng., 2005, 68(4), 527–533 CrossRef.
- T. Dapčević, P. Dokić, M. Hadnađev and M. Pojić, Determining the yield stress of food products-importance and shortcomings, Food Feed Res., 2008, 35(3), 143–150 Search PubMed.
- M. Klost, C. Brzeski and S. Drusch, Effect of protein aggregation on rheological properties of pea protein gels, Food Hydrocolloids, 2020, 108, 106036 CrossRef CAS.
- R. Kaur and G. Ghoshal, Sunflower protein isolates-composition, extraction and functional properties, Adv. Colloid Interface Sci., 2022, 306, 102725 CrossRef CAS PubMed.
- D. R. Dash, S. K. Singh and P. Singha, Recent advances on the impact of novel non-thermal technologies on structure and functionality of plant proteins: A comprehensive review, Crit. Rev. Food Sci. Nutr., 2024, 64(10), 3151–3166 CrossRef CAS PubMed.
- M. Wu, Y. Cao, S. Lei, Y. Liu, J. Wang, J. Hu and H. Yu, Protein structure and sulfhydryl group changes affected by protein gel properties: Process of thermal-induced gel formation of myofibrillar protein, Int. J. Food Prop., 2019, 22(1), 1834–1847 CrossRef CAS.
- M. I. Molina, S. Petruccelli and M. C. Añón, Effect of pH and ionic strength modifications on thermal denaturation of the 11S globulin of sunflower (Helianthus annuus), J. Agric. Food Chem., 2004, 52(19), 6023–6029 CrossRef CAS PubMed.
- B. Xia, Y. Shen, R. Zhao, J. Deng and C. Wang, Interactions with soy lecithin regulate the emulsification capacity of pea protein: Effects of soy lecithin concentration, Food Hydrocolloids, 2024, 110168 CrossRef CAS.
- T. Patra, Å. Rinnan and K. Olsen, The physical stability of plant-based drinks and the analysis methods thereof, Food Hydrocolloids, 2021, 118, 106770 CrossRef CAS.
- J. Auer, M. Alminger, M. Marinea, M. Johansson, G. Zamaratskaia, A. Högberg and M. Langton, Assessing the digestibility and estimated bioavailability/bioaccessibility of plant-based proteins and minerals from soy, pea, and faba bean ingredients, LWT–Food Sci. Technol., 2024, 115893 CrossRef CAS.
- S. Rousseau, C. Kyomugasho, M. Celus, M. E. Hendrickx and T. Grauwet, Barriers impairing mineral bioaccessibility and bioavailability in plant-based foods and the perspectives for food processing, Crit. Rev. Food Sci. Nutr., 2020, 60(5), 826–843 CrossRef CAS PubMed.
- S. M. Bessada, J. C. Barreira and M. B. P. Oliveira, Pulses and food security: Dietary protein, digestibility, bioactive and functional properties, Trends Food Sci. Technol., 2019, 93, 53–68 CrossRef CAS.
- A. D. Silva, S. Ávila, R. T. Küster, M. P. Dos Santos, M. T. Grassi, C. de Queiroz Pereira Pinto and S. M. R. Ferreira, In vitro bioaccessibility of proteins, phenolics, flavonoids and antioxidant activity of Amaranthus viridis, Plant Foods Hum. Nutr., 2021, 76, 478–486 CrossRef CAS PubMed.
- I. Juániz, I. A. Ludwig, L. Bresciani, M. Dall'Asta, P. Mena and D. Del Rio, et al., Bioaccessibility of (poly)phenolic compounds of raw and cooked cardoon (Cynara cardunculus L.) after simulated gastrointestinal digestion and fermentation by human colonic microbiota, J. Funct. Foods, 2017, 32, 195–207 CrossRef.
- A. Cattivelli, A. Conte, S. Martini and D. Tagliazucchi, Influence of cooking methods on onion phenolic compounds bioaccessibility, Foods, 2021, 10(5), 1023 CrossRef CAS PubMed.
Footnote |
| † Electronic supplementary information (ESI) available. See DOI: https://doi.org/10.1039/d4fo04530k |
| This journal is © The Royal Society of Chemistry 2025 |