
 Open Access Article
 This Open Access Article is licensed under a
 Creative Commons Attribution 3.0 Unported Licence
The dark side of metal exsolution: a combined in situ surface spectroscopic and electrochemical study on perovskite-type cathodes for high-temperature CO2 electrolysis†
Christian
Melcher
 *a,
Andreas
Nenning
a,
Florian
Schrenk
b,
Kirsten
Rath
a,
Christoph
Rameshan
b and
Alexander Karl
Opitz
a
*a,
Andreas
Nenning
a,
Florian
Schrenk
b,
Kirsten
Rath
a,
Christoph
Rameshan
b and
Alexander Karl
Opitz
a
aTU Wien, Institute of Chemical Technologies and Analytics, Getreidemarkt 9/164-EC, 1060 Vienna, Austria. E-mail: chrisitan.melcher@tuwien.ac.at
bMontanuniversität Leoben, Chair of Physical Chemistry, Franz-Josef-Strasse 18, 8700 Leoben, Austria
First published on 11th March 2025
Abstract
In solid oxide CO2 electrolysis cells, moderate activity and coking of the cathode are major issues that hinder commercialization of this important technology. It has been already shown that cathodes based on a mixed conducting oxide decorated with well-dispersed metal nanoparticles, which were grown via an exsolution process, are highly resilient to carbon deposition. Using perovskite-type oxides that contain reducible transition metals, such nanoparticles can be obtained in situ under sufficiently reducing conditions. However, the direct catalytic effect of exsolved metal nanoparticles on the CO2 splitting reaction has not yet been explored thoroughly (e.g. by employing well-defined model systems), thus, an in-depth understanding is still lacking. In this study, we aim at providing a crucial piece of insight into high-temperature electrochemical CO2 splitting on exsolution-decorated electrodes: we present the results of combined Near Ambient Pressure X-ray Photoelectron Spectroscopy (NAP-XPS) and electrochemical measurements on three different ferrite perovskites, which were employed as thin film model electrodes. The investigated materials are: La0.6Ca0.4FeO3−δ (LCF), Nd0.6Ca0.4FeO3−δ (NCF), and Pr0.6Ca0.4FeO3−δ (PCF). The results obtained allow us to directly link the electrode's CO2 splitting activity to their surface chemistry. Especially, the electro-catalytic activity of the materials decorated with and without metallic iron nanoparticles was in focus. Our experiments reveal that in contrast to their beneficial role in H2O electrolysis, exsolved Fe0 metal particles deteriorate CO2 electrolysis activity. This behavior contrasts with expectations derived from earlier reports on porous samples, and is likely a consequence of the differences between the CO2 splitting and H2O splitting mechanism.
Broader contextThe interplay between catalysis, materials science, and energy conversion is critical in addressing pressing global challenges such as climate change and carbon neutrality. High-temperature CO2 electrolysis is a promising approach to closing the carbon loop by converting CO2 into valuable chemical feedstocks or fuels. However, the role of surface chemistry and structural evolution in determining the performance and stability of catalytic materials remains poorly understood. In our work, we uncover the “dark side” of metal exsolution, which is known for enhancing catalytic activity for some reactions, by demonstrating its deactivating effects on CO2 splitting performance on perovskite-type oxides. Using well defined model-electrode systems, we show that CO2 splitting is fundamentally different from H2O splitting, as it relies on surface oxide reactions rather than metal-catalyzed recombination. Our findings emphasize the importance of tailored material design, particularly in controlling surface defect chemistry and lattice composition, to optimize catalytic performance for CO2 electrolysis. This study not only challenges conventional views on metal exsolution but also provides insights for developing advanced, coking-resistant materials for CO2 utilization. By addressing the mechanistic distinctions of CO2 and H2O splitting, we contribute to the development of efficient catalytic systems for sustainable energy applications. |
Introduction
With the rising demand for energy and concerns over greenhouse gas emissions, carbon neutral energy storage systems combined with renewable energy sources are crucial. Carbon conversion and utilization (CCU) present an innovative solution, utilizing renewable energy to transform CO2 into chemical energy carriers like syngas or methane. One notable candidate for CO2 conversion is direct electrochemical CO2 splitting via solid oxide electrolysis cells (SOECs) because they allow for operating temperatures up to about 900 °C, which is beneficial for breaking the bonds of this rather stable molecule and makes graphite formation thermodynamically less favorable. The faradaic efficiency for these cells is nearly 100% and the energy efficiency increases with higher temperatures.1–3Well-established cathode materials for SOECs include Ni-YSZ cermets.1,4,5 However, these cathodes suffer from long-term degradation issues, including impurity poisoning, detrimental microstructure evolution,6,7 and a relatively high susceptibility towards carbon deposition, commonly referred to as coking.8,9 An alternative approach relies on using Ni-GDC (GDC = Gd2O3 doped CeO2) or pure oxides as cathode materials. In both cases, the tendency towards coking can be decreased drastically.10,11 However, especially for the latter, it is crucial that the material functions as a Mixed Ionic and Electronic Conductor (MIEC), since both the oxide ions as well as the electrons must be transported from/to the reaction site of CO2 reduction at the surface of the cathode material. This can be straightforwardly recognized by the respective cathodic half-cell reaction (which is given in eqn (1) in Kröger–Vink notation).
 | (1) |
Numerous studies have demonstrated that metallic phases on the surface of an oxide, such as exsolved nanoparticles, indeed enhance the rate of certain reactions. Examples include the reverse water–gas shift reaction (rWGS),34 methane dry reforming (MDR),20 or electrochemical water splitting.31,35,36 Crucial for all these reactions is to obtain an improved mechanistic understanding for the enhancement of reaction rates by exsolution particles, which in these cases always involves either enhanced adsorption or recombination rates of hydrogen species on the metallic particle surfaces. For instance, the proposed mechanism for water splitting and the reason for the beneficial effect of metallic particles on the reaction rate involves a spillover mechanism.36 The adsorbed hydrogen on the host oxide has a high surface mobility and can easily diffuse towards the metallic surfaces where recombination into H2 molecules is more favored than on an oxide surface.
In the case of CO2 electrolysis, however, it is highly questionable whether carbonate reaction intermediates offer fast enough surface diffusion rates to enable a similar spillover mechanism. Additionally, CO2 splitting does not require recombination of intermediates to produce CO. Moreover, there is a general lack of well-defined model studies on the effect of exsolution on electrochemical CO2 splitting. Studies claiming that exsolutions enhance CO2 splitting kinetics were typically performed on porous electrodes, on which also variations of morphology, ionic conductivity or oxide surface composition may be responsible for the observed performance differences. On the contrary, an in situ NAP-XPS study on well-defined model samples for direct CO2 electrolysis11 found no significant effect of metallic nanoparticles exsolved from perovskite-type ferrites and chromites on the CO2 splitting rate. Thus, the beneficial effect of metal exsolution for CO2 splitting remains questionable and is thus the main motivation behind this study.
From the viewpoint of solid state electrochemistry, the material La0.6Sr0.4FeO3−δ (LSF) serves as an ideal model electrode for exsolution studies, as its defect chemistry has been extensively studied and is thus well understood.31,37,38 Moreover, metallic iron particles can be exsolved from LSF by applying sufficiently strong cathodic bias.35,36,39 In the present work, we explore similar materials using the more abundant Ca as an A-site dopant instead of Sr, analyzing their electro-catalytic performance for direct electrochemical CO2 splitting. The materials under investigation are La0.6Ca0.4FeO3−δ (LCF), Nd0.6Ca0.4FeO3−δ (NCF), and Pr0.6Ca0.4FeO3−δ (PCF). The reason for substituting La with Nd and Pr (LCF → NCF, PCF) lies in the potential valence transitions (Pr3+ ⇌ Pr4+, Nd3+ ⇌ Nd2+) and the differences in ionic radii. Especially the latter might lead to differences in exsolution behavior and stability upon reduction.
As we operate under reducing conditions (pO2 ≈ 10−21 bar) the oxygen vacancy concentration is primarily determined by the extrinsic Ca dopant concentration. Corresponding Brouwer diagrams exist for very similar materials like LSF.40 According to these, the vacancy concentration is given by  with the same dopant concentration for all three materials (40% Ca on the A-site). Upon biasing the electrodes, we change the electron concentration in our materials in the range of 0 to 10% Fe2+.40,41 Therefore, the oxygen vacancy concentration ranges from 0.2 to 0.25 per formula unit.
The objective of this paper is therefore to investigate whether exsolved Fe-nanoparticles indeed enhance the reaction rate of high temperature CO2 electrolysis. To answer this question conclusively, the experimental setting was highly optimized and the experimental boundary conditions were tailored even better to this goal:
(i) Rather than using pure CO2 (which was needed for determination of CO2 conversion rates in ref. 11), we went for a CO![[thin space (1/6-em)]](https://www.rsc.org/images/entities/char_2009.gif) :CO2 mixture of 1:10 to obtain a thermodynamically well-defined p(O2) for all our measurements leading to a well-defined reference point for the overpotential.
:CO2 mixture of 1:10 to obtain a thermodynamically well-defined p(O2) for all our measurements leading to a well-defined reference point for the overpotential.
(ii) Materials wise, we focused purely on Ca-doped ferrites (i.e. all studied perovskite-type materials have only Fe on the B-site) with the A-site being either La, Nd or Pr (LCF, NCF or PCF). Such a focused approach is crucial to gain better mechanistic understanding of the interplay between A-site composition, Fe-exsolution and the CO2 splitting reaction rates. This is achieved by utilizing a lab-based Near Ambient Pressure X-Ray Spectrometer (NAP-XPS) in tandem with Electrochemical Impedance Spectroscopy (EIS) and Direct Current (DC) measurements. Through this technique, the electrochemical performance and the surface composition can be studied simultaneously.
(iii) Especially, we compare the reaction rates before and after Fe-exsolution under otherwise identical conditions (same overpotential, same p(O2), same temperature, same surface area, same sample) in one experiment.
(iv) In order to rule out as many additional contributions to the surface activity as possible, geometrically well-defined dense model electrodes were fabricated using Pulsed Laser Deposition (PLD) and photolithography. This ensures that the model electrodes have a well-defined surface area, enabling comparisons across different materials and linking electrochemical activity directly to the surface chemistry.
Experimental methods
Sample preparation
A schematic of a typical model cell used in our NAP-XPS experiments is depicted in Fig. 1. The porous Counter Electrode (CE) was applied to the unpolished side of an (100)-oriented YSZ single crystal (9.5 mol% Y2O3 in ZrO2, CrysTec GmbH, Germany) by spin-coating (1000 rpm) a GDC10 paste (GDC10 = Ce0.9Gd0.1O1.95). The paste consisted of GDC10 powder (Treibacher Industrie AG, Austria), which was dispersed in a terpineol-based ink vehicle (FuelCellMaterials, USA) by ball milling in a 1:1 weight ratio. On top of the dried GDC10 paste layer, a Pt paste (Tanaka, Japan) was brushed as the electronic current collector. The CE was sintered at 1150 °C in air for 3 h to yield a porous structure. For more details on the fabrication of this type of electrode please refer to ref. 42. This type of CE was chosen since it showed exceptional surface activity.42
 | ||
| Fig. 1 (a) Schematic drawing of the model cell. (b) Schematic drawing of the NAP-XPS/EIS sample environment. (c) Schematic of the experimental strategy for the comparison of the surface activity with and without exsolution. The potential U vs. CE is decreased stepwise (more negative) over time from left to right until exsolution is observed in the NAP-XPS spectra at Uexsolution,obs. This voltage is typically more negative than the thermodynamic equilibrium Uth(Fe/FeO) because of exsolution overpotentials (ηexolution,obs = Uexsolution,obs − Uth(Fe/FeO)). When the voltage is retraced back to less cathodic values, Fe remains metallic on the surface until Uth(Fe/FeO) is reached. This way, rreact at a certain set voltage can be compared with, and without exsolution. | ||
Before the actual working electrode (WE) was deposited, a 15|5 μm (mesh|strip width) Ti/Pt current collector (thickness of 5 nm Ti below 100 nm Pt) was prepared on the polished side of the YSZ single crystal electrolyte by magnetron sputtering (BalTec MED 020, Leica Microsystem GmbH, Germany) and photolithography. For a more detailed description of the photolithography process, please refer to ref. 39. Subsequently, an about 100 nm thin layer of the desired perovskite-type material (LCF, NCF or PCF) was grown by PLD atop the current collector at a pO2 of 4.0 × 10⁻² mbar, using a KrF excimer laser (1800 pulses, 5 Hz, λ = 248 nm, COMPex Pro 201, Lambda Physics).43 This laser was employed to ablate the perovskite-type target (LCF, NCF, or PCF) that had been prepared via a modified Pechini method using citric acid as complexing agent,44 followed by isostatic pressing of the obtained powder and sintering in air at 1150 °C for 12 h. During thin film deposition, the temperature of the YSZ substrate was set to 600 °C (achieved by resistive heating and temperature control using a pyrometer).
In situ NAP-XPS and electrochemical measurements
For the simultaneous investigation of surface activity and composition, electrochemical impedance spectroscopy (EIS) and direct current (DC) measurements were carried out in a NAP-XPS setup, which is sketched in Fig. 1b. In this setup, both working and counter electrodes (WE and CE) are present in one chamber without gas separation. The introduced gas consisted of a CO2:CO mixture of 10:1. We therefore work with a thermodynamically equilibrated gas phase, which does not change in composition with higher temperatures. Note that the exact same amount of produced CO (from CO2 splitting at the WE) is oxidized at the CE. Therefore, the net reaction rate of the entire cell is zero and the catalytic activity cannot be derived via gas analysis. However, caused by our geometry (thin-film WE and porous CE) the reaction rate of CO2 electrolysis at the WE is rate determining. Hence, the measured current upon polarization is characteristic for the electrochemical performance of the WE. Note that for thin-films, the transport of oxide ions within the electrode material does not limit the current.45 Therefore, the DC current measured at a certain overpotential is directly proportional to the CO2 splitting reaction rate according to Faraday's law and the catalytic activity of our electrodes can be compared by evaluating the current–voltage characteristics (I–V curves).
The spectrometer utilized was a lab-based configuration equipped with a monochromatic Al-Kα X-ray source (μFOCUS 500 NAP, SPECS, Germany). In this setup, the hemispherical analyzer (PHOIBOS 150, SPECS, Germany) is positioned behind differentially pumped electrostatic lenses. To minimize gas phase scattering, the sample surface was positioned very close to the water-cooled nozzle, approximately 500 μm away. For a more detailed explanation of the NAP-XPS setup, please refer to ref. 46.
The sample holder, specifically designed for such experiments by Huber Scientific, consists primarily of corundum (Al2O3). The sample was fastened using four Pt pins, which were pressed against the corners of the sample through a screwing mechanism. While these pins provided electrical contact to the WE, the CE was separately connected using a Pt wire. An aperture on the backside of the sample holder permits an IR laser beam to irradiate and thus heat up the sample. The resulting temperature was monitored using a pyrometer. For an accurate temperature control, the emissivity of each individual sample was calibrated using EIS measurements as follows: the temperature dependence of the ionic conductivity of YSZ is well known.47 Since the geometry of the YSZ single crystal is known as well, the ohmic resistance of the sample (RYSZ ≈ x-axis intercept in the Nyquist-plot) can be used to calculate the sample's temperature. This works best at relatively low temperatures (300 °C to 500 °C), since contributions of wiring and contact resistances to the total ohmic resistance can be neglected. At these lower temperatures the emissivity used by the pyrometer was adjusted to match the calculated temperature from EIS measurements. When going to higher temperatures (600 °C to 800 °C), the now calibrated pyrometer was then used for temperature control. The laser's power output was regulated through pulse width modulation according to ref. 46.
As a cleaning routine, all samples were initially heated up to 600 °C in 1 mbar O2 (99.999% purity, Messer, Germany) for one hour inside the NAP-XPS chamber to remove carbon contaminants before the start of the CO2 splitting experiment. For the subsequent NAP-XPS experiments, a total gas pressure of 1 mbar was established with a CO:CO2 ratio of 1:10 (CO2: 99.9995% purity, Messer, Germany; CO: 99.994% purity, Air Liquide, France) ensuring a constant and well-defined effective pO2 in the gas phase for each temperature, which determines the oxygen non-stoichiometry of our oxide materials.
Electrochemical measurements were facilitated inside the NAP-XPS chamber by feedthrough connections via a CF 63 flange designed for BNC connectors. For DC and EIS measurements, a Source Meter Unit (SMU, 2410 SourceMeter, Keithley Instruments, United States) and an impedance analyzer (Alpha-20 A High Performance Frequency Analyzer, Novocontrol Technologies GmbH & Co. KG, Germany) were employed, respectively. For electrochemical impedance spectroscopy (EIS), an AC voltage of 10 mV (root mean square) was applied in addition to the constant DC bias. For all experiments, the WE was connected to the mass of the XPS analyzer, and electrochemical polarization in potentiostatic mode was achieved by applying the inverse polarization to the CE. For I–V curve measurements, time-resolved potentiostatic DC measurements were conducted using the SMU.
For recording current–voltage characteristics (I–V curves), a bias voltage was applied to the model cell, which leads to cathodic polarization of the WE. This cathodic polarization was increased stepwise up to the point where Fe-exsolution was clearly visible in the Fe 2p region of the NAP-XPS spectra (roughly −275 mV, depending on the studied material). Subsequently, the cathodic polarization was decreased (i.e. to more positive overpotentials) to correlate the amount of metallic Fe on the surface of the electrodes to the current density. A schematic diagram of the applied voltage over the course of an experiment is shown in Fig. 1c. Time-resolved IDC values were recorded after the bias was increased to distinguish capacitive current from faradaic current. After the IDC values reached a steady state, EIS measurements were performed under the given bias.
As both electrodes were located in the same atmosphere, the oxygen activity in the WE a(O2,WE) could be calculated according to Nernst's equation given by eqn (2), where η and Uvs.CE correspond to the overpotential dropping at the WE and the applied voltage Uvs.CE with respect to the CE, respectively. R, T and F have their usual meanings.
 | (2) |
In principle, the overpotential η differs from the applied bias because the electrolyte, the CE, the wiring as well as the contact resistances contribute to the overall voltage drop (η = Uvs.CE − IDC(RYSZ + RCE + Rwire + Rcontact)). However, considering the high resistances of our thin-film electrodes, especially at the low gas pressure of 1 mbar, the former mentioned contributions can safely be neglected (i.e. η ≈ Uvs.CE holds in good approximation). The effective overpotential dropping at the WE is therefore close to the applied voltage with deviations of at most 4% (worst case at maximal applied overpotential and maximal current at 800 °C).
Surface cation compositions
For comparing the different materials, it is important to ensure phase purity of the PLD targets. Furthermore, the materials should be similar in their surface cation composition. The former was verified using powder XRD measurements, as presented in Fig. S1 in the ESI.† The cation compositions were calculated from the XPS data using eqn (3), where Xj, cj, Ij, and IBG represent the molar fraction, the concentration and the signal intensity of species j, and the intensity of the background, respectively. To enhance visualization, intensities were normalized to the total intensities of the measured cations. The terms RSFpwdr, TF, and Ekin correspond to experimentally determined relative sensitivity factors by Brundle et al.,48 the transmission function (which was assumed to be constant in our case), and the kinetic energy, respectively. Measured RSFpwdr(48) values for La 3d, Nd 3d, Ca 2p, and Fe 2p transitions are summarized in Table S2 in the ESI.† | (3) |
Results
CO2 electrolysis on bare electrodes without exsolutions
The following subchapters represent results of the thin-film working electrode (WE) from measurements inside the NAP-XPS chamber. Both XPS and electrochemical data were acquired simultaneously at high temperatures. Phase purity of the PLD targets was determined by analyzing powder XRD diffraction patterns (Fig. S1 in the ESI†). The patterns show the typical reflexes of orthorhombic distorted perovskites indicating successful synthesis and phase purity of the materials.18,49–51:CO2 atmosphere with a 1:10 ratio. The electrode features in the Nyquist plot show almost ideal semi-circles, which exhibit polarization resistances between 150 Ω and 1800 Ω, depending on the material and overpotential, and capacitances in the order of 10−4–10−3 F.
 | ||
| Fig. 2 Results from electrochemical measurements taken inside the NAP-XPS chamber in a 1 mbar CO:CO2 atmosphere of a 1:10 ratio. (a) Exemplary Nyquist-plots of EIS measurements (markers) at 800 °C plus complex non-linear least squares fitting functions (lines) at OCV and under cathodic η of −200 mV. (b) Arrhenius-plot of inverse ASR values resulting from EIS measurements using the same legend as in (a). (c) Exemplary Cchem values and Fe2+ bulk fractions calculated from EIS results and at 700 °C. | ||
For the evaluation of the area specific resistance (ASR) and the chemical capacitance (Cchem) values, a complex non-linear least squares fitting function is calculated using a RYSZ–Rode‖CPE equivalent circuit, which allows extracting the electrode polarization resistance Rode (the diameter of the semicircle in the Nyquist-plot) and the capacitance C from the low frequency feature. For the ASR, Rode is normalized to the geometric surface area (roughly 0.2 cm2).
The temperature dependence of the electrode activity is displayed in an Arrhenius plot (Fig. 2b) where the reciprocal values of the area specific resistances of Rode (ASR−1) are plotted against 1000/T (again solid markers indicate measurements at OCV, hollow markers represent values under cathodic η of −200 mV vs. CE). The activation energies Ea, which can be calculated from the slopes of linear fits of the data points in Fig. 2b (solid lines), range between 0.56 ± 0.03 eV and 0.81 ± 0.05 eV (uncertainties represent two times the standard deviation derived from the uncertainties in the slopes of the least-squares fit in the Arrhenius plot, corresponding roughly to a 95% confidence interval). These values remain largely unaffected when a cathodic overpotential is applied, however, the ASR significantly decreases under bias causing a parallel shift in the Arrhenius plots. This behavior is expected and aligns with the understanding that perovskite-type mixed conducting electrodes in reducing atmospheres typically exhibit non-linear I–V curves, which was already observed for LSF electrodes in ref. 11 and 37.
The capacitance associated with the low-frequency feature of the impedance spectra, captured in the fit as a constant phase element (CPE), represents the largest capacitance in the system. Based on our defect chemical understanding of closely related perovskites such as LSF38 it can be safely assumed that this capacitance corresponds to the chemical capacitance Cchem of the perovskite-type working electrodes rather than to other typically electrostatic capacitive contributions (e.g. originating from interfaces).
As Cchem depends on the minority charge carrier concentration38 and thus scales with the film thickness, the capacitances (in the order of 10−4–10−3 F) are normalized to the volume of the film (roughly 2 × 10⁻⁶ cm2), which leads to values in the order of 102–103 F cm−3 at 700 °C (see Fig. 2c). The film thickness was determined using SEM cross sections (see Fig. S11–S13 in the ESI†) and vary between 240 and 360 nm. Error bars in Fig. 2c depict the uncertainties of the Cchem values which are propagated by two times the standard deviation from SEM cross section thicknesses (roughly 10%). Uncertainties coming from impedance fitting are neglected, as they are found to be much smaller than the scatter in film thicknesses (roughly 0.2%).
As an RYSZ–Rode‖CPE circuit was used for impedance fitting, with the CPE element covering the slight deviations from an ideal semicircle,52 a real capacitance can be calculated in good approximation from the CPE-element fit parameters and the electrode resistance according to ref. 53. The obtained Cchem is directly proportional to the minority charge carrier concentration of the WE bulk material.54,55 Furthermore, the defect chemistry of the given ferrite-based perovskites in reducing atmospheres is governed by a high number of oxygen vacancies, and a comparatively small concentration of electronic point defects, which are expected to be localized to the B-site cations of the perovskite, thus appearing as Fe2+ ions.41 Under these conditions, and assuming that defect interactions play a minor role, the Fe2+ bulk concentration [Fe2+] can be calculated according to eqn (4).38 Here, Vm and Vfilm represent the molar volume and the volume of the PLD layer, respectively, while R, T and F retain their usual meanings.
 | (4) |
:CO2 = 1:10, −200 mV vs. CE) conditions. The normalized surface cation compositions are calculated according to eqn (3) in the Experimental section and are depicted in Fig. 3b (for exemplary Fe 2p spectra please see Fig. 6a in the following section). The bar on the right labeled ‘ref’ indicates the nominal cation fraction of the synthesized bulk materials  providing a visual benchmark. The results indicate that all three materials show a lower B-site and a higher A-site cation fraction at their surface than the nominal bulk material. As an additional check, and in order to estimate reproducibility and uncertainty, the corrected Fe/(Fe + O) fractions (see eqn (3)) are calculated for different samples of the same material (denoted s1, s2, s3, s4) at 600 °C under oxidizing conditions (see Fig. 3c). Error bars (which are overlapping) indicate two times the standard deviation, which roughly corresponds to a confidence level of 95%.
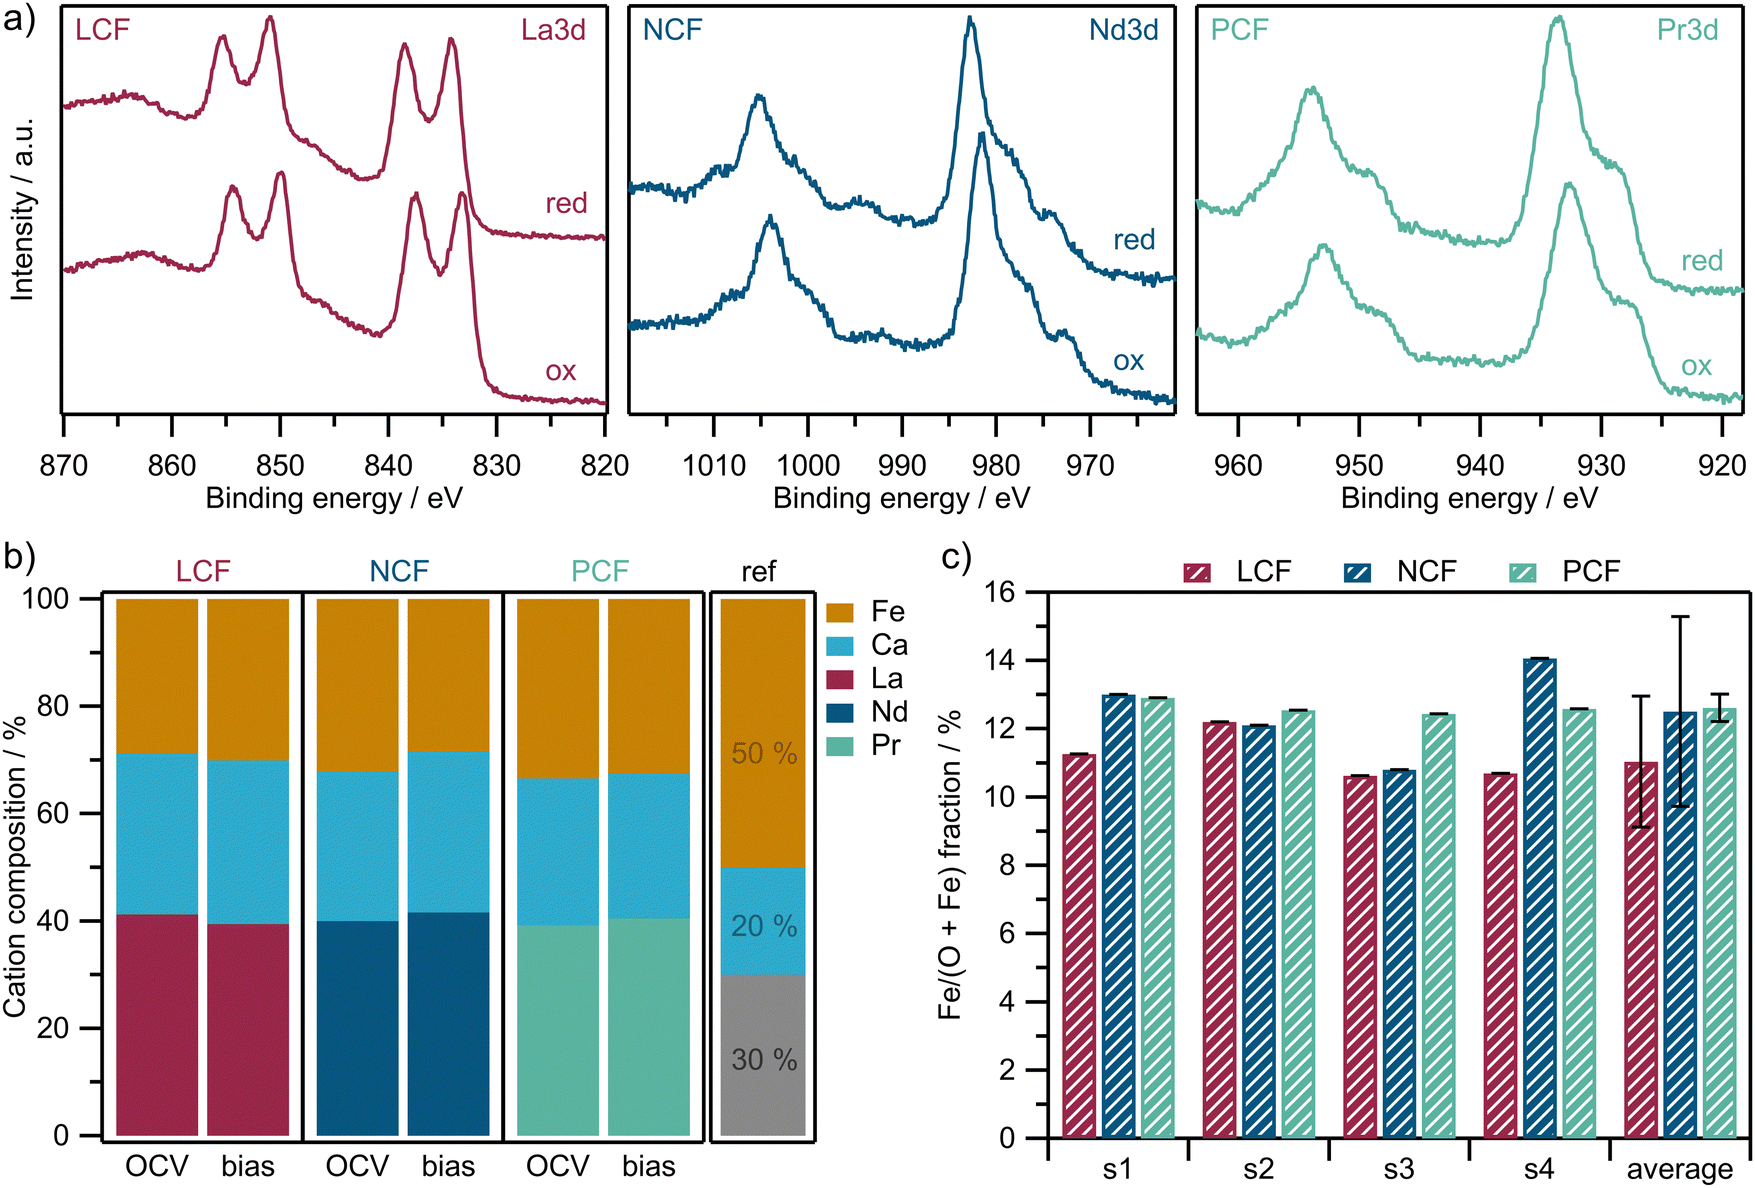 | ||
| Fig. 3 (a) Exemplary NAP-XPS spectra of the A-site cations under oxidizing (1 mbar O2, OCV) and reducing (1 mbar CO:CO2 = 1:10, −200 mV) conditions. (b) Normalized surface cation composition at 700 °C from in situ NAP-XPS measurements under OCV and −200 mV (bias). The bar labeled ‘ref’ indicates the nominal values of the bulk materials as a guide to the eye. (c) RSF and Ekin corrected Fe/(O + Fe) fractions of different samples (s1, s2, s3, s4) under oxidizing conditions at 600 °C. The error bars indicate two times the standard deviation between the four different samples of the same material. | ||
In order to comprehensively assess the surface chemistry of the electrodes under in situ conditions, it is not only important to spectroscopically analyze the constituents of the electrode materials, but also those of potential adsorbates. From literature it is known that carbonate-type intermediates form on the electrode surface during CO2 electrolysis on ceria-based9,56 and perovskite-type electrodes.11 Therefore, the observation of these intermediates under conditions without Fe metal exsolution is a first important step.
NAP-XPS spectra of the C 1s and O 1s regions for LCF under an overpotential of −200 mV vs. CE across varying temperatures are presented in Fig. 4a. For better comparability, the spectra in the C 1s region are normalized to the baseline of each individual C 1s spectrum. Three main peaks are evident: a CO2 gas phase peak at 292.8 eV,11,57 a peak related to a carbonate adsorbate at 289.5 eV,11,57,58 and – for the lowest temperature – an asymmetric peak at 283.8 eV corresponding to graphite-like carbon.11,57,59–61 The O 1s spectra in Fig. 4a display a pronounced asymmetric peak at 528.8 eV, stemming from lattice oxygen species and in part from surface oxygen species.57,62,63 This peak is modeled using two components: Olattice and Oasym. Additionally, a signal at 531.4 eV emerges, corresponding to an adsorbed carbonate-type species.11,57Fig. 4b displays the normalized intensities of the O 1s regions for all three materials at OCV and under −200 mV overpotential. The Ocarbonate peak is evident regardless of the material and increases with cathodic overpotential.
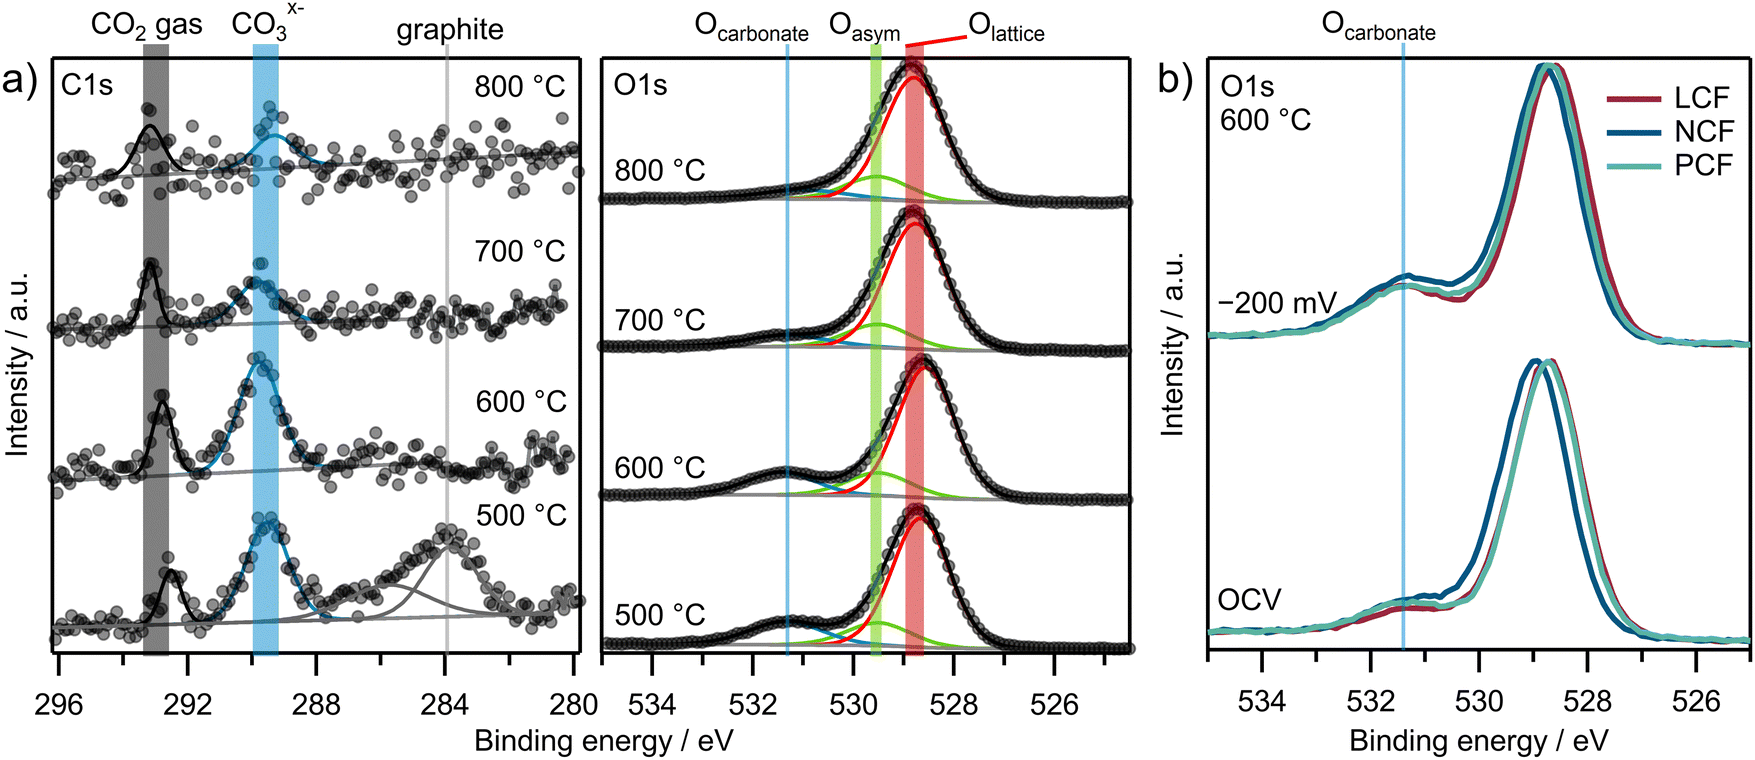 | ||
| Fig. 4 NAP-XPS spectra of (a) C 1s and O 1s regions for LCF with varying temperatures under −200 mV cathodic η and (b) O 1s regions of all three materials at 600 °C under OCV and −200 mV cathodic overpotential. | ||
The graphite-like carbon peak for LCF at −200 mV in the C 1s region in Fig. 4a is only visible at the lowest temperature of 500 °C. Signals from the carbonate species in both the C 1s and O 1s regions decrease above 600 °C. For further quantification of the carbonate coverage, the O 1s region is considered, as it offers a superior signal-to-noise ratio (SNR) in comparison to the C 1s spectra. However, to observe graphite-like carbon on the surface, the C 1s region is essential.
Analogous NAP-XPS spectra were acquired for all three electrode materials under various overpotentials. Fig. 5a displays heatmaps of the Ocarbonate/Otot intensity ratios as a function of temperature and overpotential. Each square represents a set of temperature and overpotential and the color of each square indicates the intensity ratio. The adsorbed carbonate is observed under all conditions and the intensity ratios range from 2% to 25%. The signal intensity ratio Cgraphite/Ctot in Fig. 5b on the other hand is zero under most conditions and graphite-like carbon is only observed at lower temperatures (500 °C and 600 °C) and higher cathodic overpotentials.
 | ||
| Fig. 5 Heatmaps of NAP-XPS intensity ratios for all three materials of (a) Ocarbonate/Otot and (b) Cgraphite/Ctot. Each square represents one measurement point at a certain combination of temperature and overpotential. The color of each square indicates the intensity ratio according to the color scale on the right creating a data matrix across various temperatures and electrochemical overpotentials. | ||
CO2 electrolysis on electrodes decorated with Fe exsolutions
Fig. 6a shows the Fe 2p region of the measurements on LCF at 700 °C under varying cathodic overpotentials (η). Note that the XPS fitting is not sufficient to separate Fe2+ from Fe3+. Therefore, only the sum of both is depicted as Fe oxide which is modeled using two constrained peaks to match the asymmetric shape of the Fe oxide peak. The Fe metal peak on the other hand is clearly separated and well de-convoluted using XPS fitting.
 | ||
| Fig. 6 (a) Exemplary Fe 2p NAP-XPS spectra of LCF at 700 °C under varying cathodic overpotentials for increasing (spectra no. 1–3) and decreasing (spectrum no. 4) |η|. (b) Heatmaps for the increasing |η| branch showing the measured fraction of metallic iron, thus indicating the degree of Fe exsolution for the pristine films of all three materials. Each square in (b) represents one measurement point at a certain combination of temperature and overpotential. The color of each square indicates the intensity ratio according to the color scale on the right creating a data matrix across various temperatures and electrochemical overpotentials. | ||
Initially, η was set from −200 mV to −300 mV in a stepwise manner (increasing |η|, spectra no. 1–3 in Fig. 6a). Subsequently, η was retraced back to −250 mV (decreasing |η|, spectrum no. 4 in Fig. 6a). It is evident that initially, under overpotentials slightly less cathodic than or equal to −250 mV, no metallic iron is present on the surface, even though we would expect it to be stable under these conditions. Only under overpotentials more cathodic than −250 mV, two additional peaks appear at 707 eV and 719 eV for the Fe 2p3/2 and Fe 2p1/2 branches. Their binding energies perfectly match metallic Fe,31,64,65 indicating the successful exsolution of Fe0 particles. These additional peaks remain unaffected when η is retraced back from a maximum −300 mV to −250 mV (decreasing |η|, spectrum no. 4 in Fig. 6a) and the exsolved iron remains metallic even under conditions at which no Fe0 was observed during the initial reduction (compare spectra no. 2 and 4 in Fig. 6a). This demonstrates that the initial formation of exsolved particles requires an additional exsolution overpotential ηex, which is in line with our prior experience with similar materials as well as with literature reports. Consequently, the experimental strategy proposed in Fig. 1c is directly applicable to the materials studied here. This offers the opportunity that two different states of the material can be observed under otherwise identical conditions (same overpotential and temperature): one with and one without Fe exsolution. In other words, a hysteresis-like behavior emerges regarding the Fe0 content on the surface. As a next step, the surface activities of these different stages (with and without exsolved Fe0) will be compared in the following chapter by looking at the current voltage characteristics (I–V curve).
The tendency for Fe exsolution of different materials can be an important factor for the kinetics of CO2 splitting. Therefore, a comprehensive visual representation of the relative Fe0 amount is illustrated using heatmaps in Fig. 6b for the increasing |η| branch thus depicting the Fe exsolution tendency of the pristine materials. Here, the NAP-XPS signal intensity ratios of Fe0/Fetot (Fetot = Fe0 + FeII + FeIII) from the Fe 2p region are displayed as a function of temperature and overpotential for all three materials. Caused by uncertainties from XPS fitting, the Fe0/Fetot threshold indicating significant amounts of exsolution was found to be 3%. Therefore, Fe0/Fetot ratios below this 3% threshold are assumed to be insignificant, which is taken into account in the definition of the color bar in Fig. 6b. The results show that the amount of metallic Fe is strongly increased by overpotential. Temperature on the other hand seems to play only a minor role.
 | ||
| Fig. 7 Top y-axis: Current–voltage characteristics (I–V curves) for all three materials at 700 °C showing the current densities iDC as a function of η. Bottom y-axis: Corresponding Fe0/Fetot ratios calculated from Fe 2p NAP-XPS spectra also as a function of η. For all subplots, the solid markers represent values when the cathodic overpotential is ramped up initially (increasing |η|) while the hollow markers represent values when the cathodic overpotential is subsequently decreased (decreasing |η|). | ||
Beneath the I–V curve of each electrode in Fig. 7 the fraction of metallic Fe0 on the surface of the electrodes (Fe0/Fetot as calculated from NAP-XPS measurements) is plotted also as a function of the applied overpotential. As was already described in Fig. 6a, all materials show a hysteresis-like relationship with respect to the Fe0 fraction as well, and the overpotential region of the Fe0 fraction hysteresis loop perfectly coincides with the I–V hysteresis. Similar I–V and Fe0 fraction curves for all three materials across the entire measured temperature range (500 °C to 800 °C) can be found in Fig. S4 in the ESI.† The results show that the above-described hysteresis in Fe0 fraction and the electrode de-activation are reproducible for all materials and temperatures.
Discussion
In the current study, three aspects are in focus, which will be discussed in the following. Firstly, we compare the electrochemical CO2 splitting performance of ferrite-based perovskites with different A-site cations. Secondly, we in situ explore the onset conditions of Fe exsolution depending on the A-site composition. And thirdly, we aim at correlating the CO2 splitting kinetics of different ferrite-based electrodes with the appearance of Fe0 exsolutions to gain further insights into the high temperature CO2 electrolysis kinetics and point out fundamental differences with the water splitting reaction.Effect of A-site composition on CO2 splitting performance
The investigation of the surface elemental composition shown in Fig. 3b revealed that all materials had similarly strong surface enrichment of their A-site elements, which is a well-known behavior of perovskite-type materials under such conditions.39,66–70 The observed variations in surface Fe content among the different materials in Fig. 3b can be regarded as small and statistically insignificant. This is demonstrated in Fig. 3c, where the Fe/(Fe + O) fractions are plotted for different samples of each material. First, the error bars in Fig. 3c (twice the standard deviation) overlap, indicating that the B-site content on the surface does not differ significantly between LCF, NCF and PCF (confidence level of roughly 95%). Second, the statistical variations in the B-site content of the PLD layers for each material in Fig. 3c are higher than the differences in B-site composition between the materials in Fig. 3b. This suggests that the A:B ratio of the surface cations is consistent across different samples when compared to the statistical variation of the films. Hence, the main surface chemical factors that were varied in this study are restricted to the elements occupying the A-site and the Fe oxidation state. This well-defined approach is essential to ensure that the specific electrode parameters being varied are precisely known, enabling robust and reliable conclusions about electrode kinetics.
The electrochemical impedance (Fig. 2 and Fig. S2, S3, ESI†) as well as DC measurements (Fig. 7 and Fig. S4, ESI†) show a superior electrochemical activity of LCF, compared to NCF and PCF, across the entire measured temperature range. This difference in electrochemical activity of the three perovskite-type electrodes, while exhibiting virtually identical A:B cation ratio at the surface, may be explained by two effects: either, the rare earth metal on the A-site also contributes redox activity, or the different size of La, Nd, and Pr affects the defect chemistry of the perovskite.
By looking at the NAP-XPS spectra of the A-site elements (La 3d, Nd 3d and Pr 3d) in Fig. 3a it becomes evident that no changes regarding the shapes of the spectra are observed upon electrochemical reduction. Only a binding energy shift of the entire A-site spectrum is observed, which can be explained by the Fermi-level freely moving through the band gap without being pinned by a redox active state.39 Since the shapes of the spectra are not altered at all after the reduction, a redox change can be ruled out for all three A-site elements. Furthermore, since La can be expected to be the least redox active element of the three, but LCF offers the fastest kinetics, the first option – i.e. the rare earth element contributing redox activity – can be excluded as an explanation for the materials’ different electrochemical activity.
Hence, the size effect of the A-site cations may be the more suitable explanation. Indeed, the observed activity trend (LCF > PCF ≈ NCF) correlates with the ionic radii of the elements: La > Pr ≈ Nd. The larger ionic radius of La3+ leads to a lattice expansion, as evidenced by XRD, which reveals that LCF exhibits the largest unit cell (see Fig. S1 and Table S1 in ESI†). This lattice expansion can increase the reducibility of the perovskite and enhance its surface reactivity, a phenomenon previously demonstrated for similar perovskites through 18O tracer exchange experiments on intentionally tensile-strained cobaltite perovskite thin films.71 Similar A-site size effects on the reducibility of perovskite-type ferrites were reported using thermogravimetry.72 Also, for the materials studied in the present case, an easier reducibility of LCF is supported by EIS measurements, since LCF indeed exhibits the largest chemical capacitance Cchem. Since Cchem is directly proportional to the minority charge carrier, this indicates a larger n-type electron concentration (i.e. Fe2+ concentration)54 and thus a higher degree of reduction of LCF than the other two oxides under otherwise identical conditions (compare Fig. 2c and Fig. S3 in the ESI†). From the viewpoint of LCF exhibiting a larger lattice constant this behavior seems to be plausible, as a lattice with larger unit cell volume can easier accommodate electronic charge carriers that localize at the B-site cation thus appearing as Fe2+, which is larger than Fe3+. Interestingly, Fe metal exsolution (which does not necessarily correlate to Fe3+/Fe2+ reduction) on the other hand is more pronounced for NCF and PCF. This phenomenon might be attributed to different types/degrees of lattice strain caused by different sizes of the A-site cations. Caused by the relatively smaller Nd3+ and Pr3+ cations compared to La3+, NCF and PCF exhibit more lattice distortion (and thus more local strain) compared to LCF. Strain has already been demonstrated to be able to strongly affect the exsolution behavior of perovskite films,73 and hence misfit-strain induced by size-mismatch of the A-site element may be a possible explanation for the observed differences of LCF, NCF, and PCF.
Formation and electrochemical redox-switching of Fe exsolutions
As described in the Results section, we observed a hysteresis loop in the occurrence of the Fe0 metal fraction at the electrode surface, depending on whether we drive the overpotential from or to more reducing conditions (see I–V-curve in Fig. 7): when the electrolysis overpotential is initially increased, the formation of metallic Fe0 starts at around −275 mV. Upon retracing the cathodic overpotential back to lower values, the reduced Fe0 remains metallic in a broader voltage range and is re-oxidized between −175 mV and −150 mV. This approach allowed us to capture two distinct iDC values corresponding to two different surface states of the electrode under otherwise identical conditions (same overpotential and temperature): a pristine one with (almost) no Fe0 present on the surface, and another one with a considerable Fe0 surface fraction after reduction.Regarding the effective pO2 of the initial formation of exsolution particles, the measurements are in line with literature. Very similar exsolution onset points of Fe0 nanoparticles were previously observed for NCF under steam electrolysis conditions in ref. 74. The Fe0/FeO equilibrium at 700 °C corresponds to an equivalent pO2 of 2.7 × 10⁻²² bar,75 which corresponds to a Nernst voltage of −114 mV vs. CE in a 1:10 CO:CO2 atmosphere (pO2 of 6.4 × 10⁻²⁰ bar). The fact that we observe the Fe0 exsolution onset at substantially more cathodic overpotentials (about −275 mV) strongly suggests that the initial exsolution process is kinetically hampered – e.g. by diffusion of involved species, electron transfer of the required iron reduction reaction, particle nucleation, and particle growth – and is in line with previous reports.74,76
When comparing the exsolution onsets of the different materials, subtle differences emerge by looking at Fig. 6b. Firstly, LCF appears to exhibit a slightly lower tendency for Fe exsolution since the Fe0 fraction at high overpotentials is rather low. Secondly, while LCF seems to exsolve in a more gradual manner, both NCF and PCF display a more abrupt increase in the Fe0 fraction upon reaching a certain overpotential threshold at around −275 mV.
Analyzing the iDC values of both states in Fig. 7, a clearly negative correlation between iDC and Fe0 fraction emerges, since the magnitude of the current is decreasing with increasing Fe0 fraction. The onsets of the hysteresis loops of both the iDC values and Fe0 fractions also coincide almost perfectly. Furthermore, the overpotential for the exsolution onset is within the range where the iDC values start to deviate from an exponential behavior for LCF and PCF. Since gas diffusion limitation can be safely excluded for thin films in an atmosphere of 1 mbar,77 this behavior suggests the onset of a surface de-activation process. This clearly suggests that Fe exsolution appears to affect the reaction rate, but in a detrimental manner.
The negative correlation between |iDC| and the Fe0 fraction is reproducibly demonstrated for all three investigated materials across a wide temperature range. Analogous results at different temperatures are provided in the ESI† (Fig. S4). The consistent manifestation of this phenomenon is noteworthy: a hysteresis-like behavior for both the current density and the Fe0 amount is evident across almost all material and temperature combinations, along with the negative correlation between them.
Furthermore, quantification using electrochemical (bulk) data revealed that for PCF (which exhibits by far the highest Fe0 fraction) at 700 °C, roughly 23% of the total Fe atoms present in the lattice were reduced to metal (see Table S3 in ESI†). Given the magnitude of these B-site vacancy concentrations, it seems improbable for the perovskite lattice to remain stable.32,41 De-activation caused by partial decomposition of the perovskite host would indeed be a plausible explanation at first glance. However, this does not necessarily seem to be the case here. Remarkably, once the exsolved Fe0 is re-oxidized, the surface activity is mostly recovered. This observation appears surprising, and explanations for this phenomenon remain speculative. Owing to the complexity of the observed effect, a detailed explanation is beyond the scope of this paper. Nevertheless, some thoughts deserve attention at this point: on the one hand, (at least partial) reversible exsolution could be an explanation for the re-activation upon re-oxidation. However, from what is known from literature, this seems unlikely given that exsolution – at least at the rather moderate temperatures we applied here – is typically considered to a great extent irreversible.32,36 This also suggests that the decrease in activity upon exsolution is not a sheer effect of losing surface area due to coverage by the exsolved metal particles, since the oxidized particles still remain after re-oxidation. Possibly, the oxidation state of the surface-decorating particles indirectly affects the reactivity of the perovskite surface, e.g. via triggering work function changes of the oxide. Another possibility would be a change in morphology of the particle after oxidation caused by a sudden change in the nanoparticle/perovskite interface energy. In addition, the evolution of surface roughness upon exsolution and re-oxidation may also affect the net activity of the electrode. SEM measurements revealed pronounced morphological changes of the thin-film electrodes when comparing post-measurement samples with a pristine one (see Fig. S7–S10 in the ESI†). However, the recovery of electrode surface activity upon particle re-oxidation can only hardly be explained to the full extent from the data available so far, and additional experiments are required to draw clear conclusions.
The de-activation of the electrodes for CO2 splitting upon Fe0 exsolution seems surprising at first glance, since the beneficial effect of exsolution was demonstrated for many reactions e.g. steam electrolysis.36,74 However, the reaction mechanisms for CO2 and H2O splitting differ significantly. In H2O splitting, the metal particles primarily facilitate the recombination of two neutrally adsorbed hydrogen atoms Had to form H2(36). In contrast, for CO2 splitting the presence of a metal appears not to enhance the desorption process of CO. Instead, the entire reaction seems to proceed entirely on the oxide surface. Its rate-limiting step is likely the conversion of a carbonate-type intermediate, which involves an electron transfer from the oxide to the carbonate.11 This carbonate intermediate was also observed in the present study and will be discussed in detail in the following section.
Carbon surface chemistry on perovskite-type ferrites
Looking at the C 1s and O 1s regions in Fig. 4 and 5, all three materials exhibit the expected carbonate-type species, which previous works identified as the reaction intermediate of CO2 electrolysis on mixed conducting electrodes.11,57 In these studies, it is argued that CO2 adsorbs to an oxygen vacancy and electrons are provided by the B-site of the perovskite. The sum of all elementary steps involved in the formation of the carbonate-radical intermediate can be expressed as in eqn (5). | (5) |
 | (6) |
 in Kröger–Vink notation, with the asterisk denoting its radical character; using a notation of absolute charges this corresponds to (CO3)3−*). Please note that this explanation is only one possible model that is in accordance with the experimental data available so far, and that alternative binding geometries of the intermediate may also be possible. For clarification, further experimental validation would be required, which is way beyond the scope of the present work. What is important to note is that the rate of both above-described processes, the formation and conversion of the carbonate intermediate, depend on the electrode's electron concentration
  which relates to the materials chemical capacitance (see eqn (4)38). Since LCF exhibits the highest chemical capacitance (see Fig. 2c), it seems plausible that also the reaction rate using LCF as the cathode is the highest among the three materials (see Fig. 2b and 7). Interestingly, no pronounced spectral features for Fe2+ were found in the Fe 2p spectra in Fig. 6a. Given that the bulk concentration of Fe2+ determined from the chemical capacitance is below 5% (Fig. 2c), its concentration is most likely below the detection limit if the surface is not much easier to reduce in terms of Fe3+ to Fe2+ reduction.
To put the NAP-XPS intensity ratios Ocarbonate/Otot into perspective, the carbonate surface coverage θcarbonate is roughly approximated by a simple calculation. With an inelastic mean free path of the O 1s photoelectrons of 2 nm78 and a bulk oxygen density of 5 × 10²² oxygen atoms cm−3, the bulk O 1s signal stems from approximately 1016 oxygen atoms cm−2. When further considering the C:O ratio of 1:3 of the carbonate, its surface concentration can be estimated by eqn (7). The maximum carbonate intensity in Fig. 5a corresponds to a coverage of about 63% relative to the unit cell density of [100] oriented film (3 × 10¹⁵ unit cells cm−2). Therefore, we can assume that already more than half of a monolayer is present at 600 °C and high overpotential. While this approximation is subject to uncertainties, it still indicates a relatively high carbonate coverage, supporting the idea that carbonate conversion is the rate-limiting step.
 | (7) |
 | (8) |
 and
and  concentrations at lower temperatures might explain the uncommon relationship between temperature and carbonate coverage.
Coking was primarily observed at 500 °C and high overpotentials (Fig. 4 and 5), which might further affect the carbonate coverage on the oxide surface since some adsorption sites might be blocked. At higher temperatures graphite-like carbon does not form, confirming the coking resistance of these materials. This is consistent with the findings of Skafte et al.,9 who observed that high oxygen vacancy concentrations and carbonate coverages on the surface delay graphite-like carbon formation.
Effect of metal exsolution: H2O vs. CO2 splitting
By comparing the gathered information for CO2 splitting with what is known for water splitting, substantial differences emerge. Fe exsolution is known to enhance the surface activity of perovskite-type oxide electrodes for H2O splitting.35,36,39,74 The reason is schematically depicted in Fig. 8a. For H2 to form, a recombination of two neutrally charged hydrogen species is needed. However, on the oxide surface, adsorbed hydrogen exists as positively charged OHads groups. Therefore, for recombination to occur, a simultaneous charge transfer to two adjacent OHads groups would be necessary. If a metallic surface is present nearby, an alternative pathway to this unlikely process can emerge. Because the adsorbed intermediates (OHads) are likely to exhibit a large surface diffusion coefficient, they are able to move towards the metallic surface. Here, the adsorbed species Hads is neutrally charged and the recombination to form H2,ads is more favored.36 | ||
| Fig. 8 Sketch for comparing the key pathways for (a) H2O and (b) CO2 splitting. Solid black arrows depict the fast/dominant processes, dashed grey arrows depict slow/unlikely processes. | ||
For CO2 splitting in Fig. 8b, the reaction proceeds differently. First, the carbonate intermediate – especially in the case of a carbonate bidentate11 – is probably significantly less mobile on the oxides surface and therefore might not be able to diffuse towards the exsolved nanoparticle with significant rate. Second, for CO formation, no recombination of adsorbed species is required. Therefore, the reaction on the oxide surface is probably still the dominant route for CO formation. Thus, no beneficial effect of metallic nanoparticles is observed.
Conclusion
In this fundamental study on well-defined perovskite-type model electrodes for direct electrochemical CO2 splitting, we analyzed the electrochemical performance of the following materials: La0.6Ca0.4FeO3−δ (LCF), Nd0.6Ca0.4FeO3−δ (NCF) and Pr0.6Ca0.4FeO3−δ (PCF). Correlations between the surface chemistry, A-site compositions, Fe exsolution and reaction rates were examined. The main takeaways from this research are:• LCF displayed superior surface activity and the highest chemical capacitance. For all A-site elements, no changes in valence states were observed using NAP-XPS, confirming that the A-site predominantly acts as a structural provider for the materials. The key aspect for LCF's superior activity may therefore be the higher ionic radius of La3+ compared to Nd3+ and Pr3+. With larger A-site cations the perovskite lattice expands, thus being able to accommodate higher concentrations of n-type electronic charge carriers (i.e. higher concentrations of the larger Fe2+). Consequently, LCF exhibits more Fe2+, while NCF and PCF tend to exsolve higher amounts of metallic Fe0 under the same conditions.
• While Fe exsolution had been proven beneficial for high-temperature H2O splitting, it consistently exhibits a de-activating effect on direct electrochemical CO2 splitting in our study. This observation is validated by the tandem hysteresis behavior observed in current density and Fe0 fraction measured by in situ NAP-XPS. A plausible explanation for this substantial difference between H2O and CO2 splitting lies in the fundamental differences in their reaction mechanisms. For H2O splitting, the recombination of neutrally adsorbed hydrogen on the surface is accelerated strongly by metal particles via a spillover mechanism. In contrast, for CO formation in CO2 splitting, no such recombination is required and the reaction occurs on the oxide surface rather than on the metal. Additionally, the surface diffusivity of carbonate intermediates is probably quite low, preventing them from migrating towards the metallic nanoparticles.
• Using NAP-XPS, the well-known carbonate-type intermediate was detected. Notably, all three studied perovskite-type oxide electrodes showed excellent coking resistance, as graphite-like carbon was only identified in the lower temperature range of 500 °C to 600 °C. At higher temperatures, no graphite-like carbon was observed, demonstrating their potential as low-degrading electrode materials.
In conclusion, our research underscores the critical role of fundamental studies on well-defined model samples, which are essential for understanding reaction dynamics and the interplay between chemical surface states and electrochemical activity. Moreover, it is crucial to recognize that correlations observed for specific reactions may not apply universally, as demonstrated by the differing impact of Fe exsolution on H2O splitting versus direct CO2 splitting.
Data availability
Data for this article, including raw impedance data, XPS spectra, cation compositions, U–I curves and heatmaps, are available at TU Wien Research Data at https://10.48436/vj57v-wn613.org.Conflicts of interest
There are no conflicts of interest to declare.Acknowledgements
This research was funded by the Austrian Science Fund (FWF) [10.55776/I5478] and [10.55776/COE5] (Cluster of Excellence MECS). For open access purposes, the author has applied a CC BY public copyright license to any author accepted manuscript version arising from this submission. The authors acknowledge TU Wien Bibliothek for financial support through its Open Access Funding Programme.References
- L. B. Lei, Y. Chen, Y. X. Zhang, T. Liu, Y. Wang and F. L. Chen, High Performance Solid Oxide Electrolysis Cells with Hierarchically Porous Ni-YSZ Electrode, Solid Oxide Fuel Cells, 2017, 78(1), 3217–3228 Search PubMed.
- Y. F. Song, X. M. Zhang, K. Xie, G. X. Wang and X. H. Bao, High-Temperature CO2 Electrolysis in Solid Oxide Electrolysis Cells: Developments, Challenges, and Prospects, Adv. Mater., 2019, 31(50), 18 CrossRef.
- R. Kungas, Review-Electrochemical CO2 Reduction for CO Production: Comparison of Low- and High-Temperature Electrolysis Technologies, J. Electrochem. Soc., 2020, 167(4), 11 Search PubMed.
- Y. F. Song, Z. W. Zhou, X. M. Zhang, Y. J. Zhou, H. M. Gong and H. F. Lv, et al., Pure CO2 electrolysis over an Ni/YSZ cathode in a solid oxide electrolysis cell, J. Mater. Chem. A, 2018, 6(28), 13661–13667 RSC.
- H. Wang, F. K. Jiang, X. Wang, L. T. Ye and K. Xie, Enhanced CO2 Electrolysis with the Modification of Ni-YSZ Cathodes by SDC in Microtubular Solid Oxide Electrolysis Cells, Energy Fuels, 2022, 36(21), 13195–13202 Search PubMed.
- M. B. Mogensen, M. Chen, H. L. Frandsen, C. Graves, A. Hauch and P. V. Hendriksen, et al., Ni migration in solid oxide cell electrodes: review and revised hypothesis, Fuel Cells, 2021, 21(5), 415–429 Search PubMed.
- G. Rinaldi, A. Nakajo, P. Burdet, M. Cantoni and W. Chiu, Characterization of local morphology and availability of triple-phase boundaries in solid oxide cell electrodes, Acta Mater., 2019, 178, 194–206 CrossRef CAS.
- S. D. Ebbesen, C. Graves, A. Hauch, S. H. Jensen and M. Mogensen, Poisoning of Solid Oxide Electrolysis Cells by Impurities, J. Electrochem. Soc., 2010, 157(10), B1419–B1429 CrossRef CAS.
- T. L. Skafte, Z. X. Guan, M. L. Machala, C. B. Gopal, M. Monti and L. Martinez, et al., Selective high-temperature CO2 electrolysis enabled by oxidized carbon intermediates, Nat. Energy, 2019, 4(10), 846–855 Search PubMed.
- T. L. Skafte, P. Blennow, J. Hjelm and C. Graves, Carbon deposition and sulfur poisoning during CO2 electrolysis in nickel based solid oxide cell electrodes, J. Power Sources, 2018, 373, 54–60 Search PubMed.
- A. K. Opitz, A. Nenning, C. Rameshan, M. Kubicek, T. Goetsch and R. Blume, et al., Surface Chemistry of Perovskite-Type Electrodes During High Temperature CO2 Electrolysis Investigated by Operando Photoelectron Spectroscopy, ACS Appl. Mater. Interfaces, 2017, 9(41), 35847–35860 CrossRef CAS.
- T. Zhu, D. E. Fowler, K. R. Poeppelmeier, M. Han and S. A. Barnett, Hydrogen oxidation mechanisms on perovskite solid oxide fuel cell anodes, J. Electrochem. Soc., 2016, 163(8), F952 Search PubMed.
- A. Nenning, L. Volgger, E. Miller, L. V. Mogni, S. Barnett and J. Fleig, The electrochemical properties of Sr(Ti, Fe)O3−δ for anodes in solid oxide fuel cells, J. Electrochem. Soc., 2017, 164(4), F364 CrossRef CAS.
- A. D. Aljaberi and J. T. Irvine, Ca-substituted, A-site deficient perovskite La0.2Sr0.7TiO3 as a potential anode material for SOFCs, J. Mater. Chem. A, 2013, 1(19), 5868–5874 RSC.
- T. Ishihara, S. Fukui, M. Enoki and H. Matsumoto, Oxide anode derived from Sr-doped LaMnO3 perovskite oxide for SOFCs using LaGaO3 electrolyte, J. Electrochem. Soc., 2006, 153(11), A2085 CrossRef CAS.
- Y. Luo, X. Chang, J. Wang, D. Zhang, L. Fu and X.-K. Gu, et al., Precise Regulation of In Situ Exsolution Components of Nanoparticles for Constructing Active Interfaces toward Carbon Dioxide Reduction, ACS Nano, 2025, 1463–1477, DOI:10.1021/acsnano.4c14279.
- Y. Luo, D. Zhang, T. Liu, X. Chang, J. Wang and Y. Wang, et al., In situ exsolution of quaternary alloy nanoparticles for CO2–CO mutual conversion using reversible solid oxide cells, Adv. Funct. Mater., 2024, 34(40), 2403922 CrossRef.
- L. Lindenthal, T. Ruh, R. Rameshan, H. Summerer, A. Nenning and C. Herzig, et al., Ca-doped rare earth perovskite materials for tailored exsolution of metal nanoparticles, Acta Crystallogr., Sect. B: Struct. Sci., Cryst. Eng. Mater., 2020, 76, 1055–1070 CrossRef PubMed.
- J. Popovic, L. Lindenthal, R. Rameshan, T. Ruh, A. Nenning and S. Loffler, et al., High Temperature Water Gas Shift Reactivity of Novel Perovskite Catalysts, Catalysts, 2020, 10(5) DOI:10.3390/catal10050582.
- F. Schrenk, L. Lindenthal, H. Drexler, R. Rameshan, H. Summerer and T. Berger, et al., Impact of nanoparticle exsolution on dry reforming of methane: improving catalytic activity by reductive pre-treatment of perovskite-type catalysts, Appl. Catal., B, 2022, 318, 11 CrossRef.
- J. Irvine, J. L. M. Rupp, G. Liu, X. X. Xu, S. Haile and X. Qian, et al., Roadmap on inorganic perovskites for energy applications, JPhys Energy, 2021, 3(3), 50 Search PubMed.
- D. Neagu, J. T. Irvine, J. Wang, B. Yildiz, A. K. Opitz and J. Fleig, et al., Roadmap on exsolution for energy applications, JPhys Energy, 2023, 5(3), 031501 CrossRef.
- D. Neagu, V. Kyriakou, I. L. Roiban, M. Aouine, C. Y. Tang and A. Caravaca, et al., In Situ Observation of Nanoparticle Exsolution from Perovskite Oxides: From Atomic Scale Mechanistic Insight to Nanostructure Tailoring, ACS Nano, 2019, 13(11), 12996–13005 CrossRef PubMed.
- W. Kobsiriphat, B. D. Madsen, Y. Wang, M. Shah, L. D. Marks and S. A. Barnett, Nickel- and Ruthenium-Doped Lanthanum Chromite Anodes: Effects of Nanoscale Metal Precipitation on Solid Oxide Fuel Cell Performance, J. Electrochem. Soc., 2010, 157(2), B279–B284 CrossRef.
- M. B. Katz, S. Y. Zhang, Y. W. Duan, H. J. Wang, M. H. Fang and K. Zhang, et al., Reversible precipitation/dissolution of precious-metal clusters in perovskite-based catalyst materials: bulk versus surface re-dispersion, J. Catal., 2012, 293, 145–148 CrossRef.
- Y. Nishihata, J. Mizuki, T. Akao, H. Tanaka, M. Uenishi and M. Kimura, et al., Self-regeneration of a Pd-perovskite catalyst for automotive emissions control, Nature, 2002, 418(6894), 164–167 CrossRef PubMed.
- D. Neagu, T. S. Oh, D. N. Miller, H. Menard, S. M. Bukhari and S. R. Gamble, et al., Nano-socketed nickel particles with enhanced coking resistance grown in situ by redox exsolution, Nat. Commun., 2015, 6 DOI:10.1038/ncomms9120.
- L. Lindenthal, J. Huber, H. Drexler, T. Ruh, R. Rameshan and F. Schrenk, et al., In Situ Growth of Exsolved Nanoparticles under Varying rWGS Reaction Conditions—A Catalysis and Near Ambient Pressure-XPS Study, Catalysts, 2021, 11(12), 1484 CrossRef.
- Y. F. Sun, J. H. Li, Y. M. Zeng, B. S. Amirkhiz, M. N. Wang and Y. Behnamian, et al., A-site deficient perovskite: the parent for in situ exsolution of highly active, regenerable nano-particles as SOFC anodes, J. Mater. Chem. A, 2015, 3(20), 11048–11056 Search PubMed.
- D. W. Zeng, Y. Qiu, S. Peng, C. Chen, J. M. Zeng and S. Zhang, et al., Enhanced hydrogen production performance through controllable redox exsolution within CoFeAlOx spinel oxygen carrier materials, J. Mater. Chem. A, 2018, 6(24), 11306–11316 Search PubMed.
- A. Nenning, S. Reuter, R. Schlesinger, H. Summerer, R. Ramehsan and L. Lindenthal, et al., Surface and Defect Chemistry of Porous La0.6Sr0.4FeO3-delta Electrodes on Polarized Three-Electrode Cells, J. Electrochem. Soc., 2022, 169(9), 12 CrossRef.
- J. Y. Wang, A. Kumar, J. L. Wardini, Z. Zhang, H. Zhou and E. J. Crumlin, et al., Exsolution-Driven Surface Transformation in the Host Oxide, Nano Lett., 2022, 22(13), 5401–5408 CrossRef PubMed.
- L. Thommy, O. Joubert, J. Hamon and M. T. Caldes, Impregnation versus exsolution: using metal catalysts to improve electrocatalytic properties of LSCM-based anodes operating at 600 °C, Int. J. Hydrogen Energy, 2016, 41(32), 14207–14216 CrossRef.
- L. Lindenthal, J. Popovic, R. Rameshan, J. Huber, F. Schrenk and T. Ruh, et al., Novel perovskite catalysts for CO2 utilization – Exsolution enhanced reverse water-gas shift activity, Appl. Catal., B, 2021, 292 DOI:10.1016/j.apcatb.2021.120183.
- A. K. Opitz, A. Nenning, C. Rameshan, R. Rameshan, R. Blume and M. Haevecker, et al., Enhancing Electrochemical Water-Splitting Kinetics by Polarization-Driven Formation of Near-Surface Iron(0): An In Situ XPS Study on Perovskite-Type Electrodes, Angew. Chem., Int. Ed., 2015, 54(9), 2628–2632, DOI:10.1002/anie.201409527.
- A. K. Opitz, A. Nenning, V. Vonk, S. Volkov, F. Bertram and H. Summerer, et al., Understanding electrochemical switchability of perovskite-type exsolution catalysts, Nat. Commun., 2020, 11(1), 4801, DOI:10.1038/s41467-020-18563-w.
- A. Schmid, G. M. Rupp and J. Fleig, How To Get Mechanistic Information from Partial Pressure-Dependent Current-Voltage Measurements of Oxygen Exchange on Mixed Conducting Electrodes, Chem. Mater., 2018, 30(13), 4242–4252 CrossRef PubMed.
- A. Schmid, G. M. Rupp and J. Fleig, Voltage and partial pressure dependent defect chemistry in (La,Sr)FeO3-delta thin films investigated by chemical capacitance measurements, Phys. Chem. Chem. Phys., 2018, 20(17), 12016–12026 RSC.
- A. Nenning, A. K. Opitz, C. Rameshan, R. Rameshan, R. Blume and M. Haevecker, et al., Ambient Pressure XPS Study of Mixed Conducting Perovskite-Type SOFC Cathode and Anode Materials under Well-Defined Electrochemical Polarization, J. Phys. Chem. C, 2016, 120(3), 1461–1471 CrossRef PubMed.
- A. Schmid and J. Fleig, The current-voltage characteristics and partial pressure dependence of defect controlled electrochemical reactions on mixed conducting oxides, J. Electrochem. Soc., 2019, 166(12), F831 CrossRef.
- M. Kuhn, S. Hashimoto, K. Sato, K. Yashiro and J. Mizusaki, Oxygen nonstoichiometry, thermo-chemical stability and lattice expansion of La0.6Sr0.4FeO3-delta, Solid State Ionics, 2011, 195(1), 7–15 CrossRef.
- A. Nenning, M. Holzmann, J. Fleig and A. K. Opitz, Excellent kinetics of single-phase Gd-doped ceria fuel electrodes in solid oxide cells, Mater. Adv., 2021, 2, 5422–5431, 10.1039/D1MA00202C.
- S. Kogler, A. Nenning, G. M. Rupp, A. K. Opitz and J. Fleig, Comparison of Electrochemical Properties of La0.6Sr0.4FeO3−δ Thin Film Electrodes: Oxidizing vs. Reducing Conditions, J. Electrochem. Soc., 2015, 162(3), F317–F326 Search PubMed.
- M. P. Pechini, Method of preparing lead and alkaline earth titanates and niobates and coating method using the same to form a capacitor, US-3330697-A, 1967.
- F. S. Baumann, J. Fleig, H.-U. Habermeier and J. Maier, Impedance spectroscopic study on well-defined (La, Sr)(Co, Fe)O3−δ model electrodes, Solid State Ionics, 2006, 177(11–12), 1071–1081 CrossRef.
- R. Rameshan, A. Nenning, J. Raschhofer, L. Lindenthal, T. Ruh and H. Summerer, et al., Novel Sample-Stage for Combined Near Ambient Pressure X-ray Photoelectron Spectroscopy, Catalytic Characterization and Electrochemical Impedance Spectroscopy, Crystals, 2020, 10(10) DOI:10.3390/cryst10100947.
- C. Ahamer, A. K. Opitz, G. M. Rupp and J. Fleig, Revisiting the Temperature Dependent Ionic Conductivity of Yttria Stabilized Zirconia (YSZ), J. Electrochem. Soc., 2017, 164(7), F790–F803 CrossRef.
- C. R. Brundle and B. V. Crist, X-ray photoelectron spectroscopy: a perspective on quantitation accuracy for composition analysis of homogeneous materials, J. Vac. Sci. Technol., A, 2020, 38(4), 18 CrossRef.
- C. Berger, E. Bucher, J. Lammer, C. Nader and W. Sitte, Fundamental material property trends in the La0.8−xNdxCa0.2FeO3−δ series: crystal structure and thermal expansion, J. Mater. Sci., 2021, 56, 10191–10203 CrossRef.
- C. Berger, E. Bucher, A. Windischbacher, A. D. Boese and W. Sitte, Strontium-free rare earth perovskite ferrites with fast oxygen exchange kinetics: experiment and theory, J. Solid State Chem., 2018, 259, 57–66 CrossRef.
- L. Huang, M. Wang, L. Cheng, S. Pan, Q. Yao and H. Zhou, Fast and efficient synthesis of a new adjustable perovskite-structured ferrite La1−xCaxFeO3 microwave absorbent, J. Alloys Compd., 2022, 892, 162167 CrossRef.
- G. Brug, A. L. van den Eeden, M. Sluyters-Rehbach and J. H. Sluyters, The analysis of electrode impedances complicated by the presence of a constant phase element, J. Electroanal. Chem. Interfacial Electrochem., 1984, 176(1–2), 275–295 CrossRef.
- J. Fleig, The grain boundary impedance of random microstructures: numerical simulations and implications for the analysis of experimental data, Solid State Ionics, 2002, 150(1–2), 181–193 CrossRef.
- J. Fleig, A. Schmid, G. M. Rupp, C. Slouka, E. Navickas and L. Andrejs, et al., The Chemical Capacitance as a Fingerprint of Defect Chemistry in Mixed Conducting Oxides, Acta Chim. Slov., 2016, 63(3), 509–518 Search PubMed.
- W. Lai and S. M. Haile, Impedance spectroscopy as a tool for chemical and electrochemical analysis of mixed conductors: a case study of ceria, J. Am. Ceram. Soc., 2005, 88(11), 2979–2997 CrossRef.
- Z. L. A. Feng, M. L. Machala and W. C. Chueh, Surface electrochemistry of CO2 reduction and CO oxidation on Sm-doped CeO2−x: coupling between Ce3+ and carbonate adsorbates, Phys. Chem. Chem. Phys., 2015, 17(18), 12273–12281 RSC.
- Y. Yu, B. H. Mao, A. Geller, R. Chang, K. Gaskell and Z. Liu, et al., CO2 activation and carbonate intermediates: an operando AP-XPS study of CO2 electrolysis reactions on solid oxide electrochemical cells, Phys. Chem. Chem. Phys., 2014, 16(23), 11633–11639 RSC.
- T. Staudt, Y. Lykhach, N. Tsud, T. Skala, K. C. Prince and V. Matolin, et al., Electronic Structure of Magnesia-Ceria Model Catalysts, CO2 Adsorption, and CO2 Activation: A Synchrotron Radiation Photoelectron Spectroscopy Study, J. Phys. Chem. C, 2011, 115(17), 8716–8724 CrossRef.
- X. Y. Deng, A. Verdaguer, T. Herranz, C. Weis, H. Bluhm and M. Salmeron, Surface chemistry of Cu in the presence of CO2 and H2O, Langmuir, 2008, 24(17), 9474–9478 CrossRef PubMed.
- R. Blume, D. Rosenthal, J. P. Tessonnier, H. N. Li, A. Knop-Gericke and R. Schlogl, Characterizing Graphitic Carbon with X-ray Photoelectron Spectroscopy: A Step-by-Step Approach, ChemCatChem, 2015, 7(18), 2871–2881 CrossRef.
- J.-W. DuanMu, Z.-Z. Wu, F.-Y. Gao, P.-P. Yang, Z.-Z. Niu and Y.-C. Zhang, et al., Investigation and mitigation of carbon deposition over copper catalyst during electrochemical CO2 reduction, Precis. Chem., 2024, 2(4), 151–160 CrossRef CAS.
- E. J. Crumlin, E. Mutoro, W. T. Hong, M. D. Biegalski, H. M. Christen and Z. Liu, et al., In Situ Ambient Pressure X-ray Photoelectron Spectroscopy of Cobalt Perovskite Surfaces under Cathodic Polarization at High Temperatures, J. Phys. Chem. C, 2013, 117(31), 16087–16094 CrossRef CAS.
- P. A. W. van der Heide, Systematic X-ray photoelectron spectroscopic study of La1−xSrx-based perovskite-type oxides, Surf. Interface Anal., 2002, 33(5), 414–425 Search PubMed.
- A. Nenning and J. Fleig, Electrochemical XPS investigation of metal exsolution on SOFC electrodes: controlling the electrode oxygen partial pressure in ultra-high-vacuum, Surf. Sci., 2019, 680, 43–51 CrossRef CAS.
- J. Choi, M. Kim, S. K. Kang, J. Kim, J. Ha and H. H. Shin, et al., A Highly Efficient Bifunctional Electrode Fashioned with In Situ Exsolved NiFe Alloys for Reversible Solid Oxide Cells, ACS Sustainable Chem. Eng., 2022, 10(23), 7595–7602 CrossRef CAS.
- E. J. Crumlin, E. Mutoro, Z. Liu, M. E. Grass, M. D. Biegalski and Y. L. Lee, et al., Surface strontium enrichment on highly active perovskites for oxygen electrocatalysis in solid oxide fuel cells, Energy Environ. Sci., 2012, 5(3), 6081–6088 RSC.
- A. K. Opitz, C. Rameshan, M. Kubicek, G. M. Rupp, A. Nenning and T. Goetsch, et al., The Chemical Evolution of the La0.6Sr0.4CoO3-delta Surface Under SOFC Operating Conditions and Its Implications for Electrochemical Oxygen Exchange Activity, Top. Catal., 2018, 61(20), 2129–2141 CrossRef CAS PubMed.
- T. T. Fister, D. D. Fong, J. A. Eastman, P. M. Baldo, M. J. Highland and P. H. Fuoss, et al., In situ characterization of strontium surface segregation in epitaxial La(0.7)Sr(0.3)MnO(3) thin films as a function of oxygen partial pressure, Appl. Phys. Lett., 2008, 93(15) DOI:10.1063/1.2987731.
- M. Niania, M. Sharpe, R. Webb and J. Kilner, The surface of complex oxides; ion beam based analysis of energy materials, Nucl. Instrum. Methods Phys. Res., Sect. B, 2020, 480, 27–32 CrossRef CAS.
- R. Bliem, D. Kim, J. Wang, E. J. Crumlin and B. Yildiz, Hf deposition stabilizes the surface chemistry of perovskite manganite oxide, J. Phys. Chem. C, 2021, 125(6), 3346–3354 CrossRef CAS PubMed.
- M. Kubicek, Z. Cai, W. Ma, B. Yildiz, H. Hutter and J. Fleig, Tensile lattice strain accelerates oxygen surface exchange and diffusion in La1−xSrxCoO3−δ thin films, ACS Nano, 2013, 7(4), 3276–3286 CrossRef CAS PubMed.
- P. Porta, S. Cimino, S. De Rossi, M. Faticanti, G. Minelli and I. Pettiti, AFeO3 (A = La, Nd, Sm) and LaFe1−xMgxO3 perovskites: structural and redox properties, Mater. Chem. Phys., 2001, 71(2), 165–173 Search PubMed.
- H. Han, J. Park, S. Y. Nam, K. J. Kim, G. M. Choi and S. S. Parkin, et al., Lattice strain-enhanced exsolution of nanoparticles in thin films, Nat. Commun., 2019, 10(1), 1471 Search PubMed.
- H. Summerer, A. Nenning, C. Rameshan and A. K. Opitz, Exsolved catalyst particles as a plaything of atmosphere and electrochemistry, EES Catal., 2023, 1(3), 274–289 RSC.
- D. Holmes Richard, St. C. O'Neill Hugh and J. Arculus Richard, Standard Gibbs free energy of formation for Cu2O, NiO, CoO, and FexO: high resolution electrochemical measurements using zirconia solid electrolytes from 900–1400 K, Geochim. Cosmochim. Acta, 1986, 50, 2439–2452 CrossRef.
- Y. Gao, D. Chen, M. Saccoccio, Z. Lu and F. Ciucci, From material design to mechanism study: nanoscale Ni exsolution on a highly active A-site deficient anode material for solid oxide fuel cells, Nano Energy, 2016, 27, 499–508 CrossRef CAS.
- A. Nenning, C. Bischof, J. Fleig, M. Bram and A. K. Opitz, The Relation of Microstructure, Materials Properties and Impedance of SOFC Electrodes: A Case Study of Ni/GDC Anodes, Energies, 2020, 13(4), 30 CrossRef.
- J. Zemek, S. Hucek, A. Jablonski and I. Tilinin, Photoelectron escape depth, J. Electron Spectrosc. Relat. Phenom., 1995, 76, 443–447 CrossRef CAS.
Footnote |
| † Electronic supplementary information (ESI) available. See DOI: https://doi.org/10.1039/d5ey00013k |
| This journal is © The Royal Society of Chemistry 2025 |