
 Open Access Article
 This Open Access Article is licensed under a Creative Commons Attribution-Non Commercial 3.0 Unported Licence
Oxygen vacancy-engineered Bi2O2CO3 nanosheets for enhanced photodegradation of pharmaceuticals and personal care products in water†
Helena Pérez
del Pulgar
 a,
Josefa
Ortiz-Bustos
a,
Santiago
Gómez-Ruiz
ab,
Isabel
del Hierro
*ab and
Yolanda
Pérez
*ac
a,
Josefa
Ortiz-Bustos
a,
Santiago
Gómez-Ruiz
ab,
Isabel
del Hierro
*ab and
Yolanda
Pérez
*ac
aCOMET-NANO Group, Departamento de Biología y Geología, Física y Química Inorgánica, ESCET, Universidad Rey Juan Carlos, C/Tulipán s/n, 28933 Móstoles, Madrid, Spain. E-mail: isabel.hierro@urjc.es; yolanda.cortes@urjc.es
bInstituto de Investigación de Tecnologías para la Sostenibilidad, Universidad Rey Juan Carlos, Spain
cAdvanced Porous Materials Unit, IMDEA Energy, Av. Ramón de la Sagra 3, 28935 Móstoles, Madrid, Spain
First published on 16th June 2025
Abstract
Defect engineering has emerged as a versatile approach for tailoring the properties of materials to meet specific functional applications and improve their properties. In the context of environmental remediation, the introduction of surface oxygen vacancies in semiconductor materials has demonstrated to be a highly effective strategy to enhance molecular adsorption and contaminants' degradation. Herein, we reported the synthesis of Bi2O2CO3 nanosheets with surface oxygen vacancies (OVs) via the controlled addition of an accessible, non-toxic and versatile ionic liquid, choline hydroxide. The presence of OVs was confirmed by X-ray photoelectron spectroscopy (XPS) and electrochemical techniques, including cyclic voltammetry (CV) and differential pulse voltammetry (DPV). Upon optimizing the concentration of choline hydroxide, it was found that the addition of 10% of choline hydroxide yielded a material, Chol10%-Bi2O2CO3, with significantly enhanced adsorptive and photocatalytic performance. This material efficiently removed not only antibiotics such as ciprofloxacin (97.5% in 20 min) and sulfamethoxazole (98.5% in 60 min), but also a UV filter compound, benzophenone-4 (92.4% in 180 min), which are representative of pharmaceuticals and personal care products (PPCPs) of high environmental concern. Mechanistic studies into reactive oxygen species involved in the photocatalytic process, together with a thorough study of the energy band structure, revealed that Chol10%-Bi2O2CO3 generates both hydroxyl (OH·) and superoxide (·O2−) radicals, which are essential for the efficient degradation of the recalcitrant UV filter compound, showing the potential of oxygen vacancy-engineered Bi2O2CO3 nanosheets as promising platforms for water purification and environmental remediation applications.
Water impactA highly effective Chol10%-Bi2O2CO3 photocatalyst with surface oxygen vacancies was developed, capable of removing various pharmaceuticals and personal care products (PPCPs) of significant environmental concern from water. These include antibiotics such as ciprofloxacin (97.5% removal in 20 min) and sulfamethoxazole (98.5% in 60 min), as well as a UV filter compound, benzophenone-4 (92.4% in 180 min). |
1. Introduction
The presence of pharmaceuticals and personal care products (PPCPs) in aquatic environments has become a significant global issue due to their detrimental impact on the health of both aquatic organisms and humans.1 Among PPCPs, antibiotics like ciprofloxacin (CIP) and sulfamethoxazole (SMZ) have been detected in various water sources at high concentrations, which are known to promote the emergence of antibiotic-resistant bacteria2 and the inhibition of algae growth, affecting photosynthesis in aquatic environments.3 For instance, CIP concentrations as high as 6.5 mg L−1 have been reported in waters near pharmaceutical factories,4 while SMZ concentrations have ranged from 0.1 to 32 μg L−1 in drinking water.5In addition to antibiotics, UV filters, widely used as sun-blocking agents in personal care products (e.g. sunscreens, shampoos) and industrial applications (e.g., food packaging, paints)6 are of growing concern for the scientific community. The most common UV filter compound, namely, benzophenone-4 (BP-4), is particularly resistant to degradation and has been detected at concerning concentrations (ranging from 0.2 to 5.8 μg L−1 in influents and 0.1 to 4.3 μg L−1 in effluents of wastewater treatment plants and from 0.003 to 1.3 μg L−1 in surface waters).7 BP-4's ecotoxicological impact, along with its endocrine-disrupting potential induces significant risks to aquatic organisms.8 Due to these risks, the development of cost-efficient methods to eliminate PPCPs from water is urgently needed.
In this context, the removal of BP-4 still remains a challenge.9,10 Advanced oxidation processes (AOPs) have been explored for the degradation of BP-4, but complete elimination occasionally requires the use of chemical oxidants such as peroxymonosulfate11 and/or hydrogen peroxide.12 Other methods, including UV/chlorine disinfection,13 anaerobic biodegradation7 and adsorption14 face some limitations, such as the formation of toxic by-products or high regeneration costs for adsorbents. Therefore, the development of more efficient and environmentally friendly methods for BP-4 is imperative. In this sense, photocatalysis is a promising process, as irradiation of a semiconductor with light of suitable energy excites electrons from the valence band (VB) to the conduction band (CB), leaving behind holes (h+) in the VB. These charge carriers facilitate the formation of reactive oxygen species, such as superoxide (·O2−) and hydroxyl radicals (·OH), which can subsequently degrade contaminants.15,16
Bi2O2CO3, a low-cost, non-toxic, robust and highly active photocatalyst, has demonstrated high potential for removing water contaminants. However, its performance is limited, because of its limited adsorption capacity, and insufficient presence of oxygen vacancies, among other drawbacks. To overcome these limitations, it is necessary to modify it to intrinsically enhance its photocatalytic and adsorption performance. Some strategies that have been used more efficiently include ion doping,17 surface18 and/or morphology modification19 and creating defects (e.g., OVs).20 For instance, Guo et al.21 reported Bi2O2CO3 nanosheets with functional groups and OVs, which were synthesized using a hydrothermal method with ammonia solution and ethylene glycol as a solvent mixture. Feng et al.22 prepared Bi2O2CO3 materials enriched with surface OVs by using different amounts of glyoxal at room temperature, enhancing their active sites. Similarly, Lu et al.23 improved the photocatalytic properties of Bi2O2CO3 systems via a heat-treatment method (350 °C for 2 h), resulting in OV-induced Bi2O3/Bi2O2CO3 materials. Thus, these findings support that surface OV modification is a viable approach for enhancing the photocatalytic and adsorption properties of Bi2O2CO3.
On the other hand, choline based ionic liquids have attracted considerable attention due to their low-toxicity, biocompatibility and biodegradability. The choline cation ([Chol]+), a component of vitamin B4, is classified as safe by various food regulatory agencies such as the U.S. Food and Drug Administration and the European Food Safety Agency.24 In particular, choline hydroxide, as a readily available ionic liquid, has been widely used in various chemical reactions including base-catalyzed, ring opening, Knoevenagel–Michael and aldol reactions.25
Inspired by these findings, we propose an alternative strategy to enhance both the photocatalytic and adsorption performance of Bi2O2CO3via surface modification with choline hydroxide (CholOH). This approach promotes synergistic effects, including an increase of specific surface area and the generation of OVs. The resulting Bi2O2CO3-based materials were characterized by using a wide variety of techniques including spectroscopy (FTIR, NMR, XPS, UV-vis and PL) and microscopy (TEM and FESEM), as well as textural and (photo)electrochemical methods (CV, DPV, EIS and photocurrent analysis) to investigate the properties of the modified systems prepared with varying amounts of choline hydroxide. Notably, our studies show that using an optimized amount of ionic liquid enhances the performance of Bi2O2CO3 systems, improving both the adsorption and degradation of the studied antibiotics (CIP and SMZ) and the UV filter BP-4 (Table S1†). This resulted in high total organic carbon (TOC) removals (>80% mineralization for CIP and >75% mineralization for SMZ and BP-4). Trapping experiments, identification of degradation compounds, Mott–Schottky analysis and band structure calculations revealed several insights on the mechanism and energy band alignment, highlighting the role of ROS in pollutant removal. Thus, the approach presented here provides with a simple solution for the preparation of high-performance systems, by a choline-modification of Bi2O2CO3 as an environmentally friendly alternative for the remediation of emerging water pollutants.
2. Experimental section
2.1. Materials
Bismuth(III) nitrate pentahydrate ≥98% (Bi(NO3)3·5H2O) was acquired from Chem Lab and sodium carbonate (Na2CO3, anhydrous) from Scharlau. Choline hydroxide (CholOH, 45 wt% in water) and ciprofloxacin 98% (CIP) were purchased from Acros Organics. Sulfamethoxazole (SMZ) and benzophenone-4 (BP-4) were acquired from Fluorochem and Aldrich-Merck, respectively. Acetic acid and ethanol were purchased from Carlo ERBA Reagents and VWR Chemical, respectively. Water was filtered using a Millipore Milli-Q system (Waters, USA).2.2. Synthesis of Bi2O2CO3-based materials
Bi2O2CO3 was prepared according to a previously reported method with some modifications.26 In a typical synthesis, 1.94 g (4 mmol) of Bi(NO3)3·5H2O was dissolved in 6 mL of acetic acid and the mixture was stirred for 1 h (solution A). Then, 6.36 g of Na2CO3 (60 mmol) was dissolved in Milli-Q water and CholOH (5, 10, or 20% wt) was added to give solution B. Subsequently, solution B was added dropwise to solution A and the mixture was then stirred for 1 h. The resulting solid was filtered, washed with water and ethanol, and dried overnight at 70 °C. Subsequently, the solid was calcined at 260 °C for 4 h. The samples were denoted as CholX%-Bi2O2CO3 (X = 5, 10, and 20). For comparison purposes Bi2O2CO3 was also prepared using the same method but without adding the ionic liquid.2.3. Characterization
Powder X-ray diffraction (PXRD) patterns were acquired using a Phillips diffractometer model PW3040/00 X'Pert MPD/MRD at 45 kV and 40 mA, with Cu-Kα radiation (λ = 1.5418 Å). N2 adsorption–desorption isotherms were obtained using a Micromeritics TriStar 3000 analyzer. ATR-FTIR spectra were recorded on a Perkin-Elmer Spectrum Two FT-IR spectrometer (4000 to 400 cm−1). Photoluminescence (PL) spectra were acquired with a Perkin Elmer FL 8500 fluorescence spectrometer. A Perkin-Elmer LAMBDA 850+ spectrophotometer was used to obtain DRUV-vis diffuse reflectance spectra. Transmission electron microscopy (TEM) images were collected using a JEOL F200 electronic microscope at 200 kV and field-emission scanning electron microscopy (FESEM) images were obtained using a JEOL (JSM 7900F) scanning microscope at 10 kV. Electrochemical measurements were conducted using a potentiostat/galvanostat (Autolab PSGTAT302) equipped with an impedance module. The measurements were carried out with a carbon-paste-modified electrode as the working electrode (WE), containing 10 wt% of active material in commercial carbon paste and using Nujol as an agglutinant. Cyclic voltammetry (CV) and differential pulse voltammetry (DPV) were measured in an aqueous solution of Na2SO4 (0.2 M) as the electrolyte, with a platinum rod as the counter electrode (CE) and an Ag/AgCl/KCl (3 M) electrode as the reference electrode (RE). Electrochemical impedance spectroscopy (EIS) measurements were performed using a similar setup, with an SCE as the RE and 0.2 M KOH as the electrolyte. Photocurrent experiments were conducted on a drop-cast glassy carbon electrode as the WE. The ink drop-cast onto the commercial glassy carbon electrode contained 5 mg of commercial Ketjenblack carbon and 3 mg of active material suspended in a mixture of 500 μL of Mili-Q water, 500 μL of ethanol, and 20 μL of Nafion. A 6 μL aliquot of the resulting mixture was drop-cast onto the electrode and left to air dry. Then, the electrode was introduced into an aqueous solution of 0.2 M Na2SO4 as the electrolyte, with a platinum plaque as the CE, and Ag/AgCl/KCl (3 M) as the RE. The electrode was exposed to light for periods of 20 s, followed by 10 s of darkness.2.4. Photocatalytic experiments
The photocatalytic activity of the Bi2O2CO3-based samples was evaluated for degrading contaminants in Milli-Q water and tap water. Two antibiotics, ciprofloxacin (CIP) and sulfamethoxazole (SMZ), and a UVA filter (BP-4) were chosen as target persistent contaminants. In a typical experiment, 20 mg of the bismuth-based sample was added to 20 mL of an aqueous solution containing the contaminant (15 mg L−1 of CIP and 10 mg L−1 for SMZ and BP-4). The suspension was stirred in the dark for 30 min to ensure the adsorption–desorption equilibrium has been reached. Subsequently, the suspension was irradiated using a 300 W Xe lamp. An aliquot was taken at different periods, and the resulting liquid was analyzed by UV-vis spectroscopy or HPLC. The concentration of CIP was determined by monitoring the change in absorbance at 272 nm, while the concentrations of SMZ and BP-4 were calculated by HPLC (Perkin Elmer LC300 system with a C18 reverse-phase column (4.4 μm, 4.6 × 100 mm) equipped with a multiwavelength UV/vis detector at wavelengths of 262 nm and 227 nm for SMZ and BP-4, respectively). SMZ concentration was determined using an isocratic method with a 70![[thin space (1/6-em)]](https://www.rsc.org/images/entities/char_2009.gif) :30 (water (0.1% formic acid):methanol) solvent system and oven temperature of 30 °C. BP-4 concentration was determined with a solvent system of acetonitrile and acetic acid (1 mM) in water (30:70). The retention times were 8.03 and 3.78 min for SMZ and BP-4, respectively.
:30 (water (0.1% formic acid):methanol) solvent system and oven temperature of 30 °C. BP-4 concentration was determined with a solvent system of acetonitrile and acetic acid (1 mM) in water (30:70). The retention times were 8.03 and 3.78 min for SMZ and BP-4, respectively.
The total organic carbon (TOC) was measured for the fresh contaminant solution (TOCinitial) and the resulting solution after the degradation experiment (TOCfinal) at different reaction times: 30 min, 60 min and 180 min, for CIP, SMZ and BP-4, respectively. The mineralization rates were calculated by determination of TOC using a combustion/non-dispersive infrared gas analyzer model TOC-V from Shimadzu and the following equation:

3. Results and discussion
3.1. Synthesis and characterization of Bi2O2CO3-based samples
The morphology of Bi2O2CO3 can be modified using various synthetic methods, including templated and not templated approaches27 as previously reported. In this work, we present a novel and straightforward alternative method to prepare, for the first time, Bi2O2CO3 nanosheets using choline hydroxide (CholOH) as a structure-directing agent, followed by heat treatment at 260 °C for 4 h. This optimal temperature was chosen to ensure the thermal decomposition of CholOH (occurring at ca. 175 °C)28 while preventing the formation of Bi2O3 (occurring at temperatures higher than 280 °C).26 By adjusting the amount of CholOH (i.e. 5%, 10% and 20 wt%), the materials denoted as Chol5%-Bi2O2CO3, Chol10%-Bi2O2CO3 and Chol20%-Bi2O2CO3 were obtained.The phase composition of the prepared materials was confirmed by PXRD patterns, as shown in Fig. 1. The diffraction patterns for both Bi2O2CO3 and CholX%-Bi2O2CO3 samples matched the standard tetragonal phase of Bi2O2CO3 (JCPDS No. 41-1488), indicating that the use of CholOH did not notably alter the crystal structure of Bi2O2CO3. The absence of additional peaks in any of the diffractograms confirmed the high purity of the as-prepared samples. Additionally, an increase of CholOH amount led to a slight shift of the (013) and (110) peaks towards higher angles (2θ) (Fig. S1†) suggesting slight changes in the Bi2O2CO3 lattice. This observation is consistent with the calculated lattice parameters, which revealed a reduction of the unit cell (i.e. cell volume from 213.65 to 204.81 Å3 and c-unit cell parameter from 13.97 to 13.78 Å) with an increase of CholOH, suggesting the existence of OVs (Table 1). This observation aligns with other studies,29 where oxygen vacancies led to lattice contraction. The crystallite size was calculated by applying Scherrer's equation to the (013) plane diffraction peak (Table 1). It was observed that the crystallite size decreases upon the addition of CholOH in comparison to bare Bi2O2CO3, and from this point, it increases gradually with the amount of structure-directing agent. In this context, it seems plausible that while CholOH facilitates the formation of smaller crystallites at lower concentrations, higher CholOH amounts may promote particle growth due to increased structure-directing effects. Therefore, CholOH seems to play a crucial role in modulating the crystal structure and crystallite size of Bi2O2CO3, while also promoting the formation of OVs.
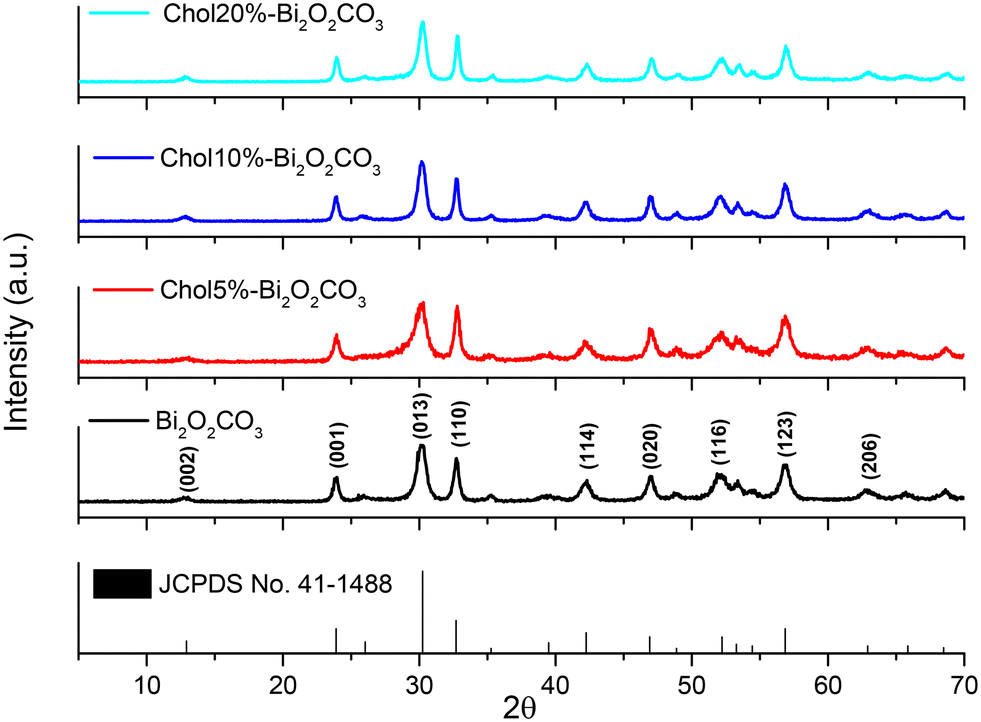 | ||
| Fig. 1 PXRD patterns of the Bi2O2CO3-based samples. | ||
| Material | S BET (m2 g−1) | Band gapa (eV) | Crystallite sizeb (nm) | Lattice parameters | ||
|---|---|---|---|---|---|---|
| a = b (Å) | c (Å) | V (Å3) | ||||
| a Estimated by the application of the Kubelka–Munk function. b Calculated by Scherrer's equation. | ||||||
| Bi2O2CO3 | 11.52 | 3.32 | 19.18 | 3.91 | 13.97 | 213.65 |
| Chol5%-Bi2O2CO3 | 12.26 | 3.29 | 11.93 | 3.86 | 13.86 | 206.45 |
| Chol10%-Bi2O2CO3 | 22.49 | 3.32 | 13.13 | 3.86 | 13.78 | 205.66 |
| Chol20%-Bi2O2CO3 | 12.27 | 3.24 | 16.67 | 3.86 | 13.78 | 204.81 |
To further confirm the removal of [Chol]+ moieties in the Bi2O2CO3-modified nanosheets, FTIR and 13C-MAS-NMR spectra were recorded. The FTIR spectra (Fig. 2a) show the characteristic bands attributed to the CO32− anions orthogonally inserted within (Bi2O2)2+ layers, which are present in all the studied samples. The bands at 1456 cm−1 and 1382 cm−1 correspond to anti-symmetric vibration ν3, while the band at 845 cm−1 corresponds to out-of-plane bending mode ν2 of CO32–.30 Moreover, the peaks at 1067 cm−1 and 691 cm−1 are assigned to symmetric stretching modes ν1, and in-plane deformation ν4 of CO32−, respectively. The characteristic Bi–O band appears at 549 cm-1.31 Significantly, in the spectra of CholX%-Bi2O2CO3 materials new broad bands appear at 3600–3200 cm−1 and at 1640 cm−1, which correspond to O–H stretching and bending vibration of physisorbed water molecules, respectively. The appearance of these bands for CholX%-Bi2O2CO3 materials suggests the presence of hydrogen bonding between water molecules and the OVs (i.e., defective O2−/O−) from [Bi2O2]2+ layers. It is important to note that no characteristic bands of the [Chol]+ moieties appear in the spectra, suggesting their complete removal by thermal treatment. To confirm this observation, FTIR spectra of CholOH and Chol20%-Bi2O2CO3 were recorded before calcination (Fig. S2†) and the spectra showed the bands of the [Chol]+ moieties appearing at 1467 and 1523 cm−1 in the spectrum of Chol20%-Bi2O2CO3 before calcination treatment, which disappear after calcination treatment. The 13C MAS-NMR spectra (Fig. 2b) provide additional confirmation of the removal of [Chol]+ moieties. All samples show a broad peak at δ = 167 ppm, attributed to interlayered carbonate anions. Interestingly, a signal at δ = 56 ppm is observed in the spectrum of Chol20%-Bi2O2CO3, which can be attributed to methylene carbon atoms.32 This suggests that the partial thermal decomposition of [Chol]+ moieties may result in methylene groups within the Bi2O2CO3 structure.
 | ||
| Fig. 2 a) FTIR spectra of the Bi2O2CO3-based materials and b) 13C MAS NMR spectra of Bi2O2CO3, Chol10%-Bi2O2CO3 and Chol20%-Bi2O2CO3. | ||
To gain further insights into the chemical composition of Bi2O2CO3-based materials, high-resolution XPS measurements were conducted for Bi2O2CO3 and Chol10%Bi2O2CO3, as representative samples. The full-scan XPS spectra reveal the presence of oxygen (O 1s), carbon (C 1s) and bismuth (Bi 4f) in both samples (Fig. 3a). The XPS spectrum of Bi 4f for Bi2O2CO3 (Fig. 3b) displays a doublet corresponding to Bi 4f5/2 (164.1 eV) and Bi 4f7/2 (158.9 eV), which is characteristic of Bi3+ species in the [Bi2O2]2+ layers.33 In contrast, in the spectrum of Chol10%-Bi–Bi2O2CO3, the Bi 4f doublet can be deconvoluted into four peaks. Two less intense peaks (158.4 and 163.6 eV) are observed to shift to lower binding energies compared to Bi2O2CO3, supporting the presence of a lower valent bismuth state (i.e. Bi2+, 158.0 and 163.3 eV)34 and/or the presence of OVs.35 This evidence confirms the formation of surface OVs on the exterior of the [Bi2O2]2+ layers (Fig. S3†). The C 1s peak of the Bi2O2CO3 material (Fig. 3c), associated with the [CO3]2− species, appears at 288.5 eV in the spectrum; this peak shifted slightly to 288.8 eV in Chol10%-Bi2O2CO3 suggesting that the electronic density of C in the CO32− layers has been slightly modified.36 An additional C 1s peak at 284.8 eV can also be deconvoluted into two signals at 284.8 and 285.6 eV, which were assigned to adventitious carbon species. In the C 1s spectrum of Chol10%-Bi2O2CO3, an additional peak is also observed at 283.7 eV, which could be attributed to the presence of residual carbon from the partial thermal decomposition of [Chol]+ moieties.37 The O 1s spectra for Bi2O2CO3 and Chol10%-Bi2O2CO3 (Fig. 3d) were deconvoluted into three distinct peaks, at 529.6, 530.6 and 531.4 eV. These peaks correspond to the Bi–O bond in [Bi2O2]2+, the C–O bond in CO32− and OVs,38 respectively. Notably, the intensity of the peak at 531.4 for Chol%-Bi2O2CO3 (13.6%) is higher in comparison to Bi2O2CO3 (5.5%), supporting the hypothesis that the use of choline hydroxide, as a structure-directing agent, induces the generation of additional OVs, which are known to play a crucial role in enhancing the photocatalytic performance of the material.
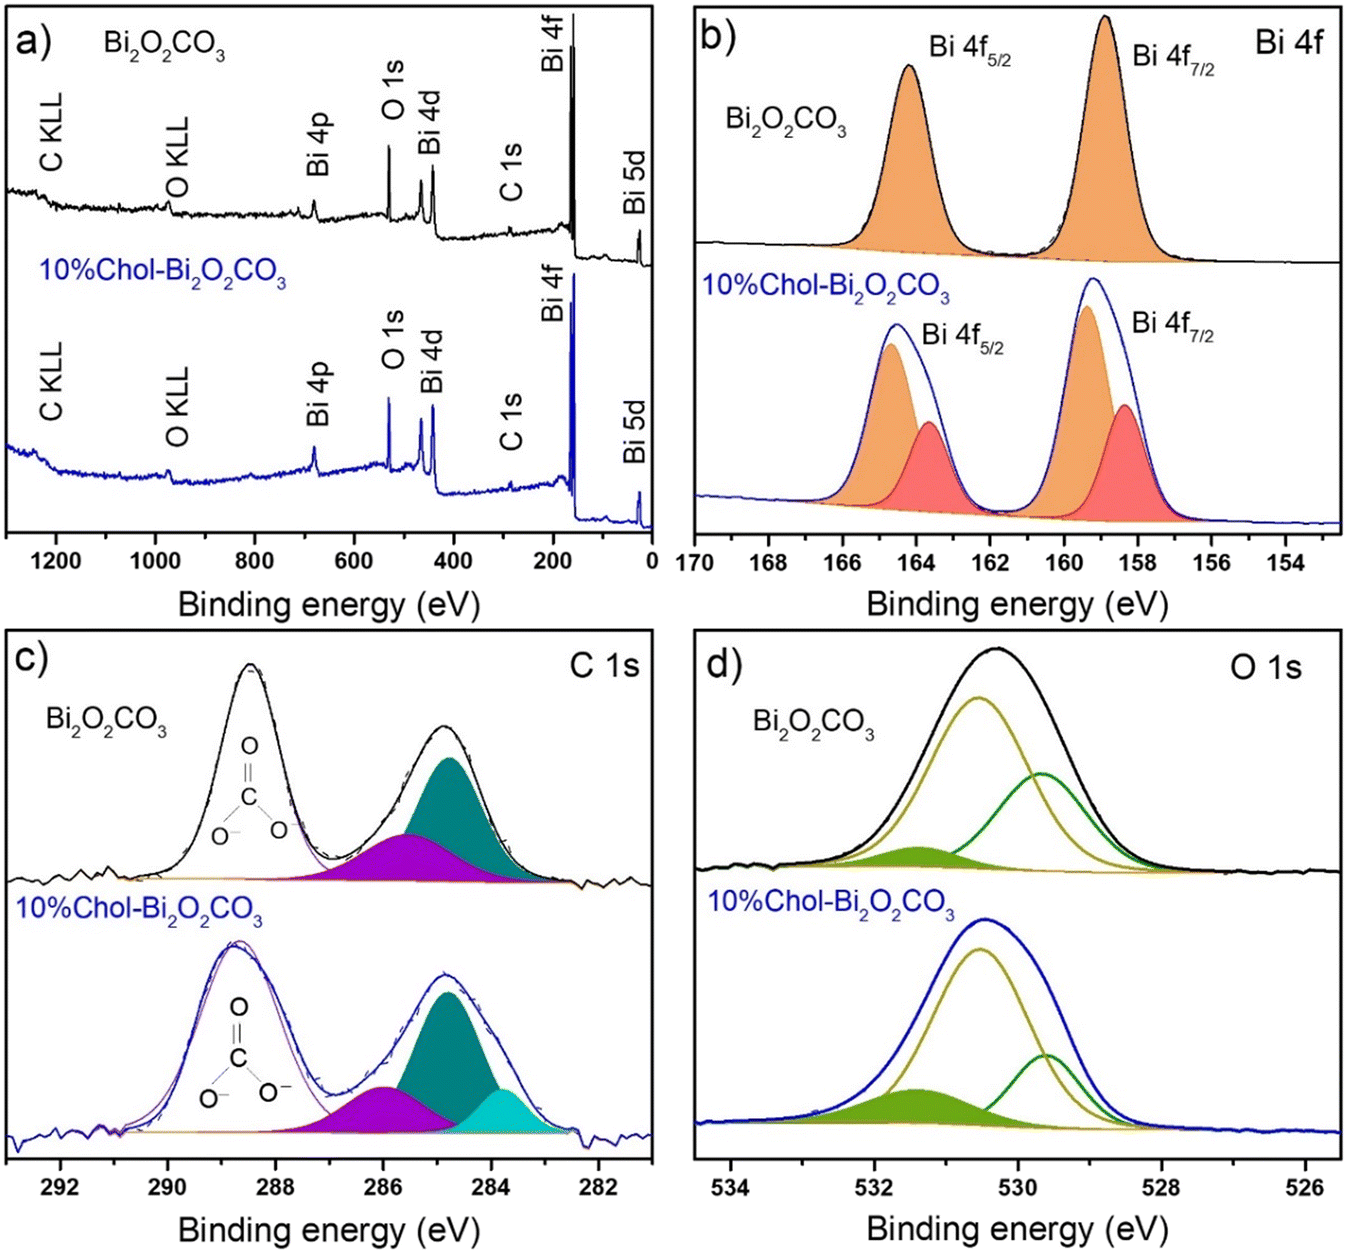 | ||
| Fig. 3 XPS for Bi2O2CO3 and Chol10%-Bi2O2CO3 samples: a) survey spectra, b) Bi 4f region, c) C 1s region and d) O 1s region. | ||
The morphology of the samples was examined by FESEM and TEM (Fig. 4). According to the FESEM images, both samples are composed of irregular nanosheets with a slight decrease in the size of the Chol10%-Bi2O2CO3 sample (Fig. 4b) in comparison with unmodified Bi2O2CO3 (Fig. 4a). Remarkably, TEM images show that the surface of the material was significantly modified by CholOH treatment as evidenced by the presence of rounded edges in the Chol10%-Bi2O2CO3 sample (Fig. 4d).
 | ||
| Fig. 4 FESEM images of a) Bi2O2CO3 and b) Chol10%-Bi2O2CO3. TEM images of c) Bi2O2CO3 and d) Chol10%-Bi2O2CO3. | ||
A high specific surface area is crucial for enhancing the adsorption capacity of materials. To assess this, N2 adsorption–desorption isotherms were measured for Bi2O2CO3-based materials. All isotherms correspond to type III of the IUPAC classification, featuring an H3 hysteresis loop (Fig. S4†). It is important to highlight that Chol10%-Bi2O2CO3 displayed the highest specific surface area, which was twice that of pure Bi2O2CO3 (22.49 vs. 11.52 m2 g−1) and slightly higher than other recently reported modified Bi2O2CO3 materials such as N-doped Bi2O2CO3 (ref. 39) (SBET = 17.13 m2 g−1), Bi2O2CO3/BOI-0.5 (ref. 40) (SBET = 15.63 m2 g−1) and Bi2O2CO3 PS (SBET = 13.87 m2 g−1).41 This result indicates that using the appropriate amount of CholOH as a structure-directing agent significantly improves the surface area.
The photoluminescence and optical properties of the Bi2O2CO3-based materials were analyzed using PL and DRUV-vis spectroscopy. All samples showed an absorption band which appears in the UV region (Fig. S5a†). Therefore, Bi2O2CO3 is classified as a direct semiconductor (n-type), thus, the band gap values were estimated using the Kubelka–Munk method, ranging from 3.24 to 3.32 eV (Fig. S5b,†Table 1). The PL spectra (Fig. S6†) revealed that bare Bi2O2CO3 exhibited the highest band intensity, while Chol10%-Bi2O2CO3 showed the lowest, indicating better separation efficiency of photogenerated electron–hole pairs in the modified system (Chol10%-Bi2O2CO3).
In addition, the electrochemical properties of the samples were examined by cyclic voltammetry (CV) and differential pulse voltammetry (DPV). The CV curves for Bi2O2CO3-modified carbon paste electrodes (CPE) (Fig. 5a) exhibited a cathodic peak associated with the reduction of Bi(III) to Bi(0) at a scan rate of 50 mV s−1. As the scan rate increases, the cathodic peak shifted to more negative potentials and the peak current increased, indicating excellent rate performance of the Bi2O2CO3 electrode, and rapid faradaic reactions. In alkaline media, Bi2O2CO3 undergoes partial dissolution as shown in eqn 1. Thus, the first step before the cathodic process involves the partial dissolution of bismuth species [Bi2O2]2+ into the ionic species BiO2−(aq), followed by its reduction to Bi0 through successive reactions involving different bismuth oxidation states. So, in the CV curve, the broad reduction peak at −0.89 V is associated with the reduction of dissolved Bi3+ species, representing the global process shown in eqn (2)
| Bi2O2CO3 + 2OH− + H2O → Bi(OH)3 + CO32− | (1) |
 | (2) |
| Bi0 → Bi+ + e− | (3) |
| 3Bi+ → Bi3+ + Bi0 | (4) |
| Bi3+ + 3OH− → Bi(OH)3 + OH− → BiIIIO2− + H2O | (5) |
 | ||
| Fig. 5 CV for Bi2O2CO3-based samples in Na2SO4 (0.2 M) measured between −1.4 and 1.0 V (V vs. Ag/AgCl/KCl) a) Bi2O2CO3, b) Chol5%-Bi2O2CO3, c) Chol10%-Bi2O2CO3 and d) Chol20%-Bi2O2CO3. | ||
The results obtained in CV studies are consistent with those obtained by DPV measurements. The DPV for unmodified Bi2O2CO3 (Fig. 6a) shows one main peak attributed to BiO2−(aq) in solution, as previously discussed. In the DPV curves for CholX%Bi2O2CO3 materials (Fig. 6b–d), a new peak is observed, which is attributed to BiO2−(ads) adsorbed species. Similar peaks, at higher potentials, have been attributed to the presence of BiO2−(ads) adsorbed species, in CV studies for Bi2O3.43 DPV can also be utilized to assess the electrochemical ion exchange performance of these electrodes in the electrolyte solution. Applying a reduction potential to the electrode, the bismuth material gains a negative charge. Consequently, sodium cations from the electrolyte (0.2 M Na2SO4) are presumably absorbed into the material to neutralize this negative charge. As mentioned above, Bi2O2CO3-based materials show substantial cathodic peaks of Bi(III) species, which may also result in the incorporation of sodium cations. According to the DPV curves, it becomes clear that the Chol10%-Bi2O2CO3 electrode shows a significantly larger redox peak area and higher current values than the others, demonstrating superior electrochemical performance and improved ion exchange performance for sodium cations. This suggests that Chol10%-Bi2O2CO3 may have more active sites for redox reactions due to the presence of OVs and a higher adsorption capacity for positively charged molecules.
 | ||
| Fig. 6 DPV for Bi2O2CO3-based samples in Na2SO4 (0.2 M) measured between −1.4 and 1.0 V (V vs. Ag/AgCl/KCl) a) Bi2O2CO3, b) Chol5%-Bi2O2CO3, c) Chol10%-Bi2O2CO3 and d) Chol20%-Bi2O2CO3. | ||
Electrochemical impedance spectroscopy (EIS) was conducted to evaluate the charge transfer kinetics at the interface between the Bi2O2CO3-modified CPE and the electrolyte solution. Fig. 7a shows that all samples display well-defined semicircles, indicating that the charge-transfer resistance is the dominant factor controlling the process. Notably, Bi2O2CO3-modified materials, with 5% and 10% of ionic liquid, exhibit a minor linear slope, suggesting that an incorporation of the appropriate amount of the ionic liquid in the material enhances the diffusion processes taking place at the electrode–electrolyte interface. Furthermore, the smaller semicircle radii in the modified materials indicate that all choline-based systems and specially Chol10%-Bi2O2CO3 possess lower resistance and more efficient charge transfer compared to bare Bi2O2CO3, which aligns well with the results and conclusions taken from DPV analysis. Additionally, an equivalent Randles model circuit was fitted for both bare Bi2O2CO3 and Chol10%-Bi2O2CO3. The equivalent circuit model consists of four elements RS, Rct, CPE, and ZW (Fig. 7b). Rs represents the resistance of the electrolyte between the reference and working electrodes and Rct reflects the resistance to the transfer of electrons at the electrode/electrolyte interface. CPE or constant phase element is used to model non-ideal capacitance behavior arising from factors such as surface roughness, non-uniformity or surface porosity of the electrode and ZW or Warburg impedance is a result of diffusion processes taking place at the electrode–electrolyte interface44Rct values are 28 kΩ and 52 kΩ for Chol10%-Bi2O2CO3 and Bi2O2CO3, respectively (Table S2†). The lower Rct value for Chol10%-Bi2O2CO3 indicates enhanced electronic and ionic conduction, factors that will notably boost the photocatalytic performance of this material.
 | ||
| Fig. 7 a) EIS plots measured for Bi2O2CO3-based samples in KOH (0.2 M) from 0.1 to 60000 Hz. b) Circuit fit of the EIS plots for Chol10%-Bi2O2CO3 and Bi2O2CO3. | ||
To gain additional insights into the interfacial electron transfer dynamics, photocurrent experiments were conducted (Fig. S7†). The Chol10%-Bi2O2CO3 sample exhibits a superior response compared to the other studied materials, indicating that more photo-induced electrons were generated by this system. This behavior supports a more effective separation of photogenerated electron–hole pairs under UV-vis light. In contrast, Chol5%-Bi2O2CO3 and Bi2O2CO3 show similar response, while Chol20%-Bi2O2CO3 exhibits the lowest response, again highlighting the influence of using an appropriate amount of ionic liquid in the preparation of the photocatalysts to improve their performance.
This electrochemical behavior together with the comprehensive characterization techniques employed previously consistently point to notable changes in the structural, optical, electronic, and electrochemical properties of the Bi2O2CO3-modified materials. The control of the ionic liquid concentration during the preparation of the nanosheets appears to be a critical factor in achieving optimal properties. In particular, the Chol10%-Bi2O2CO3 sample exhibited a unique combination of enhanced surface area, modified chemical composition, and a high density of OVs. The synergy between structure, surface composition, and defect engineering highlights the potential of Chol10%-Bi2O2CO3 as a promising candidate for application in photocatalytic degradation of pollutants. Therefore, these properties collectively will presumably contribute to its superior performance in photocatalytic processes.
3.2. Photocatalytic degradation of CIP by Bi2O2CO3-based samples
The photocatalytic activity of Bi2O2CO3-based samples was evaluated first using the antibiotic CIP as a model recalcitrant contaminant. As shown in Fig. 8a, all samples exhibited notable adsorption capacity for CIP (i.e., 49.2–86.9%). The Chol10%-Bi2O2CO3 sample demonstrated the highest adsorption capacity. It is well-established that adsorption capacity is significantly influenced by material characteristics such as specific surface area, crystalline size, morphological features, defects and surface charge, among others.45 When comparing the zeta potential of the as-prepared Bi2O2CO3 materials (Table S3†), similar values were observed for all samples (ranging from −31.5 to −35.7), suggesting that surface charge does not play a significant role in CIP adsorption. Instead, the excellent adsorption capacity of Chol10%-Bi2O2CO3 can be attributed principally to its higher specific surface area (22.49 vs. 11.52, 12.26 and 12.27 m2 g−1 for Bi2O2CO3, Chol5%-Bi2O2CO3 and Chol20%-Bi2O2CO3, respectively). Moreover, its additional defects, such as OVs introduced in Chol10%-Bi2O2CO3 further enhance its adsorption capability by presumably providing more active sites for CIP interaction. | ||
| Fig. 8 a) Removal of CIP by Bi2O2CO3-based materials and b) CIP removal by Chol10%-Bi2O2CO3 during six consecutive photodegradation cycles. | ||
Remarkably, the Chol10%-Bi2O2CO3 sample demonstrated the highest CIP removal, achieving 97.5% within just 20 min (Table S3†). The CIP removal by Chol10%-Bi2O2CO3 is higher compared to other reported Bi2O2CO3-based samples (Table S1†) such as BOC-5 (ref. 46) (86.8% within 60 min) and Br3-Bi2O2CO3 (ref. 47) (95% within 30 min). In addition, Chol10%-Bi2O2CO3 presents a higher removal capacity than TiO2-based photocatalysts (TiO2@PANI48 and 0.4%Cu–0.5%S–TiO2 (ref. 49) and composite-based photocatalysts (S-C3N4/ZnO, CeO2–Ag/AgBr, Fe3O4/g-C3N4).50–52
The removal of pollutants through an adsorption process is widely considered a cost-efficient, environment friendly and straightforward method. In this context, the regeneration capacity is an essential factor in determining the feasibility and sustainability of the adsorbent. Regeneration processes, however, are often expensive and energy-intensive, requiring high temperatures vacuum conditions, microwave irradiation and or, frequently, the use of organic solvents.53 Given the remarkable adsorption capacity of Chol10%-Bi2O2CO3 (achieving CIP removal of 86.9% in 30 min), regeneration experiments were performed using Chol10%-Bi2O2CO3 loaded with CIP. To carry out a sustainable regeneration process, the CIP-loaded sample was regenerated using a low-cost and green treatment consisting of washing the sample with a saturated NaHCO3 solution for 30 min. After the washing step, the regenerated Chol10%-Bi2O2CO3 was suspended in a fresh CIP solution and the dispersion was stirred in the dark for 30 min. The resulting adsorption rate was 0.011 mg of CIP per mg of material, recovering around 88% of the initial CIP removal efficiency. To go further in the assessment of the reusability of the system, a second and third adsorption cycles were performed under similar conditions, achieving 88% and 83% efficiency, respectively. This performance, combined with its low-cost and green regeneration strategy, positions Chol10%-Bi2O2CO3 as a promising adsorbent for sustainable water treatment applications.
The reusability of Chol10%-Bi2O2CO3 was also investigated using a combination of adsorption and photocatalytic processes (30 min in the dark and 30 min under UV-vis irradiation), without further treatment. As shown in Fig. 8b, while the CIP removal by adsorption notably decreases after the first cycle, the CIP removal efficiency by Chol10%-Bi2O2CO3 is maintained for at least 6 cycles owing to an increase in its photocatalytic activity. In other words, in the first run, CIP was mainly removed by adsorption (86.9% vs. 9.8%), whereas, by the sixth cycle, the photocatalytic degradation of the pollutant becomes the principal process (58.6% vs. 29.7%). Additionally, PXRD (Fig. S8†) and FT-IR analysis (Fig. S9†) confirmed the stability of Chol10%-Bi2O2CO3, preserving its structure after 6 cycles. These results support the possibility of using Chol10%-Bi2O2CO3 as a powerful dual-function adsorbent–photocatalyst.
3.3. Photocatalytic degradation of SMZ and BP-4 by Chol10%-Bi2O2CO3
To further evaluate the performance of Chol10%-Bi2O2CO3, its photocatalytic activity was also studied using the target contaminants sulfamethoxazole (SMZ) and benzophenone-4 (BP-4). The blank tests of SMZ and BP-4 resulted in negligible degradation, indicating the need to use reactive oxygen species (ROS). In this regard, several authors have reported the efficient removal of SMZ through a photocatalytic process combining semiconductors (Table S1†). Herein, our as-prepared single semiconductor, Chol10%-Bi2O2CO3, was able to eliminate 44.4% of SMZ in 30 min by adsorption to finally achieve a complete removal within the next 60 min under UV-vis light irradiation (Fig. 9a). This again demonstrates the promising adsorption and photodegradative ability of Chol10%-Bi2O2CO3. | ||
| Fig. 9 Photocatalytic degradation of a) SMZ and b) BP-4 using Chol10%-Bi2O2CO3. | ||
For BP-4 removal, it is important to highlight that Chol10%-Bi2O2CO3 exhibited exceptional photodegradation performance in the absence of any additional oxidant, removing BP-4, almost completely, in 180 min (Fig. 9b). The kinetic constants (k) were calculated from a pseudo-first order reaction (Fig. S10†), resulting in a high-rate constant, k = 0.053 and k = 0.014 min−1, for the degradation of SMZ and BP-4, respectively. Comparing the photocatalyst performance of Chol10%-Bi2O2CO3 with other reported photocatalysts, our material is able to remove SMZ faster than composites such as BiOBr/Bi12O17Br2 (ref. 54) and AgBr-BaMoO4 (ref. 55) with kinetic constants of 0.022 and 0.01 min−1, respectively (Table S1†). Note here that the reported photocatalysts mentioned are composed of two semiconducting materials, in contrast to the simple semiconductor Chol10%-Bi2O2CO3 reported here. Furthermore, the BP-4 removal by Chol10%-Bi2O2CO3 (UV-vis, k = 0.014 min−1) is slightly higher than that of TiO2-based nanowires56 (UV-vis/H2O2, k = 0.0129 min−1) and slightly lower compared to that using the UV/chlorine method (k = 0.02 min−1).10
3.4. Photocatalytic degradation mechanisms and pathways
To deeply understand the degradation process of CIP, SMZ and BP-4 by Chol10%-Bi2O2CO3, scavenger experiments were carried out using isopropanol (IPA), p-benzoquinone (BQ) and ascorbic acid (AA) as trapping agents for hydroxyl radicals, superoxide radicals and holes, respectively (Fig. S11a†). For CIP degradation, holes are the main active species (efficiency drops from 98.8% to 39.2% in the presence of AA) and superoxide radicals are the secondary species (a 20% reduction in the removal in the presence of BQ), while hydroxyl radicals seem to not contribute to the process. For SMZ degradation, holes and superoxide radicals are also the primary and secondary reactive species, respectively, while hydroxyl radicals also play a role in the process (removal decreases from 92.4% to 62.5%). In contrast, BP-4 degradation is affected by the presence of all scavengers, with the degradation efficiency decreasing to 21.1%, 12.3% and 0% in the presence of IPA, AA and BQ, respectively. This indicates that for an efficient degradation of BP-4 the presence of holes, superoxide radicals and hydroxyl radicals is determinant and they all play an important role in the removal process. To confirm this, EPR measurements were carried out to detect hydroxyl (·OH) and superoxide (·O2−) radicals in Bi2O2CO3 and Chol10%-Bi2O2CO3 samples. For both samples, the peaks corresponding to ·OH radicals were clearly observed after 20 min of UV irradiation, with the Chol10%-Bi2O2CO3 sample exhibiting the highest intensity (Fig. S12a†). In contrast, the typical peaks associated with the DMPO–O2·− adduct were not significantly detected in either sample (Fig. S12b†). Since photogenerated holes are involved in the formation of ·OH radicals, both holes and ·OH radicals are considered to play a major role in the photodegradation process for the Chol10%-Bi2O2CO3 sample, as previously observed by scavenger experiments.Additionally, the proposed degradation pathways for the three PPCPs were determined by HPLC/MS (Fig. S13, S15 and S17†). In the proposed degradation pathways of CIP (Fig. S14†), the CIP molecule undergoes a defluorination process (m/z = 313), followed by piperazine ring opening and loss of N atom (m/z 300).57 The fragment could evolve through two possible approaches, both involving modifications to the piperazine ring moieties, which generate the same mass (m/z = 272). CIP-4a could undergo transformation of the piperazine ring until the formation of a primary amine (m/z = 244)58 or lose the carboxylic group of the quinoline ring, leading to the formation of CIP-6 (m/z = 228). The latter could lose the amino moiety (CIP-7) and undergo cleavage and opening of the quinolone and benzene rings.59 Finally, the fragment continues its decomposition through the formation of malonic acid (m/z = 104) until mineralization (CO2 + H2O).60
In addition, three possible degradation pathways are proposed for the degradation of SMZ (Fig. S16†). In the first pathway (I), the cleavage of the S–N bond of SMZ via the hydrolysis of the sulfonamide bond generates the degradation product SMZ-1 (m/z = 99). In contrast, in pathway II, SMZ could be converted to 2,4-dinitrobenzene-sulfinic acid (SMZ-2) through consecutive ·OH attacks.61 A third possible pathway involves the cleavage of the isoxazole ring to give SMZ-3 (m/z = 215) initially, followed by the loss of the formamide group to form SMZ-5 (m/z = 172).62 An intermediate of SMX-3 undergoes loss of the amine group, giving 2-oxo-N-(phenyl sulfonyl) acetimidamide (SMZ-4) and the formamide group of SMZ-5 is oxidized to sulfonic acid (SMZ-6), which is eliminated in SMZ-7 (m/z = 125). Benzoic acid (SMZ-8) is transformed into maleic acid (SMZ-10) or phenol (SMZ-9), which can convert into malealdehyde (SMZ-12), resulting in benzene (SMZ-11). The last degradation intermediates consist of several molecules with diol groups (SMZ-13, SMZ-14 and SMZ-15).
Finally, the BP-4 degradation could follow two different pathways (Fig. S17†). In the first path, the reduction of the sulphonic group to a mercapto group leads to the formation of BP-4-1, which could be replaced by a hydroxyl group in the BP-4-2 intermediate and then evolves to BP-4-3.61 Pathway II starts with the cleavage of the molecule at the ketone group, oxidizing it to a carboxylic acid (BP-4-4). The latter could form two intermediates with the same m/z fragment (BP-4-5 and/or BP-4-6).7 BP-4-5 (m/z = 218) could generate also two possible new molecules (BP-4-7 and BP-4-8) depending on the reduction of one of the ketone groups. On the other hand, BP-4-6 leads to BP-4-9 (m/z = 184) by transforming all the functional groups of the ring and gives BP-4-10 or BP-4-11 when the formate group turns into a methoxy or a hydroxyl group, respectively. The last steps of the mechanism involve the loss of the hydroxyl groups from the phenyl ring (BP-4-12 and BP-4-13), the saturation of its bonds (BP-4-14) and its opening (BP-4-15) until the formation of the final fragment BP4-16 (m/z = 62).
The toxicity of degradation products was estimated using the Toxicity Estimation Software Tool (T.E.S.T) (Tables S4 and S5†), resulting in a low or no toxicity of the degradation intermediates. Furthermore, mineralization rates were determined for the three degradation experiments at optimized reaction times: 30 min, 60 min and 180 min, for CIP, SMZ and BP-4, respectively (Fig. S19†). The TOC removal efficiencies of the Chol10%-Bi2O2CO3 photocatalyst were remarkably high (83.3% mineralization for CIP, 75.5% for SMZ and 79.9% for BP-4), revealing its effectiveness in the photocatalytic degradation of these pollutants.
3.5. Photocatalytic degradation of CIP, SMZ and BP-4 in tap water
To further assess the applicability of Chol10%-Bi2O2CO3 under realistic conditions, the degradation of three selected target contaminants (CIP, SMZ and BP-4) was tested in tap water from Madrid (Spain), which contains various anions and cations (see Table S6†). As shown in Fig. S11b,† complete removal of CIP was achieved in both Milli-Q and tap water, indicating that the presence of ions in tap water does not affect the degradation process of CIP. In contrast, the degradation efficiency of SMZ and BP-4 significantly decreased, from 98.5% to 18% and from 92.4% to 42%, from Milli-Q to tap water, respectively. This seems to be due to the presence of the inorganic anions that could trap the reactive species involved in the degradation process. In this regard, tap water contains ions such as chlorine (Cl−), sulphate (SO4−2), and carbonate (CO3−2) (Table S6†), which have been described as scavengers of hydroxyl radicals.59 As mentioned in the previous section, hydroxyl radicals seem to play a significant role only in the degradation SMZ and BP-4, but not in the elimination of CIP (Fig. S11a†), which supports the hypothesis of hydroxyl radicals being trapped by these ions present in tap water.These results highlight the complexity of pollutant degradation in real water matrices and give an overview of the importance of understanding the interactions between inorganic ions and reactive oxygen species in the degradation of persistent pollutants in water. Despite these challenges, Chol10%-Bi2O2CO3 shows a robust performance in removing CIP and seems to offer significant potential for the degradation of other contaminants in natural water systems.
To determine the valence band potential (EVB) and conduction band potential (ECB) for Chol10%-Bi2O2CO3 and Bi2O2CO3, EIS experiments were conducted. As expected, Mott–Schottky plots of both materials exhibit positive slopes (Fig. S20†), confirming their classification as n-type semiconductors. The flat band potential was determined from the intersection of the plot with the x-axis, resulting in values of −1.44 and −1.55 V vs. Ag/AgCl (equivalent to −0.80 and −0.86 V vs. NHE) for Bi2O2CO3 and Chol10%-Bi2O2CO3, respectively.
For n-type semiconductors, the flat band potential typically aligns near the ECB. Thus, the ECB yielded values of −0.70 and −0.76 V, while EVB values (estimated from ECB = EVB − Eg) were found to be 2.62 and 2.55 V for Bi2O2CO3 and Chol10%-Bi2O2CO3, respectively. These shifts in the ECB and EVB bands might be influenced by the introduction of choline hydroxide. A proposed mechanism for both materials is illustrated in Fig. 10.
 | ||
| Fig. 10 Proposed mechanism for Bi2O2CO3 and Chol10%-Bi2O2CO3. | ||
According to the results, the superior photocatalytic performance of Chol10%-Bi2O2CO3 seems to rely on three main factors: i) its larger surface area, which enhances adsorption capacity and increases the number of active sites for photocatalysis; ii) its high density of OVs, which facilitates charge transfer and reduces the recombination of photogenerated charges; and iii) its enhanced electronic and ionic conductivity and boosted photocurrent activity which helps in the improvement of the photocatalytic efficiency.
4. Conclusions
For the first time, Bi2O2CO3 nanosheets were successfully synthesized using choline hydroxide as a structure-directing agent for water remediation. Due to the higher concentration of OVs, Chol10%-Bi2O2CO3 exhibited more efficient charge transfer and enhanced charge separation compared to pristine Bi2O2CO3, as evidenced by DPV, EIS and PL measurements. These properties highlight the potential of Chol10%-Bi2O2CO3, as a functional material capable of acting both as an adsorbent and a photocatalyst for the degradation of various PPCPs, including CIP (97.5% in 20 min), SMZ (98.5% in 60 min) and BP-4 (92.4% in 180 min), in the absence of any additional oxidant. This performance surpasses many other bismuth-based materials reported in the literature.The comprehensive mechanistic study of the degradation of pollutants in water using Chol10%-Bi2O2CO3 revealed that the position of energy bands of this material and the experiments with trapping agents make this material capable of generating both hydroxyl and superoxide radicals. This capability offers a significant advantage over other bismuth-based materials, as it allows to produce a greater variety of reactive oxygen species (especially hydroxyl and superoxide radicals, confirmed by scavenger experiments), thereby enhancing its photocatalytic activity and potential. In this sense, the TOC removal was exceptionally high, 83.3% mineralization for CIP, 75.5% for SMZ and 79.9% for BP-4.
Furthermore, Chol10%-Bi2O2CO3 has demonstrated to be a robust material, with outstanding stability (confirmed by different techniques) and excellent reusability for at least 6 consecutive degradation cycles. These results position Chol10%-Bi2O2CO3 as a reliable material for long-term photocatalytic applications.
Data availability
The data supporting this article have been included as part of the ESI.†Author contributions
Helena Pérez del Pulgar: writing – original draft, methodology, investigation, conceptualization. Josefa Ortiz-Bustos: methodology, investigation. Santiago Gómez-Ruiz: writing – review & editing, funding acquisition. Isabel del Hierro: writing – review & editing, supervision, methodology. Yolanda Pérez: writing – original draft, supervision, funding acquisition, conceptualization.Conflicts of interest
The authors declare that they have no known competing financial interests or personal relationships that could have appeared to influence the work reported in this paper.Acknowledgements
We would like to thank funding from the research project PID2022-136417NB-I00 financed by Agencia Estatal de Investigación-Ministerio de Ciencia, Innovación y Universidades of Spain MCIU/AEI/10.13039/501100011033/ and “ERDF A way of making Europe”. We would also like to thank the support of Universidad Rey Juan Carlos to our research group COMET-NANO through the project M3271.References
- E. Emmanuel, M. G. Pierre and Y. Perrodin, Environ. Int., 2009, 35, 718–726 CrossRef CAS PubMed.
- L. Pan, J. Li, C. Li, X. Tang, G. Yu and Y. Wang, J. Hazard. Mater., 2018, 343, 59–67 CrossRef CAS PubMed.
- B. Liu, W. Liu, X. Nie, C. Guan, Y. Yang, Z. Wang and W. Liao, J. Environ. Sci., 2011, 23, 1558–1563 CrossRef CAS PubMed.
- D. G. J. Larsson, C. de Pedro and N. Paxeus, J. Hazard. Mater., 2007, 148, 751–755 CrossRef CAS PubMed.
- F. A. Kibuye, H. E. Gall, K. R. Elkin, B. Swistock, T. L. Veith, J. E. Watson and H. A. Elliott, J. Environ. Qual., 2019, 48, 1057–1066 CrossRef PubMed.
- T. Simetić, J. Nikić, M. Kuč, D. Tamindžija, A. Tubić, J. Agbaba and J. Molnar Jazić, Processes, 2024, 12(6), 1156 CrossRef.
- R. Beel, C. Lütke Eversloh and T. A. Ternes, Environ. Sci. Technol., 2013, 47, 6819–6828 CrossRef CAS PubMed.
- Y. Huang, L. Luo, X. Y. Ma and X. C. Wang, Environ. Sci. Pollut. Res., 2018, 25, 32549–32561 CrossRef CAS PubMed.
- B. Imamović, P. Trebše, E. Omeragić, E. Bečić, A. Pečet and M. Dedić, Molecules, 2022, 27(6), 1874 CrossRef PubMed.
- L. Santbay, M. Kassir, R. Nassar, S. Mokh, M. Al Iskandarani and A. Rifai, Environ. Sci. Pollut. Res., 2024, 31, 31201–31212 CrossRef CAS PubMed.
- H. Liu, P. Sun, M. Feng, H. Liu, S. Yang, L. Wang and Z. Wang, Appl. Catal., B, 2016, 187, 1–10 CrossRef CAS.
- M. Peng, E. Du, Z. Li, D. Li and H. Li, Sci. Total Environ., 2017, 603–604, 361–369 CrossRef CAS PubMed.
- X. Jia, J. Jin, R. Gao, T. Feng, Y. Huang, Q. Zhou and A. Li, Chemosphere, 2019, 222, 494–502 CrossRef CAS PubMed.
- A. Ruz-Luna, M. Cruz-Yusta, M. Sánchez, L. Sánchez, B. Gámiz and I. Pavlovic, J. Environ. Chem. Eng., 2024, 12, 111709 CrossRef CAS.
- A. Chawla, A. Sudhaik, R. Sonu, P. Kumar, T. Raizada, A. Aslam Ahamad, P. Khan, Q. Van Le, V.-H. Nguyen, S. Thakur and P. Singh, Coord. Chem. Rev., 2025, 529, 216443 CrossRef CAS.
- A. Chauhan, R. Kumar, P. Raizada, S. Thakur, V.-H. Nguyen, A. Singh, Q. Van Le, P. Singh and A. Sudhaik, Coord. Chem. Rev., 2025, 535, 216634 CrossRef CAS.
- N. Shan, G. Liu, L. Li, J. Dong, B. Wang, M. Ji, H. Li and J. Xia, J. Alloys Compd., 2024, 990, 174202 CrossRef CAS.
- Q. Yang, J. Li, J. Zhong, C. Cheng, Z. Xiang and J. Chen, Mater. Lett., 2017, 192, 157–160 CrossRef CAS.
- L. Li, H. Gao, G. Liu, S. Wang, Z. Yi, X. Wu and H. Yang, Adv. Powder Technol., 2022, 33, 103481 CrossRef CAS.
- P. Chen, H. Liu, Y. Sun, J. Li, W. Cui, L. Wang, W. Zhang, X. Yuan, Z. Wang, Y. Zhang and F. Dong, Appl. Catal., B, 2020, 264, 118545 CrossRef CAS.
- X. Guo, C. Liu, W. Hu, Z. Xu, L. Lu, C. Gao and X. Li, Colloids Surf., A, 2024, 685, 133333 CrossRef CAS.
- Y. Feng, Z. Zhang, K. Zhao, S. Lin, H. Li and X. Gao, J. Colloid Interface Sci., 2021, 583, 499–509 CrossRef CAS PubMed.
- Y. Lu, Y. Huang, Y. Zhang, J. Cao, H. Li, C. Bian and S. C. Lee, Appl. Catal., B, 2018, 231, 357–367 CrossRef CAS.
- X. Li, N. Ma, L. Zhang, G. Ling and P. Zhang, Int. J. Pharm., 2022, 612, 121366 CrossRef CAS PubMed.
- B. L. Gadilohar and G. S. Shankarling, J. Mol. Liq., 2017, 227, 234–261 CrossRef CAS.
- X. Zhang, C. Li, J. Liang, J. Wang, J. Zhang, X. Chen, F. Wang and R. Li, ChemCatChem, 2020, 12, 1212–1219 CrossRef CAS.
- H. Ye, S. Sun, J. Chen, W. Zhou, M. Zhang and Z. Yuan, Environ. Sci. Pollut. Res., 2021, 28, 56003–56031 CrossRef CAS PubMed.
- F. Elhi, M. Gantman, G. Nurk, P. S. Schulz, P. Wasserscheid, A. Aabloo and K. Põhako-Esko, Molecules, 2020, 25(7), 1691 CrossRef CAS PubMed.
- D. S. Aidhy, B. Liu, Y. Zhang and W. J. Weber, Comput. Mater. Sci., 2015, 99, 298–305 CrossRef CAS.
- L. Li, H. Gao, Z. Yi, S. Wang, X. Wu, R. Li and H. Yang, Colloids Surf., A, 2022, 644, 128758 CrossRef CAS.
- H. Lu, L. Xu, B. Wei, M. Zhang, H. Gao and W. Sun, Appl. Surf. Sci., 2014, 303, 360–366 CrossRef CAS.
- P. Cruz, E. Granados, M. Fajardo, I. del Hierro and Y. Pérez, Appl. Catal., A, 2019, 587, 117241 CrossRef.
- Q. Xu, K. Su, J. Chen, Y. Zhong, Y. Zhao, M. Sun and L. Yu, Nanoscale, 2025, 17, 9588–9598 RSC.
- Y. Feng, Z. Zhang, K. Zhao, S. Lin, H. Li and X. Gao, J. Colloid Interface Sci., 2021, 583, 499–509 CrossRef CAS PubMed.
- X. Guo, C. Liu, W. Hu, Z. Xu, L. Lu, C. Gao and X. Li, Colloids Surf., A, 2024, 685, 133333 CrossRef CAS.
- J. Li, Z. Wu, S. Zhang, K. Xu, N. Ma, W. Feng, M. Wu, D. Xu, S. Zhang and J. Shen, CrystEngComm, 2022, 24, 1377–1386 RSC.
- S. Yamamoto, K. Takeuchi, Y. Hamamoto, R. Liu, Y. Shiozawa, T. Koitaya, T. Someya, K. Tashima, H. Fukidome, K. Mukai, S. Yoshimoto, M. Suemitsu, Y. Morikawa, J. Yoshinobu and I. Matsuda, Phys. Chem. Chem. Phys., 2018, 20, 19532–19538 RSC.
- L. Xue, Y. Du, X. Sun, N. Jiang, J. Qu and J. Zhao, Mater. Sci. Semicond. Process., 2022, 141, 106447 CrossRef CAS.
- Z. Yuan, L. Zhang, L. Tan, W. Chen, G. Liao, L. Li and J. Wang, Appl. Surf. Sci., 2024, 649, 159198 CrossRef CAS.
- X. Wu, N. Qin, L. Yan, R. Ji, D. Wu, Z. Hou, W. Peng and J. Hou, Front. Chem., 2023, 10, 1102528 CrossRef PubMed.
- X. Yang, Y. Wang, N. He, W. Wan, F. Zhang, B. Zhai and P. Zhang, Nanotechnology, 2020, 31, 375604 CrossRef CAS PubMed.
- V. Vivier, A. Régis, G. Sagon, J. Nedelec, L. T. Yu and C. Cachet-Vivier, Electrochim. Acta, 2001, 46, 907–914 CrossRef CAS.
- D. Lin, H. Zhang, X. An, L. Chang, A. Alameen, S. Ding, X. Du and X. Hao, Phys. Chem. Chem. Phys., 2021, 23, 8500–8507 RSC.
- M. R. d. S. Pelissari, L. Pereira Camargo, F. M. L. Pontes and L. H. Dall'Antonia, Color. Technol., 2023, 139, 742–757 CAS.
- S. M. Abegunde, K. S. Idowu, O. M. Adejuwon and T. Adeyemi-Adejolu, Resour. Environ. Sustain., 2020, 1, 100001 Search PubMed.
- L. Li, H. Gao, Z. Yi, S. Wang, X. Wu, R. Li and H. Yang, Colloids Surf., A, 2022, 644, 128758 CrossRef CAS.
- X. Hu, H. Zhao, Y. Liang and R. Chen, Appl. Catal., B, 2019, 258, 117966 CrossRef CAS.
- B. A. Prasetyo, I. Prasetyo and T. Ariyanto, Water, Air, Soil Pollut., 2023, 234, 391 CrossRef CAS.
- J. Ortiz-Bustos, S. Gómez-Ruiz, J. Mazarío, M. E. Domine, I. del Hierro and Y. Pérez, Catal. Sci. Technol., 2020, 10, 6511–6524 RSC.
- B. Gupta, A. K. Gupta, C. S. Tiwary and P. S. Ghosal, Environ. Res., 2021, 196, 110390 CrossRef CAS PubMed.
- X. Wen, C. Niu, L. Zhang, C. Liang, H. Guo and G. Zeng, J. Catal., 2018, 358, 141–154 CrossRef CAS.
- R. Liu, X. Han, R. Liu and Y. Sun, Highly selective photodegradation of ciprofloxacin by molecularly imprinted Fe3O4/g-C3N4, Mater. Lett., 2022, 325, 132811 CrossRef CAS.
- A. V. Baskar, N. Bolan, S. A. Hoang, P. Sooriyakumar, M. Kumar, L. Singh, T. Jasemizad, L. P. Padhye, G. Singh, A. Vinu, B. Sarkar, M. B. Kirkham, J. Rinklebe, S. Wang, H. Wang, R. Balasubramanian and K. H. M. Siddique, Sci. Total Environ., 2022, 822, 153555 CrossRef CAS PubMed.
- F. Wang, N. Ma, L. Zheng, L. Zhang, Z. Bian and H. Wang, Chemosphere, 2022, 307, 135666 CrossRef CAS PubMed.
- S. K. Ray, D. Dhakal and S. W. Lee, J. Photochem. Photobiol., A, 2018, 364, 686–695 CrossRef CAS.
- L. Soto-Vázquez, F. Rolón-Delgado, K. Rivera, M. C. Cotto, J. Ducongé, C. Morant, S. Pinilla and F. M. Márquez-Linares, J. Environ. Manage., 2019, 247, 822–828 CrossRef PubMed.
- M. Manasa, P. R. Chandewar and H. Mahalingam, Catal. Today, 2021, 375, 522–536 CrossRef CAS.
- E. Turiel, G. Bordin and A. R. Rodríguez, J. Environ. Monit., 2005, 7, 189–195 RSC.
- H. Pérez del Pulgar, J. Ortiz-Bustos, S. Gómez-Ruiz, I. del Hierro and Y. Pérez, Environ. Sci.: Water Res. Technol., 2024, 10, 2087–2102 RSC.
- Z. Chen, J. Liang, X. Xu, G. He and H. Chen, J. Mater. Sci., 2020, 55, 6065–6077 CrossRef CAS.
- A. Yazdanbakhsh, A. Eslami, M. Massoudinejad and M. Avazpour, Chem. Eng. J., 2020, 380, 122497 CrossRef CAS.
- S. K. Ray, D. Dhakal and S. W. Lee, J. Photochem. Photobiol., A, 2018, 364, 686–695 CrossRef CAS.
Footnote |
| † Electronic supplementary information (ESI) available. See DOI: https://doi.org/10.1039/d5ew00367a |
| This journal is © The Royal Society of Chemistry 2025 |