
 Open Access Article
 This Open Access Article is licensed under a
 Creative Commons Attribution 3.0 Unported Licence
Polystyrene nanoplastics trigger changes in cell surface properties of freshwater and marine cyanobacteria†
Nigarsan
Kokilathasan
 a,
Basirath
Raoof
a and
Maria
Dittrich
*ab
a,
Basirath
Raoof
a and
Maria
Dittrich
*ab
aBiogeochemistry Group, Department of Physical and Environmental Sciences, University of Toronto Scarborough, 1065 Military Trail, Toronto, ON M1C 1A4, Canada. E-mail: m.dittrich@utoronto.ca
bDepartment of Earth Sciences, University of Toronto St. George, 22 Ursula Franklin Street, Toronto, ON M5S 3B1, Canada
First published on 28th April 2025
Abstract
Anthropogenic pressures on aquatic ecosystems have led to threats, including nanoplastics, defined as plastic particles less than 1 μm in diameter. This is concerning as cyanobacterial abundance is expected to increase under rising temperatures and carbon dioxide levels. Cyanobacterial cell surfaces are significant in nutrient and metal uptake and cycling; negatively charged functional groups and extracellular polymeric substances (EPS) help promote calcium carbonate formation along cell surfaces. Yet, the impacts of nanoplastics on cyanobacterial physiology and surface properties remain unclear. Here, we investigated the effects of polystyrene nanoplastics on cell growth, morphology, and surface properties of marine Synechococcus sp. PCC8806 and freshwater Spirulina platensis, crucial primary producers and players in many biogeochemical processes, under environmentally relevant nanoplastic concentrations. Nanoplastic aggregation and elevated secretion of EPS minimized negative impacts on growth and morphology by reducing potential nanoplastic–cell interactions. Polystyrene nanoplastics modified cell surface compositions by increasing polysaccharide and lipid contents by up to 35% and 37% in Synechococcus and Spirulina, respectively. Additionally, cell wall thickness increased by 15–20 nm for both cyanobacterial species. Together, these findings demonstrated the impacts of nanoplastics on cell surfaces and the coping mechanisms cyanobacteria employ against polystyrene nanoplastics.
Environmental significanceWith the rapid rise of plastic production globally, there are ecological and human health concerns about the increased presence of nanoplastics within aquatic environments. Cyanobacteria and their cell surfaces provide key ecosystem services as primary producers. In this study, we examine the impacts of polystyrene nanoplastics at environmentally relevant concentrations on the physiology and cell surface properties of freshwater and marine cyanobacteria. Our findings showcased the role of extracellular polymeric substances (EPS) secretion and cell surface modifications as coping mechanisms cyanobacteria employ to mitigate any negative impacts of polystyrene nanoplastics on cyanobacterial physiology. Studying the impacts of polystyrene nanoplastics on cell surface properties can provide insights into the physiological and biogeochemical functions that cyanobacteria contribute to aquatic environments. |
Introduction
Plastic pollution, a pressing global threat, has far-reaching adverse consequences. The plastic debris, often discarded in landfills, can end up in aquatic environments through processes like surface runoff and wastewater treatment plant (WWTP) effluent.1 Within aquatic systems, plastic debris can undergo weathering processes, forming nanoplastics (NPls), plastic particles less than 1 μm in diameter.2,3 When transported into aquatic systems, NPls can also be generated from the progressive degradation of bulk plastic particles and microplastics (MPs).4 The formation processes of NPls can lead to physical and chemical heterogeneity of NPls and their environmental fate.5 The size, shape, surface charge, and chemical reactivity of NPls are influenced by their formation processes and environmental factors, i.e., pH, ionic strength, and natural organic matter. For example, weathering and fragmentation of bulk plastics increase the abundance of oxygen and hydroxyl radicals (OH·) on the plastic surface, making bulk plastics more susceptible to photodegradation and further degradation to NPls.6 Weathering of NPls by ultraviolet radiation can lead to cracks due to the oxidation of active functional groups.7 Conversely, the charge of surface functional groups on NPls and interacting environmental factors can promote or hinder aggregation.5,8 Aggregation of positively and negatively charged PS NPls was reported when exposed to sodium chloride (NaCl) greater than 5%; the hydrodynamic diameter of PS NPls increased drastically as NaCl concentrations increased.9NPls can actively interact with cyanobacterial cell surfaces. In Gram-negative bacteria, consisting of most freshwater and marine cyanobacteria, bacterial cell walls are rich in hydroxyl, carboxyl, and phosphate functional groups and contain a thin peptidoglycan layer.10 The electrostatic interactions between the bacterial cell surfaces and NPls can determine the extent of the impacts of NPls. The overall negative surface charge makes cell surfaces more susceptible to positively charged NPls.11 Cyanobacterial cell surface properties and the secretion of extracellular polymeric substances (EPS) are involved in nutrient and metal uptake, biogeochemical and metabolic processes, and aggregation and adhesion of bacterial communities to surfaces.12–14 For instance, EPS and negatively charged surface functional groups sorb metal cations such as calcium ions (Ca2+); after EPS is degraded, the release of Ca2+ may yield locally high concentrations and favor calcium carbonate (CaCO3) formation.14 Electrostatic interactions between the bacterial cell surfaces and NPls can determine the extent of the impacts of NPls. The sorption and subsequent bioaccumulation of NPls has been observed to inhibit growth rate and photosynthetic activity significantly; the decline in algal growth and photosynthetic activity of Chlorella vulgaris was related to the observed adsorption of PS NPls on microalgal surfaces.15 Additionally, the presence of NPls induces the production of reactive oxygen species (ROS), such as superoxide anion (O2·−), hydrogen peroxide (H2O2), and OH·, by disrupting the transfer of electrons to oxygen within the electron transport chain or through the oxidative degradation of NPls.16–18 ROS accumulation can damage DNA/RNA and impact the structure and functionality of the cell membrane of living organisms.19 Under the presence of NPls, cyanobacteria can secrete EPS; EPS can promote aggregation and act as a protective barrier against NPls.20
Picocyanobacteria (0.2–2.0 μm) genera Synechococcus are major primary producers in oceans and large freshwater lakes.21 Cyanobacteria genera Spirulina are widely distributed in freshwater and marine environments and are an essential source of algal biomass, pigments, and antioxidants.22Synechococcus and Spirulina are important, particularly as abundances of both cyanobacterial species are expected to increase under rising temperatures and CO2 levels.23 In addition, Synechococcus and Spirulina can combat CO2 increases in freshwater and marine environments through photosynthetic activity and CaCO3 formation along their cell surfaces, which serves as a buffer against the acidification of water bodies.24,25 With the combination and increasing nano-fractions of plastics based on future trends of bulk plastic production and degradation26,27 and increased cyanobacterial populations due to climate change, there will potentially be more interactions between NPls and cyanobacterial cell surfaces. Any slight reduction in cyanobacterial populations, primary production, or nutrient cycling by NPls will severely affect ecosystem services and functioning, zooplankton, and young fish populations.
The effects of NPls on cell surfaces remain understudied despite the importance of cyanobacterial cell surfaces. To the best of our knowledge, no studies have been documented on the detailed impact of NPls on the cell surface properties of Synechococcus and Spirulina. Furthermore, an essential aspect of interpreting laboratory studies and upscaling the findings for environmental systems is the choice of NPl concentrations reported in nature. So far, most laboratory studies have used high NPl concentrations, including studies exposing Synechococcus to NPls.2 Such concentrations would only be applicable based on future trends of plastic waste in aquatic environments. These laboratory studies may not accurately represent the environmental impact of NPls since field studies on NPls documented a range of concentrations obtained with different protocols. The lack of a defined set of protocols limits the determination of environmentally relevant NPl concentrations. However, multiple studies suggested that environmentally relevant concentrations are 2–20 mg L−1 NPls.28–31 Accordingly, we tested a concentration range of 2–20 mg L−1 at the laboratory scale to reflect concentrations that could be found in natural systems.
The objective of this study is to examine the effects of polystyrene (PS) NPls at environmentally relevant concentrations on the cell growth, morphology, and surface properties, such as surface charge and composition of marine Synechococcus PCC8806 (henceforth referred to as PCC8806) and freshwater Spirulina platensis (Spirulina). We hypothesize that the interactions between NPls and cell surfaces will decrease cell growth and deform cell morphology. As a response to PS NPls, cells will secrete EPS. The interactions between PS NPls and cell surfaces, supposedly dependent on environmental pH, will alter the composition of cell surface functional groups (i.e., favoring one surface macromolecule over another) and decrease negative surface charge. This will influence the cycling of nutrients and metals like carbon via CaCO3 formation and primary productivity. To test the hypothesis, we analyzed growth rates and overall cell surface charge of cells exposed to NPls, whereas various spectroscopic methods such as Attenuated total reflectance Fourier-transform infrared spectroscopy (ATR-FTIR) and X-ray spectroscopy (XPS) were used to assess the changes in the composition of surface functional groups. EPS was characterized and visualized with laser scanning confocal microscopy (LSCM). Finally, we visualized morphology for potential interactions between NPls and cell surfaces using scanning electron microscopy (SEM) and transmission electron microscopy (TEM). PS was chosen as it is a synthetic, resilient thermoplastic polymer widely used in tableware and packaging and represents the most commercially available form of synthetic NPls.32 Notably, almost half of NPl toxicological studies (∼48%) are performed with PS NPls, notwithstanding the prevalence of different plastic polymers that comprise more of the total plastic produced globally than PS.28 Nevertheless, any observed impacts on cell physiology and surface properties can be generalized to other NPl polymers as the primary mode of interaction is via sorption of NPls onto cell surfaces.
Methods
Characterization of PS NPls
Synthetic 600 nm diameter PS NPls were purchased from Sigma-Aldrich as 10% solids aqueous solutions with a density of 1.05 g mL−1. The stock PS NPls underwent dialysis under ambient conditions against 400 mL deionized (DI) water for five days using benzoylated dialysis tubing with a molecular weight cut-off of 2000 in 500 mL beakers. This was done to circumvent any potential influences from the presence of additives and/or surfactants that could amplify the impacts of PS NPls. The DI water was replaced daily throughout the dialysis process.The morphology of PS NPls was characterized using TEM (Hitachi H-7500, Tokyo, Japan) at an accelerating voltage of 80 kV. Samples were sonicated, vortexed, and suspended in DI water and then dried at room temperature on carbon-coated 200 mesh copper grids. Particle size analysis of the PS NPls was performed using ImageJ software on the TEM images.
Zeta potential (ZP) and hydrodynamic diameter (HD) values of the three PS NPl concentrations (2, 10, and 20 mg L−1) in the two growth media (ASN-III and Zarrouk) and DI water were measured using a NanoBrook Omni (Brookhaven Instruments, Holtsville, NY, USA). Furthermore, ZP measurements of 2, 10, and 20 mg L−1 PS NPls in 0.1 M NaNO3 at pH values ranging from 4 to 10 were performed. The pH values were chosen to reflect natural and predicted conditions.33 The pH was adjusted using 0.1 M HCl or 0.1 M NaOH. Samples were vortexed before each measurement and were measured at 25 °C. Measurements were performed as triplicates with three measurements per replicate (n = 9). Particle number concentrations of 2, 10, and 20 mg L−1 PS NPls were calculated (see ESI†).
Cyanobacterial cell cultures
Synechococcus sp. PCC8806 (NCBI: txid195249; accession number: AF448077), isolated from a lagoon in Port-Gentil, Gabon, was received from the Pasteur Culture Collection. Spirulina platensis LB 2340 (NCBI: txid1521533; accession number: DQ39280), isolated from Natron Lake in Chad, was obtained from the University of Texas (UTEX) Austin Culture Collection of Algae. PCC8806 was grown in ASN-III medium under a constant light intensity of 38 ± 3 μE m−2 s−1 (HOBO Micro Station H21-002 light sensor), room temperature (24 ± 1 °C), and shaken at 130 rpm continuously. Spirulina was grown in Zarrouk medium under continuous light intensity (29 ± 7 μE m−2 s−1), temperature (33 ± 1 °C), and shaken at the same speed as PCC8806. See ESI† for culture media composition. All culture media were prepared using autoclaved DI water; glassware was washed with 5% (v/v) nitric acid (HNO3), followed by rinses with Milli-Q grade water (18.2 MΩ cm). Rinsed glassware was autoclaved before exposure experiments.Cell count calibration curves were constructed for PCC8806 and Spirulina based on optical density (OD) readings (Fig. S1†). OD readings were measured at 680 nm for Spirulina and 650 nm for PCC8806 using a GENESYS 10S ultraviolet-visible (UV-Vis) spectrophotometer (Thermo Fisher Scientific, Waltham, MA, USA). OD 650 and OD 680 were chosen as they represent the number of living cyanobacterial cells with chlorophyll pigments on their intact cell surfaces.12 The cell count calibration curves were based on previous studies of the strains from our research group.24,34,35 The validation arises from plotting the cell numbers against the OD readings.
Exposure of cyanobacteria to PS NPls
PCC8806 and Spirulina were grown in 125 mL flasks containing 75 mL ASN-III and Zarrouk media with an initial cell count of 2.8 × 10⁶ cells per L and 1.1 × 10⁵ cells per L, respectively. Cultures were inoculated from parent cultures at the early exponential phase. The cyanobacteria were then exposed to environmentally relevant PS NPl concentrations (2, 10, and 20 mg L−1), with a negative control of 0 mg L−1. We chose these environmentally relevant NPl concentrations based on predicted and previous MP and NPl studies ranging from 0.01 to 100 mg L−1.28 Each experimental condition had three independent replicates with separate cultures and was exposed to the same growing conditions described above. Each replicate was spaced sufficiently to avoid overshadowing or interferences amongst the flasks. Experiments were conducted at the Biogeochemistry Lab at the Department of Physical and Environmental Sciences at the University of Toronto, Scarborough (43°47′14′′ N, 79°11′26′′ W).OD readings were conducted daily until the cells reached the stationary phase, at 60 days for PCC8806 and 27 days for Spirulina. The OD readings of the PS NPls in the growth media were subtracted from the OD readings of the cells exposed to PS NPls. Average specific growth rates were obtained from Gompertz model curve fitting using cell counts. Visualization of morphology and ultrastructure and measurement of cell surface properties were performed at the exponential growth phase, at 48 and 12 days of exposure for PCC8806 and Spirulina, respectively.
To avoid potential contamination from environmental NPls or MPs, cotton lab coats and powder-free nitrile gloves were worn throughout the experiments. In a biosafety cabinet, measurements and sample preparation involving cyanobacteria were performed under sterile conditions (using sterile glassware) within a biosafety cabinet. Benches and surfaces were cleaned and disinfected with 70% (v/v) ethanol.
Scanning electron microscopy and transmission electron microscopy
To visualize cell morphology under the presence of PS NPls, cell suspensions were centrifuged at 10![[thin space (1/6-em)]](https://www.rsc.org/images/entities/char_2009.gif) 610 × g for 10 min at room temperature; the growth medium was discarded. The pellets were washed four times with Milli-Q water before being fixed with 2% (wt/vol) glutaraldehyde in 0.1 M sodium cacodylate (pH = 7.4) for two hours at 4 °C in the dark. After the incubation, the pellets were washed twice with Milli-Q water and filtered through 0.2 μm black polycarbonate (PC) filters.13,36 The filters were air-dried overnight, mounted on metal stubs, and sputter-coated with gold. SEM images were obtained on a field-emission SEM (FESEM; Hitachi SU-7000, Tokyo, Japan) using an acceleration voltage of 1.5 kV.
610 × g for 10 min at room temperature; the growth medium was discarded. The pellets were washed four times with Milli-Q water before being fixed with 2% (wt/vol) glutaraldehyde in 0.1 M sodium cacodylate (pH = 7.4) for two hours at 4 °C in the dark. After the incubation, the pellets were washed twice with Milli-Q water and filtered through 0.2 μm black polycarbonate (PC) filters.13,36 The filters were air-dried overnight, mounted on metal stubs, and sputter-coated with gold. SEM images were obtained on a field-emission SEM (FESEM; Hitachi SU-7000, Tokyo, Japan) using an acceleration voltage of 1.5 kV.
To visualize the ultrastructure, the cell suspensions were centrifuged and washed four times in Milli-Q water before being fixed with 2% (wt/vol) glutaraldehyde in 0.1 M sodium cacodylate (pH = 7.4) overnight at 4 °C in the dark.37 The cell pellets were then embedded in 12% (wt/vol) gelatin and rinsed three times in 1× phosphate buffer saline (PBS) washing buffer (pH = 7.4). After the rinses, the cell pellets were fixed with 1% (wt/vol) osmium tetroxide in the washing buffer for two hours at room temperature. Following the fixation, the cell pellets underwent a graded ethanol dehydration series (50%, 70%, 95%, and 100% ethanol). The pellets were infiltrated under various ratios of 100% ethanol–Spurr resin (5:1, 3:1, 1:1, 1:3, 1:3, pure resin, and pure resin) before being embedded in fresh resin. After embedding, thin sections were cut by a DiATOME Ultra 45° diamond knife under a Leica Ultracut UCT ultramicrotome microscope and mounted on copper grids. The grids were stained with uranyl acetate and lead citrate and dried for electron contrast in TEM images. TEM images were taken on a Hitachi H-7500 TEM, using an accelerating voltage of 80 kV. As a control, 2 mL of stock PS NPls underwent the same sample preparation. Cell wall thickness was measured from the TEM images using ImageJ.
Filters and grids were stored within plates to mitigate any dust and/or NPls/MP deposition from the surroundings.
Analysis of cyanobacterial cell surface properties
Once the OD readings were taken, cell pellets at the exponential phase were harvested and centrifuged at 10610 × g for 10 min at room temperature; the growth medium was discarded. Afterward, the pellets were washed once in Milli-Q water and resuspended in 0.001 M ethylenediaminetetraacetic acid (EDTA). The washing procedure was repeated four times under the same conditions. The washed pellets were transferred to sterile ceramic crucibles and freeze-dried overnight at −50 °C using a FreeZone 2 freeze dryer (Labconco, Kansas City, MO, USA). The freeze-dried biomass was stored at −20 °C before ZP measurements were performed.
ZP measurements were conducted by resuspending 0.1 mg dried bacteria per mL in 0.1 M sodium nitrate (NaNO3); 0.1 M NaNO3 was selected as the background electrolyte. After the OD readings were measured, the pH was adjusted (pH 4–10) using 0.1 M HCl or 0.1 M NaOH, and the bacterial solution was equilibrated for 1–1.5 hours.38 Measurements were performed in triplicate with five measurements per replicate (100 runs at a temperature of 25 °C) at pH 4–10. Samples were shaken and vortexed before each measurement. Based on the observation under epifluorescence microscopy, most freeze-dried cells maintain their morphology. Therefore, the ZP measured originated from freeze-dried cells.
ATR-FTIR spectra serve as a valuable tool in our research, providing crucial information on the presence of functional groups associated with macromolecules present on cell surfaces. These macromolecules, mainly comprised of carbohydrates/polysaccharides, nucleic acids, proteins, and lipids, are pivotal in determining cell surface functionality and stability. ATR-FTIR (Bruker Ltd., ON, CA) equipped with a single reflection diamond crystal and operating with the OPUS software (v. 7.5 and 8.5) was used to analyze the impacts of NPls on cell surfaces. The diamond crystal was cleaned with ethanol, and a background spectrum (accumulation of 256 scans) of only the diamond crystal was performed before placing the freeze-dried cells. All measurements were conducted at room temperature, and data were collected from the accumulation of 256 scans from 1800–600 cm−1 with a spectral resolution of 1 cm−1. ATR-FTIR spectra of the freeze-dried cells were taken for each control and NPl treatment group replicate. The averaged ATR-FTIR spectra (as triplicates) were baseline-corrected and normalized to the amide II band. Deconvolution of peak area at ∼990 cm−1 and ∼1656 cm−1 (representative of polysaccharides and proteins, respectively) was determined using the Peak Deconvolution app within the OriginPro software (OriginLab Corporation, Northampton, Massachusetts, USA). Peak area ratios at ∼990 cm−1 and ∼1656 cm−1 were calculated between the peak area of the NPl-exposed samples and the peak area of the control sample.
Complementary information about cell surfaces under NPl exposure was obtained using XPS. XPS Analyses were conducted on the freeze-dried cell biomass using a Thermo Scientific K-Alpha photoelectron spectrometer with monochromatized A1 Kα X-ray radiation (nominal 400 μm spot, 10 μm area of analysis). XPS analysis was also done on freeze-dried PS NPls. Individual peak and survey analyses were obtained for each sample (as duplicates) with a pass energy of 150 eV and 0.2 eV step. High-resolution spectra of carbon (C1s), oxygen (O1s), and nitrogen (N1s) were measured using a pass energy of 50 eV and 0.1 eV step. To fix the C1s component to C–C bonds, 284.8 eV was set as the binding energy scale. In addition, the O1s components were adjusted to exclude the sodium auger peak present due to the washing procedure. XPS technique collects information only from the outermost molecular layers of the surface (2 to 5 nm) due to inelastic scattering of electrons in the sample. Avantage software was used to fit the XPS spectra peaks. The atomic concentration ratios were calculated based on the fitting of the peak areas normalized to the basis of the acquisition parameters and sensitivity factors provided by the manufacturer. Refer to ESI† for details on the deconvolution of carbon, nitrogen, and oxygen peaks and their functional group assignments.
The surface composition of cell walls can be presented based on three classes of essential constituents: polysaccharides, hydrocarbon-like compounds (lipids), and peptides (proteins). Compounds such as peptidoglycans are considered a combination of peptides and polysaccharides.34 This corresponds to C6H10O5 for polysaccharides and CH2 for hydrocarbon-like compounds. The weight fraction ratios of protein (CPr/C), polysaccharide (CPS/C), and hydrocarbon-like compounds (CHC/C) to total carbon were estimated from the XPS analyses according to the following equations:39
| [N/C]obs = 0.279(CPr/C) | (1) |
| [O/C]obs = 0.325(CPr/C) + 0.833(CPS/C) | (2) |
| 1 = (CPr/C) + (CPS/C) + (CHC/C) | (3) |
EPS measurements and visualization
Cell suspensions were preserved in 4% buffered paraformaldehyde (containing 1% sodium dodecyl sulfate) in 1× PBS (pH = 7.4) and stored in −20 °C before EPS extraction and visualization. Cell suspensions were transferred to 1.5 mL microcentrifuge tubes and centrifuged at 11648 × g for 10 min to remove the preservative and growth medium. Afterward, the cell pellets were washed three times with 1× PBS.
EPS was extracted according to Khatiwada et al.40 Briefly, 1.5 mL of 0.9% (wt/vol) NaCl was added to the cell pellets; the samples were then incubated in an 80 °C water bath for 30 min with moderate shaking conditions. After cooling the samples to room temperature for 30 min, they were centrifuged at 7455 × g for 10 min, and the supernatant was collected. Total polysaccharide content was determined using the phenol-sulfuric acid method.41 50 μL of the supernatant was added to a 96-well plate, followed by 150 μL of concentrated sulfuric acid and 30 μL of 5% (v/v) phenol. The microplate was placed in a water bath at 90 °C for 5 min and then cooled down at room temperature for 5 min. The microplate was reheated and cooled to room temperature. Once dried, the absorbance of the solution was recorded at 490 nm spectrophotometrically. Blank samples were prepared using DI water instead of the supernatant. Calibration curves were constructed using different glucose concentrations (mg L−1) as a standard. Measurements were performed with three measurements per replicate.
Calcofluor white was used to stain (exo)polysaccharides within EPS and cells, specifically β-D-glucopyranose polysaccharides.42 After preserving and washing the cells with 1× PBS, the samples were stained with 100 μL of 300 mg L−1 calcofluor white (dissolved in water) and incubated at room temperature for 30 min in the dark. The stained cells were washed two times using 1× PBS to remove any excess stains before preparing glass slides. The samples were observed under LSCM (Leica Stellaris, Wetzlar, Germany). The excitation/emission wavelengths of cells and calcofluor white were 570/680 nm (red) and 405/435 nm (blue), respectively. Images were taken using a 63×/1.40 (numerical aperture) oil lens with a pinhole of 95.5 μm.
Blue fluorescence represents polysaccharides, and red fluorescence represents chlorophyll. Within the overlay images, a purple fluorescence signal indicates a higher fluorescence intensity of polysaccharides than the chlorophyll fluorescence signal, likely EPS coating the cells. A pink fluorescence signal represents a lower concentration of EPS coating cell surfaces.
Statistical analysis
Standard deviations and standard errors for the three independent replicates were calculated using the OriginPro 2024b software. The normality of the data was tested using the Shapiro–Wilk test. Statistical analysis was performed using one-way analysis of variance (ANOVA) followed by post hoc Tukey's honest significant difference (HSD) test. The homogeneity of variance was tested using the Brown–Forsythe test. Statistical significance was defined as p < 0.05.Results and discussion
Characterization of PS NPls under freshwater and marine conditions
TEM images showed PS NPls with an average particle diameter of 549.5 ± 25.6 nm (Fig. 1a and S2†), a significant discrepancy from the manufacturer's reported diameter. A significant difference in average ZP and HD values of PS NPls was observed in ASN-III, Zarrouk, and DI water (Fig. 1b and c). The higher HD values indicate aggregation compared to the nominal size of PS NPls (549.5 ± 25.6 nm). | ||
| Fig. 1 Visualization and measurements of PS NPls in growth media and DI water. a. TEM image of 10 mg L−1 PS NPls in DI water. Average b. ZPs and c. HDs of the three PS NPls concentrations in ASN-III (MM), Zarrouk (FM), and DI water. ZPs and HDs of PS NPls in DI water were measured as a control. Values are shown as mean ± standard deviation (SD), n = 9. Different letters indicate significant differences between treatments (p < 0.05). | ||
The positive trend in ZPs and higher HDs can be attributed to the solution's ionic strength; the ionic strength of ASN-III is higher than the ionic strength of Zarrouk and DI water. Based on the Derjaguin–Landau–Verwey–Overbeek (DLVO) theory, a higher ionic strength reduces the stability of individual particles and decreases electrostatic repulsion between negatively charged PS NPls due to electrostatic charge screening of the NPls' surfaces and compression of the electrical double layer.43 Charge neutralization by cations produces a less negative ZP due to the screening of negatively charged surfaces.9 Thus, the more positive ZP of 20 mg L−1 NPls in ASN-III (−14.31 ± 0.96 mV) compared to the ZPs in Zarrouk (−29.39 ± 1.69 mV) and DI water (−48.09 ± 1.63 mV) at the same NPl concentration (Fig. 1b) illustrates the influence of electrostatic charge screening.
The compression of the electrical double layer promotes the aggregation and sedimentation of PS NPls, thereby increasing HD via van der Waals interactions.1 Indeed, we observed significantly higher HDs for 2, 10, and 20 mg L−1 PS NPls in ASN-III (1626.59 ± 116.43 nm, 806.75 ± 17.55 nm, and 614.51 ± 12.70 nm, respectively) compared to Zarrouk and DI water (Fig. 1c; p < 0.05). Likewise, in Schmidtmann et al.,44 the aggregation and sedimentation of 1 μm PS MPs in 10 mM NaCl were reported despite highly negative ZPs. Additionally, the HDs of PS NPls in DI water were similar to the nominal size of PS NPls. Individual particles remain stable due to electrostatic repulsion at high positive or negative ZPs: ZPs higher than 30 mV or lower than −30 mV.32 This scenario applies to environments with low ionic strength, i.e., freshwater environments.45 Therefore, we expect PS NPls to persist mainly as individual particles in freshwater environments, whereas, in marine environments, we expect PS NPls to form agglomerates. Furthermore, our findings suggest that the formation and sedimentation of agglomerates potentially mitigate the effects of PS NPls on aquatic biota more in marine than in freshwater environments. Combined with other environmental factors such as dissolved organic matter, this has implications for the fate, stability, and transport of NPls in aquatic environments and the extent of their impacts on cyanobacterial cell surfaces. Since agglomerates of PS NPls will eventually settle to the sediment, this removal of PS NPls in the water column will reduce the likelihood of NPl exposure to cyanobacteria.
Electrostatic interactions between NPls also depended on pH conditions. Under a constant electrolyte, 0.1 M NaNO3, we recorded significant differences in the average ZPs of 2, 10, and 20 mg L−1 PS NPls at pH 4–10 (Fig. S3†). The HDs of 2, 10, and 20 mg L−1 PS NPls in 0.1 M NaNO3 were comparable at pH > 5 and higher than the nominal size of PS NPls (p < 0.05). For example, at pH 7, the HDs of 2, 10, and 20 mg L−1 PS NPls were 698.50 ± 23.53 nm, 723.34 ± 8.09 nm, and 729.61 ± 5.29 nm, respectively. The surface functional groups on NPl surfaces can become protonated or deprotonated depending on the pH and their acidity constants (pKa), resulting in different ZPs.12,46 Changes to pH will influence the degree of charge screening and suppression of the electrical double layer, thereby promoting agglomeration.45
PS NPls did not impact cell growth, morphology, and ultrastructure
We reported no statistically significant difference in the specific growth rates between the control PCC8806 and Spirulina cells and those exposed to PS NPls (Table 1; p > 0.05). Therefore, PS NPls did not inhibit the specific growth rates of PCC8806 and Spirulina at the tested concentrations, contrary to what we hypothesized. Moreover, under PS NPl exposure, the cell morphology and ultrastructure of PCC8806 and Spirulina remained unchanged when exposed to the tested concentrations (Fig. 2 and S4†). These results are consistent with previous studies involving Synechococcus and other cyanobacteria that reported no impact on cell growth and morphology.13,47–49 For instance, no significant effect on cell growth was observed for Microcystis aeruginosa after PS NPl exposure for 30 days.50 Another study reported stagnant growth and no changes in the cell morphology of marine Syn. PCC7002 after seven days of 500 mg L−1 PS NPl exposure.51 Yet, the sorption and subsequent bioaccumulation of NPls are expected to inhibit cyanobacterial growth and deform cell morphology. A decrease in cell growth, fragmentation, and loss of cellular integrity was observed in Spirulina exposed to 10 mg L−1 PS NPls for 20 days.52| PS NPl concentration (mg L−1) | PCC8806 (k ± S.E.) | Spirulina (k ± S.E.) |
|---|---|---|
| 0 | 0.074 ± 0.005a | 0.128 ± 0.015a |
| 2 | 0.079 ± 0.005a | 0.128 ± 0.022a |
| 10 | 0.078 ± 0.005a | 0.169 ± 0.023a |
| 20 | 0.079 ± 0.007a | 0.149 ± 0.016a |
 | ||
| Fig. 2 Morphology of PCC8806 and Spirulina exposed to PS NPls. SEM images of PCC8806 and Spirulina cells at the exponential phase: a and b. control, c and d. with 2 mg L−1 PS NPls, e and f. with 10 mg L−1 PS NPls, g and h. with 20 mg L−1 PS NPls. Surface interactions between PS NPls and cyanobacterial cells were observed. The arrows indicate the presence of PS NPls and EPS. | ||
Homo-agglomeration (refers to the aggregation of two or more identical colloidal particles) of PS NPls and cells could explain the lack of impacts on cell growth, morphology, and ultrastructure.53 Given the ionic strength of the media, NPls can agglomerate due to the charge screening and compression of the electrical double layer. Eventually, the agglomerates will sediment, thereby reducing the bioavailability of NPls to cells. In addition, large agglomerates of PS NPls have a lower surface area than their single particle counterparts, reducing the contact area and lessening any damage to cell surfaces.54 Our results are consistent with previous studies.9,20,54 For instance, Bergami et al.55 observed no significant impact on the cell growth of marine green microalga Dunaliella tertiolecta after exposure to 10–40 mg L−1 negatively charged carboxylate-modified PS NPls. They attributed the lack of effects to the strong aggregation patterns and reduced bioavailability of negatively charged PS NPls in the growth medium. The homoagglomeration of cells was observed, especially for PCC8806 exposed to PS NPls (Fig. 2). More than eight cells of PCC8806 were agglomerated (Fig. 2a, c, e and g); as Spirulina cells are large and filamentous, on the Fig. 2d and h, one cell was observed far away from the second cell. The homo-agglomeration of cells would reduce the surface-to-volume ratio and result in fewer cell-PS NPl agglomerates.20,54 Still, the lack of changes in cell morphology and internalization of PS NPls despite the sorption of NPls could be attributed to electrostatic repulsion exerted by the negatively charged functional groups on cyanobacterial cell surfaces. Nonetheless, the sorption of NPls will elicit a reaction to cell surfaces, including changes in the composition of functional groups.
Sorption of PS NPls altered cyanobacterial surface composition
The net negative surface charge of PCC8806 and Spirulina and the downward trend of ZP at pH 4–10 indicate the dominance of acidic functional groups (Fig. 3).10 The surfaces of Synechococcus are known to be dominated by acidic carboxylic and phosphoric functional groups.12,24 Acidic functional groups deprotonate when the pH becomes more basic, resulting in a net negative surface charge. | ||
| Fig. 3 Surface charge of PCC8806 and Spirulina under PS NPl exposure. Effects of PS NPls on the ZPs of a. PCC8806 and b. Spirulina cells at the exponential phase in 0.1 M NaNO3 at pH 4–10. Values are shown as mean ± SD, n = 15. Statistical significance is defined as p < 0.05. | ||
PS NPls significantly altered the surface charge of PCC8806 at pH 4–10 (Fig. 3a; p < 0.05); this is supported by SEM imagery (Fig. 2). At pH 7, the ZPs of PCC8806 10 and 20 mg L−1 (−16.73 ± 0.70 mV and −20.12 ± 0.69 mV) were significantly lower than the control (−13.44 ± 0.97 mV). A decreased negative ZP with increasing NPls concentrations indicates interactions between cell surfaces and PS NPls, as the sorption of negatively charged NPls blocks positively charged surface functional groups. This blockage and subsequent charge screening increases the proportion of negatively charged groups, thereby influencing cyanobacterial surface charge and promoting electrostatic repulsion. Considering the significance of cyanobacterial surface functional groups, any changes to the surface charge by the sorption of NPls will impact nutrient and metal uptake and cycling.25,46 In particular, any inhibition in the uptake of trace and heavy metals by negatively and positively charged binding sites by bacterial surfaces, especially of dominant cyanobacterial species like Synechococcus, will have drastic consequences in primary productivity and growth of higher trophic-level organisms.56,57
Moreover, the compression of the electrical double layer and sorption of opposite charge ions, particularly under high ionic strength, can reduce ZPs by promoting more NPl–cell surface interactions.11 Similar hypotheses have been proposed to explain the drop in the ZPs of Gram-negative bacteria Klebsiella pneumoniae and green algae Scenedesmus exposed to negatively charged NPls.17,32 Furthermore, the ZPs of PCC8806 significantly decreased as PS NPl concentrations increased. A ZP dependence on PS NPl concentrations lets us assume that increasing particle concentration would enable more sorption and blockage of positively charged functional groups on cell surfaces.
Interestingly, the ZPs of Spirulina were found to be exclusively altered at lower pH values (pH 4–6) by PS NPls (Fig. 3b; p < 0.05), contrary to the significant decrease in the ZPs of PCC8806 by the presence of PS NPls at pH 4–10. Our results indicate a considerable pH dependence on the impacts of NPls on the surface properties of Spirulina. This pH dependence for cell–NPl interactions carries profound implications for cyanobacterial adaptation to plastic pollution in the face of globally changing aquatic environments. The pH of natural waters ranges from pH 2–12, depending on the buffering capacities of water bodies and dissolved organic matter; fluctuations in pH values can occur during periods of high primary productivity and acidification.58 The phenomenon of pH homeostasis, which regulates differences in intracellular and extracellular pH, is primarily maintained by channeling cations like sodium (Na+) and Ca2+ through cell membranes and begins with the sorption of cations onto cell surfaces.46,59 Sorption of NPls would block channel proteins, hindering pH homeostasis and resulting in more susceptibility to cell lysis. Further consequences of the presence of NPls include impacts on the uptake and transport of metals and nutrients, i.e., phosphorus (P) and cyanobacterial-induced CaCO3 formation, as both are linked to cell surfaces.34,46 We hypothesize that surface-driven cyanobacterial CaCO3 precipitation will also be affected by NPls.
The ATR-FTIR spectra of PCC8806 exhibited strong peaks associated with polysaccharides, including peaks at ∼990 and ∼1040 cm−1 relating to C–O and C–C stretching and at ∼1150 cm−1 for C–O stretching in glycosidic bridges (Fig. 4a). Peaks associated with proteins were also observed, including peaks at 1536 cm−1 (N–H bending, C–N stretching, and C![[double bond, length as m-dash]](https://www.rsc.org/images/entities/char_e001.gif) O stretching) and ∼1656 cm−1 (CO stretching) of amides in proteins (Table S2†). Similar findings have been reported in Paulo et al.;34 peaks associated with polysaccharides (i.e., at ∼1000 cm−1) and proteins (i.e., at ∼1650 cm−1) were observed within the ATR-FTIR spectra of PCC8806 grown under different P concentrations. The ATR-FTIR spectra of Spirulina revealed strong peaks relating to proteins (Fig. 4b). This includes peaks at ∼1650 cm−1 and ∼1540 cm−1 corresponding to amide I and II, respectively. Broad bands were detected within the polysaccharide region, such as at ∼990 and ∼1150 cm−1, corresponding to C–O stretching and C–C of pyranose (Table S3†). The obtained ATR-FTIR spectra of Spirulina are consistent with a previous study by Kavitha et al.,60 where strong peaks associated with amide I and II bands and C–O stretching (1070 cm−1) of glycogen were observed. Minor nucleic acid and lipids peaks were also discovered in PCC8806 and Spirulina ATR-FTIR spectra.
O stretching) and ∼1656 cm−1 (CO stretching) of amides in proteins (Table S2†). Similar findings have been reported in Paulo et al.;34 peaks associated with polysaccharides (i.e., at ∼1000 cm−1) and proteins (i.e., at ∼1650 cm−1) were observed within the ATR-FTIR spectra of PCC8806 grown under different P concentrations. The ATR-FTIR spectra of Spirulina revealed strong peaks relating to proteins (Fig. 4b). This includes peaks at ∼1650 cm−1 and ∼1540 cm−1 corresponding to amide I and II, respectively. Broad bands were detected within the polysaccharide region, such as at ∼990 and ∼1150 cm−1, corresponding to C–O stretching and C–C of pyranose (Table S3†). The obtained ATR-FTIR spectra of Spirulina are consistent with a previous study by Kavitha et al.,60 where strong peaks associated with amide I and II bands and C–O stretching (1070 cm−1) of glycogen were observed. Minor nucleic acid and lipids peaks were also discovered in PCC8806 and Spirulina ATR-FTIR spectra.
 | ||
| Fig. 4 ATR-FTIR spectra of PCC8806 and Spirulina under NPl exposure. ATR-FTIR spectra of a. PCC8806 and b. Spirulina under control and NPl-exposed conditions. See Tables S1 and S2† for specific assignments of the ATR-FTIR peaks for PCC8806 and Spirulina. | ||
Variations in the macromolecular composition of cell surfaces are expected in the presence of stressors, such as PS NPls. For instance, Déniel et al.61 reported increased protein content in the FTIR spectra of microalgae Chlamydomonas reinhardtii exposed to 1 mg L−1 PS NPls. Principal component analysis revealed slight variations in polysaccharide and protein bands, indicating a reaction between PS NPls and C. reinhardtii.61
Under PS NPl exposure, polysaccharide bands at ∼990 and ∼1040 cm−1 shifted towards higher wavenumber for PCC8806 and Spirulina (Tables S2 and S3†). Furthermore, an increase in the peak area ratio at ∼990 cm−1 was detected for PCC8806 exposed to 2 and 20 mg L−1 PS NPls and Spirulina under all tested PS NPl concentrations compared to the control (Fig. S10a†). Both observations indicate that PS NPls react with cyanobacterial surfaces, producing more polysaccharides. This contrasts with decreased polysaccharide-related peak intensities in PS NPl-exposed microalgae Chlorella vulgaris.18
Moreover, there were spectral variations within the PCC8806 and Spirulina ATR-FTIR spectra towards lower and higher wavenumbers at peaks relating to the protonation and deprotonation of carboxylic acid or ester functional groups in proteins and lipids (at ∼1340 cm−1, ∼1399 cm−1, and ∼1739 cm−1). The peak area ratio at ∼1656 cm−1 increased and decreased for PCC8806 and Spirulina by PS NPl exposure, respectively (Fig. S10b†). The increased PCC8806 protein content is in agreement with previous studies.61,62 A decreased protein content in Spirulina further confirms that PS NPls interacted with cyanobacterial surfaces. In Hazeem et al.,18 an increase in the amide I band was observed in conjunction with a decrease in the amide III band (∼1450 cm−1). The authors concluded that PS NPls interacted with proteins on the cell surfaces of C. vulgaris, resulting in lower total protein content being detected. C. vulgaris exposed to 20 mg L−1 PS NPls revealed a decline in FTIR peak intensities associated with polysaccharides and proteins (amide I, II, and III bands) arising from the observed sorption and destruction of cell membranes. Interestingly, a higher peak intensity at ∼701 cm−1 was observed within the Spirulina FTIR spectra under NPl exposure; this band represents C–H out-of-plane bending vibrations within the PS structure.32 This confirms the presence of PS NPls on the cell surfaces of Spirulina.
Complementary to ATR-FTIR, XPS is a surface characterization method with a penetration depth of a few nanometers.39 In agreement with the findings by ATR-FTIR, the XPS spectra of PCC8806 showed that the carbon component at ∼284.8 eV (C1s), which corresponded to carbon bonded solely to carbon and hydrogen,63 was lower under NPl exposure (Table 2). Total carbon mass fraction decreased under 10 and 20 mg L−1 NPls. Qian et al.64 reported similar findings; exposure to PS NPls decreased C1s concentrations within EPS. The decrease in C1s concentrations and lower total carbon mass fraction imply that hydrocarbons decreased as a response to NPls. Potentially, the conversion of lipids to polysaccharides and proteins is evident in increased ATR-FTIR peak ratios (Fig. S10†). In contrast, we observed only slight differences in C1s components but increased total carbon mass fractions between the control and NPl-exposed Spirulina XPS spectra (Table 3).
| Element/ratio | Peak energy (eV) | PCC8806 | Assignment | |||
|---|---|---|---|---|---|---|
| Mass fraction (%) | ||||||
| Control | 2 mg L−1 NPls | 10 mg L−1 NPls | 20 mg L−1 NPls | |||
| Total C | 284.76 ± 0.11 | 68.4 | 68.4 | 55.3 | 62.1 | |
| Total O | 399.61 ± 0.04 | 23.6 | 24.6 | 38.5 | 30.5 | |
| Total N | 531.63 ± 0.14 | 8.0 | 7.0 | 6.2 | 7.4 | |
| O/C | 0.3 | 0.4 | 0.7 | 0.5 | ||
| N/C | 0.1 | 0.1 | 0.1 | 0.1 | ||
| C1s | 284.63 ± 0.08 | 53.6 | 61.2 | 54.4 | 54.4 | C–(C,H) |
| C1s A | 286.01 ± 0.09 | 29.2 | 21.2 | 30.3 | 29.0 | C–(O,N) |
| C1s B | 287.57 ± 0.13 | 12.6 | 12.2 | 10.4 | 12.9 | CO; O–C–O |
| C1s C | 288.42 ± 0.13 | 4.6 | 5.4 | 4.9 | 3.7 | OC–OH/CO |
| O1s | 530.68 ± 0.09 | 17.0 | 31.9 | 16.0 | 19.2 | OC; PO, P–O-ring |
| O1s A | 531.64 ± 0.16 | 48.9 | 40.2 | 50.6 | 49.2 | C–OH; C–O–C; P–OH |
| O1s B | 532.78 ± 0.10 | 34.0 | 28.0 | 33.3 | 31.6 | HO–C |
| N1s | 399.61 ± 0.04 | 91.7 | 100 | 100 | 98.9 | Unprotonated amine or amide functional groups |
| N1s A | 401.25 ± 0.37 | 8.3 | 1.1 | Protonated amine or amide functional groups | ||
| Element/ratio | Peak energy (eV) | Spirulina | Assignment | |||
|---|---|---|---|---|---|---|
| Mass fraction (%) | ||||||
| Control | 2 mg L−1 NPls | 10 mg L−1 NPls | 20 mg L−1 NPls | |||
| Total C | 284.65 ± 0.05 | 55.9 | 61.0 | 59.9 | 68.3 | |
| Total O | 399.43 ± 0.35 | 41.1 | 33.2 | 36.5 | 26.7 | |
| Total N | 531.11 ± 0.49 | 3.0 | 5.8 | 3.6 | 5.0 | |
| O/C | 0.7 | 0.5 | 0.6 | 0.4 | ||
| N/C | 0.1 | 0.1 | 0.1 | 0.1 | ||
| C1s | 284.61 ± 0.01 | 52.3 | 45.0 | 51.5 | 50.9 | C–(C,H) |
| C1s A | 285.98 ± 0.11 | 18.0 | 33.0 | 22.6 | 18.8 | C–(O,N) |
| C1s B | 287.31 ± 0.55 | 9.7 | 14.5 | 8.9 | 8.5 | CO; O–C–O |
| C1s C | 288.58 ± 0.42 | 20.1 | 7.6 | 17.0 | 21.8 | OC–OH/CO |
| O1s | 530.70 ± 0.11 | 66.5 | 33.2 | 74.2 | 35.2 | OC; PO, P–O-ring |
| O1s A | 531.74 ± 0.34 | 19.9 | 23.0 | 18.3 | 24.9 | C–OH; C–O–C; P–OH |
| O1s B | 532.72 ± 0.20 | 13.6 | 43.7 | 7.6 | 39.9 | HO–C |
| N1s | 399.61 ± 0.06 | 100 | 87.4 | 100 | 94.8 | Unprotonated amine or amide functional groups |
| N1s A | 399.58 ± 1.36 | 12.6 | 5.2 | Protonated amine or amide functional groups | ||
Variations in the oxygen components were observed with the XPS spectra of NPl-exposed PCC8806 and Spirulina cells. The oxygen component at ∼531.7 eV (O1s A), attributed to hydroxide groups, acetal, and hemiacetal,34,63 was higher under PCC8806 2 mg L−1NPls than the control group; under 10 and 20 mg L−1 NPls, concentrations were slightly higher. The concentrations of the oxygen component at ∼532.7 eV (O1s B), assigned to oxygen forming a single bond with hydrogen (HO–C), slightly decreased for PCC8806 after exposure to PS NPls. The concentrations of the oxygen component at ∼530.7 eV (O1s) were lower for Spirulina exposed to 2 and 20 mg L−1 NPls and higher under 10 mg L−1 NPls. Overall, higher [O/C] ratios detected in the XPS spectra of NPl-exposed PCC8806 cells signal that the contents of oxygenated compounds increased, i.e., polysaccharides and proteins. The opposite trend can be observed for Spirulina O1s A and O1s B components and [O/C] ratios, signaling that the contents of oxygenated compounds decreased under PS NPl exposure.
Both nitrogen components at ∼399.5 eV (N1s) and ∼400.5 eV (N1s A) were detected in PCC8806 and Spirulina. [N/C] ratios of PCC8806 and Spirulina were similar under NPl exposure (Tables 2 and 3), corresponding to no significant changes in the abundance of nitrogenated compounds, such as amino acids and proteins. These observations differ from our ATR-FTIR results. In particular, the peak area ratio associated with proteins increased for PCC8806 in the presence of PS NPls (Fig. S10b†). This can be linked to the penetration depth of X-rays during XPS analysis of a few nanometers versus the penetration depth for ATR-FTIR between 0.9 μm at 1800 cm−1 and about 2.7 μm at 600 cm−1 (see ESI†). The diameters of the studied cells are ∼2 μm (PCC8806) and ∼5 μm (Spirulina). The penetration depth of ATR-FTIR in the spectral area of interest of 1000–1800 cm−1 is about 0.9 μm; thus, cell surfaces were analyzed for Spirulina cells, and whole cells were analyzed for PCC8806 with ATR-FTIR. For both cyanobacterial species, the outer cell layers were analyzed by XPS. Similarly to our study, the XPS techniques was applied to investigate the impact of PS NPls on EPS composition of activated sludge,64 demonstrating that the XPS spectra of PS NPls has a negligible nitrogen peak. This fact is supported by our findings (Fig. S15†) demonstrating that nitrogen components were notdetectable for PS NPls (Fig. S15 and Table S9†). Additionally, the composition of C1s, C1s A and C1sB components as well as O1sA and O1sB components of PS NPls (Fig. S15 and Table S9†) differ distinct from the XPS data for the experiments with cyanobacterial cells. Therefore, we can be certain that the cells outer layer was characterized during the XPS acquisitions.
The dominant macromolecules of PCC8806 and Spirulina cell envelopes were proteins and polysaccharides, respectively. Under PS NPl exposure, we observed an increased relative proportion of polysaccharides by up to 35% for PCC8806 exposed to 10 and 20 mg L−1 PS NPls (Fig. 5a); a decrease in the weight fraction of lipids accompanied this increase. The relative proportion of proteins remained relatively stable. Lower C1s concentrations, spectral variations within ATR-FTIR spectra, and the increased ATR-FTIR peak area ratios of polysaccharides and proteins (Fig. S10a and Table S2†) reinforce these observations. A decrease in hydrocarbon content could be attributed to favorable interactions of PS NPls with lipids. PS NPls could interact with the headgroups of membrane lipids or fatty acid residues within the lipid bilayer.65 This can modify lipid concentrations within the cell walls of PCC8806.
 | ||
| Fig. 5 Effects of NPls on the cell envelope. Weight fractions (%) of the predominant macromolecules in a. PCC8806 and b. Spirulina cell envelope. Calculations were based on XPS-measured [O/C] and [N/C] ratios. | ||
Additionally, increased polysaccharide contents within the cell walls of PCC8806 could arise from increased levels of pectin and cellulose. Higher pectin and hemicellulose levels were observed within the cell walls of C. vulgaris exposed to 1 mg L−1 PS NPls; pectin and cellulose influence the strength and fluidity of cell walls.66 Even though the cell wall remains intact, NPls can elicit cellular mechanisms that modify and coat cell surfaces. Alterations to the structures and composition of polysaccharides and lipids can occur depending on their charge and affinity to NPls; this will influence the relative proportions of lipids, polysaccharides, and proteins on cell surfaces.65,67
On the other hand, the weight fraction of lipids for Spirulina increased markedly under PS NPl exposure (Fig. 5b); variations in the relative proportions of polysaccharides and proteins were observed in conjunction with the increase in lipid weight fraction (increase in lipids content from 0.2% to up to 37%). These results are connected to the shifts in wavenumbers and decreased peak area ratios relating to protein contents in our Spirulina ATR-FTIR spectra (Fig. 4 and S10b†). However, we could not detect any variations within the lipid region by PS NPls using ATR-FTIR. Nevertheless, we can assume that PS NPls interacted more with oxygenated compounds on Spirulina cell surfaces, thereby increasing the proportion of hydrocarbons, or promoted the contents of hydrocarbons and proteins. PS NPls have been reported to interact with polysaccharides and proteins on the cell surfaces.18,68 Similar to our findings, PS NPls impacted polysaccharide and protein levels on the cell surfaces of Scenedesmus obliquus.69
Lipid accumulation and secretion are coping mechanisms that cyanobacteria employ to protect against environmental stressors.70 Lipids can serve as energy sources that cells utilize under unfavorable conditions or as a defensive mechanism. Accumulation of lipids can exhibit changes in membrane permeability and cell wall thickness. Relative lipid and polysaccharide contents increased in the cell surfaces of C. reinhardtii grown under low N concentrations.67 Additionally, Dai et al.71 reported that lipid coatings shielded Gram-negative bacteria E. coli against the interactions of positively charged PS NPls; higher survivability and lower ROS concentrations were observed. Despite the importance of cell wall structure Spirulina for biotechnology purposes, little structural information on cell walls under different environmental conditions has been collected in recent studies.72 It has been shown that under alkaline conditions, the monomers within the cell surfaces of Spirulina can be loosened because of the breakage of hydrogen bonds among molecular chains and some peptide bonds of peptidoglycan. In those experiments, the lipid content of Spirulina was also determined to be 1.75 ± 0.18% (wt/wt).72 Hence, lipids secreted by Spirulina may play a similar role, acting as a protective barrier and altering membrane permeability to counter the sorption of PS NPls.
Furthermore, our TEM observations documented that cell wall thickness for PCC8806 and Spirulina increased under NPl exposure (Fig. S8 and S9†). The cell wall thickness of PCC8806 rose significantly in the presence of PS NPls (34.52 ± 3.32 nm vs. 38.27 ± 3.03 nm, 49.51 ± 2.18 nm, and 50.56 ± 3.02 nm under 2, 10, and 20 mg L−1 PS NPls, respectively); the cell wall thickness of Spirulina increased under 10 and 20 mg L−1 PS NPls (Fig. S9; Table S1;†p < 0.05). Similar observations have been revealed in Chlorella pyrenoidosa exposed to PS MPs.20 Our results indicate that though the thickness of cell envelopes increased, there was no uniform increase in the outer, peptidoglycan, and inner membrane layers. The outer and peptidoglycan layers may have increased for PCC8806, as both layers are rich in polysaccharides. The inner membrane thickness may have increased for Spirulina, which is mainly composed of phospholipids. An increase in these layers could be correlated to the relative proportions of polysaccharides, proteins, and lipids (Fig. 5). The thickening and changes in the surface composition of cell walls are another defensive mechanism we observed, effectively blocking the penetration of PS NPls.
Nonetheless, the increased cell wall thickness and changes in cell surface properties will impact nutrient and metal uptake and transport. Namely, cyanobacteria have been reported to influence P cycling by storing P as polyphosphate (polyP).73 Under low P concentrations, cells can utilize and cleavage polyP for metabolic processes; polyP dynamics can serve as a nutrient reservoir and influence carbon flow. Any changes to surface properties or fluidity can limit the uptake and storage of P, thereby reducing polyP formation and P levels in aquatic systems. Despite this importance, no studies have examined the impacts of NPls on polyP formation and metabolism.
Elevation of EPS secretion of cyanobacteria by PS NPls
The presence of PS NPls increased EPS concentrations markedly under 10 and 20 mg L−1 NPls for PCC8806 (Fig. 6). EPS concentrations of Spirulina were significantly higher compared to the control group (p < 0.05). These observations indicate that the cells were under stressed conditions.40,74 Wang et al.75 revealed that negatively charged sulfonate-modified PS NPls elicited higher EPS levels in M. aeruginosa and connected the results to the downregulation of genes involved in the citrate (TCA) cycle. Inhibition of the TCA cycle would limit the metabolism of carbohydrates and lipids, promoting the accumulation of EPS.40,49 In contrast, genes involved in the EPS biosynthetic or related pathways may be upregulated.76 Upregulation of genes involved in the Calvin cycle and amino sugar and nucleotide sugar metabolisms and glycosyltransferases were observed in the marine diatom Thalassiosira pseudonana after exposure to 50 mg L−1 PS NPls for 48 hours.77 The promotion of these genes would enable the production of raw materials and subsequent conversion into EPS units; these EPS units can be assembled into polysaccharides. | ||
| Fig. 6 EPS content under various NPl concentrations. Effects of different concentrations of PS NPls on EPS concentrations of PCC8806 and Spirulina. Values are shown as mean ± SD, n = 9. Different letters indicate significant differences between treatments (p < 0.05). | ||
Notably, using the imagery technique LSCM, we observed a higher abundance of polysaccharides either near or coating the cell surfaces of PCC8806 cells under 10 and 20 mg L−1 NPls than the control (Fig. 7). In contrast, we didn't observe any significant differences in polysaccharide concentrations in Spirulina (Fig. S17†). EPS were observed coating but not adjacent to the cell surfaces, as seen in PCC8806 and the SEM images (Fig. 2). The molecular mechanism based on the downregulation of genes involved in the TCA cycle and upregulation of genes involved in creating and assembling EPS units may have occurred in PCC8806. Still, the exact mechanism for PCC8806 and Spirulina requires further investigation.
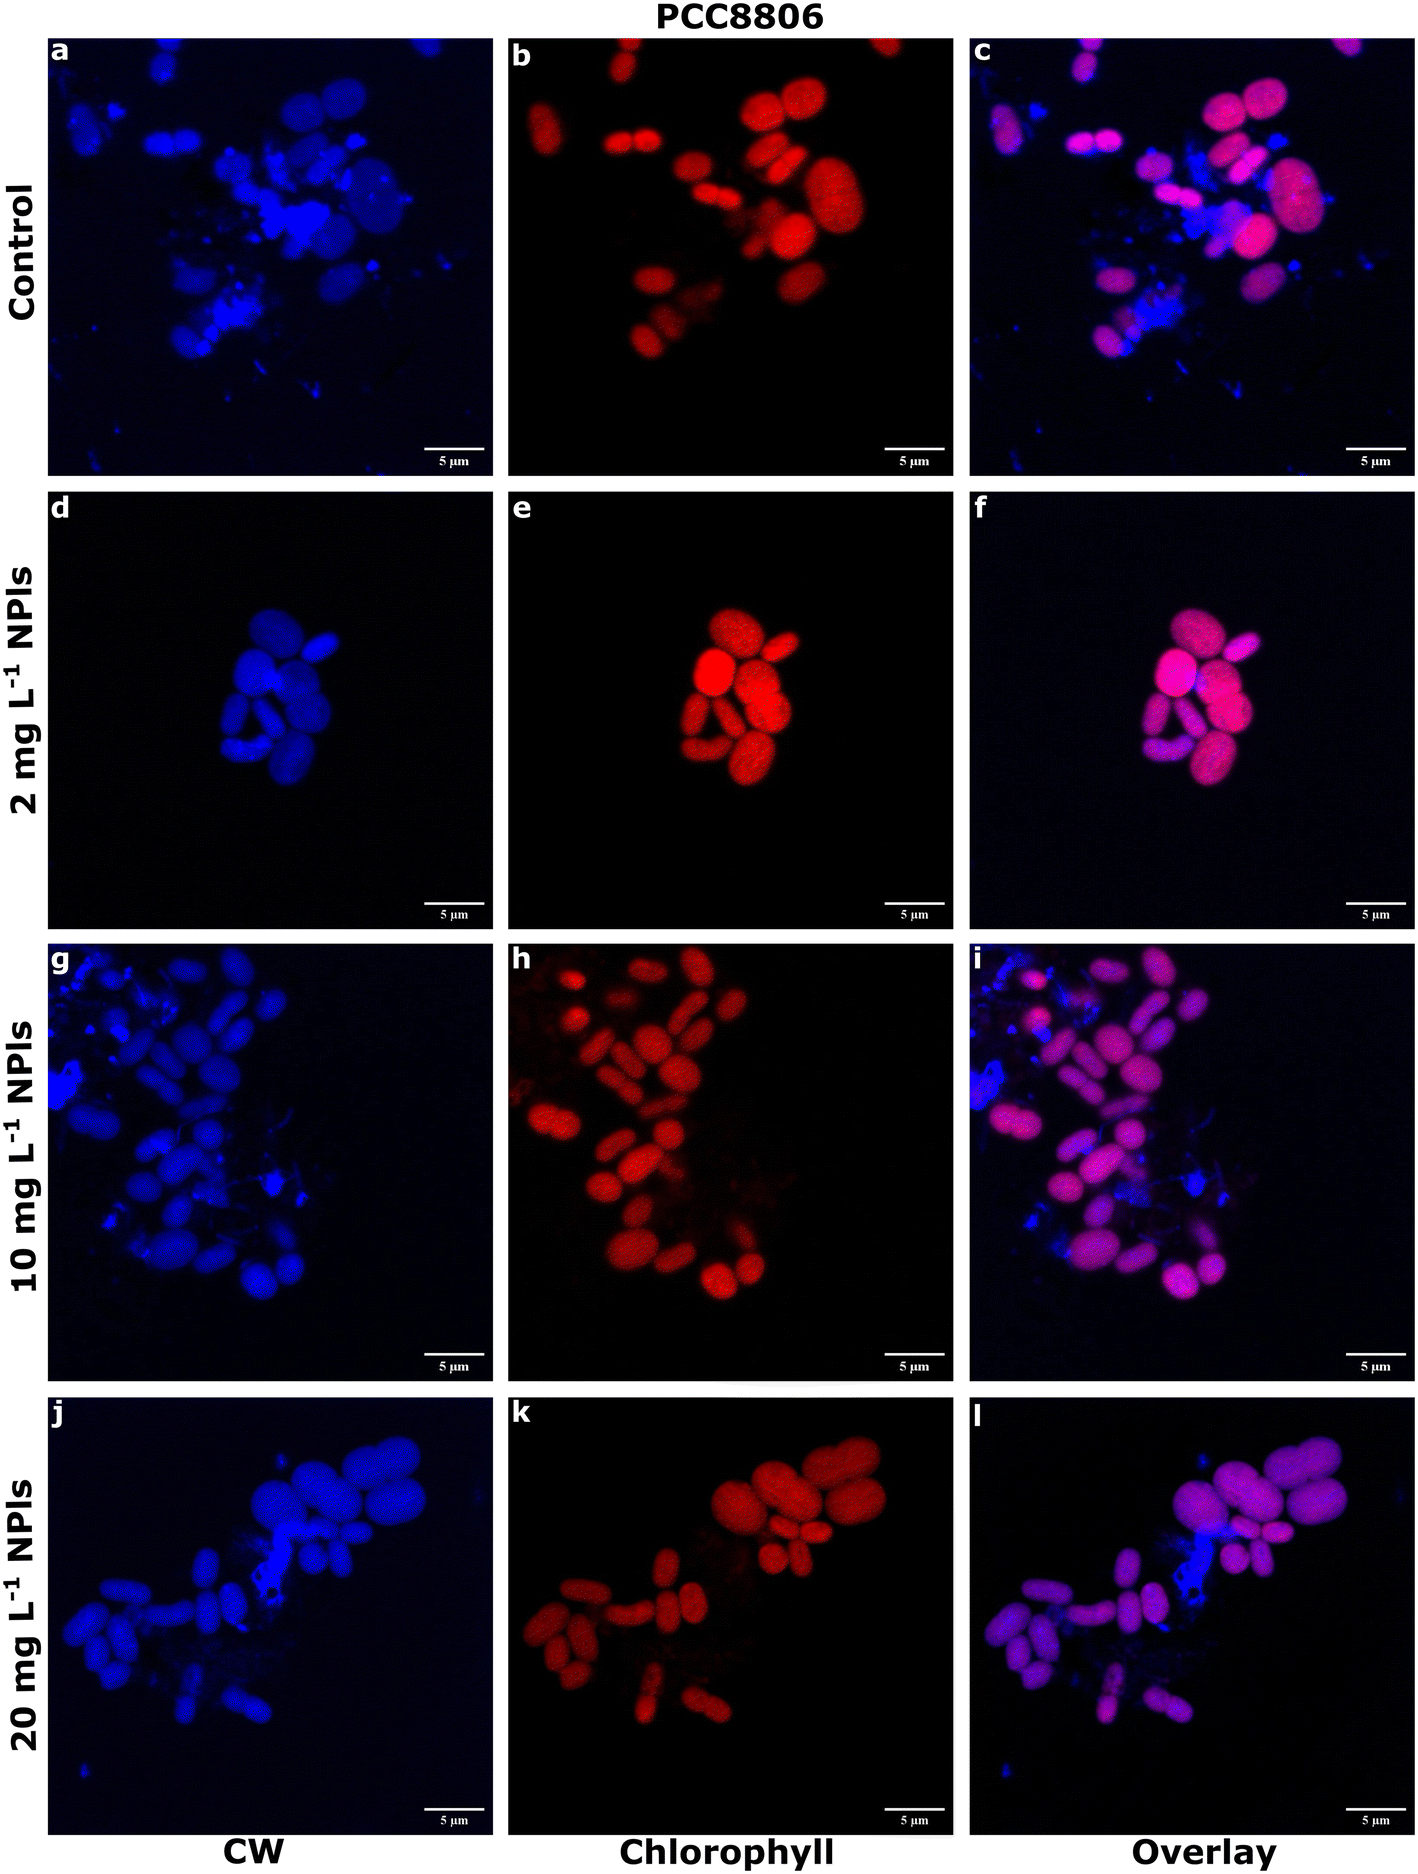 | ||
| Fig. 7 EPS secretion of PCC8806 by PS NPls. LSCM images of PCC8806 cells at the exponential phase. a–c. Control, d–f. with 2 mg L−1 PS NPls, g–i. with 10 mg L−1 PS NPls, j–l. with 20 mg L−1 PS NPls. Scale bar is 5 μm. Cells were stained with calcofluor white (CW) for polysaccharides. Images (c, f, i and l) represent CW staining and chlorophyll fluorescence overlay. Purple color indicates a higher presence of polysaccharides than chlorophyll fluorescence. | ||
Overall, PS NPls did not impact cell growth, morphology, and ultrastructure of PCC8806 and Spirulina. Our findings bring evidence that EPS played two roles in alleviating the effects of PS NPls: (1) facilitating agglomeration via electrostatic interactions between cells and NPls and (2) providing additional layers of protection for cells to adapt to the presence of PS NPls.20,48,78 EPS secretion was proposed as a self-protection mechanism for NPls to explain the similar growth rates between control and NPl-exposed M. aeruginosa cells.50 Other coping mechanisms observed in our study involve thickening cell walls, lipid accumulation, and enhanced homo-aggregation of cells and NPls.
NPls and cells can form agglomerates, with EPS as a binding agent.13,48 We observed the homo-agglomeration and hetero-agglomeration44 of cells and PS NPls under NPl exposure and increased EPS levels (Fig. 2 and 6). These observations are consistent with the findings involving PS NPl experiments with freshwater Syn. PCC7942 and PCC7002.13 EPS can attach to NPls through van der Waals or electrostatic interactions, altering the surface charge and aggregation kinetics of NPls.78,79 In addition, PS NPls may form agglomerates large enough for sedimentation. Based on the average Stokes' velocity, the settling distances of PS NPl agglomerates in FM were between 19.6 and 21.3 mm after 12 days, whereas the settling distances in the MM after 48 days were between 131.2 and 333.6 mm (Table S11†). As NPls settle to the bottom, fewer particles are dispersed in the medium, reducing their bioavailability. Homo-agglomeration of cells aids in lowering the extracellular stress of NPls and minimizing cell-NPl interactions.
Additionally, EPS can serve as a barrier between the cell surfaces and NPls for cell-PS NPl agglomerates, minimizing any adverse impacts on cell physiology. Despite the sorption of PS NPls on cell surfaces, the coating of EPS prevented PS NPls from being in direct contact with, overcoming, and translocating across cell membranes. The contributions from secreted EPS could influence the presence of certain bonds and surface macromolecules detected. In particular, EPS has been shown to reorganize its contents in the presence of external stressors.18 Thus, besides increased cell wall thickness, EPS could explain the spectral shifts, increased polysaccharide and protein peak area ratios, and increased relative proportion of polysaccharides and lipids on the cell surfaces of NPl-exposed cells (Fig. 4 and 5 and S8†). Moreover, EPS and humic acids secreted as a physiological response to NPls can facilitate eco-corona formation on NPls, altering cell surface reactivity and reducing their affinity for cyanobacterial surfaces.80,81 The encapsulation and eco-corona formation of NPls with humic acids were hypothesized to explain the alleviation of the adverse effects on cell growth and photosynthetic activity of M. aeruginosa.82 However, each EPS strand has a unique electrostatic potential and role depending on its composition.79,83 Thus, EPS may influence ZP, particularly for the cyanobacterial cell surfaces of NPl-exposed cells. This has implications for the sorption and uptake of nutrients and metals dependent on cell surfaces and maintaining pH homeostasis. Furthermore, the increased EPS production will influence carbon-to-nutrient ratios in aquatic environments, potentially increasing the abundance of higher trophic-level organisms. Interestingly, EPS could be a biological strategy for removing NPls in WWTPs, as conventional methods cannot be used due to size limitations and costs.84 Currently, MPs and NPls are removed mainly by screens, gravity separation, or flocculation with coagulants such as aluminum and ferric salts.85 However, residual MPs and NPls not removed initially will be retained within the solid phase (sludge); this requires costly and careful sludge disposal practices or additional treatment. Therefore, cyanobacteria can serve as a bio-alternative to help prevent the transport and leakage of NPls to aquatic systems through EPS secretion and biodegradation.
Conclusion
Global plastic production and plastic leakage to aquatic environments are expected to increase drastically over the next few decades, leading to higher levels of NPls. Hence, further studies into the ecological risks of PS NPls to cyanobacteria are justified. We observed no significant impact on the specific cell growth and morphology of PCC8806 and Spirulina under environmentally relevant PS NPl concentration despite cell-NPl interactions. We attributed these observations to the aggregation of NPls, elevated EPS secretion, and increased cell wall thickness, thereby reducing the impacts of NPls. Increased cell wall thickness and EPS secretion minimized the severity and bioavailability of PS NPls to cell surfaces. On the other hand, our experiments clearly showed that the sorption of PS NPls altered cyanobacterial cell surface properties since polysaccharide and lipid contents increased in the cell walls of PCC8806 and Spirulina, respectively; polysaccharide content in the cell walls of PCC8806 increased up to 35% whereas lipid content increased up to 37% for Spirulina. In addition, the presence of PS NPls on the cell surfaces of Spirulina was also detected with ATR-FTIR.Our findings showcase the coping mechanisms utilized by cyanobacteria exposed to PS NPls, such as EPS secretion, changes in cell surface composition, and increased cell wall thickness. Specifically for cyanobacterial cell walls, the increases in polysaccharide and lipid contents highlight different strategies elicited by freshwater and marine cyanobacteria involving cell walls. Higher pectin and cellulose levels and increased thickness of outer and peptidoglycan layers may prevent the bioaccumulation of PS NPls while maintaining growth and morphology for cyanobacteria like PCC8806. Conversely, cyanobacteria like Spirulina may increase lipid content and the thickness of the inner membrane as a coping mechanism. Further investigation is required regarding the molecular mechanisms involved in the presence of NPls. Changes in gene expression within PCC8806 and Spirulina may explain the modifications in cell surface properties and the lack of significant changes in cell growth and morphology. Transcriptomic analysis needs to be conducted in future research to understand the mechanisms at play in the presence of PS NPls.
Studying the impacts of NPls on cyanobacterial cell surface properties can provide insights into the environmental consequences of NPls, especially on the processes dependent on cyanobacterial cell surfaces in an increasingly plastic world. NPls are complex and heterogeneous contaminants, so their risks to aquatic systems and cyanobacteria merit further examination. Though overall cyanobacterial physiology and ecological resilience were confirmed at environmentally relevant NPl concentrations, the effectiveness of the coping mechanisms under higher NPl concentrations remains unclear. Increasing cell wall thickness and EPS production consumes valuable resources, so an insufficient response to NPls will severely harm cyanobacterial physiology and surface properties. As cyanobacterial species like Synechococcus and Spirulina are expected to increase in abundance, they will have an expanded role in aquatic systems as primary producers and players in biogeochemical processes (i.e., CaCO3 precipitation). Thus, any reduction in cyanobacterial populations will have detrimental effects on nutrient cycling and growth of higher-level trophic organisms and our combat against climate change and acidification. It is imperative to understand the ecological risks of NPls at environmentally relevant concentrations to mitigate any severe effects on cyanobacterial cell surfaces that could be exacerbated under future trends of plastic pollution.
Data availability
Data supporting this article has been included as part of the ESI.† Data will be available on request.Author contributions
NK – conceptualization, investigation, methodology, formal analysis, visualization, and writing – original draft, and writing – review and editing. BR – investigation and methodology – culturing. MD – conceptualization, investigation, writing – review and editing, supervision, and funding acquisition.Conflicts of interest
There are no conflicts of interest.Acknowledgements
MD thank the NSERC fund “Source-specific identification, characterization, and control of microplastics across a remote, rural, and urban gradient” and Canada Foundation for Innovation, Leaders Opportunity Fund for the PhD support for NK. The authors are grateful to Dr. DiLoreto, Dr. Avetisyan, and D. Aceituno-Caicedo for their guidance. We also thank Prof. Ruby Sullan (Nano(materials)-Bio Interactions Lab; University of Toronto, Scarborough) for access to the NanoBrook Omni and F. Perez for training. We wish to acknowledge S. Boccia and P. Brodersen (Open Centre for the Characterization of Advanced Materials (OCCAM); University of Toronto, St. George), Dr. Akhbarizadeh (Diamond Environmental Research Group; University of Toronto, St. George), and D. Acharya and B. Chue (Centre for the Neurobiology of Stress (CNS); University of Toronto, Scarborough) for assisting and training us with SEM, XPS, ATR-FTIR, TEM, and LCSM, respectively.References
- A. Pradel, C. Catrouillet and J. Gigault, The environmental fate of nanoplastics: What we know and what we need to know about aggregation, NanoImpact, 2023, 29, 100453 CrossRef CAS PubMed.
- N. Kokilathasan and M. Dittrich, Nanoplastics: Detection and impacts in aquatic environments – A review, Sci. Total Environ., 2022, 849, 157852 CrossRef CAS PubMed.
- A. Cózar, F. Echevarría, J. I. González-Gordillo, X. Irigoien, B. Úbeda, S. Hernández-León, Á. T. Palma, S. Navarro, J. García-de-Lomas, A. Ruiz, M. L. Fernández-de-Puelles and C. M. Duarte, Plastic debris in the open ocean, Proc. Natl. Acad. Sci. U. S. A., 2014, 111, 10239–10244 CrossRef PubMed.
- A. L. Andrady, Microplastics in the marine environment, Mar. Pollut. Bull., 2011, 62, 1596–1605 CrossRef CAS PubMed.
- J. Gigault, H. El Hadri, B. Nguyen, B. Grassl, L. Rowenczyk, N. Tufenkji, S. Feng and M. Wiesner, Nanoplastics are neither microplastics nor engineered nanoparticles, Nat. Nanotechnol., 2021, 16, 501–507 CrossRef CAS PubMed.
- J. Duan, N. Bolan, Y. Li, S. Ding, T. Atugoda, M. Vithanage, B. Sarkar, D. C. W. Tsang and M. B. Kirkham, Weathering of microplastics and interaction with other coexisting constituents in terrestrial and aquatic environments, Water Res., 2021, 196, 117011 CrossRef CAS PubMed.
- L. Tian, Q. Chen, W. Jiang, L. Wang, H. Xie, N. Kalogerakis, Y. Ma and R. Ji, A carbon-14 radiotracer-based study on the phototransformation of polystyrene nanoplastics in water versus in air, Environ. Sci.: Nano, 2019, 6, 2907–2917 RSC.
- G. Hul, H. Okutan, P. Le Coustumer, S. Ramseier Gentile, S. Zimmermann, P. Ramaciotti, P. Perdaems and S. Stoll, Influence of Concentration, Surface Charge, and Natural Water Components on the Transport and Adsorption of Polystyrene Nanoplastics in Sand Columns, Nanomaterials, 2024, 14, 529 CrossRef CAS PubMed.
- J. Wu, R. Jiang, W. Lin and G. Ouyang, Effect of salinity and humic acid on the aggregation and toxicity of polystyrene nanoplastics with different functional groups and charges, Environ. Pollut., 2019, 245, 836–843 CrossRef CAS PubMed.
- M. Dittrich and S. Sibler, Cell surface groups of two picocyanobacteria strains studied by zeta potential investigations, potentiometric titration, and infrared spectroscopy, J. Colloid Interface Sci., 2005, 286, 487–495 CrossRef CAS PubMed.
- T. M. Nolte, N. B. Hartmann, J. M. Kleijn, J. Garnæs, D. van de Meent, A. J. Hendriks and A. Baun, The toxicity of plastic nanoparticles to green algae as influenced bysurface modification, medium hardness and cellular adsorption, Aquat. Toxicol., 2017, 183, 11–20 CrossRef CAS PubMed.
- M. Tavafoghi, S. Garg, A. Korenevski and M. Dittrich, Environmentally friendly antibiofilm strategy based on cationized phytoglycogen nanoparticles, Colloids Surf., B, 2021, 207, 111975–111986 CrossRef CAS PubMed.
- T. T. S. de Oliveira, I. Andreu, M. C. Machado, G. Vimbela, A. Tripathi and A. Bose, Interaction of Cyanobacteria with Nanometer and Micron Sized Polystyrene Particles in Marine and Fresh Water, Langmuir, 2020, 36, 3963–3969 CrossRef CAS PubMed.
- T. Zhu and M. Dittrich, Carbonate Precipitation through Microbial Activities in Natural Environment, and Their Potential in Biotechnology: A Review, Front. Bioeng. Biotechnol., 2016, 4, 4 Search PubMed.
- Q. Xiang, Y. Zhou and C. Tan, Toxicity Effects of Polystyrene Nanoplastics with Different Sizes on Freshwater Microalgae Chlorella vulgaris, Molecules, 2023, 28, 3958 CrossRef CAS PubMed.
- E. Yousif and R. Haddad, Photodegradation and Photostabilization of Polymers, especially Polystyrene: Review, Springerplus, 2013, 2, 398 CrossRef PubMed.
- P. Bhattacharya, S. Lin, J. P. Turner and P. C. Ke, Physical Adsorption of Charged Plastic Nanoparticles Affects Algal Photosynthesis, J. Phys. Chem. C, 2010, 114, 16556–16561 CrossRef CAS.
- L. J. Hazeem, G. Yesilay, M. Bououdina, S. Perna, D. Cetin, Z. Suludere, A. Barras and R. Boukherroub, Investigation of the toxic effects of different polystyrene micro-and nanoplastics on microalgae Chlorella vulgaris by analysis of cell viability, pigment content, oxidative stress and ultrastructural changes, Mar. Pollut. Bull., 2020, 156, 111278 CrossRef CAS PubMed.
- F. C. Camini, C. C. da Silva Caetano, L. T. Almeida and C. L. de Brito Magalhães, Implications of oxidative stress on viral pathogenesis, Arch. Virol., 2017, 162, 907–917 CrossRef CAS PubMed.
- Y. Mao, H. Ai, Y. Chen, Z. Zhang, P. Zeng, L. Kang, W. Li, W. Gu, Q. He and H. Li, Phytoplankton response to polystyrene microplastics: Perspective from an entire growth period, Chemosphere, 2018, 208, 59–68 CrossRef CAS PubMed.
- S. Śliwińska-Wilczewska, J. Maculewicz, A. Barreiro Felpeto and A. Latala, Allelopathic and Bloom-Forming Picocyanobacteria in a Changing World, Toxins, 2018, 10, 48 CrossRef PubMed.
- B. Raoof, B. D. Kaushik and R. Prasanna, Formulation of a low-cost medium for mass production of Spirulina, Biomass Bioenergy, 2006, 30, 537–542 CrossRef CAS.
- P. Flombaum, J. L. Gallegos, R. A. Gordillo, J. Rincón, L. L. Zabala, N. Jiao, D. M. Karl, W. K. W. Li, M. W. Lomas, D. Veneziano, C. S. Vera, J. A. Vrugt and A. C. Martiny, Present and future global distributions of the marine Cyanobacteria Prochlorococcus and Synechococcus, Proc. Natl. Acad. Sci. U. S. A., 2013, 110, 9824–9829 CrossRef CAS PubMed.
- A. Liang, C. Paulo, Y. Zhu and M. Dittrich, CaCO3 biomineralization on cyanobacterial surfaces: Insights from experiments with three Synechococcus strains, Colloids Surf., B, 2013, 111, 600–608 CrossRef CAS PubMed.
- R. Ramanan, K. Kannan, A. Deshkar, R. Yadav and T. Chakrabarti, Enhanced algal CO2 sequestration through calcite deposition by Chlorella sp. and Spirulina platensis in a mini-raceway pond, Bioresour. Technol., 2010, 101, 2616–2622 CrossRef CAS PubMed.
- M. Chang, P. Sun, L. Zhang, Y. Liu, L. Chen, H. Ren and B. Wu, Changes in characteristics and risk of freshwater microplastics under global warming, Water Res., 2024, 260, 121960 CrossRef CAS PubMed.
- L. Peng, D. Fu, H. Qi, C. Q. Lan, H. Yu and C. Ge, Micro- and nano-plastics in marine environment: Source, distribution and threats — A review, Sci. Total Environ., 2020, 698, 134254 CrossRef CAS PubMed.
- O. Pencik, M. Durdakova, K. Molnarova, A. Kucsera, D. Klofac, M. Kolackova, V. Adam and D. Huska, Microplastics and nanoplastics toxicity assays: A revision towards to environmental-relevance in water environment, J. Hazard. Mater., 2023, 454, 131476 CrossRef CAS PubMed.
- S. Jiang, H. Lu, Y. Xie, T. Zhou, Z. Dai, R. Sun, L. He and C. Li, Toxicity of microplastics and nano-plastics to coral-symbiotic alga (Dinophyceae Symbiodinium): Evidence from alga physiology, ultrastructure, OJIP kinetics and multi-omics, Water Res., 2025, 273, 123002 CrossRef CAS PubMed.
- R. Yang, J. Qu, H. Li, W. Meng, X. Xu, J. Guo and F. Fang, Effects of unmodified and amine-functionalized polystyrene nanoplastics on nitrogen removal by Pseudomonas stutzeri: strain characteristics, extracellular polymers, and transcriptomics, Environ. Sci.: Nano, 2025, 12, 1531–1544 RSC.
- G. L. Sullivan, J. D. Gallardo, E. W. Jones, P. J. Holliman, T. M. Watson and S. Sarp, Detection of trace sub-micron (nano) plastics in water samples using pyrolysis-gas chromatography time of flight mass spectrometry (PY-GCToF), Chemosphere, 2020, 249, 126179 CrossRef CAS PubMed.
- M. Zając, J. Kotyńska, G. Zambrowski, J. Breczko, P. Deptula, M. Cieśluk, M. Zambrzycka, I. Święcicka, R. Bucki and M. Naumowicz, Exposure to polystyrene nanoparticles leads to changes in the zeta potential of bacterial cells, Sci. Rep., 2023, 13, 9552 CrossRef PubMed.
- R. Cavicchioli, W. J. Ripple, K. N. Timmis, F. Azam, L. R. Bakken, M. Baylis, M. J. Behrenfeld, A. Boetius, P. H. Boyd, A. T. Classen, T. W. Crowther, R. Danovaro, C. M. Foreman, J. Huisman, D. A. Hutchins, J. K. Jansson, D. M. Karl, B. Koskella, D. B. Mark Welch, J. B. H. Martiny, M. A. Moran, V. J. Orphan, D. S. Reay, J. V. Remais, V. I. Rich, B. K. Singh, L. Y. Stein, F. J. Stewart, M. B. Sullivan, M. J. H. Van Oppen, S. C. Weaver, E. A. Webb and N. S. Webster, Scientists' warning to humanity: microorganisms and climate change, Nat. Rev. Microbiol., 2019, 17, 569–586 CrossRef CAS PubMed.
- C. Paulo, J. Kenney, P. Persson and M. Dittrich, Effects of Phosphorus in Growth Media on Biomineralization and Cell Surface Properties of Marine Cyanobacteria Synechococcus, Geosciences, 2018, 8, 471 CrossRef CAS.
- T. Zhu, Y. Lin, X. Lu and M. Dittrich, Assessment of cyanobacterial species for carbonate precipitation on mortar surface under different conditions, Ecol. Eng., 2018, 120, 154–163 CrossRef.
- M. Seoane, C. González-Fernández, P. Soudant, A. Huvet, M. Esperanza, Á. Cid and I. Paul-Pont, Polystyrene microbeads modulate the energy metabolism of the marine diatom Chaetoceros neogracile, Environ. Pollut., 2019, 251, 363–371 CrossRef CAS PubMed.
- T. Zhu, C. Paulo, M. L. Merroun and M. Dittrich, Potential application of biomineralization by Synechococcus PCC8806 for concrete restoration, Ecol. Eng., 2015, 82, 459–468 CrossRef.
- I. A. Bundeleva, L. S. Shirokova, P. Bénézeth, O. S. Pokrovsky, E. I. Kompantseva and S. Balor, Zeta potential of anoxygenic phototrophic bacteria and Ca adsorption at the cell surface: Possible implications for cell protection from CaCO3 precipitation in alkaline solutions, J. Colloid Interface Sci., 2011, 360, 100–109 CrossRef CAS PubMed.
- Y. F. Dufrêne, A. Van Der Wal, W. Norde and P. G. Rouxhet, X-Ray Photoelectron Spectroscopy Analysis of Whole Cells and Isolated Cell Walls of Gram-Positive Bacteria: Comparison with Biochemical Analysis, J. Bacteriol., 1997, 179, 1023–1028 CrossRef PubMed.
- J. R. Khatiwada, C. Madsen, C. Warwick, S. Shrestha, C. Chio and W. Qin, Interaction between polyethylene terephthalate (PET) microplastic and microalgae (Scenedesmus spp.): Effect on the growth, chlorophyll content, and hetero-aggregation, Environ. Adv., 2023, 13, 100399 CrossRef CAS.
- T. Masuko, A. Minami, N. Iwasaki, T. Majima, S.-I. Nishimura and Y. C. Lee, Carbohydrate analysis by a phenol–sulfuric acid method in microplate format, Anal. Biochem., 2005, 339, 69–72 CrossRef CAS PubMed.
- M.-Y. Chen, D.-J. Lee, Z. Yang, X. F. Peng and J. Y. Lai, Fluorecent Staining for Study of Extracellular Polymeric Substances in Membrane Biofouling Layers, Environ. Sci. Technol., 2006, 40, 6642–6646 CrossRef CAS PubMed.
- G. V. Lowry, R. J. Hill, S. Harper, A. F. Rawle, C. O. Hendren, F. Klaessig, U. Nobbmann, P. Sayre and J. Rumble, Guidance to improve the scientific value of zeta-potential measurements in nanoEHS, Environ. Sci.: Nano, 2016, 3, 953–965 RSC.
- J. Schmidtmann, H. Elagami, B. S. Gilfedder, J. H. Fleckenstein, G. Papastavrou, U. Mansfeld and S. Peiffer, Heteroaggregation of PS microplastic with ferrihydrite leads to rapid removal of microplastic particles from the water column, Environ. Sci.: Processes Impacts, 2022, 24, 1782–1789 RSC.
- H. Zhu, X. Fan, H. Zou, R.-B. Guo and S.-F. Fu, Effects of size and surface charge on the sedimentation of nanoplastics in freshwater, Chemosphere, 2023, 336, 139194 CrossRef CAS PubMed.
- M. Dittrich and S. Sibler, Influence of H+ and Calcium Ions on Surface Functional Groups of Synechococcus PCC 7942 Cells, Langmuir, 2006, 22, 5435–5442 CrossRef CAS PubMed.
- Y. Guo, A. M. O'Brien, T. F. Lins, R. S. Shahmohamadloo, X. O. Almirall, C. M. Rochman and D. Sinton, Effects of Hydrogen Peroxide on Cyanobacterium Microcystis aeruginosa in the Presence of Nanoplastics, ACS ES&T Water, 2021, 1, 1596–1607 Search PubMed.
- Y. Song, B. Zhang, M. Si, Z. Chen, J. Geng, F. Liang, M. Xi, X. Liu and R. Wang, Roles of extracellular polymeric substances on Microcystis aeruginosa exposed to different sizes of polystyrene microplastics, Chemosphere, 2023, 312, 137225 CrossRef CAS PubMed.
- X. You, X. Cao, X. Zhang, J. Guo and W. Sun, Unraveling individual and combined toxicity of nano/microplastics and ciprofloxacin to Synechocystis sp. at the cellular and molecular levels, Environ. Int., 2021, 157, 106842 CrossRef CAS PubMed.
- X. Zheng, Y. Yuan, Y. Li, X. Liu, X. Wang and Z. Fan, Polystyrene nanoplastics affect growth and microcystin production of Microcystis aeruginosa, Environ. Sci. Pollut. Res., 2021, 28, 13394–13403 CrossRef CAS PubMed.
- M. C. Machado, G. V. Vimbela, T. T. Silva-Oliveira, A. Bose, A. Tripathi and W.-C. Chin, The response of Synechococcus sp. PCC 7002 to micro−/nano polyethylene particles - Investigation of a key anthropogenic stressor, PLoS One, 2020, 15, e0232745 CrossRef CAS PubMed.
- J. Karimi, A. Asgharpour, S. Mohsenzadeh and S. Abbasi, The impact of polystyrene nanoplastics (PSNPs) on physiological and biochemical parameters of the microalgae Spirulina platensis, J. Hazard. Mater., 2024, 474, 134644 CrossRef CAS PubMed.
- S. Stoll and E. Pefferkorn, Monte Carlo Simulation of Controlled Colloid Growth by Homo- and Heterocoagulation in Two Dimensions, J. Colloid Interface Sci., 1996, 177, 192–197 CrossRef CAS PubMed.
- R. Li, B. Wang, F. Nan, J. Lv, X. Liu, Q. Liu, J. Feng and S. Xie, Effects of polystyrene nanoplastics on the physiological and biochemical characteristics of microalga Scenedesmus quadricauda, Environ. Pollut., 2023, 319, 120987 CrossRef CAS PubMed.
- E. Bergami, S. Pugnalini, M. L. Vannuccini, L. Manfra, C. Faleri, F. Savorelli, K. A. Dawson and I. Corsi, Long-term toxicity of surface-charged polystyrene nanoplastics to marine planktonic species Dunaliella tertiolecta and Artemia franciscana, Aquat. Toxicol., 2017, 189, 159–169 CrossRef CAS PubMed.
- Y. Liu, D. S. Alessi, G. W. Owttrim, D. A. Petrash, A. M. Mloszewska, S. V. Lalonde, R. E. Martinez, Q. Zhou and K. O. Konhauser, Cell surface reactivity of Synechococcus sp. PCC 7002: Implications for metal sorption from seawater, Geochim. Cosmochim. Acta, 2015, 169, 30–44 CrossRef CAS.
- J. C. Brown, Q. Mackay, Q. Yu and J. B. Fein, The role of cell surface sulfhydryl and amine binding sites in the removal of Cr(VI) from solution by Bacillus subtilis bacterial cells, Chem. Geol., 2024, 664, 122299–122310 CrossRef CAS.
- R. G. Wetzel, Limnology: Lake and River Ecosystems, Academic Press, San Diego, California, 3rd edn, 2001 Search PubMed.
- N. Giraldez-Ruiz, P. Mateo, I. Bonilla and F. Fernandez-Pinas, The relationship between intracellular pH, growth characteristics and calcium in the cyanobacterium Anabaena sp. strain PCC7120 exposed to low pH, New Phytol., 1997, 137, 599–605 CrossRef CAS.
- E. Kavitha, L. Devaraj Stephen, B. Fatema Hossain and S. Karthikeyan, Two-trace two-dimensional (2T2D) correlation infrared spectral analysis of Spirulina platensis and its commercial food products coupled with chemometric analysis, J. Mol. Struct., 2021, 1244, 130964 CrossRef CAS.
- M. Déniel, F. Lagarde, A. Caruso and N. Errien, Infrared spectroscopy as a tool to monitor interactions between nanoplastics and microalgae, Anal. Bioanal. Chem., 2020, 412, 4413–4422 CrossRef PubMed.
- M. Déniel, N. Errien, F. Lagarde, M. Zanella and A. Caruso, Interactions between polystyrene nanoparticles and Chlamydomonas reinhardtii monitored by infrared spectroscopy combined with molecular biology, Environ. Pollut., 2020, 266, 115227 CrossRef PubMed.
- J. J. Ojeda, M. E. Romero-González, R. T. Bachmann, R. G. J. Edyvean and S. A. Banwart, Characterization of the Cell Surface and Cell Wall Chemistry of Drinking Water Bacteria by Combining XPS, FTIR Spectroscopy, Modeling, and Potentiometric Titrations, Langmuir, 2008, 24, 4032–4040 CrossRef CAS PubMed.
- J. Qian, X. He, P. Wang, B. Xu, K. Li, B. Lu, W. Jin and S. Tang, Effects of polystyrene nanoplastics on extracellular polymeric substance composition of activated sludge: The role of surface functional groups, Environ. Pollut., 2021, 279, 116904 CrossRef CAS PubMed.
- I. A. Guschina, A. J. Hayes and S. J. Ormerod, Polystyrene microplastics decrease accumulation of essential fatty acids in common freshwater algae, Environ. Pollut., 2020, 263, 114425 CrossRef CAS PubMed.
- S. Zhang, Z. Sun, T. Zheng, C. He and D. Lin, Nanoplastics increase algal absorption and toxicity of Cd through alterations in cell wall structure and composition, Water Res., 2024, 254, 121394 CrossRef CAS PubMed.
- A. P. Dean, D. C. Sigee, B. Estrada and J. K. Pittman, Using FTIR spectroscopy for rapid determination of lipid accumulation in response to nitrogen limitation in freshwater microalgae, Bioresour. Technol., 2010, 101, 4499–4507 CrossRef CAS PubMed.
- O. Hollóczki and S. Gehrke, Nanoplastics can change the secondary structure of proteins, Sci. Rep., 2019, 9, 16013 CrossRef PubMed.
- S. Das, V. Thiagarajan, N. Chandrasekaran, B. Ravindran and A. Mukherjee, Nanoplastics enhance the toxic effects of titanium dioxide nanoparticle in freshwater algae Scenedesmus obliquus, Comp. Biochem. Physiol., Part C: Toxicol. Pharmacol., 2022, 256, 109305 CAS.
- S. C. Singh, R. P. Sinha and D. P. Häder, Role of lipids and fatty acids in stress tolerance in cyanobacteria, Acta Protozool., 2002, 41, 297–308 CAS.
- S. Dai, R. Ye, J. Huang, B. Wang, Z. Xie, X. Ou, N. Yu, C. Huang, Y. Hua, R. Zhou and B. Tian, Distinct lipid membrane interaction and uptake of differentially charged nanoplastics in bacteria, J. Nanobiotechnol., 2022, 20, 191 CrossRef CAS PubMed.
- W. Chen, J. Xu, Q. Yu, Z. Yuan, X. Kong, Y. Sun, Z. Wang, X. Zhuang, Y. Zhang and Y. Guo, Structural insights reveal the effective Spirulina platensis cell wall dissociation methods for multi-output recovery, Bioresour. Technol., 2020, 300, 122628 CrossRef CAS PubMed.
- J. Li and M. Dittrich, Dynamic polyphosphate metabolism in cyanobacteria responding to phosphorus availability, Environ. Microbiol., 2019, 21, 572–583 CrossRef CAS PubMed.
- H. Nigam, R. Jain, A. Malik and V. Singh, Effect of different polystyrene nano-plastic concentrations on Chlorella pyrenoidosa, Algal Res., 2022, 67, 102835 CrossRef.
- Q. Wang, W. Liu, A. Zeb, Y. Lian, R. Shi, J. Li and Z. Zheng, Toxicity effects of polystyrene nanoplastics and arsenite on Microcystis aeruginosa, Sci. Total Environ., 2023, 874, 162496 CrossRef CAS PubMed.
- S. Pereira, A. Zille, E. Micheletti, P. Moradas-Ferreira, R. De Philippis and P. Tamagnini, Complexity of cyanobacterial exopolysaccharides: composition, structures, inducing factors and putative genes involved in their biosynthesis and assembly, FEMS Microbiol. Rev., 2009, 33, 917–941 CrossRef CAS PubMed.
- B. Zhang, Z. Wang, D. Li, L. Li, Y. Zhao, X. Tang and Y. Zhao, Reactive oxygen species mediated extracellular polymeric substances production assisting the recovery of Thalassiosira pseudonana from polystyrene micro and nanoplastics exposure, Environ. Pollut., 2024, 348, 123850 CrossRef CAS PubMed.
- W. Yang, P. Gao, Z. Ye, F. Chen and L. Zhu, Micro/nano-plastics and microalgae in aquatic environment: Influence factor, interaction, and molecular mechanisms, Sci. Total Environ., 2024, 934, 173218 CrossRef CAS PubMed.
- K. Ikuma, A. W. Decho and B. L. T. Lau, When nanoparticles meet biofilms—interactions guiding the environmental fate and accumulation of nanoparticles, Front. Microbiol., 2015, 6, 591 Search PubMed.
- J. Saavedra, S. Stoll and V. I. Slaveykova, Influence of nanoplastic surface charge on eco-corona formation, aggregation and toxicity to freshwater zooplankton, Environ. Pollut., 2019, 252, 715–722 CrossRef CAS PubMed.
- Y. Jiao, Y. Zhu, M. Chen, L. Wan, Y. Zhao, J. Gao, M. Liao and X. Tian, The humic acid-like substances released from Microcystis aeruginosa contribute to defending against smaller-sized microplastics, Chemosphere, 2022, 303, 135034 CrossRef CAS PubMed.
- G. Liu, R. Jiang, J. You, D. C. G. Muir and E. Y. Zeng, Microplastic Impacts on Microalgae Growth: Effects of Size and Humic Acid, Environ. Sci. Technol., 2020, 54, 1782–1789 CrossRef CAS PubMed.
- L. Cui, L. Fan, Z. Li, J. Wang, R. Chen, Y. Zhang, J. Cheng, X. Wu, J. Li, H. Yin, W. Zeng and L. Shen, Characterization of extracellular polymeric substances from Synechocystis sp. PCC6803 under Cd (II), Pb (II) and Cr (VI) stress, J. Environ. Chem. Eng., 2021, 9, 105347 CrossRef CAS.
- L.-J. Feng, J.-J. Wang, S.-C. Liu, X.-D. Sun, X.-Z. Yuan and S.-G. Wang, Role of extracellular polymeric substances in the acute inhibition of activated sludge by polystyrene nanoparticles, Environ. Pollut., 2018, 238, 859–865 CrossRef CAS PubMed.
- M. Keerthana Devi, N. Karmegam, S. Manikandan, R. Subbaiya, H. Song, E. E. Kwon, B. Sarkar, W. Kim, J. Rinklebe and M. Govarthanan, Removal of nanoplastics in water treatment processes: A review, Sci. Total Environ., 2022, 845, 157168–157180 CrossRef CAS PubMed.
Footnote |
| † Electronic supplementary information (ESI) available. See DOI: https://doi.org/10.1039/d4en01223b |
| This journal is © The Royal Society of Chemistry 2025 |