
 Open Access Article
 This Open Access Article is licensed under a
 Creative Commons Attribution 3.0 Unported Licence
Unconventional catalytic kinetics of dual field regulated pyrochlore-type high-entropy ceramics towards the Li2S4 intermediate†
Lin Zhoua,
Handing Liu*b,
Ji-Xuan Liua,
Xinrui Zhangb,
Yixi Yaob,
Ruirui Wangc,
Ziliang Chen *df,
Prashanth W. Menezes*ef and
Guo-Jun Zhang*a
*df,
Prashanth W. Menezes*ef and
Guo-Jun Zhang*a
aState Key Laboratory for Modification of Chemical Fibers and Polymer Materials, Institute of Functional Materials, College of Materials Science and Engineering, College of Science, Donghua University, Shanghai 200433, P. R. China. E-mail: gjzhang@dhu.edu.cn
bPKU-HKUST Shenzhen-Hongkong Institution, Peking University Shenzhen Institute, Shenzhen 518057, Guangdong Province, China. E-mail: liuhd@ier.org.cn
cSchool of Materials Science and Engineering, Suzhou University of Science and Technology, Suzhou 215009, China
dInstitute of Functional Nano and Soft Materials (FUNSOM), Jiangsu Key Laboratory for Carbon-Based Functional Materials and Devices, Soochow University, Suzhou, 215123, P. R. China. E-mail: zlchen@suda.edu.cn
eDepartment of Chemistry, Metalorganics and Inorganic Materials, Technische Universität Berlin, Berlin, Germany. E-mail: prashanth.menezes@mailbox.tu-berlin.de; prashanth.menezes@helmholtz-berlin.de
fDepartment of Materials Chemistry for Catalysis, Helmholtz-Zentrum Berlin für Materialien und Energie, Albert-Einstein-Str. 15, 12489 Berlin, Germany
First published on 20th May 2025
Abstract
The electrocatalytic performance of high-entropy ceramics has been recognized as a pivotal prerequisite to realizing ultra-durability for lithium–sulfur batteries. However, the dynamics of accurately capturing Li2S4 remains poorly understood, and thus a comprehensive understanding of the mechanism between dynamic control factors and electrocatalytic performance remains largely unexplored. In this study, we visually present the Li2S4 electrocatalytic process and accurately identify that high-entropy engineering of rare earth sites leads to positive modifications in crystal field splitting energy and electronegativity. In conjunction with theoretical analysis, we demonstrate that the adsorption energy of Li2S4 is optimized by the electronic structure and covalency under dual-field (electric field and crystal field) regulation, leading to efficient electrocatalytic performance. These findings have enabled us to develop an ultra-durable ceramic electrocatalyst (La0.15Nd0.15Sm0.40Eu0.15Gd0.15)2Zr2O7 as a sulfur cathode (HEZO-S) with a lifespan exceeding 10![[thin space (1/6-em)]](https://www.rsc.org/images/entities/char_2009.gif) 000 hours. This fundamental understanding of the intrinsic relationship provides a feasible high-entropy strategy for the design of advanced catalysts for lithium–sulfur batteries.
000 hours. This fundamental understanding of the intrinsic relationship provides a feasible high-entropy strategy for the design of advanced catalysts for lithium–sulfur batteries.
Broader contextThe functionalization of host materials is crucial for high sulfur loading and ultra-long cycling in lithium–sulfur batteries, which demands efficient and persistent electrocatalysis. Stabilizing catalytic sites and tuning electronic structures in host materials is a promising approach to optimize intermediate adsorption and enhance electrocatalytic efficiency. High-entropy oxide ceramics exhibit strong structural stability and tunable electronegativity/crystal field splitting at their sites. In this work, we optimized the Zr–O bond and Zr electronic structure, promoting Li2S4 conversion kinetics. These findings provide in-depth insights into the intrinsic correlation between metal electronic structures and catalytic activity, inspiring entropy engineering of ultra-durable electrocatalysts for lithium–sulfur batteries. |
Introduction
Lithium–sulfur (Li–S) batteries have made significant contributions to the advancement of energy storage technologies owing to their high theoretical specific capacity and the involvement of multi-electron electrochemical conversion.1 However, the sulfur cathode redox reaction (SRR) faces major challenges, including the shuttle effect and sluggish kinetics of intermediate lithium polysulfides (LiPSs) during its complex, multi-phase transformation. To address these issues, the development of sulfur host materials with optimized electrocatalytic properties is essential.2 Transition metal oxides, as electrocatalysts, offer a viable strategy to enhance the stability and rate performance of Li–S batteries.3–5 Notably, the electrocatalytic activity of transition metal oxides is mainly contributed by the d-orbital electrons of metal atoms.6–8 Unfortunately, this activity is often compromised due to the high hybridization degree between the 3d orbital of the metal and the 2p orbital of oxygen in the heterogeneous reaction.9–11 Therefore, enhancing the catalytic activity of transition metal oxides is critical, particularly for improving the SRR process in the multi-phase reaction of Li–S batteries.Previous studies have shown that binary metal-based oxides (ABOx) could promote the electrocatalytic effect on LiPSs in Li–S batteries by increasing both conductivity and oxygen vacancies (e.g., spinel, perovskite, and mullite phases).12–22 Nevertheless, these efforts have mainly focused on increasing the number of active sites available for catalysis rather than optimizing the intrinsic adsorption free energy of ABOx towards LiPSs, leaving ample room for further improvement of the catalytic performance. Inspired by the above considerations, several efforts have recently been devoted to altering the electronic structure of transition metal species in ABOx compounds to regulate the intrinsic catalytic effect.23–28 Despite these advances, the dissolution of B-site transition metals in these ABOx compounds during prolonged cycling leads to the formation of vacancies and detrimental segregation at the A-site, thereby causing instability in the electronic structure. This, in turn, results in a progressive decline in electron mobility and catalytic activity, ultimately capping the potential for enhancements in device performance.29–31 Recent investigations have revealed that high-entropy engineering, which involves incorporating multiple metal elements, could potentially be an effective strategy to counteract phase segregation and maintain a stable electronic structure with high catalytic activity.32–41 More importantly, the cocktail effect introduced through high entropy engineering endows the material with enhanced and more stable catalytic activity by optimizing the electronic structure. This synergistic effect often allows high-entropy materials to surpass the performance of single-component materials, achieving a “1 + 1 > 2” effect.32 As a result, they are gradually emerging as highly promising candidates for next-generation high-efficiency electrocatalytic and energy storage systems.37 While these findings are promising, to the best of our knowledge, the underlying mechanisms by which high-entropy engineering of the A-site in ABOx ceramics enhances catalytic activity remain unclear. Another challenge in understanding Li–S battery performance lies in the behavior of the intermediate Li2S4, which is a key species at 25% theoretical capacity and plays a key role in the liquid-to-solid phase transition during the electrochemical process.19,42 However, capturing the dynamic behavior of Li2S4 has remained extremely challenging to date, possibly due to the complexity of the interfacial environment, leaving significant gaps in our understanding of its interactions and the catalytic effects of various materials on it.
Herein, we developed a high-entropy ceramic (La0.15Nd0.15Sm0.40Eu0.15Gd0.15)2Zr2O7 (HEZO), based on the Sm2Zr2O7 prototype with a pyrochlore structure as an electrocatalyst for Li–S batteries by using a simple rapid molten salt method. This material significantly enhances redox kinetics, as evidenced by the reduction in the Tafel slope of the reduction peak to 29.83 and 34.36 mV dec−1 and the oxidation peak to 54.7 mV dec−1. Impressively, the HEZO-S electrode maintains operation for a continuous 10000 hours at a current density of 0.5C. To the best of our knowledge, this represents the highest areal capacity reported for ABOx-based sulfur cathodes so far and exhibits catalytic activity that surpasses current state-of-the-art metal oxide catalysts. Our detailed analyses using in situ electrochemical confocal Raman spectroscopy (EC-CRS), X-ray absorption spectroscopy (XAS), UV-Vis diffuse reflectance spectroscopy, and density functional theory (DFT+U) calculations reveal that although the introduced high-entropy engineering of the A-site lacks direct catalytic activity towards the SRR, it plays a pivotal role in modulating the d-orbital electronic structure and covalency through crystal field splitting energy and adjusting the electronegativity. This modulation optimizes the adsorption free energy for LiPSs, culminating in superior SRR performance. Our work not only achieves a significant breakthrough in fine-tuning the electronic structure of ABOx for ultra-durable performance but also offers deeper insight into the entropy engineering strategy for developing efficient electrocatalysts tailored for practical Li–S batteries.
Results and discussion
Key descriptors for the electrocatalytic performance of the HEZO ceramic host
It is important to recognize that the adsorption energy of ABOx ceramics serves a dual role in the SRR conversion process. Therefore, to effectively enhance the electrocatalytic performance while ensuring stability, high-entropy engineering provides a synergistic modulation of the electronic structure and bond properties by incorporating multiple elements into ABOx. This approach is envisioned as a viable strategy for achieving optimal performance. We developed a molten salt method for the synthesis of HEZO catalysts. Fig. 1A schematically illustrates the synthesis process. Initially, lanthana, neodymia, samaria, europia, gadolinia, and zirconia were mixed in a molar ratio of 3:3:8:3:3:20 in an ethanolic solution. The resulting mixed powders were then transferred to an alumina crucible and heated in a muffle furnace. The temperature was gradually increased at a rate of 5 °C per minute to 1200 °C and was maintained for 1 hour. The elevated temperature further enhances metal atom diffusion, which is crucial for obtaining a uniform high-entropy phase.
 | ||
| Fig. 1 Regulation of adsorption of lithium polysulfide by electronegativity and crystal field splitting. (A) Schematic synthesis procedure of HEZO. (B) Li2S4 permeation measurements in H-shaped glass cells with Sm2Zr2O7 (up), HEZO (middle), and ZrO2 (down) coated PP separators. (C) Effect of crystal field splitting energy variation on the electron structure. (D) Schematic diagram of the weak crystal field splitting energy on the electronic structure. (E) Tauc plots of the Kubelka–Munk function vs. energy of (SmEuGd)2Zr2O7 and Sm2Zr2O7. (F) Pauling electronegativity values of high entropy rare earth elements. (G) Schematic diagram of the effect of electronegatively regulated covalency of Zr–O on adsorption states. (H) Modeled FT EXAFS data for the mixture of HEZO and Sm2Zr2O7. | ||
Adsorption experiments comparing La2O3, Nd2O3, Sm2O3, Eu2O3, Gd2O3, and ZrO2 reveal that Li2S4 preferentially adsorbs on Zr sites (Fig. S1, ESI†), indicating that the catalytic activity of rare-earth sites is significantly lower than that of Zr sites. In a H-type electrochemical cell, the Li2S4 adsorption capacity follows the order of (LaNdSm)2Zr2O7 > (SmEuGd)2Zr2O7 > HEZO > Sm2Zr2O7 > ZrO2. Interestingly, the Tafel slope, Li ion diffusion coefficient, symmetrical battery current density, and constant current charge–discharge platform voltage difference, which reflects electrocatalytic activity in the H-type transparent cell, exhibit the reverse trend: HEZO > (LaNdSm)2Zr2O7 > (SmEuGd)2Zr2O7 > Sm2Zr2O7 > ZrO2 (Fig. S2 and S3, ESI†). This observation suggests that high-entropy pyrochlore ceramics exhibit a “volcano-shaped” adsorption behavior for Li2S4 (Fig. 1B).
To decouple the key descriptors of active sites and electrocatalytic performance, high-entropy pyrochlore ceramics were designed by substituting Sm sites with high-entropy elements (La/Nd/Sm/Eu/Gd). First, rare-earth metals with weak crystal field splitting energies (e.g., Eu and Gd) were introduced.43 Using the Tauc plot method from UV-Vis diffuse reflectance spectroscopy, it was determined that the bandgap of (SmEuGd)2Zr2O7 is lower than that of Sm2Zr2O7 (5.45 eV) (Fig. 1C). This is attributed to the weaker repulsion between the 4f7 orbitals of Eu and Gd and the 4d2 orbitals of Zr, which allows better orbital overlap between the f and d states (Fig. 1D). Consequently, a highly overlapping electronic “reservoir” is formed between the empty upper Hubbard band (UHB) and the occupied lower Hubbard band (LHB) in the Zr–O* antibonding orbitals (Fig. 1E). This electronic overlap significantly enhances the probability of rapid charge migration, resulting in a smaller bandgap at the macroscopic scale. Upon introducing elements with weaker crystal field splitting energies (e.g., La and Nd), extended X-ray absorption fine structure (EXAFS) analysis near the Zr K-edge revealed that the Zr–O bond length in (LaNdSm)2Zr2O7 extends to 1.59 Å, exceeding the bond length observed in Sm2Zr2O7 (Fig. 1F). This elongation is attributed to the lower electronegativity of La and Nd (Fig. 1G), which reduces the ability of Zr4+ to withdraw electrons from oxygen, thereby destabilizing the Zr–O covalent bond and enhancing the reactivity of the Zr–O bond (Fig. 1H).
Structural characteristics of HEZO and HEZO-S cathodes
The phase structure of the HEZO oxides was analyzed using X-ray diffraction (XRD). The XRD patterns of individual La2Zr2O7 and Sm2Zr2O7 phases (Fig. S4, ESI†) demonstrate that the solid-phase strategy successfully converts metal oxides into pure phase high-entropy oxides. Notably, due to the lattice distortion effects associated with high-entropy engineering, Rietveld refinement analysis of the X-ray diffraction (XRD) peaks of HEZO (Fig. 2A) reveals a shift to higher angles compared to the single La2Zr2O7 phase (PDF#17-0450, space group: Fd![[3 with combining macron]](https://www.rsc.org/images/entities/char_0033_0304.gif) m) where crystal facets (222), (400), (440), and (622) are located at 28.68°, 33.28°, 47.65° and 56.55°, respectively. In contrast, the diffraction peaks of HEZO shift to lower angles when compared to the Sm2Zr2O7 phase, indicating lattice expansion. Due to the lattice distortion induced by high-entropy engineering, electron interactions are inevitably triggered among the various elements. To clarify this, X-ray photoelectron spectroscopy (XPS) analysis was conducted on the HEZO composite material, Sm2Zr2O7, and ZrO2. The Gd 3d, Eu 3d, Sm 3d, Nd 3d, La 3d, and Zr 3d signals, O1s, and other related energy spectral peaks can be clearly observed in the full-spectrum peaks (Fig. S5, ESI†). As shown in Fig. S6 (ESI†), the Zr 3d3/2 and Zr 3d5/2 peaks in the HEZO composite material appeared at 184.1 and 181.7 eV, respectively. Moreover, compared with ZrO2, the peaks of Zr 3d3/2 and Zr 3d5/2 in HEZO and Sm2Zr2O7 shifted towards higher energies, and the energies of O 1s in HEZO and Sm2Zr2O7 were also significantly higher than that in ZrO2, indicating that the oxygen vacancies in HEZO and Sm2Zr2O7 require the high oxidation state of Zr to balance. Further comparison of the high-resolution XPS spectra of Sm2Zr2O7 shows that the Zr 3d3/2 and Zr 3d5/2 peaks in the HEZO composite material are slightly shifted towards lower energy. This indicates that an increased electron density around Zr follows high-entropy engineering. This enhancement enables Zr to accommodate more electrons and greatly increases the probability of rapid conversion of LiPSs at the Zr site. The band gap width of the high-entropy pyrochlore-type HEZO material was further reduced to 4.25 eV.
m) where crystal facets (222), (400), (440), and (622) are located at 28.68°, 33.28°, 47.65° and 56.55°, respectively. In contrast, the diffraction peaks of HEZO shift to lower angles when compared to the Sm2Zr2O7 phase, indicating lattice expansion. Due to the lattice distortion induced by high-entropy engineering, electron interactions are inevitably triggered among the various elements. To clarify this, X-ray photoelectron spectroscopy (XPS) analysis was conducted on the HEZO composite material, Sm2Zr2O7, and ZrO2. The Gd 3d, Eu 3d, Sm 3d, Nd 3d, La 3d, and Zr 3d signals, O1s, and other related energy spectral peaks can be clearly observed in the full-spectrum peaks (Fig. S5, ESI†). As shown in Fig. S6 (ESI†), the Zr 3d3/2 and Zr 3d5/2 peaks in the HEZO composite material appeared at 184.1 and 181.7 eV, respectively. Moreover, compared with ZrO2, the peaks of Zr 3d3/2 and Zr 3d5/2 in HEZO and Sm2Zr2O7 shifted towards higher energies, and the energies of O 1s in HEZO and Sm2Zr2O7 were also significantly higher than that in ZrO2, indicating that the oxygen vacancies in HEZO and Sm2Zr2O7 require the high oxidation state of Zr to balance. Further comparison of the high-resolution XPS spectra of Sm2Zr2O7 shows that the Zr 3d3/2 and Zr 3d5/2 peaks in the HEZO composite material are slightly shifted towards lower energy. This indicates that an increased electron density around Zr follows high-entropy engineering. This enhancement enables Zr to accommodate more electrons and greatly increases the probability of rapid conversion of LiPSs at the Zr site. The band gap width of the high-entropy pyrochlore-type HEZO material was further reduced to 4.25 eV.
 | ||
| Fig. 2 Phase, structure and morphology of host materials. (A) XRD spectrum and Rietveld refined spectrum of HEZO. (B) Comparison of XANES spectra of the Zr K-edges of HEZO, Sm2Zr2O7, and Zr foil. (C) Zr K-edge Fourier-transform EXAFS k3χ(k) data of the HEZO. (D) Tauc plots of the Kubelka–Munk function vs. energy of HEZO and Sm2Zr2O7. WT-EXAFS plots of (E) HEZO and (F) Sm2Zr2O7. (G) High-angle annular dark-field scanning transmission electron microscopy (HAADF-STEM) image of HEZO and EDS elemental mapping of La, Nd, Sm, Eu, Gd, Zr, and O. (H) Enlarged 3D AOGF mapping (right) corresponding to HRTEM (left) along the area marked with the white virtual rectangle. (I) The corresponding dilatation strain maps along εxx, εyy and εzz by TEM using the GPA algorithm for HEZO. | ||
Moreover, X-ray near-edge absorption spectroscopy (XANES) at the Zr K-edge reveals that the oxidation state of Zr in HEZO is nearly identical to the +4 states observed in Sm2Zr2O7, which is significantly higher than that of a Zr foil (Fig. 2B). The Zr K-edge XANES results for HEZO, Sm2Zr2O7, and ZrO2 showed that their absorption edge positions are very close, indicating that the Zr oxidation states in these samples are essentially identical (+4). Importantly, the extensive X-ray absorption fine structure (EXAFS) of Zr provides direct evidence of the Zr–O bond length variation (Fig. 2C). Compared to Sm2Zr2O7, the Zr–O bond length significantly increased to 1.62 Å in the HEZO, indicating weaker hybridization between O 2p and Zr 3d and weaker covalence of the Zr–O bonds. Under the influence of the crystal field splitting energy and electronegativity, the electron migration speed was greatly increased, which is manifested as a small band gap (4.25 eV) in macroscopic properties (Fig. 2D). Through wavelet transform (WT) EXAFS analysis, the Zr–O bond lengths in HEZO were found to be slightly longer than those in Sm2Zr2O7 (Fig. 2E and F). Additionally, the analysis reveals two types of rare-earth Zr bonding: one involving Zr–Nd/Gd at bond lengths from 2 Å to 3 Å and the other involving Zr–La/Eu at bond lengths greater than 3 Å, suggesting that the surrounding rare-earth elements can significantly influence the electronic structure of Zr.
The HEZO was characterized further by field emission scanning electron microscopy (FESEM) and transmission electron microscopy (TEM). The FESEM images (Fig. S7A–D, ESI†) revealed that the HEZO oxide exhibits a pseudo-spherical shape with particle sizes ranging from 500 nm to 1 μm. The low-magnification TEM images corroborated this morphology, while the magnified TEM image displayed a large number of lattice fringes within the matrix, with no indication of an amorphous structure. The high-resolution TEM images showed a lattice fringe spacing of 0.605 nm, which is slightly smaller than the theoretical spacing of 0.608 nm observed for the (111) crystal facet of La2Zr2O7 and slightly larger than 0.602 nm spacing observed for the (111) crystal facet of the Sm2Zr2O7 phase, being consistent with XRD results (Fig. S7E and F, ESI†).
Meanwhile, the high-resolution TEM diffraction pattern showed a series of concentric rings, with reciprocal points, corresponding to each family of diffraction crystal facets distributed and assembled into a reciprocal sphere with a radius of 1/d, demonstrating characteristics typical of a polycrystalline diffraction pattern. In order to better clarify the distribution of elements and the absence of segregation in the crystal structure of HEZO, high-angle annular dark-field (HAADF) imaging and corresponding elemental mapping were conducted (Fig. 2G). The analyses further indicated that the elements La, Nd, Sm, Eu, Gd, Zr, and O were uniformly distributed throughout the particles. Moreover, three-dimensional atomic overlap Gaussian function fitting (3D AOGF) mapping showed only the adjacent upper and lower layers of rare earth metals after subtraction of the Zr atomic layer (Fig. 2H). The presence of multiple colors exhibited by the rare earth atoms and the observation of three colors in the layer facing the Zr atoms provide strong evidence for the bonding characteristics between the rare earth elements and Zr. This finding directly supports the conclusion that only three metal atoms can form direct bonds with the Zr atoms in chaotic systems, which has significant implications for the structure and properties of high-entropy ceramics. Furthermore, the arrangement of atoms along the (111) crystal plane in HEZO is discontinuous and irregular, indicating that there is no local order at the high entropy sites in the material (Fig. S7G, ESI†). In contrast, the high-resolution aberration-corrected electron microscopy images of single-phase Sm2Zr2O7 show that atoms of different colors are arranged periodically as indicated within the dashed box, clearly demonstrating the structural order (Fig. S7H, ESI†). To more precisely determine the regions of strain within the crystal, geometric phase analysis (GPA) was employed to compute the strains along the X, Y, and XY directions. This technique begins with the careful selection of two nonlinearly correlated diffraction spots for analysis (Fig. S7I, ESI†). Two-dimensional high-resolution images of positive space were defined and used as a reference to measure the distortion of the high-resolution lattice of the experimental group. Using GPA plug-in software (HREM Research Inc.) in Digital Micrograph software (Gatan), the surface of the HEZO ceramic sample was calculated and analyzed. The offset distance between experimental lattice fringes and theoretical lattice fringes (without strain) is calculated by the Fourier transform of lattice fringes so that more accurate strain information can be obtained. Since tensile strain and compressive strain were paired in the crystal, the inversion points of a large number of light and dark tones in the image correspond to the distribution range of tension-compressive strain within the nanodomain (Fig. 2I). In order to correlate the phenomenon of the local strain structure with the defect concentration, three different regions a, b and c were selected to calculate the strain intensity and oxygen vacancy concentration. The results show that the oxygen vacancy defect concentration increases with the increase in strain intensity (Fig. S8, ESI†).
Hosts with different specific surface areas obtained at different milling times have little effect on lithium ion diffusion (Fig. S9A, ESI†). High temperature treatment can produce a rich micropore/mesopore characteristic on the surface, which is conducive to the diffusion and migration of ions in the subsequent electrochemical process. To understand this fact, the Brunauer–Emmett–Teller surface area and pore volume were calculated to be up to 152 m2 g−1 and 2.0 cm3 g−1, respectively (Fig. S9B, ESI†). Such a large surface area and suitable pore distribution enhance the exposure of active sites and accelerate nucleolar migration during electrochemical reactions. Similarly, thermogravimetric (TG) analysis after sulfur infiltration conducted at a mass ratio of 1:4 and 155 °C showed that the sulfur content in the high-entropy pyrochlore-type oxide reaches 76.6%. This indicates that 95.75% of the elemental sulfur is constrained within the HEZO material (Fig. S10, ESI†).
Electrochemical and electrocatalysis performance of the HEZO-S cathode
Stimulated by the observed electronic and structural characteristics, a coin-cell system was assembled to evaluate the electrochemical performance. To investigate the effect of entropy composition on battery performance, seven groups of pyrochlore ceramics with varying molar ratios were synthesized: (La0.15Nd0.15Sm0.40Eu0.15Gd0.15)2Zr2O7, (La0.15Nd0.20Sm0.35Eu0.15Gd0.15)2Zr2O7, (La0.10Nd0.25Sm0.35Eu0.15Gd0.15)2Zr2O7, (La0.10Nd0.25Sm0.30Eu0.15Gd0.20)2Zr2O7, (La0.10Nd0.20Sm0.25Eu0.25Gd0.20)2Zr2O7, (La0.15Nd0.20Sm0.25Eu0.20Gd0.20)2Zr2O7, and (La0.20Nd0.20Sm0.20Eu0.20Gd0.20)2Zr2O7. These ceramics were labeled as HEZO, HEZO-2, HEZO-3, HEZO-4, HEZO-5, HEZO-6, and HEZO-7, respectively, with their calculated configurational entropy values (R) gradually increasing: 1.504, 1.513, 1.543, 1.544, 1.567, 1.581, and 1.609. The band gaps of seven different high-entropy components were compared using the Tauc curves of UV-Vis diffuse reflectance spectra, and it was found that (La0.15Nd0.15Sm0.40Eu0.15Gd0.15)2Zr2O7 (HEZO) has the lowest bandgap width. The kinetic speed was evaluated by comparing the Tafel slope, lithium ion diffusion ability, and reaction current density of samples with different components. The results all indicated that the HEZO component has the least kinetic delay in the sulfur cathode (Fig. 3A and Fig. S11–S13, ESI†). | ||
| Fig. 3 Electrochemical performance of the HEZO-S cathode. (A) Tafel slopes of different HEZO components. (B) Long-cycling performance at 0.1C. (C) Rate capabilities from 0.1C to 2C. (D) Long-cycling performance with different sulfur loading values at 0.5C. (E) Galvanostatic discharge–charge curves of different cycle numbers at 0.1C. (F) Galvanostatic discharge–charge curves of different current densities at the 100th cycle. (G) Ratio of low to high platform capacity at different rates. CV curves of (H) the HEZO-S normal cell and (I) the HEZO-Li2S6 catholyte symmetric cell. | ||
Using HEZO-S as the working electrode and lithium foil as the counter electrode, the battery exhibited outstanding performance. At a sulfur loading of 2 mg cm−2 and an electrolyte-to-sulfur (E/S) ratio of 5.3 μL mg−1, it delivered a discharge capacity of 1507 mA h g−1. Even after 150 cycles at a low current density of 0.1C, the cell maintained a reversible capacity of 1238 mA h g−1, with the capacity retention rate exceeding 80% and the average coulombic efficiency exceeding 99.68% (Fig. 3B). Comparatively, the composite electrode materials La2Zr2O7-S, Nd2Zr2O7-S, Sm2Zr2O7-S, Eu2Zr2O7-S, Gd2Zr2O7-S and ZrO2-S demonstrated lower performance and higher concentration polarization (Fig. S14 and S15, ESI†). In addition, after 3 cycles of stable activation with low current, the HEZO-S cathode demonstrated superior rate performance at varying current densities (Fig. 3C). At current densities of 0.1, 0.2, 0.5, 1.0, and 2.0C, the discharge capacities were 1426, 1322, 1208, 1110, and 1002 mA h g−1, respectively. Upon returning to 0.1C after a gradient increase in current density, the capacity of the HEZO-S cathode recovered to 1417 mA h g−1 with a capacity retention rate of 99.5% and an average coulombic efficiency above 99%. Compared with the other two groups of electrodes, HEZO-S displayed superior capacity retention and coulombic efficiency (Fig. S16, ESI†). Moreover, when the sulfur loading on the circular electrode increased to 7.06 mg cm−2 (E/S ratio of 5.8 μL mg−1), the HEZO-S electrode still delivered an areal capacity of 7.35 mA h cm−2 (Fig. 3D). After 100 cycles, the reversible areal capacity remained at 6.79 mA h cm−2. Further increasing the loading to 10.27 mg cm−2 resulted in an areal capacity of 9.32 mA h cm−2, maintaining 8.863 mA h cm−2 after 100 cycles. Fig. 3E shows the constant current charge–discharge curve of the HEZO-S electrode at a low current density of 0.1C, which indicated sulfur utilization of 86%, 83%, and 78% in the 5th, 50th, and 100th cycles, respectively, with a minimal voltage plateau difference. At the same time, the constant current charge–discharge curve of the same cycle (100 cycles) at different charge–discharge ratios further proves the advantage of the high-entropy oxide HEZO-S cathode (Fig. 3F). Specifically, the effective sulfur utilization of HEZO-S at different current densities was better than that of the other two cathodes (Fig. S17, ESI†).
The efficient utilization of the HEZO-S cathode is attributed to its stable cycling durability and high-rate capacity, facilitated by the high conductivity of the sulfur host and its electrocatalytic effect on intermediate polysulfides. Furthermore, the electrochemical impedance spectroscopy (EIS) fitting analysis was conducted to investigate the charge transfer resistance and Warburg impedance of the HEZO-S, Sm2Zr2O7-S, and ZrO2-S cell cathodes (Fig. S18, ESI†). Additionally, the voltage profiles of the SZO-S cathode at 0.1C were obtained to further investigate the internal resistance (Fig. S19, ESI†). It was observed that HEZO-S exhibits significantly lower internal resistance during both the S lithiation and Li2S decomposition, indicating higher conductivity during electrochemical processes. This facilitates the accelerated kinetics of sulfur and intermediate LiPSs. The degree of conversion can be verified by the ratio of low-potential plateau capacity to high-potential plateau capacity. As the current density of the HEZO-S cell increases from 0.1C to 2C, the ratio at low and high potentials remained closer to the theoretical value of 3 (measured values of 2.77, 2.63, 2.55, and 2.49) and significantly higher than that of the other two control cells. Additionally, there is almost no attenuation in the potentials for electrochemical conversion at high and low potentials (Fig. 3G and Fig. S20, S21, ESI†), indicating a more complete conversion of the sulfur cathode.
The CV curves of the three cathodes at a scanning rate of 0.5 mV s−1 (Fig. 3H and Fig. S22, S23, ESI†) reveal that HEZO-S exhibits superior electrochemical performance due to enhanced redox kinetics and higher catalytic activity. The current density of the maximum reduction peak for HEZO-S was found to be 1.02 mA cm−2 and 1.47 mA cm−2, and the current density of the maximum oxidation peak was 3.33 mA cm−2. Furthermore, the differential CV curves were analyzed to accurately compare the initial potentials of the electrochemical conversion reactions. For the reduction reaction, the initial potentials of the HEZO-S electrode were 2.45 V and 2.08 V, while for the oxidation reaction, the initial potential was 2.15 V. Furthermore, linear sweep voltammetry (LSV) curves (Fig. S24, ESI†) were obtained to determine Tafel slopes and were used to evaluate the catalytic kinetics of the SRR. In the HEZO-S reduction, the Tafel slopes of peak I and peak II were only 29.83 and 34.36 mV dec−1 (Fig. S25, ESI†), whereas for oxidation, the Tafel slope was 54.7 mV dec−1 (Fig. S26, ESI†). HEZO-S demonstrated the smallest Tafel slopes in both the reduction and oxidation processes, indicating faster kinetic conversion of lithium polysulfides for HEZO-S. Otherwise, two different lithium polysulfides (Li2S4 and Li2S6) were used as electrolytes at the same concentration. The HEZO electrode exhibited a larger reaction current density (2.7 mA cm−2) in the CV curve with Li2S4 electrolyte (Fig. 3I and Fig. S27, ESI†). Moreover, the HEZO/Li2S4/HEZO symmetric cell showed more favorable reaction potentials and kinetics. Specifically, the maximum reduction peak currents corresponded to potentials of 0.055, −0.072, and −0.301 V, while the maximum oxidation peak currents corresponded to potentials of −0.013, 0.269, and 0.413 V. These results essentially indicate that the rapid conversion of Li2S4 is the key factor for performance enhancement in high-entropy pyrochlore-type oxides.
In situ electrochemical confocal Raman spectroscopy and visualization of Li2S4 dynamics
To conclusively demonstrate that Li2S4 is the key factor in enhanced electrocatalytic performance, in situ Raman spectroscopy was used to monitor the HEZO-S battery during real-time constant current charge–discharge cycling. Observations indicated that HEZO-S follows the classical stepwise lithiation of S8. Remarkably, after the low potential plateau, characteristic Raman peaks for LiPSs were hardly observed (Fig. 4A and B), indicating the sole presence of Li2S in the system. This is distinct from the Sm2Zr2O7-S and ZrO2-S cathodes, where characteristic Raman peaks of liquid-phase LiPSs were still evident (Fig. S28 and S29, ESI†). Significant amounts of LiPSs in HEZO-S started to produce upon charging to 2.3 V, while the other two electrodes exhibited intermittent and scattered LiPS signals throughout the charging process. | ||
| Fig. 4 In situ monitoring of electrocatalytic processes by Raman spectroscopy. (A) HEZO-S of the time sequence of Raman spectra obtained during the discharge process. (B) HEZO-S of the time sequence of Raman spectra obtained during the charge process. (C) In situ electrochemical confocal Raman spectra. (D) Summary of Raman lines at different discharge depths of OCP, 25%, 50%, and 80%. (E) Summary of Raman lines at different charge depths of 10%, 25%, 50%, and 80%. (F) 2D projection mapping of different discharge depths based on S8 and Li2S4 characteristic peaks with a scale of 1 μm. (G) The actual utilization of Li2S4 in different discharge states. (H) 2D projection mapping of different charge depths based on S8 and Li2S4 characteristic peaks with a scale of 1 μm. (I) The actual utilization of Li2S4 in different charge states. | ||
It is well known that in situ Raman spectroscopy provides an average response of the Raman signals within the illuminated laser spot. By integrating confocal technology with Raman spectroscopy, one can acquire the phase distribution through point-by-point scanning within a specified area, thereby enhancing the decoupling of critical information pertaining to the sulfur cathode with improved spatial and temporal resolution. The underlying principle of this technique is depicted in Fig. 4C, where an especially designed battery cell mold was positioned under the optical microscope of the Raman spectrometer. A fixed objective region was chosen for the collection of Raman signals, and two external wires were connected to the battery cell mold, which in turn was connected to an electrochemical workstation. This setup enables the charge–discharge cycling process at a constant current while simultaneously recording the characteristic peak signals of the products within the microscopic field. Compared to conventional in situ Raman spectroscopy, we focused on in situ electrochemical Raman laser and microscopic imaging on the same confocal area (4 × 4 μm2). By performing frame-by-frame scanning with the Raman laser (at a rate of 0.02 × 0.02 μm2 s−1), the characteristic peaks of LiPSs (range 50–700 cm−1) with high spatial accuracy were obtained in this confocal region. The confocal acquisition approach offers three distinct advantages: (1) it captures the locational information of the sulfur cathode and intermediate polysulfides within the illuminated laser spot; (2) it monitors the concentration fluctuations of the sulfur cathode and intermediate polysulfides at the same location as the voltage varies; and (3) it precisely differentiates between sulfur and intermediate phase information using multi-characteristic peak combination plotting techniques. Based on the above principle, the Raman signals of the three characteristic peaks (152, 220, and 475 cm−1) of S8 in the initial state were obtained as references (Fig. 4D and E). Meanwhile, NGS LabSpec software was used to perform subtractive liquid phase background and peak intensity normalization processing on all the obtained spectra. We extracted the intensifications of two characteristic fingerprint vibration peaks of Li2S4 at 200 cm−1 and 450 cm−1, quantified the projection of the Raman two-dimensional (2D) plane (Fig. 4F), and obtained the superposition of two different Gaussian distribution color mappings. Since the calibration of the Raman characteristic peak intensity of a specific LiPS is directly related to the color contrast of the image, the change in the Raman two-dimensional mapping area can be equivalent to the phase conversion efficiency. This allows for the visualization of the phase distribution within the confocal area. The position and concentration of the Li2S4 Raman signal at discharge depths of 25%, 50%, and 80% and charge depths of 10%, 25%, 50%, and 80% were recorded. The superimposed mapping of these two characteristic peaks (200 and 450 cm−1) is helpful for accurately analyzing the actual conversion efficiency of Li2S4.
In this map, the white and purple regions represent the distribution of elemental sulfur (S8) and Li2S4, respectively, while the black regions indicate the distribution of lithium sulfide (Li2S). By evaluating the changes in the area of the 2D projection mapping at varying depths of discharge (DOD), we establish a correlation between the actual conversion efficiency of Li2S4 and the practical battery capacity under different configurational entropy values. As the discharge depth increases, the peak intensity of S8 gradually diminishes, and part of the Raman 2D projection mapping corresponding to S8 is progressively replaced by signals from intermediate LiPSs. As a result, at discharge states of 10% and 25%, the original bright regions gradually differentiate into three color regions: purple, white, and black, representing S8, Li2S4, and Li2S2/Li2S, respectively. The mapping area becomes predominantly black as Li2S2/Li2S does not produce Raman characteristic signals. When the cutoff discharge depth reaches 80%, a small amount of white remaining is observed, indicating residual Li2S4. To validate the reliability of using the S8 peak projection area as a reference for quantifying phase evolution, key discharge depths of 10%, 25%, and 80% were selected, where the theoretical proportions of Li2S4 distribution in the selected region are 40%, 100%, and 0%, respectively. The corresponding experimental values were found to be 38.6%, 95.3%, and 1.5%, respectively (Fig. 4G), which closely match the theoretical values. In contrast, during the charging process at depths of charge (DOC) of 25%, 50%, 75%, and 90%, the actual conversion proportions of polysulfides (Sx2−) to S8 were 18.9%, 48.5%, 71.4%, and 86.4%, respectively (Fig. 4H, I and Fig. S28, S29, ESI†). High-resolution in situ confocal Raman spectroscopy, combined with electrochemical charge–discharge analysis, accurately reflects the critical role of the pyrochlore-structured high-entropy oxides in facilitating the effective conversion of Li2S4. This conversion is essential for enhancing the capacity of Li–S batteries. Comparing the conversion ratios under different high-entropy compositions, it is evident that (La0.15Nd0.15Sm0.40Eu0.15Gd0.15)2Zr2O7 (R = 1.504) exhibits the optimal electrocatalytic performance for Li2S4 conversion.
Electrocatalytic performance under a DFT decoupling electric field and crystal field regulation
The adsorption free energy of intermediate polysulfides (ΔG(LiPSs*)) on ABOx catalysts is a critical indicator that reflects the intrinsic catalytic activity for the SRR involving LiPS species.44–46 The indicator can be preliminarily assessed through a visualized adsorption experiment of Li2S4 solution (Fig. 1B). It is worth noting that the Sm2Zr2O7 host exhibits slightly stronger adsorption capability towards Li2S4 compared to the HEZO. However, during the evaluation of battery performance, HEZO demonstrated a more efficient utilization of the sulfur cathode. This suggests that the SRR process shares fundamental similarities with other well-studied electrocatalytic reactions, where the adsorption properties of key intermediates govern the reaction kinetics. The volcano-shaped relationship indicates the existence of an optimal adsorption strength that can maximize the reaction rate, highlighting the pivotal role of Li2S4 kinetics in the overall electrocatalytic performance. Furthermore, the insights gained from the Zr–O bond activation and band gap reduction emphasize the importance of the electronegativity and crystal field splitting modifications induced by the high-entropy approach. To gain a deeper understanding of the Li2S4 transformation mechanism, a DFT analysis of the three key intermediate states (Li2S4*, LiS2*, and Li2S2*) involved would provide valuable insights.Within the strongly correlated system of rare earth metals, DFT+U calculations indicate that as the U value increases, the contraction effect of La-based rare earth metals significantly impacts the electronic structure of the f orbitals (Fig. S30, ESI†). Therefore, it is essential to determine the reasonable values of U by considering the actual UV solid-state diffuse reflectance spectra to ascertain the positioning of the f orbitals. Based on this, the U values of the rare earth elements were determined to be ULa = 2.8 eV, UNd = 5 eV, USm = 1 eV, UGd = 6.9 eV, and UEu = 4.0 eV. In constructing the adsorption model of a complex high entropy system, Zr is more predisposed to interact with the highest occupied molecular orbital (HOMO) and the lowest unoccupied molecular orbital (LUMO) of Li2S4. The EXAFS analysis result of the Zr clearly demonstrates the existence of specific regularities in the atomic-scale structure of high-entropy materials. The discovery that only three rare earth elements can directly bond with Zr provides strong experimental evidence for the establishment and validation of the adsorption mechanism model. Based on this, two adsorption configurations, HEZO-(100)-Zr and SmEuGd-Zr, were selected to simulate the steady-state adsorption and the oxygen vacancy was considered in the model (Fig. 5A and B). DFT+U computations were performed to formulate three adsorption configurations of Li2S4, LiS2, and Li2S2 affixed to Zr surfaces, and by analyzing the Zr–O bond lengths and correlating them with adsorption geometries of ΔG(LiS), ΔG(LiS2), and ΔG(Li2S2), three adsorption configurations of Li2S, LiS2, and Li2S2 on the Zr surface were determined using DFT+U calculations (Fig. 5C). The (100) and (111) active crystal facets of HEZO were selected as model structures for the simulations. The results show five Zr–O adsorption sites for Li2S, LiS2, and Li2S2 molecules, labeled as Zr4–O15, Zr4–O26, Zr15–O26, Zr15–O16, and Zr15–O10. During the adsorption, activation, and desorption processes of Li2S4 on the surface, under the steady-state adsorption of Li2S4*, LiS2*, and Li2S2*, it was observed that the Zr–O bond lengths on the exposed (100) and (111) facets of HEZO are longer than those in Sm2Zr2O7. This indicates a further weakening of Zr–O covalency during the discharge process. Conversely, the adsorption energies (ΔGLi2S4 and ΔGLi2S2) of the Zr sites on the (100) and (111) facets of HEZO are lower than those on Sm2Zr2O7–Zr (Fig. 5D), suggesting that the adsorption energy of polysulfides decreases as the covalency weakens. Ex situ extended X-ray absorption fine structure (EXAFS) analysis near the Zr K-edge reveals that compared to the initial Zr–O bond length of 1.62 Å in HEZO, the bond length increases to 1.78 Å at a 50% depth of discharge, consistent with the theoretical model structure (Fig. 5E). The projected density of states (pDOS) of Zr shows an enhanced overlap between the Zr f and d orbitals, providing a faster pathway for electron migration (Fig. 5F). Additionally, the adsorption structures on the (100) and (111) facets of HEZO exhibit downhill Gibbs free energy distributions, demonstrating that HEZO with oxygen vacancy defects has superior performance in accelerating the overall sulfur redox reaction (SRR) process in lithium–sulfur batteries (Fig. 5G and Fig. S31–S34, ESI†).
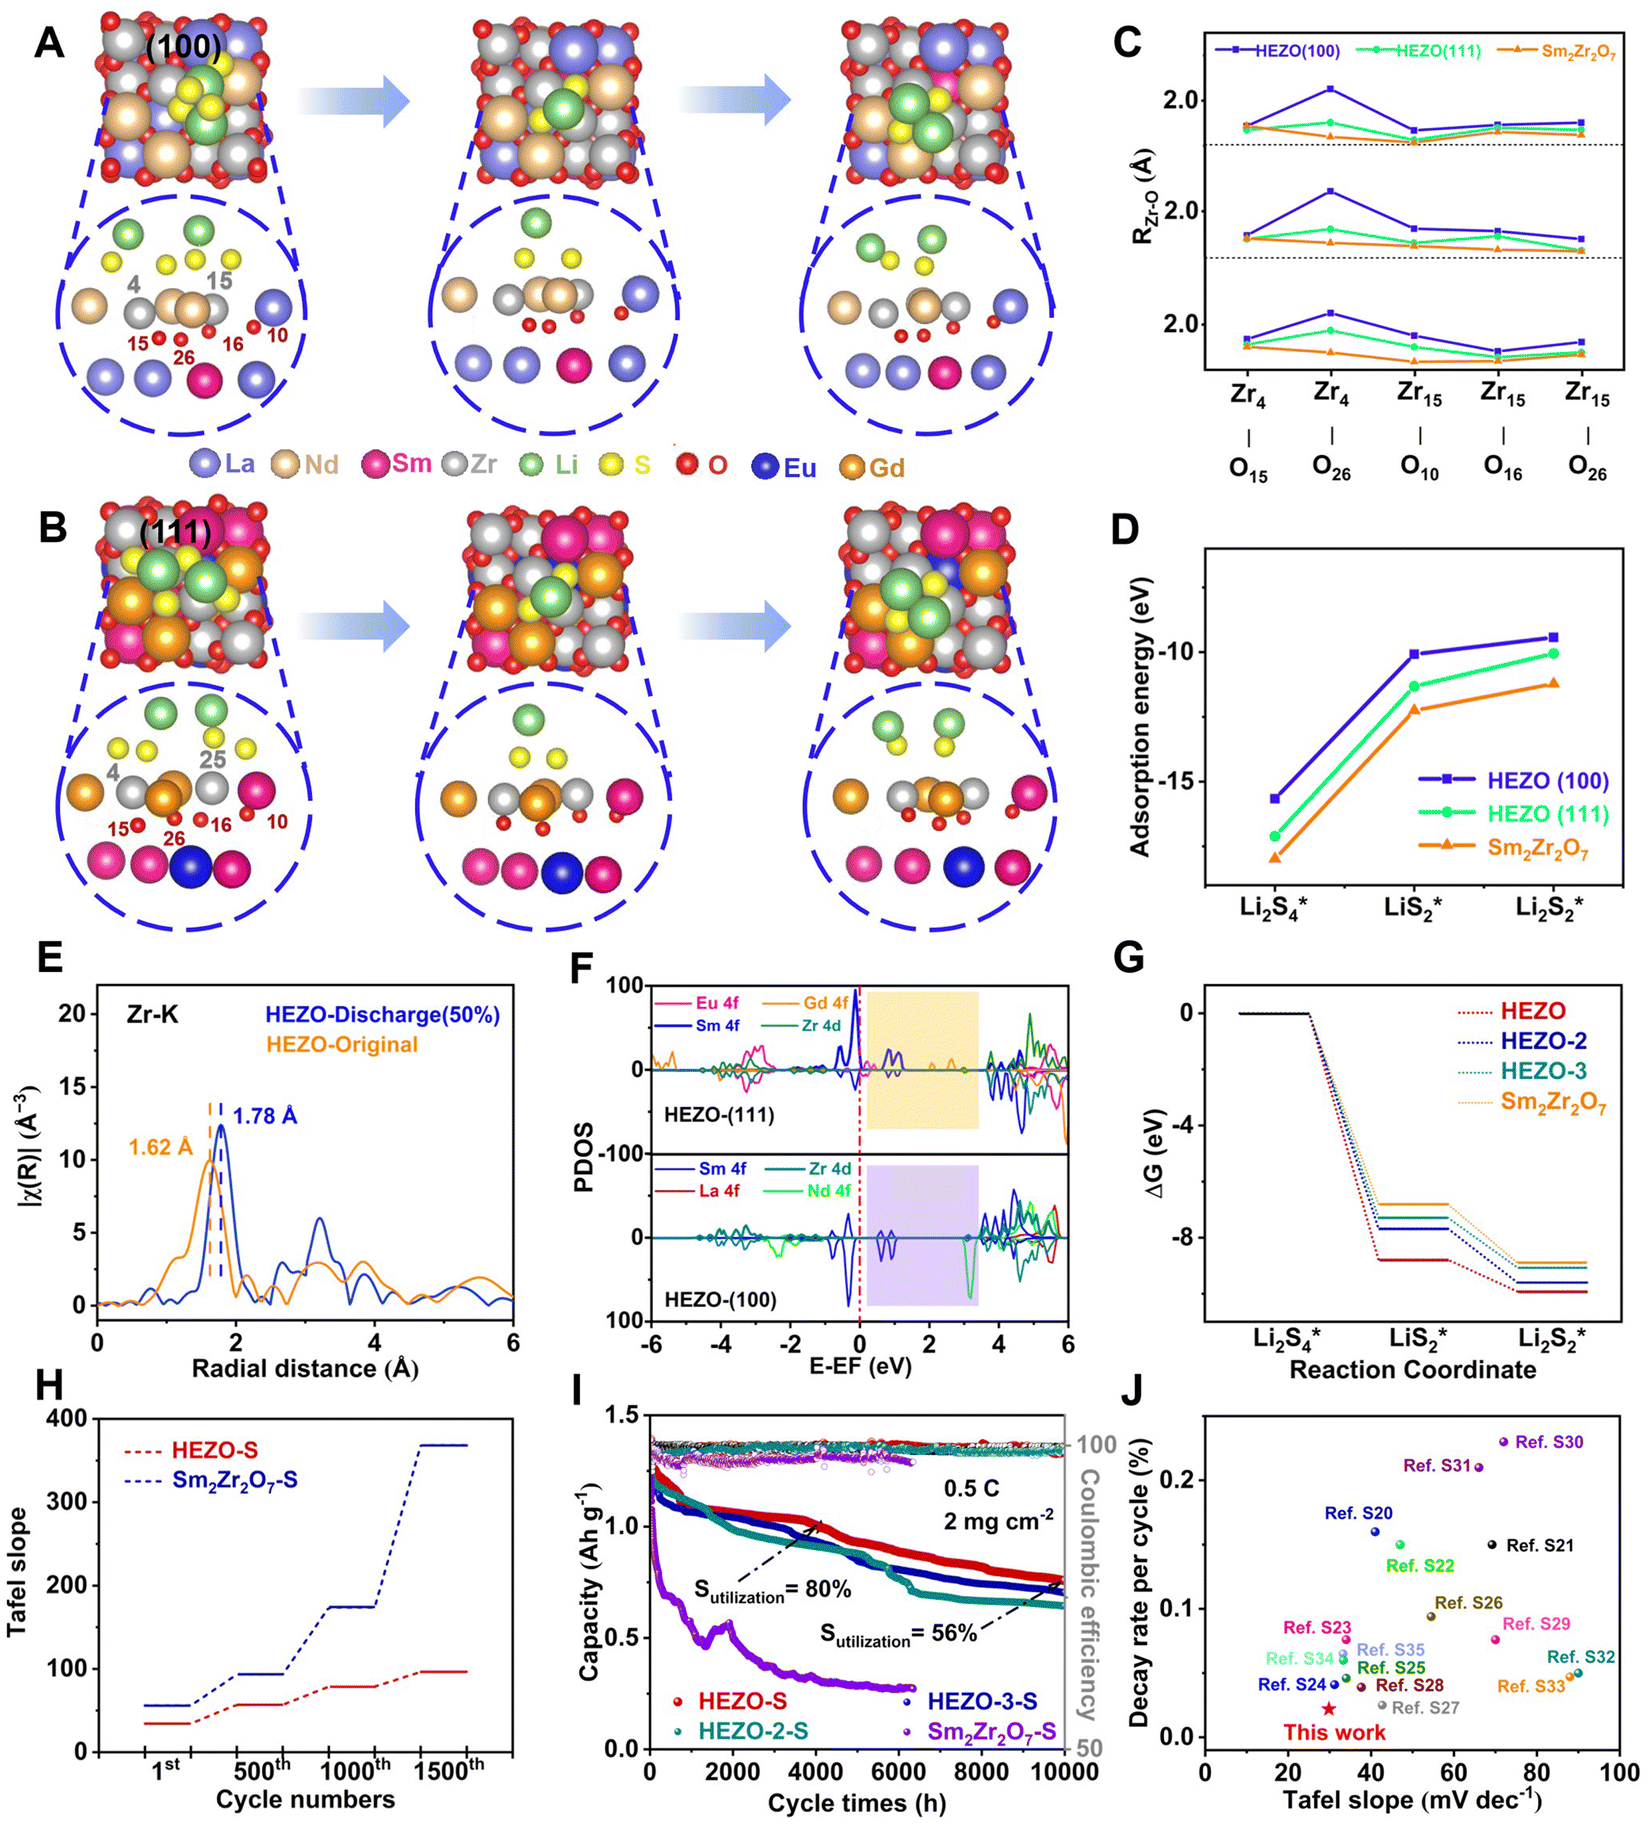 | ||
| Fig. 5 First-principles calculations and electrocatalytic kinetic characterization of ultra-durable HEZO-S cathode performance. (A) The steady-state configuration of the adsorption, activation, and desorption of Li2S4 by exposed Zr sites on HEZO (100) crystal faces with oxygen vacancies. (B) The steady-state configuration of the adsorption, activation, and desorption of Li2S4 by exposed Zr sites on HEZO (111) crystal faces with oxygen vacancies. (C) The length of the Zr–O bond at the Zr site of (100) and (111) crystal faces in three adsorption states in the transformation of Li2S4. (D) Adsorption energy at the Zr site of (100) and (111) crystal faces in three adsorption states. (E) HEZO-S discharge depths of 0% and 50% Zr k edge Fourier transform EXAFS k3 χ(k) data. (F) PDOS of the (top) Zr site of (111) crystal faces and (down) (100) crystal faces. (G) Gibbs free energy diagram of Li2S4 conversion steps of the HEZO and Sm2Zr2O7 substrate. (H) HEZO-S and Sm2Zr2O7-S batteries of the Tafel slope under different cycle periods. (I) Long cycle performance. (J) Comparison of HZEO with recently reported capacity decay rates and Tafel slopes of oxide electrocatalysts in extended cycles.20–35 | ||
To corroborate the theoretical analysis and DFT+U calculation results, HEZO-S and Sm2Zr2O7-S electrodes were incorporated into coin cells. As the discharge cycles of the battery devices escalated from 1 to 500, 1000, and 1500 cycles, the Tafel slope of HEZO-S increased from 34.36 to 56.89, 78.63, and 96.38 mV dec−1, representing an increase of approximately 180% (Fig. 5H). Notably, the HEZO-S battery was still capable of undergoing reversible charge and discharge at over 4000 cycles and more than 10000 hours of operation at the time of publication, with an average coulombic efficiency of 99.51% (Fig. 5I). By modulating the crystal field splitting energy and electronegativity of the high-entropy ceramic, we optimize the electronic structure of the active sites and their covalency with oxygen. This adjustment leads to efficient electrocatalytic conversion in the key process of the sulfur redox reaction, providing material support for the full performance of battery devices. In practical applications, the HEZO-S battery can still operate stably even after 10000 hours of charge and discharge, and the reversible capacity is still 55% (Fig. 5J). When the surface capacity of the soft pack battery is 2 mg cm−2 and the E/S ratio is 5.3 μL mg−1, it can still maintain 3 h of illumination for the LED lamp after 150 cycles (Fig. S35, ESI†). The surface load of the soft pack battery was further increased to 11.2 mg cm−2, the E/S ratio was reduced to 1.7 μL mg−1, and the reversible discharge capacity at a current density of 0.5C was 649 mA h g−1 after 100 cycles, with an average Coulomb efficiency of 99.58% (Fig. S36, ESI†). This shows the significant advantages of high-entropy engineering to improve electrocatalytic activity in battery performance.
Conclusions
In summary, we have developed one novel ultrarapid sintering method to successfully synthesize a pyrochlore-type high-entropy metal oxide, (La0.15Nd0.15Sm0.40Eu0.15Gd0.15)2Zr2O7 (HEZO), which serves as an efficient electrocatalyst for Li–S batteries. The reduced electronegativity and crystal field splitting energy jointly modulate the electronic structure of Zr and the covalency of the Zr–O bond, effectively mitigating the intrinsic adsorption strength of Li2S4. Furthermore, localized electrons, derived from the f orbitals, contribute to the formation of an electronic buffer band that acts as a reservoir between the UHB and the LHB, significantly enhancing the catalytic activity towards the sulfur redox reaction. Notably, within this highly disordered high-entropy system, a form of inherent ordering was found. This not only establishes a new benchmark for ABOx-based catalysts but also surpasses the electrocatalytic performance of hierarchical porous carbon materials. It furthermore demonstrates exceptional durability, sustaining stable operation for 10000 hours at a current density of 0.5 C. These are all exciting evidence that the application of high-entropy engineering in the design of electrocatalysts offers an innovative strategy to enhance the high-rate capability and ultra-durable performance of Li–S batteries, thereby boosting their competitiveness on the market.
Methods
Synthesis of the (La0.15Nd0.15Sm0.40Eu0.15Gd0.15)2Zr2O7 (HEZO) hosts
10 mmol of ZrO2, 0.75 mmol of La2O3, Nd2O3, Eu2O3, and Gd2O3, and 2 mmol Sm2O3 were accurately weighed and placed in a planetary ball mill. The ball-to-material mass ratio was set at 6:1, and a sufficient amount of ethanol was added to completely immerse the powder. The mixture was then ball-milled at 560 rpm min−1 for 10 hours. Afterward, the slurry was transferred to a rotary evaporator to remove ethanol. The obtained slurry was then dried overnight at 60 °C in an oven, resulting in a pale white powder. Subsequently, the dried powders were mixed in a mass ratio of 1:5 and blended in a molten salt mixture of NaCl/KCl (1:1). The mixture was then heated in a muffle furnace at a rate of 5 °C min−1 until 1200 °C was reached, and the powders were sintered at this temperature for 1 h. After the furnace cooled down to room temperature, the crucible was immersed in water to dissolve NaCl/KCl. Finally, after washing it with water and absolute ethanol several times, it was dried at 80 °C overnight.
Preparation of Sm2Zr2O7 hosts
0.01 mol of ZrO2 and 0.005 mol Sm2O3 were accurately weighed and placed in a planetary ball mill. The ball-to-material mass ratio was set at 6:1, and a sufficient amount of ethanol was added to completely immerse the powder. The mixture was then ball-milled at 560 rpm min−1 for 10 hours. Afterward, the slurry was transferred to a rotary evaporator to remove the ethanol. The obtained slurry was then dried overnight at 60 °C in an oven. Subsequently, the dried powders were mixed in a mass ratio of 1:5 and blended in a molten salt mixture of sodium NaCl/KCl (1:1). The mixture was then heated in a muffle furnace at a rate of 5 °C min−1 until 1200 °C was reached, and the powders were sintered at this temperature for 1 h. After the furnace cooled down to room temperature, the crucible was immersed in water to dissolve NaCl/KCl. Finally, after washing with water and absolute ethanol several times, it was dried at 80 °C overnight.
Preparation of the (La0.15Nd0.15Sm0.40Eu0.15Gd0.15)2Zr2O7–S (HEZO-S) cathode
HEZO and pure sulfur powder (1:4 in mass ratio) were blended and ground for 15 min. Then, the mixture was shifted into an autoclave at 155 °C for 10 h. After cooling down, the product was annealed at 255 °C for half an hour under a flow of nitrogen gas to eliminate the residuary sulfur particles. For comparison, Sm2Zr2O7–S and ZrO2–S composites were prepared using a procedure similar to those of the (La0.15Nd0.15Sm0.40Eu0.15Gd0.15)2Zr2O7–S composite instead of the zinc atomic cluster with single zinc atom and without the zinc cluster, except the dopamine hydrochloride.
Synthesis of the HEZO with different proportion components
All the synthesis steps are the same as those for the HEZO mentioned above, with the difference in the molar ratio from the initial raw material. Specifically speaking, 10 mmol of ZrO2, 0.5 mmol of La2O3, 1.25 mmol of Nd2O3, 0.75 mmol of Eu2O3, Gd2O3, and 1.75 mmol Sm2O3 afforded HEZO-2; 10 mmol of ZrO2, 0.75 mmol of La2O3, Eu2O3, Gd2O3, 1 mmol of Nd2O3, and 1.75 mmol Sm2O3, afforded HEZO-3; 10 mmol of ZrO2, 0.5 mmol of La2O3, 1.25 mmol of Nd2O3, 0.75 mmol of Eu2O3, 1 mmol of Gd2O3, and 1.5 mmol Sm2O3, afforded HEZO-4; 10 mmol of ZrO2, 0.5 mmol of La2O3, 1 mmol of Nd2O3, 1.25 mmol of Eu2O3, Sm2O3, and 1 mmol Gd2O3, afforded HEZO-5; 10 mmol of ZrO2, 0.75 mmol of La2O3, 1 mmol of Nd2O3, Eu2O3, Gd2O3, and 1.25 mol Sm2O3, afforded HEZO-6; and 10 mmol of ZrO2, 1 mmol of La2O3, Nd2O3, Eu2O3, Gd2O3, and Sm2O3, afforded HEZO-7.Materials characterization
X-ray diffraction (XRD) measurements with Cu Kα radiation (60 kV, 200 mA) were performed using a PANalytical X'Pert3 X-ray Powder Diffractometer. Field-emission scanning electron microscopy (FESEM, Hitachi S-4800, Japan) images and energy dispersive X-ray (EDX) spectra were captured using an S-4800 field-emission scanning electron microscope. High-resolution transmission electron microscopy (HRTEM) images were obtained from the transmission electron microscope assembled with a JEOL-2200FS Dual SDD system. Atomic-resolution HAADF-STEM images were obtained on a FEI Titan Cubed Themis G2 300 working at 200 kV. Thermogravimetric analyses (TGAs) were performed using an America Q600SDT analyzer under a N2 atmosphere. The nitrogen adsorption–desorption isotherms were collected using a Micromeritics ASAP 2000 system at 77 K. The corresponding pore size distribution was calculated by the Barrett–Joyner–Halenda model using the adsorption branch. X-ray photoelectron spectra were obtained on an AXIS Supra instrument from Kratos using monochromatic Al Kα radiation. All binding energies were calibrated by setting the measured C 1s peak to 284.5 eV. X-ray photoelectron spectroscopy (XPS) measurements were conducted on an AXIS Supra instrument. The in situ Raman measurement was performed using a Horiba Jobin Yvon LabRAM ARAMIS system with an excitation laser line of 532 nm with the electrochemical cycling of an in situ battery (Beijing Science Star Technology Co. Ltd). The instrument was calibrated with respect to the silicon peak at 520.8 cm−1.Electrochemical measurements
To prepare the composite cathode, a mixture composed of 70 wt% sulfur host, 20 wt% conductive carbon black, and 10 wt% polyvinylidene fluoride (PVDF) in N-methyl-2-pyrrolidinone (NMP) solvent (98%) was firstly stirred for 10 hours to form the homogeneous slurry. Following that, the slurry was carefully painted onto the collector and dried in a vacuum oven at 60 °C overnight to achieve the composite cathode. Coin-type CR2032 cells were prepared in an Ar-filled glovebox (H2O and O2, <0.1 ppm) by using a Celgard 2500 membrane as a separator and Li metal foil as a counter electrode. The electrolyte was 1 M LiTFSI in a mixture of DOL and DME (1:1 in volume) with 1 wt% additive of LiNO3. Linear sweep voltammetry (LSV) and cyclic voltammetry (CV) were performed in a voltage window range of 1.7–2.8 V by using a Land CT2001A battery measurement instrument and CHI760 electrochemical measurement in a thermostatic test box, respectively. Electrochemical impedance spectroscopy (EIS) was performed in a frequency range from 0.01 Hz to 100 kHz on a system. To further analyze the influence of different systems on the redox process of lithium polysulfides, a symmetrical cell was used to perform CV tests to analyze the redox behavior of three different polysulfide electrolytes within the voltage window from −1.2 to 1.2 V at a scan rate of 2 mV s−1. All electrochemical parameters in terms of current densities and specific capacities mentioned in this study are computed based on the sulfur content.
Density functional theory (DFT+U) calculations
Density functional theory calculations were performed using the Vienna ab initio simulation package (VASP) with a plane-wave basis set and the projector augmented-wave (PAW) method.47–50 The exchange–correlation potential was treated using generalized gradient approximation (GGA) with Perdew–Burke–Ernzerhof (PBE) parametrization.51 The valence states of the elements were defined as follows: La (11 valence electrons) – 5s25p65d16s2, Nd (14 valence electrons) – 4f45s25p66s2, Sm (14 valence electrons) – 4f65s25p66s2, Eu (14 valence electrons) – 4f75s25p66s2, Gd (14 valence electrons) – 4f75s25p66s2, and Zr (12 valence electrons) – 4s24p65s24d2. To address the limitations of GGA, we employed the GGA+U method in our calculations. The effective Hubbard U values were chosen as follows: U(4f) = 2.8 eV for La,52 U(4f) = 5.0 eV for Nd,52 U(4f) = 1.0 eV for Sm, U(4f) = 6.9 eV for Gd,53 and U(4f) = 4.0 eV for Eu, based on previous studies and DFT+U tests for Eu and Sm. We also applied the van der Waals correction of Grimme's DFT-D3 model.54 The energy cutoff was set to 550 eV, and Brillouin-zone integration was performed using a single Γ point (1 × 1 × 1). The structures were fully relaxed until the maximum force on each atom was less than 0.05 eV Å−1, and the energy convergence criterion was set to 10−6 eV. The Gibbs free energies of the intermediate evolution were calculated using the following expression:| ΔG = ΔE + ΔEZPE − TΔS |
In situ electrochemical confocal Raman spectroscopy (EC-CRS) measurement method
In situ confocal Raman spectroscopy characterization was performed as follows: The LabRam-ARAMIS confocal Raman spectroscopy and imaging system (placed in an air environment, controlled at a laboratory temperature of 20 ± 2 °C) were used to acquire Raman spectroscopic signals and mapping images. The in situ electrochemical Raman laser and microscopic imaging are focused on the same area (4 × 4 μm2). Raman laser frame-by-frame scanning (at a speed of 0.02 × 0.02 μm2 s−1) obtained a series of LiPS characteristic peaks with high spatial accuracy (ranging from 50 to 700 cm−1). All the obtained spectra were subjected to liquid phase background subtraction and peak intensity normalization using the NGS LabSpec software. The intensity of the specific characteristic peak was extracted, the projection of the Raman two-dimensional plane was quantified, and the color mapping of the intensity of the characteristic peak was obtained. The intensities of the three characteristic peaks (151 cm−1, 219 cm−1, and 475 cm−1) of S8 under the open-circuit potential condition were determined, Gaussian distribution superposition on the color mapping of the intensities of these three characteristic peaks was performed, and the initial mapping area of the sulfur cluster monomer was selected as a reference value for the active surface area. The 2D mapping area of Li2S4 at open circuit voltage can be considered as the initial concentration, and the change in the 2D mapping area under Li2S4 is compared by altering the charge–discharge states. In the constant potential experiments, the change in area is converted into the corresponding concentration and plotted against time. Constant potential and constant current measurements were achieved by using an electrochemical workstation (CHI660C) to control the voltage/reaction rate of the battery and monitor the current–time/voltage–time response.Data availability
The data supporting this article have been included as part of the ESI.†Conflicts of interest
The authors declare that there is no conflict of interest.Acknowledgements
This work was supported by the National Natural Science Foundation of China (project no. 52201269, 52471234, 52032001, 52101209, and 52371023), the Shenzhen KQTD Project (project no. KQTD20180411143400981) and the IER Foundation (project no. IERF202302). This work was also supported by the Collaborative Innovation Center of Suzhou Nano Science & Technology, the 111 Project, and Suzhou Key Laboratory of Functional Nano & Soft Materials. P. W. M. greatly acknowledges support from the German Federal Ministry of Education and Research in the framework of the project Catlab (03EW0015A/B).Notes and references
- P. G. Bruce, S. A. Freunberger, L. J. Hardwick and J.-M. Tarascon, Nat. Mater., 2012, 11, 19–29 CrossRef CAS PubMed.
- Y. X. Yang, Y. R. Zhong, Q. W. Shi, Z. H. Wang, K. N. Sun and H. L. Wang, Angew. Chem., Int. Ed., 2018, 57, 15549–15552 CrossRef CAS PubMed.
- Y. Wang, R. Zhang, J. Chen, H. Wu, S. Lu, K. Wang, H. Li, C. J. Harris, K. Xi, R. V. Kumar and S. Ding, Adv. Energy Mater., 2019, 9, 1900953 Search PubMed.
- D. A. Kuznetsov, B. Han, Y. Yu, R. R. Rao, J. Hwang, Y. Román-Leshkov and Y. Shao-Horn, Joule, 2018, 2, 225–244 Search PubMed.
- H. Liu, Z. Chen, L. Zhou, K. Pei, P. Xu, L. Xin, Q. Zeng, J. Zhang, R. Wu, F. Fang, R. Che and D. Sun, Adv. Energy Mater., 2019, 9, 1901667 CrossRef CAS.
- P. Wang, B. Xi, M. Huang, W. Chen, J. Feng and S. Xiong, Adv. Energy Mater., 2021, 11, 2002893 Search PubMed.
- Z. Chen, W. Lv, F. Kang and J. Li, J. Phys. Chem. C, 2019, 123, 25025–25030 CrossRef CAS.
- R. Li, D. Rao, J. Zhou, G. Wu, G. Wang, Z. Zhu, X. Han, R. Sun, H. Li, C. Wang, W. Yan, X. Zheng, P. Cui, Y. Wu, G. Wang and X. Hong, Nat. Commun., 2021, 12, 3102 CrossRef CAS PubMed.
- R. P. Forslund, C. T. Alexander, A. M. Abakumov, K. P. Johnston and K. J. Stevenson, ACS Catal., 2019, 9, 2664–2673 CrossRef CAS.
- Z.-Y. Guo, C.-X. Li, M. Gao, X. Han, Y.-J. Zhang, W.-J. Zhang and W.-W. Li, Angew. Chem., Int. Ed., 2021, 60, 274–280 Search PubMed.
- J. Dai, Y. Zhu, Y. Yin, H. A. Tahini, D. Guan, F. Dong, Q. Lu, S. C. Smith, X. Zhang, H. Wang, W. Zhou and Z. Shao, Small, 2019, 15, 1903120 CrossRef PubMed.
- J.-X. Lin, X.-M. Qu, X.-H. Wu, J. Peng, S.-Y. Zhou, J.-T. Li, Y. Zhou, Y.-X. Mo, M.-J. Ding, L. Huang and S.-G. Sun, ACS Sustainable Chem. Eng., 2021, 9, 1804–1813 CrossRef CAS.
- H. Li, P. Shi, L. Wang, T. Yan, T. Guo, X. Xia, C. Chen, J. Mao, D. Sun and L. Zhang, Angew. Chem., Int. Ed., 2023, 62, e202216286 CrossRef CAS PubMed.
- Z. Bai, Z. Wang, R. Li, Z. Wu, P. Feng, L. Zhao, T. Wang, W. Hou, Y. Bai, G. Wang and K. Sun, Nano Lett., 2023, 23, 4908–4915 CrossRef CAS PubMed.
- S. Chen, J. Zhang, Z. Wang, L. Nie, X. Hu, Y. Yu and W. Liu, Nano Lett., 2021, 21, 5285–5292 CrossRef CAS.
- W. Hou, P. Feng, X. Guo, Z. Wang, Z. Bai, Y. Bai, G. Wang and K. Sun, Adv. Mater., 2022, 34, 2202222 CrossRef CAS.
- W. Hou, R. Li, Z. Wang, L. Fang, Z. Bai, T. Wang, Y. Bai and K. Sun, J. Energy Chem., 2023, 81, 432–442 CrossRef CAS.
- É. A. Santos, C. G. Anchieta, R. C. Fernandes, M. J. Pinzón C, A. N. Miranda, I. Galantini, F. C. B. Maia, G. Doubek, C. B. Rodella, L. M. Da Silva and H. Zanin, Nano Energy, 2023, 116, 108809 Search PubMed.
- L. Wang, Z. Hu, X. Wan, W. Hua, H. Li, Q.-H. Yang and W. Wang, Adv. Energy Mater., 2022, 12, 2200340 Search PubMed.
- W. Zhang, D. Hong, Z. Su, S. Yi, L. Tian, B. Niu, Y. Zhang and D. Long, Energy Storage Mater., 2022, 53, 404–414 Search PubMed.
- D. E. Mathew, G. J. Rani, D. P. Jenis, S. Thomas and A. M. Stephan, ChemistrySelect, 2021, 6, 7628–7635 CrossRef CAS.
- R. Xiao, S. Yang, T. Yu, T. Hu, X. Zhang, R. Xu, Y. Wang, X. Guo, Z. Sun and F. Li, Batteries Supercaps, 2022, 5, e202100389 CrossRef CAS.
- W. Hua, H. Li, C. Pei, J. Xia, Y. Sun, C. Zhang, W. Lv, Y. Tao, Y. Jiao, B. Zhang, S.-Z. Qiao, Y. Wan and Q.-H. Yang, Adv. Mater., 2021, 33, 2101006 Search PubMed.
- M. Li, X. Wang, K. Liu, H. Sun, D. Sun, K. Huang, Y. Tang, W. Xing, H. Li and G. Fu, Adv. Mater., 2023, 35, 2302462 CrossRef CAS PubMed.
- Z. Chen, H. Qing, R. Wang and R. Wu, Energy Environ. Sci., 2021, 14, 3160–3173 RSC.
- K. Dastafkan, X. Shen, R. K. Hocking, Q. Meyer and C. Zhao, Nat. Commun., 2023, 14, 547 CrossRef CAS PubMed.
- D. Chen, R. Lu, R. Yu, Y. Dai, H. Zhao, D. Wu, P. Wang, J. Zhu, Z. Pu, L. Chen, J. Yu and S. Mu, Angew. Chem., Int. Ed., 2022, 61, e202208642 CrossRef CAS PubMed.
- X. Yan, D. Liu, P. Guo, Y. He, X. Wang, Z. Li, H. Pan, D. Sun, F. Fang and R. Wu, Adv. Mater., 2023, 35, 2210975 CrossRef CAS PubMed.
- R. Thalinger, M. Gocyla, M. Heggen, B. Klötzer and S. Penner, J. Phys. Chem. C, 2015, 119, 22050–22056 CrossRef CAS.
- M. L. Weber, M. Wilhelm, L. Jin, U. Breuer, R. Dittmann, R. Waser, O. Guillon, C. Lenser and F. Gunkel, ACS Nano, 2021, 15, 4546–4560 Search PubMed.
- A. K. Opitz, A. Nenning, V. Vonk, S. Volkov, F. Bertram, H. Summerer, S. Schwarz, A. Steiger-Thirsfeld, J. Bernardi, A. Stierle and J. Fleig, Nat. Commun., 2020, 11, 4801 Search PubMed.
- L. Y. Tian, Z. Zhang, S. Liu, G. R. Li and X. P. Gao, Nano Energy, 2023, 106, 108037 CrossRef CAS.
- B.-W. Zhang, M.-N. Zhu, M.-R. Gao, X. Xi, N. Duan, Z. Chen, R.-F. Feng, H. Zeng and J.-L. Luo, Nat. Commun., 2022, 13, 4618 CrossRef CAS PubMed.
- H. Zhu, S. Sun, J. Hao, Z. Zhuang, S. Zhang, T. Wang, Q. Kang, S. Lu, X. Wang, F. Lai, T. Liu, G. Gao, M. Du and D. Wang, Energy Environ. Sci., 2023, 16, 619–628 Search PubMed.
- L. Fan, Y. Ji, G. Wang, J. Chen, K. Chen, X. Liu and Z. Wen, J. Am. Chem. Soc., 2022, 144, 7224–7235 CrossRef CAS.
- J. Hao, Z. Zhuang, K. Cao, G. Gao, C. Wang, F. Lai, S. Lu, P. Ma, W. Dong, T. Liu, M. Du and H. Zhu, Nat. Commun., 2022, 13, 2662 CrossRef CAS PubMed.
- M. Du, P. Geng, C. Pei, X. Jiang, Y. Shan, W. Hu, L. Ni and H. Pang, Angew. Chem., Int. Ed., 2022, 61, e202209350 CrossRef CAS.
- F. Li, L. Zhou, J.-X. Liu, Y. Liang and G.-J. Zhang, J. Adv. Ceram., 2019, 8, 576–582 CrossRef CAS.
- L. Zhou, F. Li, J.-X. Liu, S.-K. Sun, Y. Liang and G.-J. Zhang, J. Hazard. Mater., 2021, 415, 125596 CrossRef CAS.
- H. L. Liu, S. Pang, C. Q. Liu, Y. T. Wu and G. J. Zhang, J. Am. Ceram. Soc., 2022, 105, 6437–6448 Search PubMed.
- L. Zhou, J.-X. Liu, T.-Z. Tu, Y. Wu and G.-J. Zhang, J. Adv. Ceram., 2023, 12, 111–121 CrossRef CAS.
- T. Wang, J. R. He, Z. Zhu, X. B. Cheng, J. Zhu, B. A. Lu and Y. P. Wu, Adv. Mater., 2023, 35, 2303520 CrossRef CAS.
- M.-K. Jo, H. Heo, J.-H. Lee, S. Choi, A. Kim, H. B. Jeong, H. Y. Jeong, J. M. Yuk, D. Eom, J. Jahng, E. S. Lee, I.-y Jung, S. R. Cho, J. Kim, S. Cho, K. Kang and S. Song, ACS Nano, 2021, 15, 18113–18124 CrossRef CAS PubMed.
- Y. Guo, Q. Niu, F. Pei, Q. Wang, Y. Zhang, L. Y. Du, Y. Zhang, Y. S. Zhang, Y. Y. Zhang, L. Fan, Q. Y. Zhang, L. X. Yuan and Y. H. Huang, Energy Environ. Sci., 2024, 17, 1330–1367 RSC.
- S.-F. Ng, M. Y. L. Lau and W.-J. Ong, Adv. Mater., 2021, 33, 2008654 CrossRef CAS.
- C. Zhao, Y. Huang, B. Jiang, Z. Chen, X. Yu, X. Sun, H. Zhou, Y. Zhang and N. Zhang, Adv. Energy Mater., 2024, 14, 2302586 Search PubMed.
- P. Hohenberg and W. Kohn, Phys. Rev., 1964, 136, B864–B871 CrossRef.
- W. Kohn and L. J. Sham, Phys. Rev., 1965, 140, A1133–A1138 CrossRef.
- G. Kresse and J. Furthmüller, Phys. Rev. B:Condens. Matter Mater. Phys., 1996, 54, 11169–11186 Search PubMed.
- P. E. Blöchl, Phys. Rev. B:Condens. Matter Mater. Phys., 1994, 50, 17953–17979 CrossRef PubMed.
- J. P. Perdew, K. Burke and M. Ernzerhof, Phys. Rev. Lett., 1996, 77, 3865–3868 CrossRef CAS PubMed.
- T. Connor, O. Cheong, T. Bornhake, A. C. Shad, R. Tesch, M. Sun, Z. He, A. Bukayemsky, V. L. Vinograd, S. C. Finkeldei and P. M. Kowalski, Front. Chem., 2021, 9, 733321 CrossRef CAS PubMed.
- X. J. Wang, H. Y. Xiao, X. T. Zu and W. J. Weber, J. Nucl. Mater., 2011, 419, 105–111 CrossRef CAS.
- S. Grimme, J. Antony, S. Ehrlich and H. Krieg, J. Chem. Phys., 2010, 132, 154104 CrossRef PubMed.
Footnote |
| † Electronic supplementary information (ESI) available. See DOI: https://doi.org/10.1039/d5ee01215e |
| This journal is © The Royal Society of Chemistry 2025 |