
 Open Access Article
 This Open Access Article is licensed under a Creative Commons Attribution-Non Commercial 3.0 Unported Licence
Effect of Cs and Ba promoters on Ni/graphite catalysts for CO2 conversion via the reverse water gas shift reaction†
J.
Moral-Pombo
 ab,
J. M.
Conesa-Alonso
a,
E.
Campos-Castellanos
b,
E.
García-Bordejé
c,
A.
Guerrero-Ruiz
bd and
I.
Rodríguez-Ramos
*a
ab,
J. M.
Conesa-Alonso
a,
E.
Campos-Castellanos
b,
E.
García-Bordejé
c,
A.
Guerrero-Ruiz
bd and
I.
Rodríguez-Ramos
*a
aInstituto de Catálisis y Petroleoquímica (CSIC), Marie Curie 2, 28049 Madrid, Spain. E-mail: irodriguez@icp.csic.es
bDepartamento de Química Inorgánica y Química Técnica, UNED, 28040, Madrid, Spain
cInstituto de Carboquímica (CSIC), Miguel Luesma Castán 4, 50018 Zaragoza, Spain
dGrupo de Diseño y Aplicación de Catalizadores Heterogéneos, UNED, Unidad Asociada al CSIC por el ICP, Spain
First published on 28th January 2025
Abstract
Obtaining syngas from CO2 and green hydrogen via the reverse water gas shift (RWGS) reaction is a promising strategy for mitigating the greenhouse effect. Additionally, CO obtained as the product holds significant potential in the syngas-based chemical industry. In this context, we developed efficient Ni-based catalysts for the RWGS reaction at a low temperature. In our approach, we selected Cs and Ba as catalytic promoters and utilized high-surface-area graphite (HSAG400) as a support to maximize the interaction between the metal and promoter. Our study revealed that both promoters helped in enhancing the CO2 conversion but had opposite effects in the RWGS reaction. In particular, the use of the Cs promoter boosted the CO selectivity up to 95%, while the addition of Ba proved to be detrimental to CO selectivity.
Introduction
In order to meet the Paris Agreement targets, anthropogenic CO2 emissions need to be critically reduced in a more time-consistent way.1 For decades, the scientific community has been pointing out that only through an energetic transition towards renewable energy sources can sufficient carbon dioxide abatement be achieved.2 However, this requires overcoming the problem of their intermittent nature. A potential solution to this is provided by the so-called power-to-X technology. This concept refers to the idea of storing spare electric energy as chemical energy (methane, syngas, liquid fuels, etc.). The first step in this concept is the production of hydrogen by water splitting in an electrolyser. The increased efficiency of electrolysers in recent years has driven strong developments in this type of technologies in Europe, especially in France and Germany.3In this context, obtaining syngas from CO2 and green hydrogen through the reverse water gas shift (RWGS) reaction would be an interesting strategy for mitigating the greenhouse effect.4 The CO obtained as a product could play an important role in the syngas-based chemical industry. Light olefins, methanol and liquid fuels obtained after Fischer–Tropsch processes are some examples of the different applications this reaction can have in a situation where oil reserves are decreasing.5
Owing to the endothermic nature of the reverse water gas shift reaction (eqn (1)), CO formation is favoured at high temperatures. This is evident from the changes in Gibbs free energy with temperature and the increase in the equilibrium constant at higher temperatures.6 As the Sabatier reaction (eqn (2)) is exothermic,7,8 it implies that methanation is favoured at low temperatures. Consequently, relatively high temperatures are necessary for this reaction, along with stable catalysts with high activity and selectivity.
| CO2 + H2 ⇌ CO + H2O ΔrH298K = 41.2 kJ mol−1 | (1) |
| CO2 + 4H2 ⇌ CH4 + 2H2O ΔrH298K = −165 kJ mol−1 | (2) |
On the other hand, monometallic and bimetallic catalysts exhibit different performances, with the size of the metal nanoparticles significantly affecting the CO selectivity. Notably, the effect of the support on the reaction becomes more pronounced when the metal particle size is small, due to the stronger influence of the support on the smaller metal particles. Therefore, both the active phase and an appropriate support and promoter are crucial for designing effective RWGS catalysts.4 Thus, recent studies have shown that while Ru nanoparticles supported on CeO2 or Al2O3 selectively produce CH4 in the CO2 hydrogenation reaction, the atomically dispersed Ru on these supports changes the selectivity to CO.15,16 The same effect has been found for Rh/TiO2 catalysts.17 The authors explained that monoatomically dispersed Rh atoms are more prone to produce CO since they are not surrounded by other Rh, which could provide H atoms to reduce CO into CH4. It has been concluded that the active sites for CH4 formation in these catalysts is a metal–metal entity, whereas the active sites for CO formation are the metal–support interface. Generally, the lower the size of the nanoparticles, the higher the number of metal–support interfacial sites, which can increase the CO selectivity.4
Ni is one of the most used catalysts for the hydrogenation of CO2.18 It combines significant catalytic activity with the advantage of being an abundant, non-precious element.19 Ni is known to be a catalytically active metal in the Sabatier reaction, i.e., the total reduction of CO2 to CH4.20–23 Ni nanoparticles supported on various metal oxides, including alumina, titania, and ceria–zirconia, have been employed as active sites for the methanation reaction.23–26 However, atomically dispersed Ni sites were found to selectively produce CO instead of CH4.27 In fact, CO2 hydrogenation has been described as structure-sensitive reaction, with an optimal nanoparticle size for the maximum TOF to CH4 of 2.5 nm,28,29 and with smaller particles and clusters favoring the selectivity to CO.30 In addition, it has been reported that Fe addition to Ni catalysts can boost the CO selectivity due to the formation of FeOx–Ni sites, which facilitate the CO2 conversion,31 while FeOx also enhances Ni dispersion on the surface32 when used as promoter. A comparable effect has been noted with the incorporation of alkali and alkaline earth metals to RWGS catalysts.4,33 It was reported that the addition of Cs also increased the number of basic sites on the surface of the catalysts, evidencing a correlation between this property and an improved CO selectivity34 up to thermodynamic equilibrium levels, with CO selectivities close to 100%, while also blocking methanol and methane production.35
In this context, Ni-based catalysts can be optimized by controlling various parameters, such as the active-phase dispersion, structure, morphology, metal–support interaction, and surface chemistry. A thorough understanding of how different promoters and supports affect catalyst selectivity is crucial for the development of efficient heterogeneous systems. Consequently, these factors require further detailed study. In this work, Cs and Ba were chosen as promoters for Ni-catalyzed CO2 reduction. Regarding the promoters, while Cs has classically been considered an electronic promoter, Ba has been reported to be a structural one.36 In order to study their influence on CO2 reduction, different bimetallic catalysts supported on high-surface-area graphite (HSAG400) were prepared. In this sense, carbonaceous supports are usually a good choice when trying to establish a comparison between different heterogeneous catalysts, as they tend to interfere to a lesser extent than oxides in metal–promoter interactions.35,37 The catalytic activity of the Ni-promoted materials for the CO2 hydrogenation reaction was evaluated. Additionally, the most significant physicochemical properties, including the crystallinity, reducibility, morphology, and surface electronic structure, were characterized using a series of techniques. This comprehensive analysis provided us with valuable insights into the catalytic performance of these materials and elucidated the roles of the alkali and alkaline earth metals within them.
Experimental
Preparation of the catalysts
High-surface-area graphite (HSAG400, produced by Timcal, SBET = 400 m2 g−1) was employed as a support for the catalysts. The monometallic Ni catalyst (2.3%Ni/HSAG400) was prepared through a standard incipient wetness impregnation method. In addition, two series of promoted bimetallic catalysts were prepared by co-impregnation. Cs and Ba were chosen as the promoting metals. Nitrates were employed as the precursors [Ni(NO3)2·6H2O Merck, CsNO3, Aldrich and Ba(NO3)2, Fluka]. In all cases, a 1![[thin space (1/6-em)]](https://www.rsc.org/images/entities/char_2009.gif) :1 mixture of ethanol and water was utilized as the solvent. Different molar stoichiometric relationships were established between Ni and the promoter. The amount of Ni (2.3 wt%) was kept constant in all cases. In this manner, Ni–X (1:2), Ni–X (1:1), Ni–X (2:1), Ni–X (3:1), Ni–X (4:1) catalysts, where X = Cs or Ba, were prepared.
:1 mixture of ethanol and water was utilized as the solvent. Different molar stoichiometric relationships were established between Ni and the promoter. The amount of Ni (2.3 wt%) was kept constant in all cases. In this manner, Ni–X (1:2), Ni–X (1:1), Ni–X (2:1), Ni–X (3:1), Ni–X (4:1) catalysts, where X = Cs or Ba, were prepared.
Catalyst characterization
Reducibility was studied through acquisition of the corresponding thermal programmed reduction (TPR) profiles. A quartz micro-reactor containing 50 mg of the powdered materials was exposed to a continuous flow of a H2/Ar gas mixture (5% of H2). An electric oven was utilized to increase the temperature from room temperature to 720 °C (10 °C min−1). A thermal conductivity detector allowed obtaining the profile of the consumed hydrogen with respect to the measured temperature.X-Ray diffraction (XRD) measurements were performed using a PANalytical X'Pert Pro Polycrystal diffractometer with a Bragg–Brentano geometry at 45 kV and 40 mA. The XRD patterns were recorded using a Cu/Kα radiation source (λ = 0.1544 nm) in the 2θ region between 10° and 90° with a 0.04° step size.
Transmission electron microscopy (TEM) was performed using a JEOL JEM-2100F instrument at 200 kV to examine the distribution and sizes of the metallic particles. High-angle annular dark-field scanning transmission electron microscopy (HAADF-STEM) analysis was conducted with a spot size of 1 nm. The distribution of Ni and Cs or Ba in the bimetallic catalyst was analysed through X-ray energy dispersive spectroscopy (EDS) mapping, performed with an X-Max80 detector (Oxford Instruments). The samples were first ground into a fine powder, suspended in ethanol using an ultrasonic bath, and then deposited onto a copper grid with a carbon-coated layer. To determine the mean particle size (d), at least 400 particles were measured. The error was calculated as the standard deviation of the values used for determining the average particle size.
X-Ray photoelectron spectrometry (XPS) was performed at room temperature using a non-monochromatic Mg Kα X-ray radiation source (hν = 1253.6 eV) and an electrostatic hemispherical analyser equipped with seven channeltrons to obtain the XPS spectra of the reduced catalysts. This custom-made analyser package, refurbished by SPECS, combined out-of-service Omicron hardware with the SPECS HSA 3500 and SpecsLab Prodigy software. A small sample pellet was placed in the holder and degassed in the chamber until a vacuum below 10−8 Pa was obtained. Since the graphitic support was conductive, surface neutralization was unnecessary. The survey spectra were acquired with a pass energy of 50 eV, while the high-resolution spectra were obtained with a pass energy of 30 eV. The spectra were analysed using CasaXPS software. Calibration of all the peaks was done using the C 1s peak at 284.6 eV as a reference. Quantification was carried out on the high-resolution spectra by measuring the peak areas and taking into account their relative sensitivity factors (RSFs). The components were fitted with Gaussian–Lorentzian functions, except for the C 1s peak, whose fitting function was modified to introduce asymmetry due to its high conductivity. A Shirley background was employed for proper fitting of all the regions.
Catalytic activity measurements
The CO2 hydrogenation reaction was evaluated in a U-shaped fixed-bed glass reactor at a temperature of 275 °C and a constant weight hourly space velocity (WHSV) of 36000 ml h−1 g−1 with a H2/CO2 ratio of 4:1. The catalyst (0.1 g, grain size ≈ 0.25–0.35 mm) was reduced in situ right before the catalytic test by 30 ml min−1 of H2 at 450 °C for 2 h, with increasing the temperature at a rate of 10 °C min−1. Experiments were conducted to rule out the presence of diffusion problems by using different particle sizes and by significantly varying both the flow rate and the catalyst amount while maintaining a constant mass/flow rate ratio. The findings confirmed the lack of both internal and external mass-transfer effects within the specified conditions. The temperature of both the reduction and reaction was reached employing an electric oven and was measured using a K-type thermocouple in contact with the glass wall of the reactor. After pretreatment, the inlet gases were switched and the temperature of the reaction was fixed. The outlet gases were analysed and quantified with a Varian 3400 gas chromatograph coupled with a thermal conductivity detector (TCD). The CO conversion levels were maintained below 10% to ensure differential operation in the reactor, thereby limiting the extent of secondary reactions.
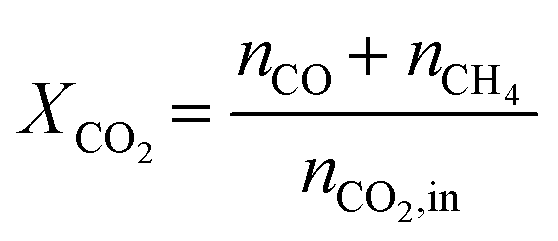
CO2 conversion (XCO2) was calculated using eqn (3), where nCO and nCH4 represent the number of CO and CH4 moles coming out of the reactor, and nCO2,in refers to the number of CO2 moles entering the system.
 | (3) |
 | (4) |
 | (5) |
Results and discussion
Catalysts characterization
The TPR profiles of the two series of samples are plotted in Fig. 1. These samples did not undergo any pretreatment, such as calcination, and therefore it is important to note that these profiles also reflect the evolution and/or reduction of certain products resulting from the decomposition of the metal precursors. Consistent with the existing literature, all the materials showed three noteworthy temperature regions: from 220 °C to 270 °C, from 270 °C to 370 °C, and from 370 °C to higher temperatures.38,39 In addition, a negative peak in the 100–220 °C range could be observed. It is known that Ni(NO3)2·6H2O decomposition under a reducing atmosphere proceeds through the formation of the tetra- and di-hydrate complexes.40 Following that, this negative peak could be assigned to the separation of H2O molecules from Ni(NO3)2·6H2O during the formation of Ni hydroxides. A slight increase in temperature translates into the appearance of a shoulder, in the case of the monometallic materials and a small peak when considering the rest of the bimetallic materials. The partial and complete decomposition of Ni(NO3)2·2H2O occurred between 150 °C and 250 °C approximately, and the lowest expected reduction temperature for the NiO species that were starting to be formed was 260 °C.40 According to this information, and in agreement with other studies,38,39 the peak at 250–270 °C was therefore assigned to the reduction of the most dispersed and weakly interacting NiO nanoparticles to Ni0. The addition of the Cs or Ba promoter in the bimetallic catalysts shifted the temperature of nickel reduction to slightly higher temperatures. | ||
| Fig. 1 TPR profiles of the Ni–Cs (a) and Ni–Ba catalysts (b). | ||
In the second temperature region, the reduction of the majority of the nickel oxide occurred38,39 and some differences appeared regarding the amount and nature of the promoter in the bimetallic catalysts. In the case of the Ni–Cs samples, the most intense H2 consumption peak appeared between 290 °C and 325 °C, and corresponded to the reduction of the NiO particles. However, this hydrogen consumption overlapped with that associated with CsNO3 decomposition. The temperature required for the decomposition of CsNO3 was drastically reduced41 since it was facilitated via hydrogen dissociation by Ni0. It is clear that the amount of impregnated promoter was proportional to the shift in the reduction temperature towards higher values and the increase in the area under the peak. This effect was more pronounced in the case of the Ni–Ba samples, whereby it increased from 290 °C to 370 °C. In this case, the overlapping peak due to the decomposition of BaNO3 could be distinguished for the samples with a higher Ba content (e.g., 1:1 and 1:2).
The third temperature region (370 °C to 720 °C) could have resulted from the reduction of the remaining largest nickel oxide particles, but it is crucial to notice that at this temperature, the consumed H2 was accompanied by methane production, which was expected to arise from gasification of the support carbon atoms surrounding the metal particles.38 Co-impregnating a higher amount of promoter with the active metal appeared to decrease the metal–support interactions. In this manner, when the Ni/promoter ratio was <1, this region almost disappeared. Thus, the TPR profiles of the promoted Ni catalysts indicated that the promoter (Cs or Ba) and nickel were in close proximity. Based on the TPR characterization, it could be confirmed that all the catalysts underwent complete reduction when treated with hydrogen at 450 °C.
Fig. 2A and 3A show the X-ray diffractograms of all the materials reduced at 450 °C. In all the cases, the principal observable peaks corresponded to the most prominent features of hexagonal graphite (JCPDS no. 75-1621), and they appeared as a sharp and intense peak at 26.5°, a broad peak centred at 43.8°, and two small signals at 54.4° and 77.4°. The first one corresponded to the (002) plane, while the broad peak was related to the combination of the (100) and the (101) planes, and the two last peaks were produced by the (004) and (110) planes, respectively.
 | ||
| Fig. 2 XRD diffractograms of the a) Ni, b) Ni–Cs (2:1), c) Ni–Cs (1:1), and d) Ni–Cs (1:2) samples reduced at 450 °C (A) and after reaction at 275 °C (B). | ||
 | ||
| Fig. 3 XRD diffractograms of the a) Ni, b) Ni–Ba (2:1), and c) Ni–Ba (1:2) samples reduced at 450 °C (A) and after reaction at 275 °C (B). | ||
The most prominent peak of Ni metallic particles usually appears at 44.4°. Its existence in these diffractograms could not be definitively proven or disproven due to it overlapping with the (101) graphitic peak in that range. Other expected peaks for the fcc phase would normally appear at around 52.0° (200) and 77.0° (220). Again, and regarding the (220) peak, an overlap with a more intense graphitic peak might be occurring here. Finally, only the most intense peaks corresponding to the XRD pattern of cubic NiO (JCPDS no. 04-0835) could be seen as emerging in these diffractograms. They were expected to appear at 37.3° and 43.4°, corresponding to the (111) and (200) planes. Although, the peak at 43.4° might have been obscured by the graphitic broad peak, that at 37.3° was clearly absent. Therefore, although the Ni loading was low and even close to the detection limit for the supported phases in XRD, it appears that nickel was well dispersed over the HSAG support.
Concerning Cs promotion, the diffractograms obtained for the different bimetallic catalysts are shown in Fig. 2A. It could be clearly seen that regardless of the amount of Cs promoter added, no peaks attributable to any Cs phase appeared in the diffractograms. So, the crystallinity of the materials remained unaltered. Therefore, Ni and Cs were well dispersed on the graphite support.
In contrast, Ba promotion induced alterations in the acquired diffractograms compared to the non-promoted catalyst (Fig. 3A). The prevalent crystallographic phase according to the diffractograms seemed to be orthorhombic BaCO3 (JCPDS no. 05-0378). In that sense, three new tiny peaks appeared in the bimetallic Ni–Ba (2:1). They were located at 23.9°, 34.1°, 34.6°, and 46.8°, and they corresponded to the (111), (112), (130), and (113) refraction planes, respectively. As the Ba molar content surpassed that of the impregnated Ni, the resulting diffractogram became more intricate. The above-mentioned peaks showed increased intensities, and the remaining expected principal reflections from orthorhombic BaCO3 could be observed at 27.7° (002), 41.9° (221), 42.0° (041), 44.2° (202), 44.9° (131), 61.0° (330), and 68.2° (332). However, no peaks assignable to Ni appeared for any of the samples, so amorphous particles or particles with sizes mainly smaller than 5 nm (the detection limit of the XRD technique) were expected.
Fig. 4 and 5 show the TEM images of the catalysts along with their corresponding histograms, which represent the particle-size distribution.
 | ||
| Fig. 4 TEM images and particle-size-distribution histograms of fresh catalysts (reduced 450 °C, left) and spent catalysts (after reaction at 275 °C, right): (a) Ni, b) Ni–Cs (2:1), c) Ni–Cs (1:1), and d) Ni–Cs (1:2). | ||
 | ||
| Fig. 5 TEM images and particle-size-distribution histograms of fresh catalysts (reduced 450 °C, left) and spent catalysts (after reaction at 275 °C, right): (a) Ni–Ba (2:1) and b) Ni–Ba (1:2). | ||
The TEM micrographs revealed a Gaussian particle-size distributions for all the catalysts, with the peak maximum corresponding to the mean particle size. Although the mean Ni particle size of the catalysts could be considered similar when accounting for the standard deviation, the particle-size-distribution histograms showed an initial shift toward smaller particle sizes, followed by a progressive shift of the maximum toward larger sizes as the Ni:Cs ratio was increased, yet always remaining below that of monometallic Ni. Overall, the introduction of the Cs promoter led to a decrease in the Ni particle size, a trend also observed with the addition of Ba. The effect of Ba on the Ni particles was more moderate compared to Cs under these conditions, likely due to the sintering of the Ba phases, as indicated by the XRD diffractograms. This sintering may reduce the overall influence of the Ba promoter on the dispersion of Ni particles.
Fig. 6 and 7 show representative STEM-HAADF micrographs and EDX elemental maps for the NiCs 1:1 and NiBa 2:1 catalysts.
 | ||
| Fig. 6 HAADF-STEM images and the corresponding EDX maps of the a) fresh (reduced at 450 °C) and b) used (after reaction at 275 °C) NiCs 1:1 catalyst. | ||
 | ||
| Fig. 7 HAADF-STEM images and corresponding EDX maps of the a) fresh (reduced at 450 °C) and b) used (after reaction at 275 °C) NiBa 2:1 catalyst. | ||
EDX elemental mapping of the NiCs catalysts revealed a high dispersion of cesium across the support (Fig. 6) and confirmed the formation of nickel nanoparticles. The spatial overlap between cesium and nickel indicated there was a well-dispersed distribution of the active phases on the carbonaceous support. For the NiBa catalysts (Fig. 7), a spatial overlap between the Ni and Ba phases was also observed. However, there was also evidence seen of the formation of large, segregated Ba particles. This finding corroborates the observations from the XRD diffractograms.
Next, XPS analysis was conducted to attain semiquantitative information on the species present on the surface of the catalysts. Both pre- and post-reaction samples were studied. A pretreatment reduction step using pure hydrogen as a reducing agent was performed before characterizing the fresh catalysts (450 °C, 2 h). The samples were exposed to ambient air before analysis, thus further surface oxidation could be expected. Fig. 8 depicts the core level X-ray photoelectron (XP) spectra in the Ni 2p3/2, Cs 3d5/2, and Ba 3d5/2 regions for the Ni–Cs (1:1) and Ni–Ba (2:1) catalysts and their XPS parameters are summarized in Tables 1 and 2.
 | ||
| Fig. 8 XPS spectra for the A) NiCs (1:1) catalyst for the Ni 2p3/2 and Cs 3d5/2 regions, B) NiBa (2:1) catalyst for the Ni 2p3/2 and Ba 3d5/2 regions. | ||
| DFM | Ni 2p3/2 BE (eV) | Ni/C | Ni/X |
|---|---|---|---|
| Ni/HSAG400 | 855.6 | 0.0033 | — |
| Ni–Cs (2:1)/HSAG400 |
855.6 | 0.0018 | 0.50 |
| Ni–Cs (1:1)/HSAG400 |
855.5 | 0.0012 | 0.10 |
| Ni–Cs (1:2)/HSAG400 |
855.3 | 0.0009 | 0.06 |
| Ni–Ba (2:1)/HSAG400 |
855.3 | 0.0016 | 0.56 |
| Ni–Ba (1:2)/HSAG400 |
855.3 | 0.0010 | 0.26 |
| DFM | Ni 2p3/2 BE (eV) | Ni/C | Ni/X |
|---|---|---|---|
| Ni/HSAG400 | 855.8 | 0.0024 | — |
| Ni–Cs (2:1)/HSAG400 |
855.7 | 0.0010 | 0.57 |
| Ni–Cs (1:1)/HSAG400 |
855.8 | 0.0013 | 0.24 |
| Ni–Cs (1:2)/HSAG400 |
855.9 | 0.0005 | 0.09 |
| Ni–Ba (2:1)/HSAG400 |
855.9 | 0.0013 | 0.44 |
| Ni–Ba (1:2)/HSAG400 |
855.9 | 0.0013 | 0.11 |
The Ni 2p3/2 region displayed one characteristic peak centred at 855.6 eV and its satellite at 861.7 eV, which could be assigned to NiO.42 As mentioned above, this was probably produced by surface oxidation with air during the sample preparation. The presence of Ni0 (852.9 eV) was only observed in the monometallic Ni/HSAG400 reduced catalyst, where it was only a minor fraction (see Fig. S1 in the ESI†). Regarding promotion, there was a clear correlation between the observed shifts in their binding energy and the presence of the promoter. It could thus be expected that, in general, the presence of an electropositive promoter would lead to a shift to lower binding energies in XPS, usually associated with an increased electron density due to electronic-transfer processes.43 However, in the case of the Cs promoter, this effect was first observed for the NiCs (1:1) sample and it became more evident when increasing the amount of promoter in the NiCs (1:2) catalyst (Table 1). In contrast, the NiBa catalysts showed the same shift in binding energy (decrease by 0.3 eV) regardless of the promoter loading. This points out that other factors, such as differences in the metal particle sizes, may be occurring in addition to the metal–promoter electronic transfer. As shown in the TEM images (Fig. 4 and 5), the presence of the Cs and Ba promoters, particularly Cs, enhanced the dispersion of Ni, resulting in a smaller Ni particle size compared to with the monometallic Ni catalyst. With respect to the Ni/C atomic ratio, this seemed to decrease along with the amount of both Cs and Ba co-impregnated. While monometallic Ni/HSAG400 had a Ni/C ratio of 0.0033, it decreased with increasing the promoter loading; for instance, down to 0.0009 and 0.0010 for Ni–Cs (1:2) and Ni–Ba (1:2), respectively. Thus, it could be inferred that a decrease in surface Ni content upon cesium or barium addition was occurring. Given the observed decrease in average Ni particle size observed through TEM analysis, it is likely that the Ni nanoparticles were partially covered by the Cs or Ba promoters, which not only enhanced the intimate metal–promoter interactions but also prevented the mobility and growth of the metal particles.37
Monometallic Ba/HSAG400 and Cs/HSAG400 samples were also examined. Cesium was characterized by its Cs 3d5/2 region at 725.0 eV, which corresponded to Cs2O or Cs2CO3.44 Its low FWHM values pointed to a prevalence of one single species. This was not observed for Ba 3d5/2, as this peak was divided into a BaCO3 main component at 780.6 eV, and another smaller one corresponding to Ba(NO3)2 at 782.1 eV, in the case of Ni–Ba catalysts.45 The energy of these regions seemed to be constant, independent of the catalyst.
Catalytic performance
Currently, low-temperature hydrogenation seems to be a more useful approach in CO2-valorisation reactions.7,14 To test this, different temperatures of reaction were tested, and a final low temperature of 275 °C was established as optimal. Control experiments confirmed that there was no reaction at 275 °C either in the empty reactor or when filled with silicon carbide, indicating that a catalyst is necessary for the reaction to occur. Preliminary tests with the HSAG support showed that this was also inactive. Under these conditions, we analysed the catalytic behaviour of our monometallic Ni catalyst. This model material displayed a quite low conversion (4%), a moderate selectivity towards CO (76%), and, therefore, a low selectivity to CH4 (24%). These catalytic results make it a good starting point for the tuning of its catalytic properties through its combination with a promoter. More specifically, the main drawback of Ni-based catalysts is their potential deactivation. This phenomenon is typically related to sintering processes; but also to the deposition of carbon or the synthesis of nickel sub-carbonyls.46 To address this problem, all the catalytic tests were performed at a fixed temperature of 275 °C, which allowed us to extend the experiments so that their average duration was close to 5 h (Fig. 9). | ||
| Fig. 9 Profiles of CO2 conversion at 275 °C over a 5 h stream for A): a) Ni, b) Ni–Cs (4:1), c) Ni–Cs (3:1), d) Ni–Cs (2:1), e) Ni–Cs (1:1), and f) Ni–Cs (1:2) catalysts and B): a) Ni, b) Ni–Ba (4:1), c) Ni–Ba (3:1), d) Ni–Ba (2:1), e) Ni–Ba (1:1), and f) Ni–Ba (1:2) catalysts. CO2 conversion at thermodynamic equilibrium was 17%.47 | ||
It was found that the crystalline structure of the Ni–Cs catalysts, as observed by XRD (Fig. 2A and B), remained unchanged after 5 h under reaction at 275 °C. Concerning the Ba promoter samples, all the peaks corresponding to Ba carbonate showed increased intensity in the post-reaction samples (see Fig. 3A and B), but no features attributable to Ni phases could be observed.
However, the average particle size, as determined by TEM, was increased for all the catalysts after reaction (Fig. 4 and 5, right), especially for the samples containing barium. Fig. 9 shows a stable conversion was achieved after reaching a peak at 2–3 h, suggesting that the nickel and the promoters underwent surface reorganization and agglomeration during the early stages of the reaction, before reaching steady-state conditions. This conclusion was further supported by the long-term on-stream experiments (see Fig. S2 in the ESI†), which revealed that no significant deactivation was observed for the Ni–Cs (1:1) and Ni–Ba (2:1) catalysts after 3 and 5 h, respectively. Also, the Ni 2p3/2 binding energy was increased for all the post-reaction catalysts (Ni and those doped with Cs or Ba catalysts), compared to their freshly reduced counterparts (Tables 1 and 2). This increase could be justified by the potential stabilization of the surface and the active oxygen species (O- and O2-) through the formation of carbonates, which might translate into slightly higher oxidation states for Ni. This hypothesis was reinforced by the observation of these crystalline carbonate phases through XRD, particularly for the Ba-doped catalysts (Fig. 3). On the other hand, in Fig. 9 it can be observed that the addition of Cs or Ba to the monometallic Ni catalyst greatly increased its activity for CO2 hydrogenation, reaching values close to those of the RWGS thermodynamic equilibrium (without considering CH4 formation).47 The maximum CO2 conversion achieved under steady-state conditions after 5 h of reaction for the Ni–Cs series was 15.5% using the Ni–Cs (1:1) catalyst. This high CO2 conversion was obtained also with the Ni–Ba (2:1) catalyst, that is, containing half the promoter load than for the Cs catalyst. According to the XRD profiles (Fig. 3), when the Ni/Ba ratio exceeded 2, diffraction peaks corresponding to BaCO3 clearly appeared. This latter suggests agglomeration of the Ba promoter and a possible decrease in the interaction between the Ni and Ba phases. It is assumed that the highest metal–promoter intimacy was obtained for the Ni–Cs (1:1) and Ni–Ba (2:1) catalysts, boosting the formation of highly active sites at the metal–promoter interfaces. In general, it has been reported that the introduction of promoters, such as alkali or alkali-earth metals, in metals (Cu, Pt, Ru, and Ni) catalysts can increase the number of CO2 adsorption sites and mediate the adsorption strength of the reactants, with a positive effect on CO2 hydrogenation conversion.4,14,35,48 In the specific case of Ni-based catalysts supported on various materials (SiO2, Al2O3, CeO2), the effect of potassium or sodium addition as a promoter has been studied. It was found that, unlike our findings with cesium and barium, the activity for CO2 hydrogenation decreased significantly.49,50
The addition of a promoter can also influence the product distribution. Fig. 10 and 11 show the CO selectivity for the NiCs and NiBa catalysts, respectively. It can generally be stated that Cs promotion of our materials facilitated CO2 reduction to CO. More specifically, when the catalysts were promoted using an equimolar relationship, both CO and CH4 production considerably increased. The diminishment of the amount of impregnated Cs entailed a complete shift of the selectivity towards CO. A paradigmatic example of this effect can be appreciated in the case of the 4:1 Ni–Cs catalyst, where SCO = 95%. The conversion was also improved in this case, producing three times more CO than our monometallic catalyst. By the contrary, when the amount of Cs was twice the amount of Ni, the conversion fell, probably due to the covering of the most suitable catalytic centres on Ni.
 | ||
| Fig. 10 CO selectivity and CO2 conversion at 275 °C with the reduced Ni–Cs catalysts. | ||
 | ||
| Fig. 11 CO selectivity and CO2 conversion at 275 °C with the reduced Ni–Ba catalysts. | ||
In general, the addition of alkali metals may alter the catalytic system reactivity.50 Adding alkali metals as a promoter in a supported metal (Pt, Pd, Cu, Ni) system increases the amount of active sites by increasing the positive charge on the catalyst surface51,52 which has been found to be favourable for the reaction, because an increase in surface positive charges is less favourable for CO adsorption and its subsequent reduction to methane and other products.52,53
The Ni–Ba catalysts displayed a different catalytic behaviour than the Ni–Cs catalysts. While Cs seemed to improve the catalysts behaviour towards the reverse water gas shift reaction (CO2 partial reduction), Ba promotion was proven to be an interesting approach when methanation is the main goal (CO2 total reduction). In all cases, both XCO2 and SCH4 increased when comparing their values with our model catalyst (Fig. 11). These rises achieved their maximum values when an optimal 2:1 Ni/Ba ratio was employed. In that sense, and regarding the non-promoted catalyst, the CO2 conversion increased from 4% to 15%, while the selectivity towards CH4 rose from 24% to 38%. Since a linear improvement of the Ni–Ba catalytic activity with Ba content seemed to be taking place, higher Ba loadings were also studied. However, for a Ni/Ba ratio <2, the performance of the bimetallic materials worsened, probably due to the large agglomeration of the promoter (see the XRD patterns in Fig. 3).
The characterization results show that the Ni–Cs catalysts exhibited a good dispersion of both the nickel and the promoter, which enhanced the metal–promoter interactions. In contrast, in the Ni–Ba catalysts, the barium promoter was agglomerated, which hindered this interaction. Therefore, we can hypothesize, in agreement with previous studies,4,14 that the active centres for methane (CH4) synthesis in these catalysts were formed by metal–metal pairs, while the sites promoting carbon monoxide (CO) production were situated at the boundary between the metal and promoter. Smaller nanoparticles enhance CO selectivity by providing a greater number of metal–promoter interfaces.
The influence of the H2/CO2 ratio was analysed using Ni–Cs (1:1), since the RWGS reaction is usually performed with a smaller ratio than that utilized in the present study, and Cs promotion was expected to increase CO production. The catalytic results regarding this H2/CO2 ratio are shown in Fig. 12. It was concluded that an optimal ratio of H2/CO2 = 4 allowed increasing the conversion to its maximum value in the case of Ni–Cs, while the selectivity to CO was only slightly diminished.
 | ||
| Fig. 12 Influence of the H2/CO2 ratios on the SCO and XCO2 of the Ni–Cs (1:1) catalyst. | ||
Conclusions
Ni-based catalysts promoted by the addition of Cs or Ba and supported on a high-surface-area graphite (HSAG) were studied in the conversion of CO2 into CO at low temperature. The addition of either Cs or Ba to the carbon-supported Ni catalysts boosted the CO2 conversion by about 3-fold, nearly reaching equilibrium conversion at 275 °C, and showing good stability. Specifically, the addition of Cs to the high-surface-area graphite-supported Ni catalyst enhanced the selectivity to CO, reaching values of 95%, representing progress in the suppression of methane production. The optimal balance between the activity and CO selectivity was observed with the Ni–Cs (1:1) catalyst, attributed to the excellent dispersion of both nickel and the promoter, which improved metal–promoter interactions and increased the number of active sites for CO production. In contrast, the use of Ba as a promoter did not help the reverse water gas shift reaction and instead promoted the CO2 methanation process. The Ni–Cs (1:1) catalyst also showed stable activity over time. These results highlight the potential of the HSAG-supported Ni–Cs system for the RWGS reaction.
Data availability
The data of this study were mainly generated during the PhD work of J. Moral-Pombo. The thesis can be accessed at the Universidad Nacional de Educación a Distancia. For any additional queries or specific data requests, please contact the authors.Author contributions
JMP: investigation, writing – original draft; JMCA: investigation; ECC: investigation; EGB: conceptualization, review and editing, funding acquisition; AGR: conceptualization, review and editing; IRR: conceptualization, project administration, supervision, writing, review and editing, funding acquisition.Conflicts of interest
There are no conflicts to declare.Acknowledgements
This work was funded by MICIU/AEI/https://doi.org/10.13039/501100011033 and by FEDER, UE through grant PID2023 146481OB-I00 and by Gobierno de Aragón (Grupo Reconocido DGA T03_17R).References
- J. Rogelj, et al. , Nat. Clim. Change, 2015, 5, 519 CrossRef.
- J. A. Turner, Science, 1999, 285, 687 CrossRef PubMed.
- C. Wulf, P. Zapp and A. Schreiber, Front. Energy Res., 2020, 8, 191 CrossRef.
- A. M. Bahmanpour, M. Signorile and O. Kröcher, Appl. Catal., B, 2021, 295, 120319 CrossRef.
- A. M. Abdel-Mageed and S. Wohlrab, Catalysts, 2021, 12, 16 CrossRef.
- C. A. Callaghan, Kinetics and Catalysis of the Water-Gas-Shift Reaction: A Microkinetic and Graph Theoretic Approach, PhD thesis, Worcester Polytechnic Institute, 2006 Search PubMed.
- W. J. Lee, C. Li, H. Prajitno, J. Yoo, J. Patel, Y. Yang and S. Lim, Catal. Today, 2021, 368, 2 CrossRef.
- B. Bulfin, M. Zuber, O. Gräub and A. Steinfeld, Chem. Eng. J., 2023, 461, 141896 CrossRef.
- M. D. Porosoff, B. Yan and J. G. Chen, Energy Environ. Sci., 2016, 9, 62 RSC.
- G. Zhou, F. Xie, L. Deng, G. Zhang and H. Xie, Int. J. Hydrogen Energy, 2020, 45, 11380 CrossRef CAS.
- D. Kobayashi, H. Kobayashi, K. Kusada, T. Yamamoto, T. Toriyama, S. Matsumura, S. Kawaguchi, Y. Kubota, M. Haneda, S. M. Aspera, H. Nakanishi, S. Arai and H. Kitagawa, J. Mater. Chem. A, 2021, 9, 15613 RSC.
- M. Zhu, Q. Ge and X. Zhu, Trans. Tianjin Univ., 2020, 26, 172 CrossRef CAS.
- R. Tang, Z. Zhu, C. Li, M. Xiao, Z. Wu, D. Zhang, C. Zhang, Y. Xiao, M. Chu, A. Genest, G. Rupprechter, L. Zhang, X. Zhang and L. He, ACS Mater. Lett., 2021, 3, 1652 CrossRef CAS PubMed.
- G. Torres-Sempere, L. Pastor-Perez, J. A. Odriozola, F. J. Duran-Olivencia, L. F. Bobadilla and T. R. Reina, Curr. Opin. Green Sustainable Chem., 2022, 36, 100647 CrossRef CAS.
- A. Aitbekova, L. Wu, C. J. Wrasman, A. Boubnov, A. S. Hoffman, E. D. Goodman, S. R. Bare and M. Cargnello, J. Am. Chem. Soc., 2018, 140, 14013736 CrossRef.
- J. H. Kwak, L. Kovarik and J. Szanyi, ACS Catal., 2013, 3, 2449 CrossRef.
- J. C. Matsubu, V. N. Yang and P. Christopher, J. Am. Chem. Soc., 2015, 137, 3076 CrossRef PubMed.
- S. I. Ngo and E. García-Bordejé, Catalysts, 2023, 13, 1422 CrossRef.
- J. Ashok, S. Pati, P. Hongmanorom, Z. Tianxi, C. Junmei and S. Kawi, Catal. Today, 2020, 356, 471 CrossRef.
- N. D. Mohd Ridzuan, M. S. Shaharun, M. A. Anawar and I. Ud-Din, Catalysts, 2022, 12, 469 CrossRef.
- J. Gödde, M. Merko, W. Xia and M. Muhler, J. Energy Chem., 2021, 54, 323 CrossRef.
- X. Xu, Y. Tong, J. Huang, J. Zhu, X. Fang, J. Xu and X. Wang, Fuel, 2021, 283, 118867 CrossRef.
- P. Unwiset, K. C. Chanapattharapol, P. Kidkhunthod, Y. Poo-arporn and B. Ohtani, Chem. Eng. Sci., 2020, 228, 115955 CrossRef.
- L. Xu, X. Wen, M. Chen, C. Lv, Y. Cui, X. Wu, C.-E. Wu, B. Yang, Z. Miao and X. Hu, Fuel, 2020, 282, 118813 CrossRef.
- L. Proaño, M. A. Arellano-Treviño, R. J. Farrauto, M. Figueredo, C. Jeong-Potter and M. Cobo, Appl. Surf. Sci., 2020, 533, 147469 CrossRef.
- G. Varvoutis, M. Lykaki, S. Stefa, E. Papista, S. A. C. Carabineiro, G. E. Marnellos and M. Konsolakis, Catal. Commun., 2020, 142, 106036 CrossRef CAS.
- Y. Hou, Y.-L. Liang, P.-C. Shi, Y.-B. Huang and R. Cao, Appl. Catal., B, 2020, 271, 118929 CrossRef CAS.
- C. Vogt, E. Groeneveld, G. Kamsma, M. Nachtegaal, L. Lu, C. J. Kiely, P. H. Berben, F. Meirer and B. M. Weckhuysen, Nat. Catal., 2018, 1, 127 CrossRef.
- E. B. Sterk, A. Nieuwelink, M. Monai, J. N. Louwen, E. T. C. Vogt, I. A. W. Filot and B. M. Weckhuysen, JACS Au, 2022, 2, 2714 CrossRef PubMed.
- K. Feng, J. Tian, M. Guo, Y. Wang, S. Wang, Z. Wu, J. Zhang, L. He and B. Yan, Appl. Catal., B, 2021, 120191 CrossRef.
- B. Yan, B. Zhao, S. Kattel, Q. Wu, S. Yao, D. Su and J. G. Chen, J. Catal., 2019, 374, 60 CrossRef.
- L. Yang, L. Pastor-Perez, S. Gu, A. Sepulveda-Escribano and T. R. Reina, Appl. Catal., B, 2018, 232, 464 CrossRef.
- D. Beierlein, D. Häussermann, M. Pfeifer, T. Schwarz, K. Stöwe, Y. Traa and E. Klemm, Appl. Catal., B, 2019, 247, 200 CrossRef.
- G. Varvoutis, M. Lykaki, E. Papista, S. A. C. Carabineiro, A. C. Psarras, G. E. Marnellos and M. Konsolakis, J. CO2 Util., 2021, 44, 101408 CrossRef.
- L. Barberis, C. I. Versteeg, J. D. Meeldijk, J. A. Stewart, B. D. Vandegehuchte and P. E. de Jongh, ACS Catal., 2024, 14, 9188 CrossRef.
- W. Raróg-Pilecka, D. Szmigiel, Z. Kowalczyk, S. Jodzis and J. Zielinski, J. Catal., 2003, 218, 465 CrossRef.
- J. L. Eslava, A. Iglesias-Juez, G. Agostini, M. Fernández-García, A. Guerrero-Ruiz and I. Rodriguez-Ramos, ACS Catal., 2016, 6, 1437 CrossRef.
- M. Cerro-Alarcón, B. Bachiller-Baeza, A. Guerrero-Ruiz and I. Rodríguez-Ramos, J. Mol. Catal. A: Chem., 2006, 258, 221 CrossRef.
- A. B. Dongil, I. T. Ghampson, R. García, J. L. G. Fierro and N. Escalona, RSC Adv., 2016, 6, 2611 RSC.
- W. Brockner, C. Ehrhardt and M. Gjikaj, Thermochim. Acta, 2007, 456, 64 CrossRef CAS.
- W. Raróg-Pilecka, E. Miśkiewicz, S. Jodzis, J. Petryk, D. Łomot, Z. Kaszkur, Z. Karpiński and Z. Kowalczyk, J. Catal., 2006, 239, 313 CrossRef.
- M. A. Peck and M. A. Langell, Chem. Mater., 2012, 24, 4483 CrossRef CAS.
- E. B. Fox, S. Velu, M. H. Engelhard, Y. H. Chin, J. T. Miller, J. Kropf and C. Song, J. Catal., 2008, 260, 358 CrossRef.
- A. Theodosiou, B. F. Spencer, J. Counsell, P. Ouzilleau, Z. He and A. N. Jones, Carbon, 2022, 197, 226 CrossRef.
- P. J. Schmitz, Surf. Sci. Spectra, 2001, 8, 190 CrossRef.
- X. Su, J. Xu, B. Liang, H. Duan, B. Hou and Y. Huang, J. Energy Chem., 2016, 25, 553 CrossRef.
- S. Adelung, S. Maier and R.-U. Dietrich, Sustain. Energy Technol. Assessments, 2021, 43, 1008972021 Search PubMed.
- G. Giammaria and L. Lefferts, Chem. Eng. J., 2020, 392, 123806 CrossRef.
- J. Gandara-Loe, E. Portillo, J. A. Odriozola, T. R. Reina and L. Pastor-Pérez, Front. Chem., 2021, 9, 785571 CrossRef.
- F. Solymosi, J. Mol. Catal., 1991, 65, 337 CrossRef.
- C.-S. Chen, W.-H. Cheng and S.-S. Lin, Appl. Catal., A, 2003, 238, 55 CrossRef.
- Y. A. Daza and J. N. Kuhn, RSC Adv., 2016, 6, 49675 RSC.
- A. G. Kharaji, A. Shariati and M. A. Takassi, Chin. J. Chem. Eng., 2013, 21, 1007 CrossRef.
Footnote |
| † Electronic supplementary information (ESI) available. See DOI: https://doi.org/10.1039/d4cy01331j |
| This journal is © The Royal Society of Chemistry 2025 |