
 Open Access Article
 This Open Access Article is licensed under a Creative Commons Attribution-Non Commercial 3.0 Unported Licence
Body fluid diagnostics using activatable optical probes
Jie
Zhan
 a,
Yanbin
Cai
b,
Penghui
Cheng
*c,
Lei
Zheng
*a and
Kanyi
Pu
*de
a,
Yanbin
Cai
b,
Penghui
Cheng
*c,
Lei
Zheng
*a and
Kanyi
Pu
*de
aDepartment of Laboratory Medicine, Guangdong Provincial Key Laboratory of Precision Medical Diagnostics, Guangdong Engineering and Technology Research Center for Rapid Diagnostic Biosensors, Guangdong Provincial Key Laboratory of Single Cell Technology and Application, Nanfang Hospital, Southern Medical University, Guangzhou, 510515, China. E-mail: nfyyzhenglei@smu.edu.cn
bGuangdong Provincial Biomedical Engineering Technology Research Center for Cardiovascular Disease, Department of Cardiology and Laboratory of Heart Center, Zhujiang Hospital, Southern Medical University, Guangzhou, 510280, China
cState Key Laboratory of Natural Medicines, China Pharmaceutical University, Nanjing, 211198, China. E-mail: penghui.cheng@126.com
dSchool of Chemistry, Chemical Engineering and Biotechnology, Nanyang Technological University, 70 Nanyang Drive, Singapore, 637457, Singapore. E-mail: kypu@ntu.edu.sg
eLee Kong Chian School of Medicine, Nanyang Technological University, 59 Nanyang Drive, 636921, Singapore, Singapore
First published on 14th March 2025
Abstract
In vitro diagnostics often detects biomarkers in body fluids (such as blood, urine, sputum, and cerebrospinal fluids) to identify life-threatening diseases at an early stage, monitor overall health, or provide information to help cure, treat, or prevent diseases. Most clinically used optical in vitro diagnostic tests utilize dye-labeled biomolecules for biomarker recognition and signal readout, which typically involve complex steps and long processing times. Activatable optical probes (AOPs), which spontaneously activate their optical signals only in the presence of disease biomarkers, offer higher signal-to-background ratios and improved detection specificity. They also have the potential to simplify detection procedures by eliminating multiple washing steps. In this review, we summarize recent advances in the use of AOPs for pre-clinical and clinical body fluid diagnostics across various diseases, including cancer, nephro-urological disorders, infectious diseases, and digestive diseases. We begin by discussing the molecular design strategies of AOPs to achieve different optical signal readouts and biomarker specificity. We then highlight their diagnostic applications in various disease models and body fluids. Finally, we address the challenges and future perspectives of AOPs in enhancing body fluid diagnostics and advancing precision medicine.
 Jie Zhan | Jie Zhan obtained her PhD degree in Biochemistry and Molecular Biology from Nankai University in 2019. She joined the Nanfang Hospital of Southern Medical University as an associate professor in 2022. She is currently a visiting scholar at Nanyang Technological University. Her research focuses on the application of self-assembled peptides and molecular probes for in vitro diagnostics and therapy in cardiovascular diseases and cancer. |
 Yanbin Cai | Yanbin Cai obtained his PhD degree in 2017 from Nankai University under the supervision of Professor Zhimou Yang. He then joined the Zhujiang Hospital of Southern Medical University as an associate professor and was promoted to full professor in 2023. His research interests focus on peptide molecular self-assembly and functional materials for applications in drug delivery, theranostics, and biomimetic systems. |
 Penghui Cheng | Penghui Cheng received her PhD degree from Nanyang Technological University in 2022 under the supervision of Prof. Kanyi Pu. After postdoctoral studies with Prof. Kanyi Pu, she joined China Pharmaceutical University, State Key Laboratory of Natural Medicines, Center of Drug Discovery in 2024 as a full Professor. Her current research interests include the development of smart imaging probes for disease theranostics and new drug development. |
 Lei Zheng | Lei Zheng is a professor at the Nanfang Hospital of Southern Medical University. He serves as the Editor-in-Chief of Interdisciplinary Medicine and Associate Editor of Journal of Extracellular Vesicles. His research interests focus on the development and clinical translation of novel in vitro diagnostic technologies, as well as the study and application of extracellular vesicles. |
 Kanyi Pu | Kanyi Pu is a President's Chair Professor at Nanyang Technological University (NTU), where he is affiliated with both the School of Chemistry, Chemical Engineering and Biotechnology and the Lee Kong Chian School of Medicine. He is the Executive Editor of the Journal of the American Chemical Society and serves on the editorial advisory boards of over 18 prestigious journals, including Chemical Society Reviews, Advanced Functional Materials, and Biomaterials. His research is focused on molecular optical imaging and nanomedicine, and he is particularly recognized for his groundbreaking work in molecular afterglow imaging and the development of artificial urinary biomarker probes. |
1. Introduction
In vitro diagnostics (IVD) refers to the analytical technologies used to examine the pathophysiological state of biological specimens from living organisms under extracorporeal conditions, and has become an integral part of modern healthcare in disease diagnostics, health monitoring, and instructed clinical decision.1 IVD involves a wide range of sample types, including body fluids, secretions/excretions, tissues, and cells. As compared to other types of IVD, body fluid (blood, urine, sputum, tears, saliva, etc.)-based diagnostics offers advantages such as directly reflecting the pathological states of various organs, minimally invasive sampling procedures, and high reproducibility.2 Therefore, body fluid diagnostics has remained as the most prevalent and widely applied form of IVD. Current clinical approaches of body fluid diagnostics encompass a variety of methods, including immunological methods (enzyme-linked immunosorbent assay (ELISA), chemiluminescence immunoassay (CLIA), flow cytometry, etc.), molecular diagnostic methods (polymerase chain reaction (PCR) and variants of reverse transcription-polymerase chain reaction (RT-PCR), and quantitative real-time polymerase chain reaction (qPCR)), clinical chemistry methods (spectrophotometry, electrochemistry, and colorimetry), hematology methods (complete blood count and coagulation tests), microbiology methods (culture and sensitivity testing and mass spectrometry), etc.3In order to improve detection sensitivity and spatial resolution, optical IVD approaches utilizing dye-labeled biomolecules for biomarker recognition and signal readout have been developed, such as colorimetry, CLIA, fluorescence immunoassay, qPCR, etc. However, these methods are typically time-consuming, labor-intensive, and require specialized personnel and instrumentation.4 For example, conventional immunoassays typically require 4+ hours of processing time (from sample collection to result reporting) with 5+ steps, including sample preparation, incubation, multiple washing, signal detection and result interpretation. These steps are crucial to reduce background signals and enhance signal-to-background ratios (SBRs), and any deviations can lead to false positive or false negative results.5 While automation has significantly improved operational efficiency and reduced human errors in clinical laboratories, the assay's inherent complexity continues to pose challenges, such as variations in sample handling and instrument calibration.6 These limitations underscore the importance of developing more simplified and advanced diagnostic approaches to maintain high accuracy.
Activatable optical probes (AOPs) are a class of optical agents that spontaneously activate their optical signals in the presence of disease biomarkers, thereby offering high SBRs and improved detection sensitivity and specificity.7–9 To date, a variety of AOPs have been applied in body fluid diagnostics.10,11 As compared to clinical assays, these AOP-based body fluid diagnostics have substantially simplified protocols: they only require direct addition of AOPs into (pre)clinical specimens, followed by a short incubation time and subsequent optical signal readout. This streamlined process not only reduces procedural complexity by eliminating repetitive washing steps and reducing sample manipulation, but also potentially improves diagnostic performance and achieves disease detection at an incipient stage. Moreover, by integrating molecular recognition and signal transduction into a single entity, AOP-based body fluid diagnostics could be developed into point-of-care testing (POCT) devices. This integration represents a significant advancement towards more efficient, rapid, and accessible in vitro diagnostic tools, making them particularly valuable across various clinical applications, especially in resource-limited settings or when rapid results are crucial.12,13
In this review, we summarize recent advances in AOP-based body fluid diagnostics under various pathological conditions (cancer, nephro-urological disorders, infectious diseases, digestive diseases, etc.) (Fig. 1 and Table 1). The molecular design strategies of AOPs that enable diverse optical signal readouts and biomarker specificity are first discussed. The diagnostic utility of these AOPs is then elaborated in various disease models and body fluids. Finally, the challenges and future perspectives related to improving body fluid diagnostics and advancing the field of precision medicine are explored.
 | ||
| Fig. 1 Body fluid-based disease diagnostics. An overview of diseases, body fluids, and biomarkers relevant to AOP applications in in vitro diagnostics. Created in Biorender.com. | ||
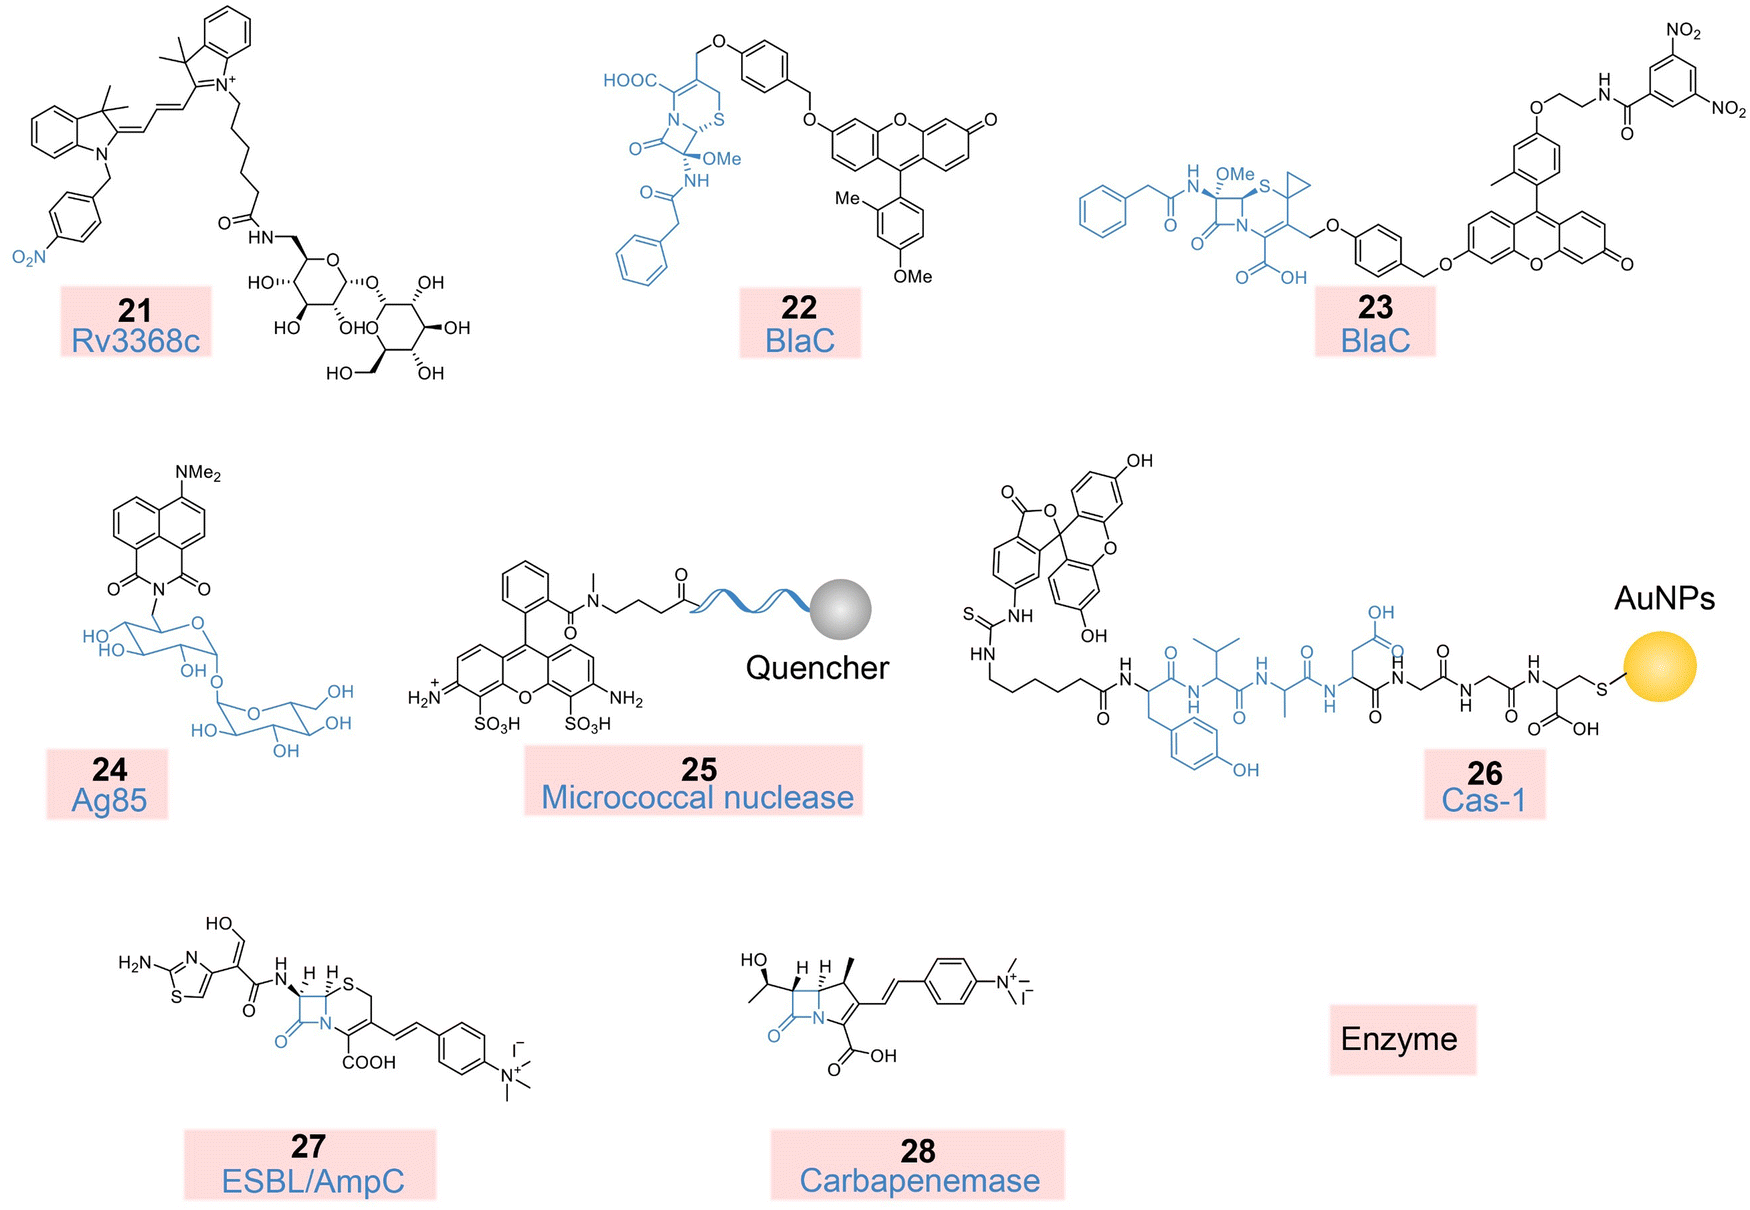
| Body fluid | AOP | Biomarker-of-interest | Design mechanism | Detection type | Signal output λex/λem (nm) | Detection range | LOD | Measurement time | Body fluid volume | Ref. |
|---|---|---|---|---|---|---|---|---|---|---|
| Abbreviations: AAP, alanine aminopeptidase; Aβ, amyloid-β; AIE, aggregation-induced emission; AMY, α-amylase; APN, aminopeptidase N; CSF, cerebrospinal fluid; Cys, cysteine; DPP-IV, dipeptidyl peptidase-IV; ESBL/AmpC, extended-spectrum/AmpC β-lactamases; FRET, Förster resonance energy transfer; GGT, γ-glutamyl transpeptidase; HCLO, hypochlorous acid; Hcy, homocysteine; H2S, hydrogen sulfide; HSA, human serum albumin; ICT, intramolecular charge transfer; LAP, leucine aminopeptidase; LOD, limit-of-detection; LPS, lipase; mALB, microalbumin; MAO, monoamine oxidase; MDA, malondialdehyde; NAG, N-acetyl-beta-D-glucosaminidase; NO, nitric oxide; NR, not reported; NSET, nanomaterial-based surface energy transfer; PET, photoinduced electron transfer; Rv3368c, nitroreductase Rv3368c; sLeX, sialyl Lewis X; TBET, through bond energy transfer; TICT, twisted intramolecular charge transfer. | ||||||||||
| Cancer detection | ||||||||||
| Blood plasma | 1 | GGT | ICT | Blue shift | Before: 730/805 | 0.1–90.0 U L−1 | 0.03 U L−1 | 16 min | NR | 14 |
| After: 540/640 | ||||||||||
| Blood serum | 2 | GGT | ICT | Turn on | λ em: 571 | 0–20 U L−1 | 0.66 mU L−1 | 30 min | NR | 15 |
| Blood plasma | 3 | Hcy | ICT | Turn on | 488/550 | 0.625–160 μM | 0.176 ppm | 5 min | NR | 16 |
| Whole blood | 4 | H2O2 | ICT | Turn on | One-photon: 400/450 | 0–100 μM | 0.1 μM | NR | NR | 17 |
| Two-photo: 800/450 | ||||||||||
| Urine | 5 | APN | ICT | Turn on | 695/720 | NR | NR | 7 days post tumor implantation | NR | 18 |
| Urine | 6 | Cys | ICT | Turn on | 488/550 | 0–10 ng μL−1 | 1 ng mL−1 | 40 min | 200 μL | 19 |
| Urine | 7 | Cys, Hcy | ICT | Turn on | 480/630(Cys) | 80–1280 μM (Cys and Hcy) | 0.64 μM (Cys) | Cys: V1/2 = 26.6 min | 198 μL | 20 |
| 480/560(Hcy) | 3.2 μM (Hcy) | Hcy: V1/2 = 192.1 min | ||||||||
| Urine | 8 | sLeX | PET | Turn on | 255/426 | NR | 4.58 × 10⁻¹⁰ mol L−1 | 15 min | 1 mL | 21 |
| Saliva | 9 | NO | FRET | Turn on | 680/780 | 0–20 μM | 28 nM | 5 min | NR | 22 |
| Lung fluid | 10 | Long-chain aldehydes | PET | Turn on | 373/530 | 0–250 μM (nonanal) | Nonanal: 10 μM | 15 min | 100 μL | 23 |
| Heptanal: 40 μM | ||||||||||
| Octanal: 100 μM | ||||||||||
| Nephro-urological disorder detection | ||||||||||
| Urine | 11 | NAG | ICT | Turn on | 695/720 | NR | NR | 30–60 min | 100 uL | 24 |
| Urine | 12 | GGT | ICT | Turn on | 380/440 | NR | NR | 1 h | 100 uL | 25 |
| Urine | 13 | AAP | ICT | Turn on | 550/590 | NR | NR | 1 h | 100 uL | 25 |
| Urine | 14 | DPP-IV | FRET | Turn on | 450/520 | NR | NR | 1 min | NR | 26 |
| Urine | 15 | GGT | FRET | Turn on | 450/520 | NR | NR | 1 min | NR | 26 |
| Urine | 16 | HSA | ICT | Blue shift | Before: 400/580 | 0–200 μg mL−1 | 0.2 μg mL−1 | 3 min | 300 μL | 27 |
| After: 400/490 | ||||||||||
| Urine | 17 | HSA | TICT | Turn on | 555/635 | 0–1.0 g L−1 | 0.36 mg L−1 | <25 min | NR | 28 |
| Urine | 18 | HSA | AIE | Turn on | 360/490 | 0.02–3000 mg L−1 | 0.21 nM | 10 s | 25 μL | 29 |
| Urine | 19 | HSA | TICT | Turn on | 520/590 | 0–0.4 mg mL−1 | 1.89 μg mL−1 | 0.5 min | NR | 30 |
| Urine | 20 | mALB | AIE&TICT | Turn on | 454/680 | 0–800 μg mL−1 | 3.15 μg mL−1 | NR | NR | 13 |
| Infectious diseases detection | ||||||||||
| Sputum | 21 | Rv3368c | PET | Turn on | 561/565 | NR | 3.5 × 10² CFU for M. smegmatis | 2 h | 2 mL | 31 |
| 4.3 × 10² CFU for H37Rv | ||||||||||
| Sputum | 22 | β-Lactamase | ICT | Turn on | 490/520 | NR | 10 CFU | <10 min | 100 μL | 12 |
| Sputum | 23 | β-Lactamase | ICT | Turn on | 490/520 | < 1.6 × 10⁷ CFU mL−1 | 10 CFU | 1 h | 100 μL | 32 |
| Sputum | 24 | Antigen 85 | Polarity responsiveness | Turn on | λ ex = 405 nm (optimal) or 488 nm | NR | 10![[thin space (1/6-em)]](https://www.rsc.org/images/entities/char_2009.gif) 000 CFU mL−1 000 CFU mL−1 |
30 min | 100 μL | 33 |
| Synovial fluid | 25 | Micrococcal nuclease | FRET | Turn on | λ ex = 480/490 nm | NR | NR | 2 h | 1 mL | 34 |
| λ em = 515–535 nm | ||||||||||
| Synovial fluid | 26 | Caspase-1 | NSET | Turn on | FITC/GFP filter sets | 5 to 20 (average number of S. aureus in one host cell) | 5 (average number of S. aureus in one host cell) | 1 h | NR | 35 |
| Urine | 27 | ESBL/AmpC | ICT | Turn on and red shift | Before: λmax = 436 nm | 5 × 10³ - 5 × 10⁶ CFU mL−1 | 5 × 10⁴ CFU mL−1 | 5 min | 20 μL | 36 |
| After: λmax = 512 nm | ||||||||||
| Urine | 28 | Carbapenemases | ICT | Turn on and red shift | Before: λmax = 417 nm | 5 × 10³ - 5 × 10⁶ CFU mL−1 | 5 × 10⁴ CFU mL−1 | 5 min | 20 μL | 36 |
| After: λmax = 591 nm | ||||||||||
| Digestive system disease detection | ||||||||||
| Blood serum | 29 | LAP, MAO | ICT | Turn on | 670/720 | 0–20 U L−1 | NR | 2 h | NR | 37 |
| Blood serum | 30 | LAP, MAO | ICT | Turn on | 365/520 | <12.5 U L−1 | LAP: 0.877 U L−1 MAO: 0.249 U L−1 | Plateau: 24 h; strip: < 1 min | NR | 38 |
| — | ||||||||||
| Blood serum | 31 | LPS, AMY | AIE | Turn on | 390/460 (LPS) | LPS: 0–72 U L−1 | LPS: 0.11 U L−1 | LPS: 7 min | NR | 39 |
| 390/610 (AMY) | AMY: 0–110 U L−1 | AMY: 0.17 U L−1 | AMY: 25 min | |||||||
| Blood serum | 32 | α-Amylase | AIE | Turn on | 370/482 | 0–45.5 U L−1 | 0.14 U L−1 | 3 min | NR | 40 |
| Drainage fluid | 33 | Pancreatic proteases | FRET | Blue shift | Before: 490/620 | NR | Trypsin: 5.00 U mL−1 | 10 min | NR | 41 |
| After: 490/520 | α-Chymotrypsin: 0.02 U mL−1 | |||||||||
| Elastase: 0.003 U mL−1 | ||||||||||
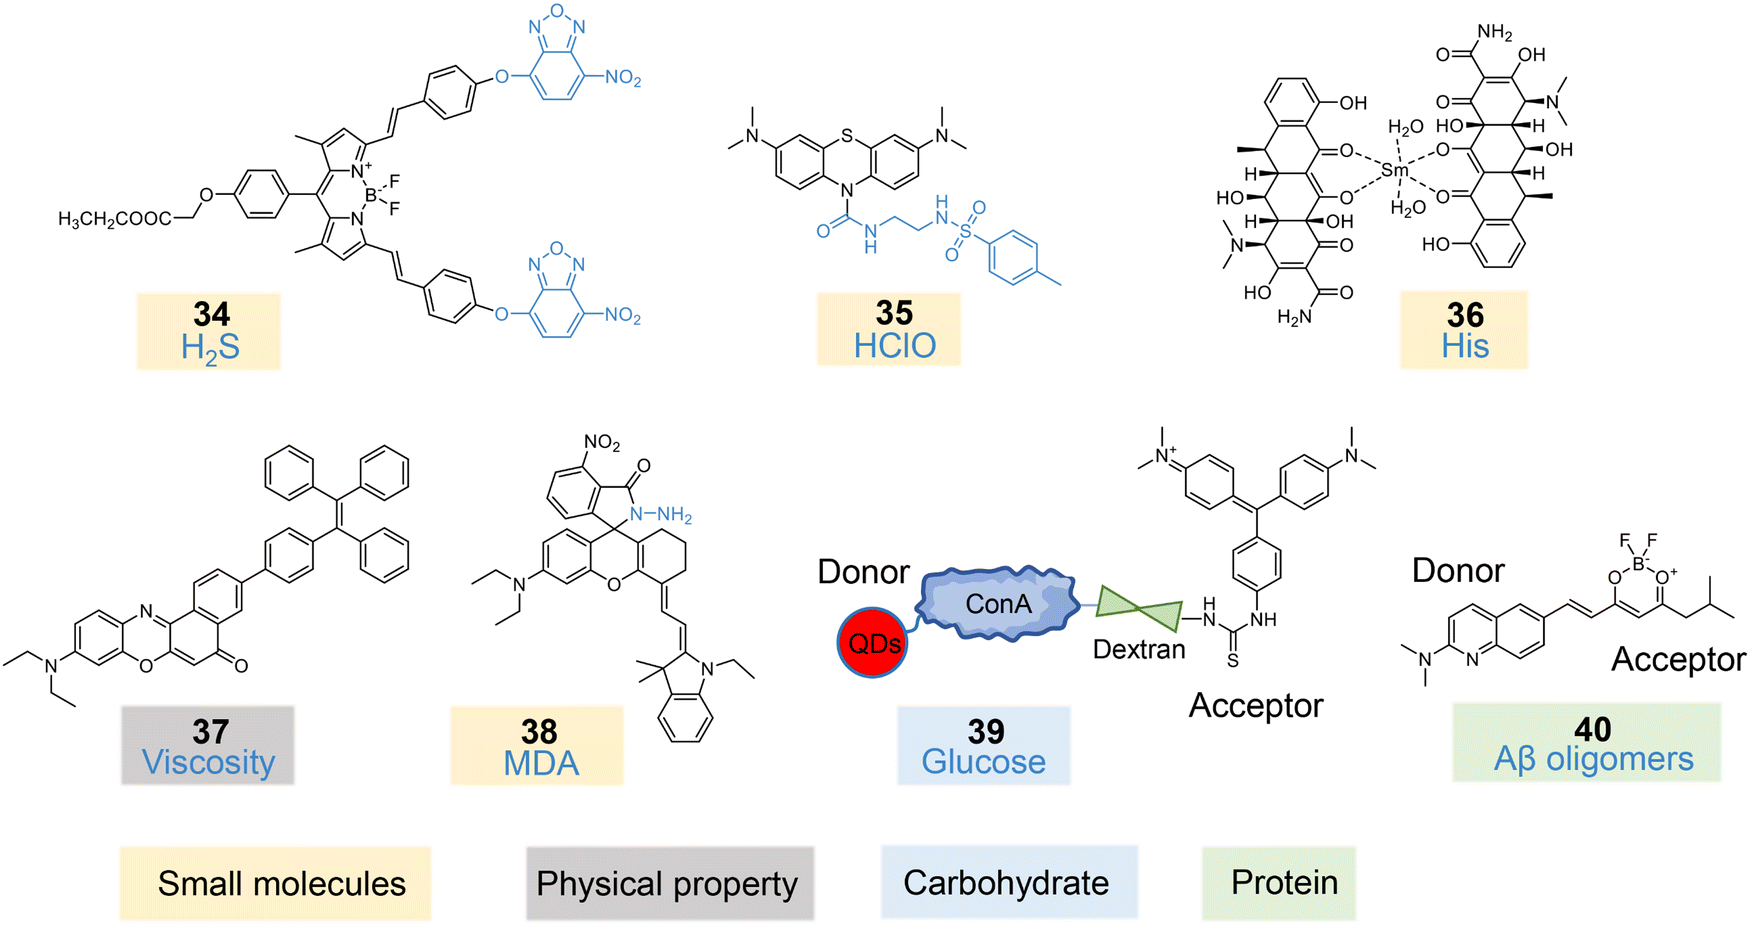
| Other disease detection | ||||||||||
| Whole blood | 34 | Hydrogen sulfide (H2S) | PET | Turn on | 580/680 | NR | 28 nM | 50 min | NR | 42 |
| Blood serum | 35 | HClO | ICT | Turn on | 620/690 | 5.0–45 μM | 0.29 μM | 2 s | NR | 43 |
| Blood serum and urine | 36 | Histidine | Ligand substitution | Turn on | 400/645 | 1.4 × 10⁻⁵ to 6.5 × 10⁻¹⁰ mol L−1 | 3.2 × 10⁻¹⁰ mol L−1 | NR | Serum:1 mL | 44 |
| Urine: 0.1 mL | ||||||||||
| Blood | 37 | Viscosity | TBET | Ratiometric | Before: 375/460 | 16.1–611 cp | NR | NR | 10 μL | 45 |
| After: 375/675 | ||||||||||
| Urine | 38 | MDA | ICT and PET | Turn on | 730/760 | 0–500 μM | 163 nM | 30 min | 10 μL | 46 |
| Tear | 39 | Glucose | FRET | Turn on | 490/652 | 0.03–3 mmol L−1 | NR | 30 s | 2 μL | 47 |
| CSF | 40 | Aβ ligomers | ICT | Turn on | 465/577 | NR | 0.57 ± 0.04 nM | 2 h | NR | 48 |
2. Molecular designs
To perform body fluid-based disease diagnostics, effective AOP designs meet the following two requirements. First, the AOP should be developed based on common optical imaging agents (molecular fluorophores,9,49 quantum dots,50 multifunctional nanomaterials,51etc.) and exhibits an obvious spectra change upon biomarker detection. To enhance SBRs and improve spatial resolution, AOPs with a “turn-on” signal response have been reported. Ratiometric AOPs with shifts in emission profiles have also been developed for biomarker quantification. Second, AOPs should demonstrate sensitive and specific detection capabilities towards biomarker-of-interest. Suitable sensing mechanisms could be incorporated into AOP molecular designs to achieve chemoselectivity towards various biomarkers in body fluids, such as enzymes,52,53 small molecules,52,54 proteins,55etc.AOPs could be classified into different categories based on their molecular design strategies, such as charge transfer processes,56 energy transfer processes,50 photoinduced electron transfer (PET)57 and aggregation-induced emission (AIE)58 (Fig. 2). For example, several AOPs with signals “turn-ON” are designed based on charge transfer processes, including intramolecular charge transfer (ICT) and twisted intramolecular charge transfer (TICT). For ICT-based AOPs (1, 5, and 11), they are designed based on fine-tuning of the charge transfer processes, where the incorporation of biomarker-responsive moieties on optical-tunable atoms disrupts the charge transfer processes, and ICT processes are recovered with fluorescence enhancement upon biomarker recognition (Fig. 2a). In addition, several TICT-based AOPs (17, 19, and 20) have been developed for albumin detection, where the initial intramolecular rotation enables charge separation (TICT ON), and upon albumin binding, the intramolecular rotation becomes restricted in the protein hydrophobic cavity (TICT OFF), resulting in fluorescence activation (Fig. 2b).
 | ||
| Fig. 2 AOP molecular design strategies. Schematic illustration of AOP molecular design strategies: (a) ICT, (b) TICT, (c) FRET, (d) PET, (e) AIE, and (f) others. | ||
Based on energy transfer processes (for example, Förster resonance energy transfer/FRET), several AOPs (33 and 39) are designed through a facile strategy by conjugating a donor fluorophore and a quencher via a biomarker-cleavable linker, and biomarker cleavage results in shifts in fluorescence emission (Fig. 2c). Besides, PET-based AOP 21 has been developed by conjugating an electron-withdrawing nitrobenzyl group onto fluorophores to achieve a nitroreductase-activatable response. AOP 21 initially exhibits minimal fluorescence due to intramolecular electron transfer, and fluorescence is recovered after biomarker cleavage. AIE represents a unique mechanism where dispersed molecules show minimal emission, but biomarker-induced aggregation restricts molecular motion, leading to enhanced fluorescence emission (Fig. 2d), typically observed in tetraphenylethene derivatives that become highly fluorescent upon analyte-induced aggregation (AOPs 31, 32).
AOPs have also been developed based on other molecular design strategies, including nanomaterial-based surface energy transfer (NSET),59 through bond energy transfer (TBET),60 ligand substitution,61 and polarity responsiveness (Fig. 2e).62 NSET refers to the dipole-surface energy transfer between fluorophores and nanomaterial surfaces. For example, AOP 26 is developed by conjugating fluorescently labeled substrates onto gold nanoparticles, and fluorophores are released upon biomarker cleavage. TBET is a highly efficient energy transfer process based on a conjugated donor–acceptor system connected via rigid π-electronic bridges for rapid and efficient energy migration. Upon biomarker recognition, structural or electronic perturbations of the conjugated pathway modulate the energy transfer process, resulting in ratiometric fluorescence changes (AOP 37). Ligand substitution-based AOPs (for example, AOP 36) are molecular sensors that utilize coordination chemistry to achieve signal transduction, wherein the exchange of ligands around a metal center induces a transition in optical properties. Polarity responsiveness-based AOPs usually modulate their emission properties based on changes in the local environmental polarity and exhibit distinct photophysical behaviors in environments of different polarities. For example, AOP 24 represents a polarity-responsive design where enzymatic incorporation and then into the hydrophobic mycomembrane triggers dramatic fluorescence enhancement through environmental polarity transition from aqueous to lipophilic conditions.
These various molecular mechanisms exhibit distinct advantages and are suitable for different detection scenarios. For instance, ICT/TICT-based mechanisms offer broad applicability and versatility in molecular design, though their performance is susceptible to environmental factors, particularly pH. FRET-based probes achieve excellent ON/OFF contrast and are particularly valuable for detecting DNA and protein, though their efficiency depends on the donor–acceptor distance and spectral overlap. PET-based designs demonstrate a rapid response and high sensitivity to electrical potential changes, making them ideal for ion detection and neurotransmitter monitoring. AIE-based probes are particularly useful for imaging in aggregation-induced analytes, such as in cellular membranes or amyloid fibrils, while their performance may be compromised in highly soluble or dispersed systems. Therefore, selecting an appropriate luminescence mechanism, or even combining multiple mechanisms, based on specific application conditions is crucial for the design and application of AOPs.63–65
3. Body fluid diagnostics using AOPs
AOPs have emerged as promising detection tools in body fluid diagnostics, demonstrating superior advantages over other (pre)clinical diagnostic approaches through their rapid detection, high sensitivity, and minimal sample requirements across various pathological conditions. Therefore, AOP-based body fluid diagnostics has been successfully implemented in the diagnosis of many major diseases, including cancer, genitourinary disorders, infectious diseases, gastrointestinal diseases, neurodegenerative diseases, cardiovascular disorders, etc. Additionally, AOPs feature user-friendly operational protocols and straightforward signal readout methods that require minimal technical expertise, making them suitable for deployment in primary healthcare settings and home-based monitoring. The specific applications of AOP-based body fluid diagnostics in various disease categories will be elaborated in more detail in the following sections.3.1. Cancer
Cancer is one of the leading causes of death globally with high morbidity and mortality.66 Therefore, cancer diagnosis at an early disease stage is crucial to achieve effective treatment and improved patient outcomes. Tumor-associated biomarkers, representing a diverse array of small molecules, enzymes, and reactive species that are distributed across various body fluids (blood, urine, saliva, and tissue fluid), offer a wealth of detection targets and sample sources for tumor detection.67 Though current clinical detection methods such as ELISA, MS, and PCR have been widely employed to detect tumor-associated biomarkers, these techniques often require sophisticated instrumentation, complex sample preparation procedures, and substantial analytical expertise, leading to time-consuming and costly analyses.68 In contrast, AOP-based body fluid diagnostics enables short detection times, simplified sample preparation protocols, accessible operational procedures, and cost-effective implementation, while maintaining sensitivity levels comparable to standard commercial assay platforms. This innovative technology paves the way for precision oncology, promising to significantly enhance the accuracy and timeliness of cancer diagnostics.γ-Glutamyl transpeptidase (GGT) is a membrane protease associated with tumor progression, invasion, and chemoresistance, and its overexpression has been reported in various human malignancies (ovarian, cervical, liver tumors, etc.).72 The elevated serum GGT level is associated with an increased risk of cancer progression, invasion, and migration.73 In response to the diagnostic potential of GGT, Li's and Yang's groups reported GGT-activatable fluorescent and bioluminescent AOPs 1 and 2 (Fig. 3).14,15 AOP 2 was constructed by caging the D-luciferin hydroxyl group with the GGT-cleavable γ-glutamyl group through a self-immolative linker. The γ-glutamyl bond was cleaved in the presence of GGT to release active D-luciferin. Due to the absence of excitation-induced autofluorescence, AOP 2 achieved a remarkable limit of detection (LOD) value of 0.66 mU L−1. The AOP 2-based serum test was then applied to distinguish ovarian carcinoma patients from healthy controls with clinical serum samples and achieved high accuracy (Fig. 4a). Notably, the detection results obtained with AOP 2 show complete concordance with those from commercial GGT assay kits.
 | ||
| Fig. 3 Chemical structures of AOPs 1–10 for cancer diagnostics in blood (AOPs 1–4), urine (AOPs 5–8), saliva (AOP 9), and tissue fluid (AOP 10). GGT, γ-glutamyl transpeptidase; Hcy, homocysteine; H2O2, hydrogen peroxide; APN, aminopeptidase N; Cys, cysteine; sLeX, sialyl Lewis X; NO, nitric oxide. | ||
 | ||
| Fig. 4 Cancer diagnostics using AOPs. Blood diagnostics: (a) comparison of serological assays using AOP 2versus a commercial kit. Samples A–D are from healthy individuals and samples E–H are from ovarian cancer patients. (b) Experimental design showing the U87 cell xenograft mouse model and blood plasma collection timeline. (c) Fluorescence intensities of diluted plasma samples from normal and GBM mice after 10 min incubation with AOP 3. Urine diagnostics: (d) experimental workflow for urine collection from the bladder cancer mouse model and fluorescence imaging using AOP 5, showing progression at 0, 3, 7, 14, 21, and 28 days post-tumor implantation. (e) Fluorescence intensity of 1756 clinical urine samples after 40 min treatment with AOP 6. Sample group: A: AOP 6 in PBS buffer, B: healthy donors (n = 308), C: urinary stone (n = 162), D: kidney cancer (n = 162), E: prostate cancer (n = 162), F: bladder cancer (n = 162), G: cervical cancer (n = 100), H: diabetes (n = 100), I: pituitary adenoma (n = 100), J: adrenal adenoma (n = 100), K: lung cancer (n = 100), L: ovarian cancer (n = 100), M: pancreatic biliary tract cancer (n = 100), and N: pancreatic cancer (n = 100). (f) Statistical analysis of AOP 6 urinary test results showing true/false positive and negative rates for healthy donors versus cervical cancer patients. Saliva diagnostics: (g) AOP 9 detection results from saliva samples of healthy donors (n = 7), periodontitis patients (n = 7), and oral cancer patients (n = 3). Tissue fluid diagnostics: (h) the workflow and quantitative comparison of nonanal in lung fluids from lung cancer patients after treatment with AOP 10versus GC-MS analysis. Panel (a) is reproduced from ref. 15 with permission from Elsevier B.V., copyright 2017. Panels (b) and (c) are reproduced from ref. 16 with permission from Elsevier B.V., copyright 2022. Panel (d) is reproduced from ref. 18 with permission from Wiley-VCH Verlag GmbH & Co. KGaA, Weinheim, copyright 2019. Panels (e) and (f) are reproduced from ref. 19 with permission from Elsevier B.V., copyright 2022. Panel (g) is reproduced from ref. 22 with permission from Elsevier B.V., copyright 2023. Panel (h) is reproduced from ref. 23 with permission from American Chemical Society, copyright 2022. | ||
The elevated serum level of homocysteine (Hcy), hyperhomocysteinemia, has been correlated with an increased risk of various cancers (such as colorectal cancer, glioblastoma, breast cancer, bladder cancer, etc.).74 Kim's group reported a Hcy-activatable fluorescent probe (AOP 3) for real-time monitoring of serum Hcy levels with diagnostic and prognostic purposes.16 AOP 3 utilized pyridine-thiol coordination and amine-addition reaction mechanisms to achieve selective Hcy detection (Fig. 3). As shown in Fig. 4b, AOP 3 showed remarkable responsiveness to Hcy in plasma with a low LOD value (0.084 ppm) and a rapid response time (within 5 minutes). The AOP 3-based blood test was then applied to monitor tumor progression in the glioblastoma (GBM) tumor mice model and up to ∼1.6-fold elevated bioluminescence signals were observed at 7 days post-tumor implantation. In contrast, AOP 3-based real-time imaging only detected tumor growth at 14 days post-tumor implantation. Therefore, the AOP 3-based blood test could effectively detect GBM at an early stage (Fig. 4c). In addition to biothiols, other small molecules have also emerged as potential biomarkers for cancer diagnosis. For example, Zhu's group developed a hydrogen peroxide (H2O2)-responsive fluorescent nanoprobe (AOP 4, Fig. 3) to assist the identification of circulating tumor cells (CTCs).17 AOP 4 consists of a H2O2-responsive molecular fluorophore (coumarin derivative Cou-BPin) and a hydrophilic glycol chitosan and self-assembles into micellar nanoparticles in aqueous solutions. AOP 4 demonstrated high sensitivity to H2O2 with a LOD of 0.1 μM, therefore enabling imaging of endogenous H2O2 in human colorectal cancer cells and facilitating the identification of circulating tumor cells (CTCs). In clinical blood samples from colorectal cancer patients, this H2O2-based CTCs counting method showed better agreement with pathological findings compared to traditional approaches.
Aminopeptidase N (APN) is a membrane-bound zinc-dependent metalloprotease that is overexpressed in various cancers (bladder cancer, breast cancer, liver cancer, etc.).76 Previously, our group reported an APN-activatable AOP 5 (Fig. 3) for sensitive bladder cancer detection.18 In orthotopic bladder cancer mice model, AOP 5-based urinalysis showed a statistically significant fluorescence enhancement (2.1-fold) at 7 days post-tumor implantation, and the urine fluorescence signals continued increasing to 4.1-fold at 28 days post-tumor implantation (Fig. 4d). Histological studies further revealed that this signal evolution correlates well with the bladder tumor progression.
Besides liable serum biomarkers, cysteine (Cys) and Hcy, are also potential urinary biomarkers for cancer detection.77 Kim's group reported AOPs 6 and 7 that selectively detect urinary Cys/Hcy for cervical cancer diagnosis (Fig. 3).19,20 With high sensitivity towards Cys (LOD = 1 ng mL−1), AOP 6-based urinalysis requires a small amount of urine sample (200 μL) and short diagnosis time (40 min). The capability of AOP 6-based urinalysis was then tested in 1756 urine samples from well-characterized patients bearing urological disorders (urinary stone, kidney cancer, prostate cancer, and bladder cancer), non-urological disorders (cervical cancer, diabetes, pituitary adenoma, adrenal adenoma, lung cancer, ovarian cancer, pancreatic biliary tract cancer, and pancreatic cancer), and healthy controls (Fig. 4e). AOP 6 showed a remarkable performance in cervical cancer diagnosis, achieving a true positive rate of 74% and a true negative rate of 88.3% (Fig. 4f). Such a non-invasive, simple, and rapid urine-based diagnostic approach offers a promising alternative to traditional cervical cancer screening methods (pap smear and staining), potentially improving early detection rates and patients’ comfort.
Sialyl Lewis X (sLeX) is a terminal O-glycan structure highly expressed on cancer cells and has been identified as a prostate cancer-related biomarker.78 Wang and coworkers presented AOP 8-based urinalysis for rapid prostate cancer detection.21 AOP 8 selectively binds to sLeX, causing a significant fluorescence enhancement due to changes in electron transitions. With high detection sensitivity (LOD = 4.58 × 10⁻¹⁰ mol L−1), AOP 8-based urinalysis successfully distinguished upregulated sLeX levels in clinical urine samples from prostate cancer patients compared to healthy controls within 15 minutes, demonstrating its potential for pancreatic cancer early screening.
Nitric oxide (NO) is a multifunctional gaseous messenger molecule involved in many important biological processes; yet, recent studies revealed that an abnormally high concentration of NO in saliva is associated with periodontitis and oral carcinoma.80 Jiao et al. reported a novel near-infrared fluorescent probe, AOP 9 (Fig. 3), to detect the saliva NO content in clinical samples.22 AOP 9 is designed based on a Se–NO bond recognition mechanism and therefore exhibits high selectivity and sensitivity towards NO with a LOD value of 28 nM. The probe demonstrates a rapid response (within 5 minutes) and near-infrared emission (780 nm), making it suitable for biological applications. The capability of AOP 9 to detect oral cancer was then evaluated with clinical experiments involving 20 saliva samples from healthy individuals and patients with periodontitis and oral cancer. In samples from oral cancer patients, the AOP 9-based saliva test showed statistically significant 4.9-, 1.9-fold fluorescence enhancements, as compared to healthy and periodontitis groups, respectively (Fig. 4g). Therefore, AOP 9 serves as a valuable tool for monitoring and evaluating the progression of oral diseases.
For example, long-chain aldehydes (specifically, hexanal, heptanal, octanal, and nonanal) have been identified as significant biomarkers for lung cancer diagnosis, and their concentrations in biological matrices (lung fluid, blood, tumor tissue, and exhaled breath) exhibit up to 80% elevation in lung cancer patients compared to healthy individuals.83 To achieve the specific detection of long-chain aldehydes, Jongkhumkrong et al. presented a novel fluorescent nanosensor, AOP 10 (Fig. 3) based on helicene dye encapsulated in ethyl cellulose.23 The helicene dye contains a hydrazide group and could react with the aldehyde group via imine formation; the chemical conjugation along with hydrophobic interactions with alkyl long-chain aldehydes subsequently induce nanosensor self-assembly and fluorescence turn-ON. AOP 10 showed high selectivity and sensitivity with a short measurement time (15 minutes) and a LOD value of 10 μM towards nonanal. The capability of AOP 10 to quantify long-chain aldehyde content in lung fluid samples was then tested with clinical specimens from lung cancer patients, and the fluorescence enhancement from AOP 10 showed a positive correlation with standard gas chromatography–mass spectrometry (GC-MS) (Fig. 4h). Therefore, with the advantages of high specificity, rapid response time, and simplicity of use, AOP 10 could become a promising tool for both research and clinical diagnostics in lung cancer management.
3.2. Nephro-urological disorders
Nephro-urological disorders encompass a wide range of conditions affecting the kidneys, ureters, bladder, and urethra and represent a significant global health concern.84 Current clinical approaches employ a combination of laboratory tests, imaging techniques, and invasive biopsy. In comparison to other clinical methods, in vitro diagnostics provides a non-invasive and rapid test approach; yet, it is limited by issues of poor sensitivity and specificity, particularly in early-stage disease detection.85 To resolve these limitations, the AOP-based urine test with enhanced specificity and real-time result readout capabilities could potentially improve disease early detection and personalized treatment strategies in nephro-urological disorders.Monitoring up-regulated urinary enzymes provides a non-invasive approach to detect renal dysfunctions at an early stage before kidney structural damages as reflected by elevations in serum creatinine.88 A series of AOPs have been developed to detect urinary enzymes that are associated with key pathophysiological processes, such as lysosomal damages (N-acetyl-β-D-glucosaminidase (NAG))89 and proximal tubule brush border membrane damages (GGT, alanine aminopeptidase (AAP), and dipeptidyl peptidase-IV (DPP-IV)).90 Previously, our group designed AOPs 11–13 for sensitive detection of drug-induced kidney injury (DIKI) at an early disease stage.24,25 These AOPs were constructed by caging the optically tunable atoms on fluorophores (coumarin, resorufin, and hemi-cyanine) with biomarker-responsive groups (GGT: γ-glutamate; AAP: alanine; NAG: N-acetyl-β-D-glucosaminide). The capabilities of AOPs 11–13 to detect kidney dysfunctions were then tested in preclinical DIKI mice models in both acute and chronic manners. In cisplatin-induced acute kidney injury mice model, NAG-activatable AOP 11 detected the onset of kidney injuries at 24 hours post-cisplatin treatment, which was at least 24 hours earlier than other preclinical blood and urine biomarkers (cystatin C, neutrophil gelatinase-associated lipocalin, osteopontin, β2-microglobulin, and trefoil factor-3), and 48 hours earlier than clinical serum creatinine and the BUN test. For multiplex urinalysis, AOPs 11–13 were designed to emit distinct fluorescence signals with a minimal overlap (Fig. 6a–c). In doxorubicin-induced chronic kidney disease models, these AOPs detected kidney dysfunction 5 days earlier than traditional clinical biomarkers like serum creatinine and blood urea nitrogen (Fig. 6d and e). Besides, as shown in Fig. 6f, receiver operating characteristic (ROC) analysis revealed that AOPs (11–13)-based multiplex urinalysis demonstrated the highest diagnostic accuracy (AUC = 0.94) among traditional clinical diagnostic approaches (AUC ≈ 0.75).
In addition, enzyme-activatable AOPs have been applied for nephron-urological disease diagnostics using clinical specimens. For example, Isomoto et al. developed AOPs 14 and 15 that are specific towards DPP-IV and GGT and demonstrated their applications in diabetic kidney disease diagnosis.26 Both DPP-IV and GGT are localized to proximal tubular cells, and are released into urine when tubules are injured; yet both tubular and circulating DPP-IV are up-regulated in patients with diabetes mellitus. In a clinical study involving 102 patient urine samples, AOPs (14 and 15)-based urinalysis successfully differentiated diabetic kidney diseases from nephrosclerosis or glomerulonephritis. Therefore, the non-invasive nature, early detection capability, and improved diagnostic accuracy make these urinalysis approaches promising for both preclinical drug screening and clinical diagnosis of nephron-related diseases.
Detection of abnormal levels of urinary protein (especially albumin (ALB)) holds great clinical importance, as it reflects various disease states such as kidney injuries, diabetic nephropathy, cardiovascular risk, and pregnancy complications.91 However, clinical methods to detect urine proteins, including dipstick tests, immunoturbidimetry, and immunofluorescence imaging suffer from shortcomings such as low sensitivity, insufficient specificity, and complicated operation procedures. To address these challenges, researchers have developed a series of AOPs 16–20 to achieve sensitive detection of urinary proteins (Fig. 5).13,27–30 For example, Zhou's group reported AOP 17 to quantitatively detect urinary ALB in samples from chronic kidney injury rat models and patient samples.28 AOP 17 specifically binds to the hydrophobic cavity of ALB which inhibits the TICT effect, and the fluorescence intensity responds linearly towards ALB concentrations (0 to 1.0 g L−1) with a LOD of 0.36 mg L−1 (5.4 nM). AOP 17 was then applied to quantify the ALB amount in patient samples, and showed consistent results with the Coomassie Brilliant Blue staining method (Fig. 6g).
 | ||
| Fig. 5 Chemical structures of AOPs 11–20 for nephron-urological disorder diagnostics in urine. NAG, N-acetyl-β-D-glucosaminidase; GGT, γ-glutamyl transpeptidase; DPP-IV, dipeptidyl peptidase-IV; HSA, human serum albumin; mALB, microalbumin. | ||
 | ||
| Fig. 6 Nephro-urological disorders diagnostics using AOPs. (a) Comparative timeline of AOP 11-based urinalysis versus conventional clinical biomarkers for the detection of drug-induced AKI. (b) Fluorescence enhancement of AOP 11 in urine samples from drug-treated mice at various post-treatment time points (mean ± s.d., n = 9). (c) Fold change in urinary and serum biomarker levels following drug treatment. (d) Comparative timeline showing AOPs 11–13-based urinalysis versus clinical biomarker detection for the detection of drug-induced AKI. (e) Fluorescence enhancement of AOPs 11–13 and clinical biomarker detection after incubation with drug treatment (n = 5, mean ± s.d.). (f) ROC curve analysis comparing diagnostic performance between individual AOPs (11, 12, 13), their combination (11 + 12 + 13), and conventional markers (sCr and proteinuria) in distinguishing nephrotoxicant-treated animals with renal injuries from untreated controls. (g) HSA level quantification in chronic nephritis patient urine samples using AOP 17versus the standard Coomassie Brilliant Blue G250 method (n = 3). (h) Schematic workflow of the AOP 20-based portable device for urinary analysis. (i) Heat map showing correlations between ΔF (fluorescence intensity of urine with AOP 20 at 750 nm – fluorescence intensity of urine at 750 nm) and clinical markers, and ΔF shows high correlations with mALB (Pearson's r = 0.92). mALB, microalbuminuria; BUN, blood urea nitrogen; sCr, serum creatinine; UA, blood uric acid; GFR, glomerular filtration rate. (j) Pearson correlation analysis of the AOP 20-based portable device across various nephron-related diseases (A: chronic nephritis, B: type 2 diabetes, C: high blood pressure, D: nephropathy, E: chronic renal failure). Panels (a)–(c) are reproduced from ref. 24 with permission from Springer Nature Limited, copyright 2019. Panels (d)–(f) are reproduced from ref. 25 with permission from American Chemical Society, copyright 2020. Panel (g) is reproduced from ref. 28 with permission from Elsevier B.V., copyright 2023. Panels (h)–(j) are reproduced from ref. 13 with permission from SCUT, AIEI and John Wiley & Sons Australia, Ltd, copyright 2024. | ||
Zhu et al. reported AOP 20 for POCT of urinary microalbumin (mALB) in clinical patient samples.13 AOP 20 exhibited conformational changes upon binding to mALB, transitioning from a twisted structure to a more planar one, which subsequently mitigated the TICT effect with fluorescence activation. In vitro experiments revealed that AOP 20 achieves mALB detection with a wide linear range (0–8000 μg mL−1) and a low LOD (3.1501 μg mL−1). Subsequently, AOP 20 was applied for POCT (Fig. 6h). As shown in Fig. 6i, AOP 20-based POCT (ΔF) showed the strongest positive correlation with mALB levels (Pearson's r = 0.92) than other kidney functional markers (BUN, sCr, UA, and GFR). Furthermore, AOP 20-based POCT showed positive correlation with the clinical ELISA method (Pearson's r = 0.8–0.9) across different nephron-related diseases (chronic nephritis, type 2 diabetes, high blood pressure, nephropathy, and chronic renal failure), validating its reliability for practical applications (Fig. 6j). This comprehensive evaluation confirms the potential of AOP 20 as a reliable POCT tool for kidney-related diseases.
3.3. Infectious diseases
Infectious diseases are primarily caused by pathogenic microorganisms such as bacteria, viruses, fungi, and parasites and have posed significant global health challenges.92 Therefore, rapid and accurate diagnostic approaches are essential to achieve effective treatment and prevention of spread. Traditional clinical diagnostic approaches such as culture-based techniques and PCR often face limitations including time-consuming processes, limited sensitivity, and high costs.93 In contrast, AOPs that detect antimicrobial resistance markers with high sensitivity and specificity have been readily developed, and AOP-based body fluid diagnostics offers several advantages for infectious disease diagnosis, such as rapid results, direct visual readout, quantitative assessment, and minimal sample requirement. Thus, AOPs have potential to become valuable tools for improving infectious disease diagnosis in clinical settings.Tuberculosis, an infectious lung disease caused by Mycobacterium tuberculosis (Mtb) infection, remains one of the most deadly diseases with high morbidity and mortality.96 Therefore, the precise detection of Mtb is crucial for early diagnosis and treatment efficacy monitoring of pulmonary infections. Liu et al. reported AOP 21 that specifically activates fluorescence in response to Rv3368c, and Rv3368c is a specific nitroreductase conversely expressed in live Mtb.31 AOP 21 is designed by incorporating a cyanine fluorophore with a nitrobenzyl group which acts as a PET quencher. In in vitro experiments, AOP 21 showed high detection specificity and sensitivity towards Rv3368v-positive Mtb in sputum, with LODs of 3.5 × 10² and 4.3 × 10² CFU, respectively, for M. smegmatis, Mtb H37Rv. The AOP 21-based sputum test was then applied for TB diagnosis using clinical samples, and showed both high sensitivity (85.9%) and specificity (99.0%) in distinguishing TB patients from healthy donors (Fig. 8a). As compared to the clinical BACTEC MGIT 960 culture methods or auramine O (AO) bacterial staining, AOP 21 showed similar diagnostic accuracy, yet significantly reduced detection time (15 min to 2 hours), prolonged signal retention time (24 hours) and superior photostability (Fig. 8b).
Besides Rv3368c, β-lactamase (BlaC, class A β-lactamase) is an enzyme naturally expressed and secreted by Mtb. To achieve sensitive detection of BlaC, Rao's group reported AOP 22 and demonstrated their applications in the diagnosis of tuberculosis in clinical sputum specimens.12 AOP 22 was constructed based on chemically modified cephalosporins; and upon BlaC hydrolyzation, they release free umbelliferone with up to 200 fold fluorescence enhancement. This allowed for rapid detection of Mtb var. bovis strain BCG (<10 CFU) in the unprocessed human sputum within 10 minutes. The potential of AOP 22 for POCT technique was then demonstrated with a cell phone-implemented portable device, and similar detection sensitivity was observed (Fig. 8c).
An alternative approach for detecting Mtb involves targeting specific enzymes and structural components of the bacterium. On the basis of AOP 22, Rao's group further reported a dual-targeting AOP 23 that could both fluoresce upon BlaC activation and retain covalent binding towards DprE1 (involved in cell wall synthesis) to label single bacilli and signal retention.32 With dual-targeting capability, AOP 23 not only differentiated live from dead Mtb var. bovis BCG strains, but also showed specificity for Mtb over other bacterial species. AOP 23 was then applied in patients’ sputum imaging, and recognized Mtb strains in a GeneXpert (commercial DNA detection method) positive but the auramine O (stain with mycolic acids) negative sample (Fig. 8d). The authors further incorporated AOP 23 into a low-cost, self-driven microfluidic chip, and demonstrated its potential for POCT with rapid, automated quantification of live BCG in patient sputum. Similarly, Bertozzi' s group reported AOP 24, which could be catalyzed by antigen 85 (Ag85, is a complex of enzymes crucial for Mycobacterium tuberculosis and plays a vital role in cell wall synthesis) into the mycomembrane as trehalose mycolates.33 Upon incorporation, the fluorophore transitions from an aqueous to a hydrophobic environment within the mycomembrane, triggering a >700-fold increase in fluorescence. This process allows specific labeling of live Mtb without washing steps, with a LOD value of approximately 10000 CFU mL−1 in sputum. AOP 24 was then applied to detect Mtb in clinical patient samples, and showed comparable diagnostic accuracy to clinical auramine O staining yet much simpler operational protocol (Fig. 8e).
Septic arthritis is an infectious orthopaedic disease mainly caused by Staphylococcus aureus (S. aureus),97 and AOPs responsive towards S. aureus-specific enzymes have been developed for disease detection. Micrococcal nuclease is an enzyme specifically secreted by S aureus and widely used in molecular biology for chromatin studies, nucleic acid cleanup, therefore serving as a diagnostic marker for S. aureus. Van Dijl et al. reported AOP 25 (Fig. 7) which consists of a fluorophore (ATTO488) and quencher (ZEN-IAbRA) pair linked by a nuclease-cleavable oligonucleotide.34 After incubation with clinical synovial fluid (biofilm) samples, AOP 25 distinguishes S. aureus from other bacteria within 2 hours (15 min), which provides a much more rapid approach as compared to traditional culture methods (2–5 days). Thus, AOP 25 showed potential for real-time, intra-operative visualization of S. aureus infection.
 | ||
| Fig. 7 Chemical structures of AOPs 21–28 for infectious disease diagnostics in sputum (AOPs 21–24), synovial fluid (AOPs 25, 26) and urine (AOPs 27, 28). Rv3368c, nitroreductase Rv3368c; BlaC, β-lactamase; Ag85, antigen 85; Cas-1, caspase-1; ESBL/AmpC, extended-spectrum/AmpC β-lactamases. | ||
In addition, the bacterial immune escape in host cells (especially in macrophages) frequently causes ineffective antibiotic treatment effects and disease recurrence of septic arthritis.98 To achieve rapid and sensitive detection of intracellular bacteria, Song and coworkers reported an activatable fluorescent AOP 26 that triggers fluorescence signals in response to caspase-1 (Cas-1), which is a cysteine protease expressed in bacterial-infected macrophages.35 AOP 26 was constructed by conjugating FITC and gold nanoparticles (AuNPs), respectively, as energy donors and acceptors, via a Cas-1-cleavable peptide sequence. AOP 26 exhibited high detection specificity and sensitivity with a LOD of 5 S. aureus per host cell without the need for washing extracellular bacteria. AOP 26 was then applied to detect intracellular bacteria in patients’ synovial fluid samples, and its activated fluorescence signals showed a positive correlation with bacterial colony growth, demonstrating the diagnostic potential of AOP 26 (Fig. 8f).
 | ||
| Fig. 8 Infectious disease diagnostics using AOPs. (a) Comparative detection sensitivity of Rv3368c in sputum samples using AOP 21versus conventional AO staining. Pie charts show detection rates in culture-positive TB patients (n = 92) and healthy donors (n = 96). AO, auramine O. (b) Time-lapse fluorescence microscopy images of TB positive sputum samples treated with AOP 21 or AO. (c) Fluorescence imaging and (pre/after)-mapping results using a smart phone of BCG-spiked sputum samples from cystic fibrosis patients and incubated with AOP 22. (d) Comparative Mtb detection in sputum samples using GeneXpert, AO smear staining and AOP 23 staining, respectively. Patient 1 (negative in all tests); patient 5 (GeneXpert+/auramine–). (e) Quantitative comparison of Mtb cell detection efficiency between AOP 24 and commercial AO staining across 16 sputum samples. (f) Fluorescence intensity of synovial fluid samples from septic arthritis patients after AOP 26 treatment, with a red dashed line indicating a diagnostic threshold, ****p < 0.0001. Panels (a) and (b) are reproduced from ref. 31 with permission from American Chemical Society, copyright 2024. Panel (c) is reproduced from ref. 12 with permission from Springer Nature Limited, copyright 2012. Panel (d) is reproduced from ref. 32 with permission from American Association for the Advancement of Science, copyright 2018. Panel (e) is reproduced from ref. 33 with permission from American Association for the Advancement of Science, copyright 2018. Panel (f) is reproduced from ref. 35 with permission from Elsevier B.V., copyright 2024. | ||
3.4. Digestive diseases
Digestive diseases refer to disorders occurred in the gastrointestinal tract, liver, pancreas, and associated organs, and represent a significant global health burden.102 Digestive disorders can manifest in diverse forms, ranging from chronic inflammation to liver cirrhosis and even cancer. Therefore, the complex nature of these diseases necessitates accurate and timely diagnosis for effective management and prevention of complications. While current diagnostic methods such as endoscopy, imaging techniques, and clinical laboratory tests have been crucial in identifying these conditions, they often present challenges including invasiveness, high costs, professional operators, and limited sensitivity. In response to these limitations, AOP-based body fluid diagnostics offers promising advantages for digestive disease diagnosis, including minimal-invasion, rapid results, high sensitivity and specificity, visual readout, and simplified detection processing. The application of AOP-based body fluid diagnostics for digestive diseases enables more precise and personalized treatment strategies, and ultimately improving patient outcomes.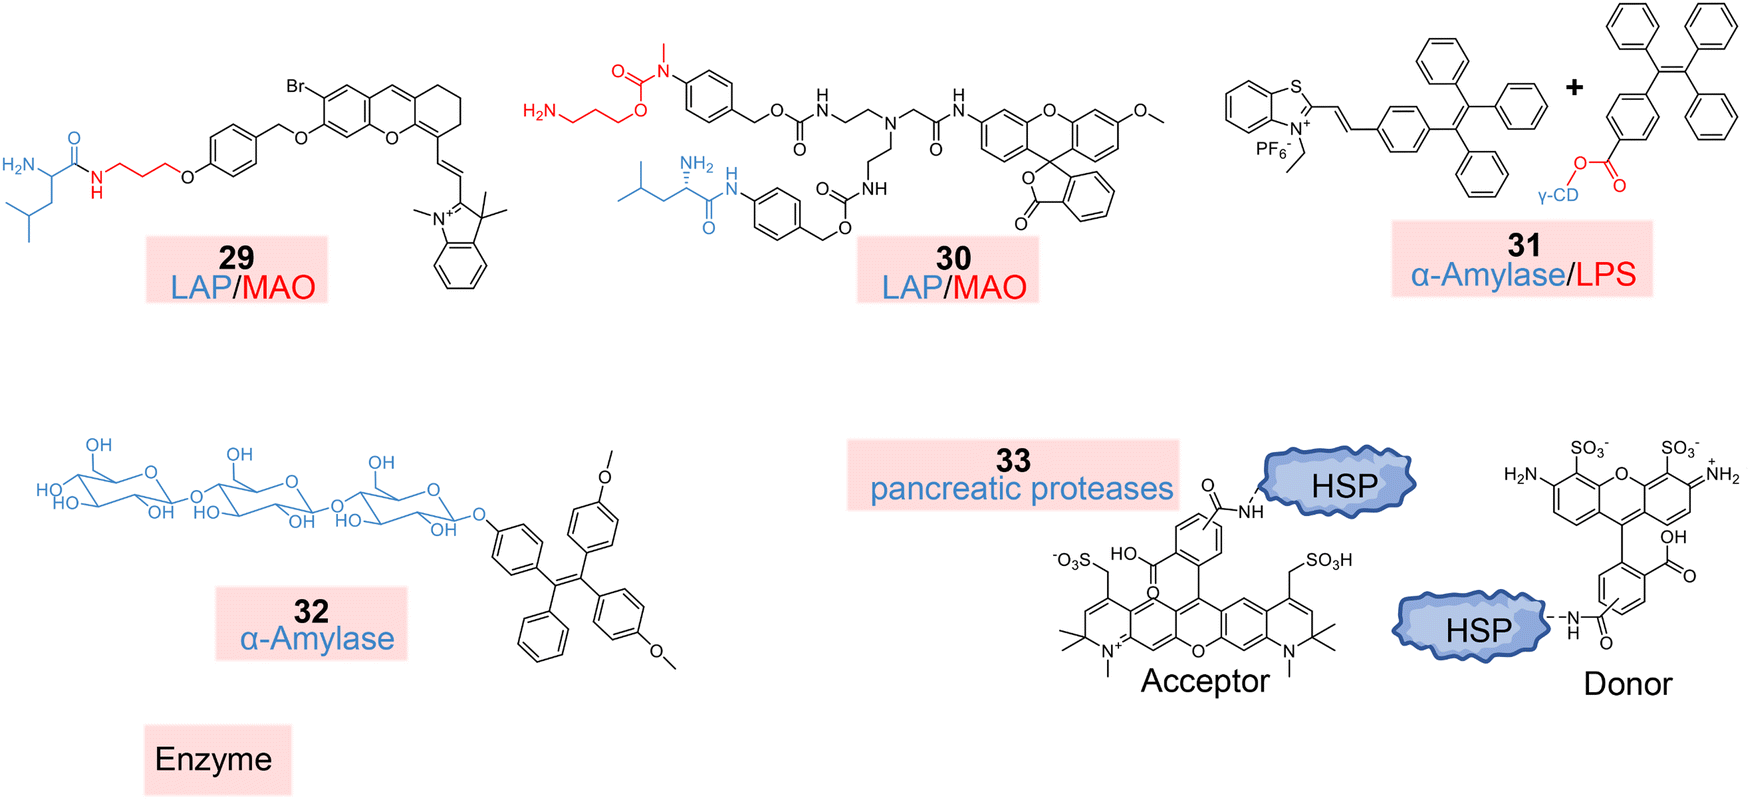 | ||
| Fig. 9 Chemical structures of AOPs 29–33 for digestive system disease diagnostics in blood (AOPs 29–32) and drainage fluid (AOP 33). LAP, leucine aminopeptidase; MAO, monoamine oxidase; LPS, lipase; HSP, heat shock protein. | ||
 | ||
| Fig. 10 Digestive disease diagnostics using AOPs. (a) Schematic workflow of hepatopathy differentiation using AOP 29-based serum testing in both mouse and human samples. (b) Comparative analysis of fluorescence intensity in human serum samples from healthy individuals, hepatitis, and cirrhosis patients using AOP 30 and compared probes. (c) Comparison of endogenous LPS and AMY activity in serum samples from healthy individuals and acute pancreatitis patients, measured by AOP 31versus the commercial kit. LPS, lipase; AMY, α-amylase. (d) Photograph and fluorescence images of drainage fluid from gastrectomy/distal pancreatectomy patients using AOP 33. Panel (a) is reproduced from ref. 37 with permission from The Royal Society of Chemistry, copyright 2019. Panel (b) is reproduced from ref. 38 with permission from The Royal Society of Chemistry, copyright 2019. Panel (c) is reproduced from ref. 39 with permission from American Chemical Society, copyright 2024. Panel (d) is reproduced from ref. 41 with permission from American Chemical Society, copyright 2016. | ||
Acute pancreatitis is an inflammatory disease caused by premature activation of digestive enzymes within the pancreas leading to autodigestion and severe inflammation and remains one of the most severe abdominal emergencies with high mortality, making early detection and appropriate therapeutic intervention critical for improving patient outcomes.104 Lipase (LPS) and α-amylase (AMY) are enzymes produced by the pancreas and elevated circulating enzyme levels in body fluids are commonly associated with pancreatic inflammation or damage. Therefore, lipase and α-amylase have become key indicators for diagnosing acute pancreatitis in clinical settings; yet rapid and sensitive detection approaches are still lacking. Tang's group presented AOPs 31 and 32 (Fig. 9) for simultaneous LPS and AMY detection and demonstrated their applications in the diagnosis of acute pancreatitis with clinical samples.39,40 AOP 31 was a supramolecular complex consisting of TPE-γ-CD and TPE-H designed to operate in a homogeneous system, enabled by the γ-CD cavity creating a micro hydrophilic–hydrophobic interface, eliminating the need for complex two-phase systems. AOP 31 exhibited dual fluorescence responses with minimal crosstalk: blue emission (460 nm) for lipase and orange emission (610 nm) for α-amylase, with excitation at 390 nm. Upon incubation with LPS/AMY, AOP 31 exhibits rapid responses and visible color changes could be observed within 25 min. The LODs were determined to be 0.11 U L−1 and 0.17 U L−1 for lipase and α-amylase, respectively. Besides, AOP 31-based clinical serum tests enable clear differentiation of acute pancreatitis patients from healthy individuals, and the results coincided with those of the commercial lipase assay kit and α-amylase assay (Fig. 10c). To further improve detection sensitivity, the same group reported an AIE-based AOP 32 to detect AMY. AOP 32 showed high detection sensitivity towards α-amylase with a LOD of 0.14 U L−1 and a response time of just 3 minutes. AOP 32 was then applied to test clinical samples (serum, urine, and saliva) for acute pancreatitis diagnosis and psychological stress analysis, and demonstrated high detection accuracy.
Pancreatic proteases (such as trypsin, chymotrypsin, elastase) are digestive enzymes produced by the pancreas that break down proteins in the small intestine. Following gastroenterological surgeries, postoperative pancreatic fistula (POPF) represents a severe complication. Elevated levels of pancreatic proteases in post-surgical drainage fluid serve as crucial indicators for early detection and risk assessment of POPF development.105 Hashizume et al. presented a novel nanoprobe AOP 33 (Fig. 9) with a heat shock protein (HSP) nanocage labeled with donor and acceptor fluorophores, which used FRET disruption upon cleavage by pancreatic proteases in the drainage fluid.41 AOP 33 possessed a rapid response time of 10 minutes, and LOD values as low as 0.003 U mL−1 for elastase, 5.00 U mL−1 for trypsin, and 0.02 U mL−1 for α-Chymotrypsin. AOP 33 demonstrated superior performance in differentiating POPF drainage fluid samples from normal samples. Its unique advantages include simultaneous detection of multiple pancreatic proteases, higher stability in blood plasma, lower toxicity, and the ability to provide visual detection visible to the naked eye under UV light (Fig. 10d). Compared to conventional methods like amylase measurements, this approach offers faster, more specific results and the potential for intraoperative visualization of pancreatic juice leakage.
3.5. Other diseases
 | ||
| Fig. 11 Chemical structures of AOPs 34–40 for other disease diagnostics in blood (AOPs 34–37), urine (AOP 38), tear (AOP 39), and cerebrospinal fluid (AOP 40). H2S, hydrogen sulfide; HClO, hypochlorous acid; His, histidine; MDA, malondialdehyde; Aβ oligomers, amyloid-beta oligomers. | ||
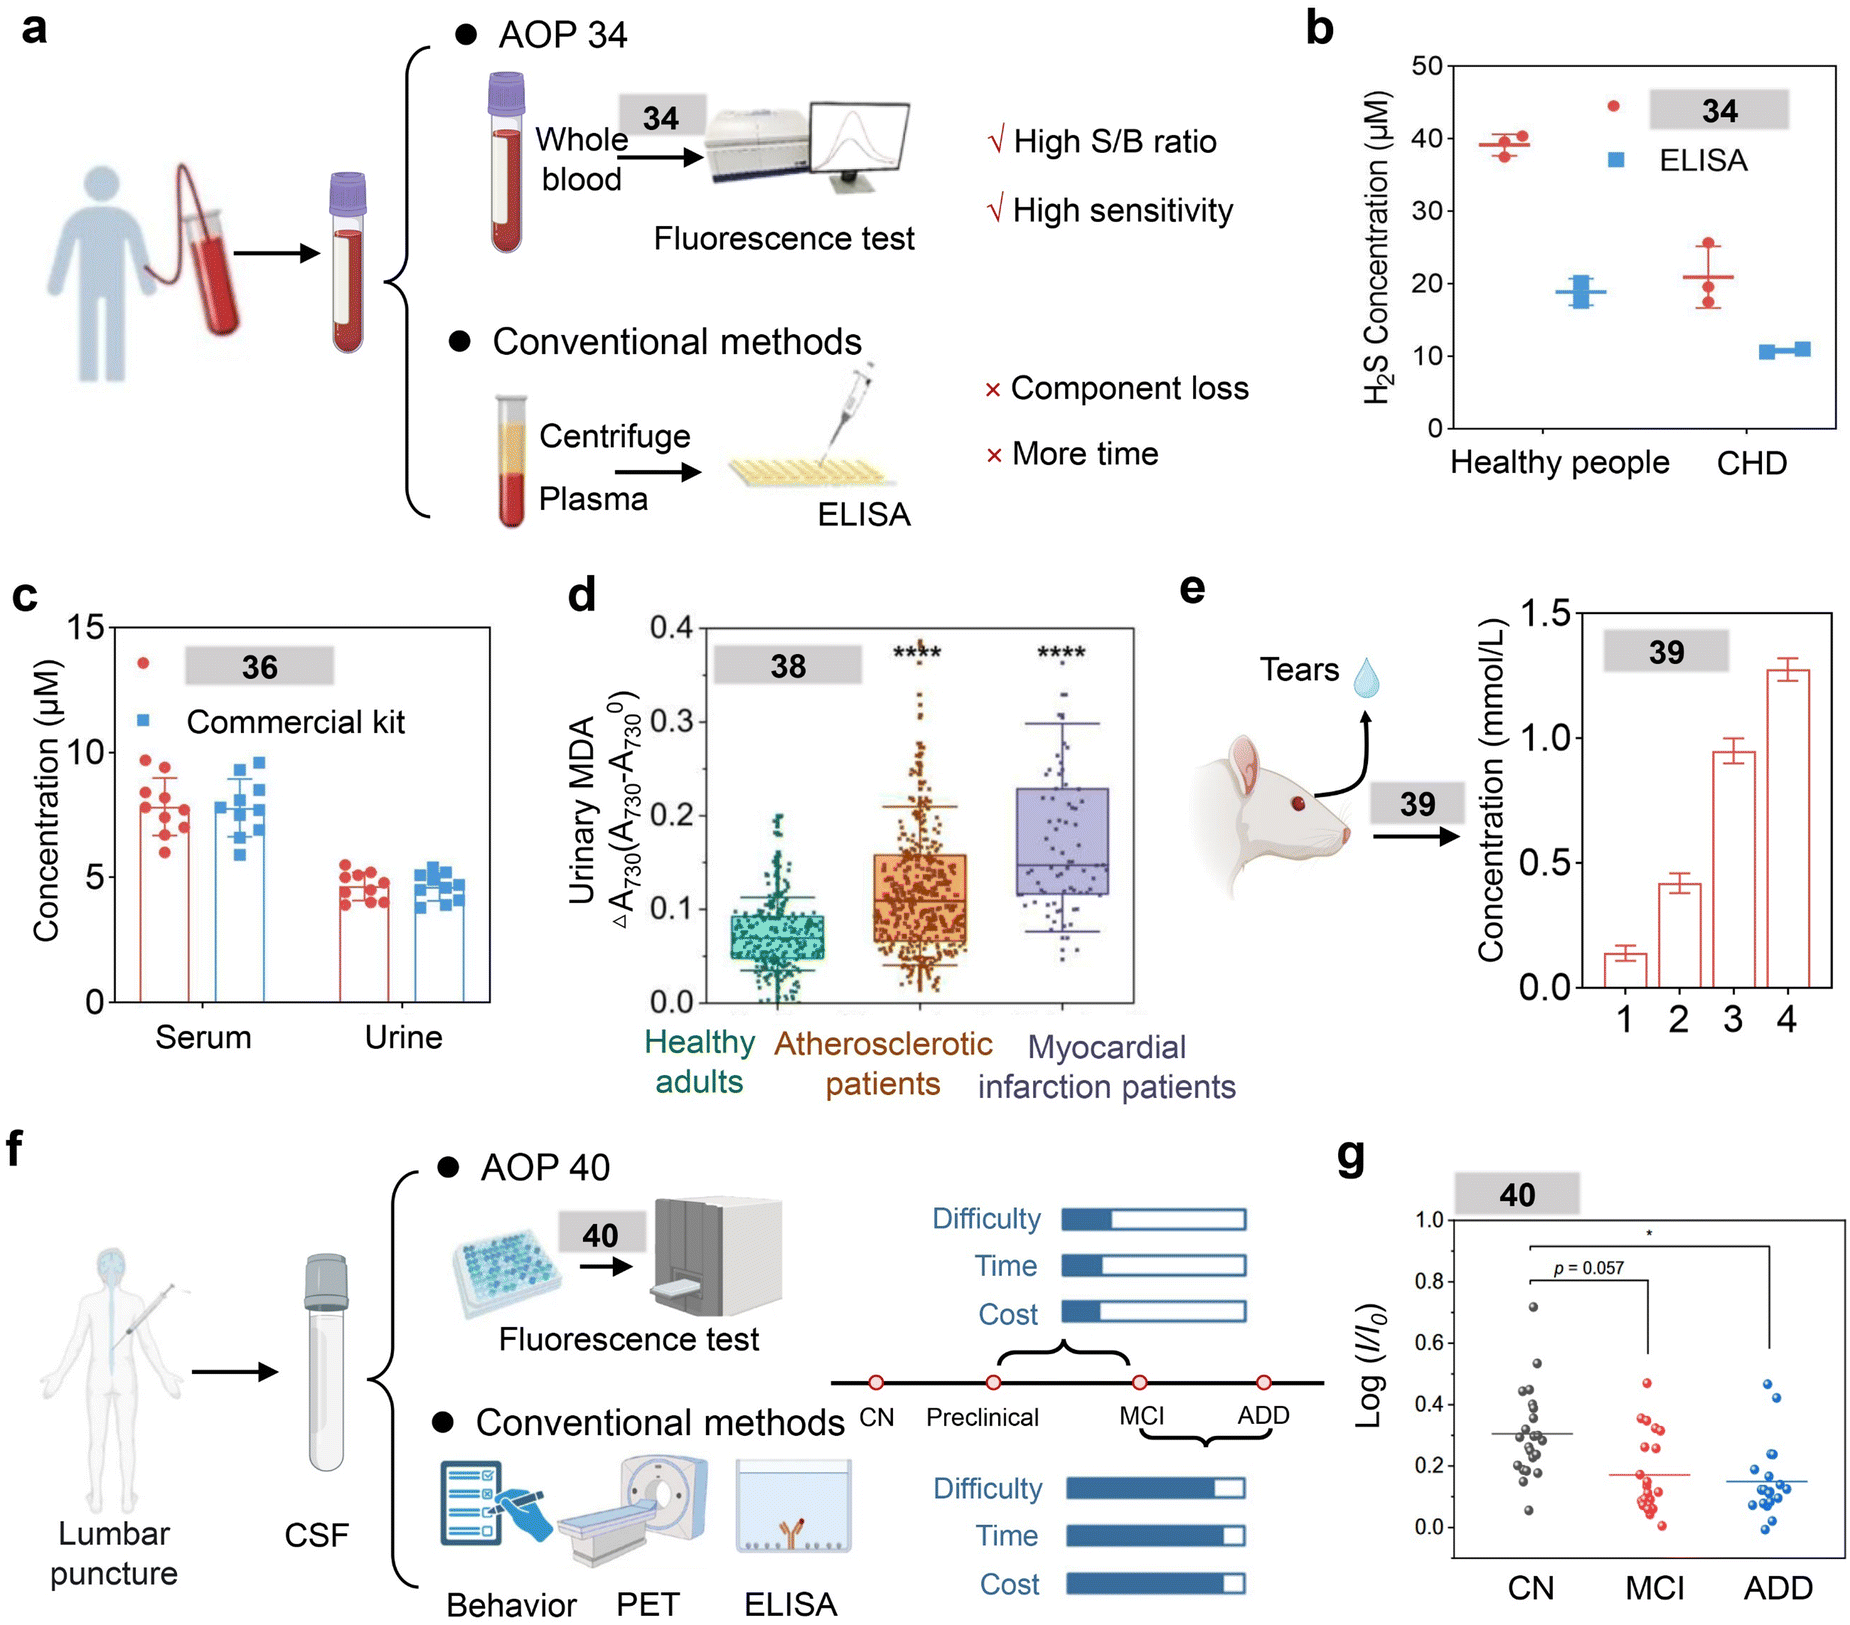 | ||
| Fig. 12 Other disease diagnostics using AOPs. (a) Workflow comparison between AOP 34-based blood analysis and the conventional ELISA method. (b) Quantitative comparison of H2S detection between AOP 34 and ELISA in healthy people and CHD patients (mean ± s.d., n = 3). CHD, coronary heart disease. (c) Comparative analysis of histidine levels in the serum and urine samples from histidinemia patients using AOP 36 versus the commercial kit. (d) Urinary MDA levels among healthy controls, atherosclerotic patients, and myocardial infarction patients using AOP 38 (****p < 0.0001, n = 265 for healthy controls, n = 374 for atherosclerotic patients, n = 76 for myocardial infarction patients). (e) Quantitative analysis of tear glucose levels in 4 individual rats using AOP 39. (f) Workflow comparison between AOP 40-based CSF analysis and conventional AD diagnostic methods (behavioral tests, PET imaging, and ELISA). (g) Fluorescence intensity ratio of CSF samples using AOP 40 across three groups: CN, n = 22, MCI, n = 21, and ADD, n = 18. CSF, cerebrospinal fluid; PET, positron emission tomography; ELISA, enzyme-linked immunosorbent assay; CN, cognitive normal; MCI, mild cognitive impairment; ADD, Alzheimer's disease dementia. *p < 0.05. Panels (a) and (b) are reproduced from ref. 42 with permission from Wiley-VCH GmbH, copyright 2023. Panel (c) is reproduced from ref. 44 with permission from Elsevier B.V., copyright 2017. Panel (d) is reproduced from ref. 46 with permission from the authors, copyright 2023. Panel (e) is reproduced from ref. 47 with permission from Elsevier B.V., copyright 2017. Panels (f) and (g) are reproduced from ref. 48 with permission from the authors, copyright 2024. | ||
Diabetes mellitus is a chronic metabolic disorder affecting millions of people worldwide.109 Early diagnosis and continuous monitoring of blood glucose levels are crucial for effective management of diabetes and preventing complications. In diabetes pathophysiology, abnormally high reactive oxygen species are produced due to the oxidative glucose phosphorylation. In particular, overexpression of hypochlorous acid (HClO) is related to vascular endothelial dysfunction, cell death, and ultimately causes diabetes development.110 He and coworkers reported AOP 35 based on an NIR fluorescent probe consisting of methylene blue and a methyl sulfonamide moiety (Fig. 11).43 AOP 35 showed a 45-fold NIR fluorescence enhancement after HClO oxidization, followed by amide bond cleavage. AOP 35 presented high detection sensitivity towards HClO with a LOD value of 0.29 μM and a rapid response time of 2 seconds. In the AOP 35-based serum test, approximately 7-fold fluorescence enhancement was observed in the diabetic patients’ serum as compared to serum from healthy controls.
Histidinemia is a rare hereditary metabolic disorder characterized by deficiency of enzyme histidase, which is necessary for the metabolism of the amino acid histidine. This condition results in elevated blood histidine levels from normal (70–120 μM) to high levels (290–1420 μM), potentially leading to developmental issues in affected children. Attia et al. introduced AOP 36 (Fig. 11), a samarium-tetracycline complex doped in the sol–gel matrix, for early diagnosis of histidinemia in newborn children.44 AOP 36 exhibits enhanced luminescence at 645 nm when histidine replaces water molecules in the coordination sphere of the Sm complex through electrostatic attraction between the positive charge of the complex and the negative charge of histidine at pH 9.2. AOP 36 exhibited high detection sensitivity and selectivity towards histidine, with a linear signal response to histidine concentrations from 1.4 × 10⁻⁵ to 6.5 × 10⁻¹⁰ mol L−1 and a LOD value of 3.2 × 10⁻¹⁰ mol L−1. AOP 36 was then applied to detect histidine in the clinical serum and urine samples of Histidinemia disease, and achieved high diagnostic sensitivity (98.88%) and specificity (97.41%) (Fig. 12c). Besides, AOP 36-based body fluid diagnostics showed consistent results with clinical standard methods. Therefore, AOP 36 presented a promising approach for the early, accurate, and convenient diagnosis of histidinemia in newborns.
Folliculitis and peritonitis represent two distinct types of inflammatory conditions – localized skin inflammation and systemic abdominal inflammation.111 Blood viscosity serves as a crucial biomarker for inflammatory conditions, as inflammation can alter blood rheological properties through changes in the plasma protein composition and cellular components.112 Lin and coworkers designed AOP 37 for detection of blood viscosity, combining Nile red as the acceptor and tetraphenylethylene (TPE) as the donor based on TBET (Fig. 11).45 AOP 37 showed ratiometric responses (460 nm/675 nm) with enhanced viscosity, with a 231-fold increase in fluorescence intensity ratio (I460/I675) over a wide viscosity range (1.40 to 953 cp). In preclinical blood samples of folliculitis and peritonitis mouse models, AOP 37 successfully detected increased blood viscosity (1.51-fold in folliculitis and 1.21–1.27-fold in peritonitis) with minimal sample requirement (10 μL blood).
4. Summary and outlook
The past decade has witnessed the development of AOP-based body fluid diagnostics in both preclinical and clinical applications. With high detection sensitivity and specificity towards biomarkers-of-interest, AOP-based body fluid diagnostics could detect biomarkers at extreme low concentrations in the intricate body fluid (for example, AOP 30 achieved LOD values of 0.249 and 0.877 U L−1 for MAO and LAP, respectively) and, therefore, diagnose diseases at an early stage. Additionally, with high detection sensitivity, AOP-based body fluid diagnostics only require minimal sample volumes, as demonstrated by AOP 39 that could detect glucose in just 2 μL of tear fluids, making them particularly valuable in analyses of precious or hard-to-obtain fluids like the cerebrospinal fluid. Besides, by virtue of the direct, quick chemical response of AOP towards biomarkers, AOP-based body fluid diagnostics typically requires short measurement times with systems like AOP 22 capable of recognizing BlaC within 10 min and eliminates the need for complicated instrumentations and well-trained technicians. Together, these properties endow AOPs a valuable tool for primary healthcare providers and even patients at home in the POCT settings.Despite the significant progress achieved, AOP-based body fluid diagnostics still faces challenges in both limited molecular design approaches and applications. Firstly, most AOPs are designed for single biomarker detection, yet simultaneous detection of multiple biomarkers is typically required for accurate and comprehensive disease assessments. Multiplex detection with several AOPs requires careful molecular designs to avoid optical signal crosstalk. However, only limited multi-lock AOPs, which allow simultaneous detection of multiple biomarkers (for example, AOPs 29, 30 and 31), have been reported for body fluid diagnostics. Secondly, the complex compositions in body fluids, such as red blood cells, proteins, and electrolytes, can interfere with signal readouts and pose challenges on the optical properties of AOPs. To resolve this issue, AOP 34 has been developed based on a BODIPY dye that quenches blood autofluorescence through an inner filter effect, and detected the presence of H2S in blood with a LOD value of 28.0 nM. However, novel approaches to reduce the background signal interference from body fluids are still lacking. Thirdly, from the application perspective, the optical signal stability and degradation behaviors of AOPs remain undiscovered, which could potentially compromise the stability and reliability of AOP-based body fluid diagnostics. Moreover, it is necessary to expand the application of AOPs to more body fluids to assist clinical diagnosis and treatment evaluation. Different body fluids achieve diagnostic needs for various diseases. For instance, the lymphatic fluid is crucial for monitoring cancer metastasis and immune responses, the peritoneal fluid provides insights into abdominal pathologies, and the amniotic fluid offers critical information for prenatal diagnostics.
To tackle these challenges, the AOP design and detection methodologies could be potentially improved in the following directions. Firstly, AOPs responsive towards multiple biomarkers could be developed to improve the disease diagnostic accuracy. This relies on careful biomarker selection through integrated multi-omics technologies and designing sophisticated responsive optical signal transitions with cost-effective synthesis strategies. Secondly, AOP-based body fluid diagnostics could be incorporated into high-throughput detection systems (for example, microfluidic techniques) to achieve rapid and parallel sample processing. With the advantages of simple operations and direct signal readouts, AOP-based body fluid diagnostics could also be incorporated into POCT or wearable devices. Furthermore, the integration of artificial intelligence (AI) into AOP design in body fluid diagnostics offers optimization approaches beyond traditional empirical methods. AI-driven virtual screening efficiently identifies promising molecular candidates from chemical libraries, while machine learning models analyze structure–activity relationships to guide rational probe design, optimizing sensitivity, selectivity, and activation efficiency. Advanced AI algorithms can simultaneously balance multiple performance metrics, including fluorescence intensity, stability, biocompatibility, and even simulate the pathophysiologic conditions especially for the hard-to-obtain body fluid samples. Moreover, by integrating multi-omics data, AI can guide the design of multi-responsive AOPs with minimal signal crosstalk. This interdisciplinary collaboration among computational scientists, chemists, biologists, and clinical researchers, leading to robust high-quality databases and advanced model training systems, accelerates the development of next-generation AOPs for body fluid diagnostics.
Glossary
| AAP | Alanine aminopeptidase |
| Aβ | Amyloid-β |
| AD | Alzheimer's disease |
| Ag85 | Antigen 85 |
| AIE | Aggregation-induced emission |
| ALB | Albumin |
| AMY | α-Amylase |
| AO | Auramine O |
| AOPs | Activatable optical probes |
| APN | Aminopeptidase N |
| BlaC | β-Lactamase |
| BUN | Blood urea nitrogen |
| Cas-1 | Caspase-1 |
| CHD | Coronary heart disease |
| CLIA | Chemiluminescence immunoassay |
| CSF | Cerebrospinal fluid |
| CTCs | Circulating tumor cells |
| Cys | Cysteine |
| DIKI | Drug-induced kidney injury |
| dPCR | Digital polymerase chain reaction |
| DPP-IV | Dipeptidyl peptidase-IV |
| ELISA | Enzyme-linked immunosorbent assay |
| ESBL/AmpC | Extended-spectrum/AmpC β-lactamases |
| FRET | Förster resonance energy transfer |
| GBM | Glioblastoma |
| GC-MS | Gas chromatography–mass spectrometry |
| GFR | Glomerular filtration rate |
| GGT | γ-Glutamyl transpeptidase |
| HCLO | Hypochlorous acid |
| Hcy | Homocysteine |
| His | Histidine |
| H2O2 | Hydrogen peroxide |
| H2S | Hydrogen sulfide |
| HSA | Human serum albumin |
| HSP | Heat shock protein |
| ICT | Intramolecular charge transfer |
| IVD | In vitro diagnostics |
| LAP | Leucine aminopeptidase |
| LOD | Limit-of-detection |
| LPS | Lipase |
| mALB | Microalbumin |
| MAO | Monoamine oxidase |
| MDA | Malondialdehyde |
| MG | Malachite green |
| Mtb | Mycobacterium tuberculosis |
| NAG | N-acetyl-beta-d-glucosaminidase |
| NO | Nitric oxide |
| NR | Not reported |
| NSET | Nanomaterials-based surface energy transfer |
| PET | Photoinduced electron transfer |
| PCR | Polymerase chain reaction |
| POC | Point-of-care |
| POCT | Point-of-care testing |
| POPF | Postoperative pancreatic fistula |
| QDs | Quantum dots |
| qPCR | Quantitative real-time polymerase chain reaction |
| ROC | Receiver operating characteristic |
| RT-PCR | Reverse transcription–polymerase chain reaction |
| Rv3368c | Nitroreductase Rv3368c |
| S. aureus | Staphylococcus aureus |
| SBRs | Signal-to-background ratios |
| SCr | Serum creatinine |
| sLeX | Sialyl Lewis X |
| TBET | Through bond energy transfer |
| TICT | Twisted intramolecular charge transfer |
| TPE | Tetraphenylethylene |
| UA | Uric acid |
Data availability
No primary research results, software or code have been included and no new data were generated or analysed as part of this review.Conflicts of interest
The authors declare no conflicts of interest.Acknowledgements
J. Z. thanks the National Natural Science Foundation of China (32101058), the Guangdong Basic and Applied Basic Research Foundation (2023A1515012734), and the Outstanding Youths Development Scheme of Nanfang Hospital, Southern Medical University (2023J006); L. Z. thanks the National Science Fund for Distinguished Young Scholars (82025024); K. P. thanks the Singapore National Research Foundation (NRF) (NRF-NRFI07-2021-0005), and the Singapore Ministry of Education, Academic Research Fund Tier 2 (MOE-T2EP30220-0010; MOE-T2EP30221-0004) for the financial support.References
- E. Cooke, Presented in part at the Selection And Use Of Essential In Vitro Diagnostics: Report Of the Second Meeting Of the Who Strategic Advisory Group Of Experts on In Vitro Diagnostics, 2019 (Including the Second Who Model List Of Essential In Vitro Diagnostics), 2019.
- J. Heikenfeld, A. Jajack, B. Feldman, S. W. Granger, S. Gaitonde, G. Begtrup and B. A. Katchman, Nat. Biotechnol., 2019, 37, 407–419 CrossRef CAS PubMed.
- K. J. Land, D. I. Boeras, X. S. Chen, A. R. Ramsay and R. W. Peeling, Nat. Microbiol., 2019, 4, 46–54 CrossRef CAS PubMed.
- N. S. I. S. Team, Regulatory Knowledge Guide for In Vitro Diagnostics, 2023 Search PubMed.
- A. Barhoum, Z. Altintas, K. S. S. Devi and R. J. Förster, Nano Today, 2023, 50, 101874 CrossRef.
- M. Clarke and M. Marzinke, Contemporary Practice in Clinical Chemistry, 2020 Search PubMed.
- P. H. Cheng and K. Y. Pu, Chem. Soc. Rev., 2024, 53, 10171–10188 RSC.
- L. L. Wu, J. G. Huang, K. Y. Pu and T. D. James, Nat. Rev. Chem., 2021, 5, 406–421 CrossRef CAS PubMed.
- X. Wu, R. Wang, N. Kwon, H. Ma and J. Yoon, Chem. Soc. Rev., 2022, 51, 450–463 RSC.
- R. R. Nair, J. M. An, J. Kim and D. Kim, Coord. Chem. Rev., 2023, 494, 215336 CrossRef CAS.
- C. Xu and K. Y. Pu, Nat. Rev. Bioeng., 2024, 2, 425–441 CrossRef CAS.
- H. X. Xie, J. Mire, Y. Kong, M. Chang, H. A. Hassounah, C. N. Thornton, J. C. Sacchettini, J. D. Cirillo and J. H. Rao, Nat. Chem., 2012, 4, 802–809 CrossRef CAS PubMed.
- Z. Zhu, X. Chen, H. Liao, L. Li, H. Yang, Q. Wang and W. H. Zhu, Aggregate, 2024, 5, e526 CrossRef CAS.
- J. Ou-Yang, Y. Li, W. L. Jiang, S. Y. He, H. W. Liu and C. Y. Li, Anal. Chem., 2019, 91, 1056–1063 CrossRef CAS PubMed.
- S. Li, R. Hu, C. Yang, X. Zhang, Y. Zeng, S. Wang, X. Guo, Y. Li, X. Cai, S. Li, C. Han and G. Yang, Biosens. Bioelectron., 2017, 98, 325–329 CrossRef CAS PubMed.
- Y. Kim, J. M. An, J. Kim, T. Chowdhury, H. J. Yu, K. M. Kim, H. Kang, C. K. Park, J. F. Joung, S. Park and D. Kim, Anal. Chim. Acta, 2022, 1202, 339678 CrossRef CAS PubMed.
- C. Li, R. Pan, P. Li, Q. Guan, J. Ao, K. Wang, L. Xu, X. Liang, X. Jin, C. Zhang and X. Zhu, Anal. Chem., 2017, 89, 5966–5975 CrossRef CAS PubMed.
- J. Huang, Y. Jiang, J. Li, S. He, J. Huang and K. Pu, Angew. Chem., Int. Ed., 2020, 59, 4415–4420 CrossRef CAS PubMed.
- J. M. An, J. Suh, J. Kim, Y. Kim, J. Y. Chung, H. S. Kim, S. Y. Cho, J. H. Ku, C. Kwak, H. H. Kim, C. W. Jeong and D. Kim, Sens. Actuators, B, 2022, 360, 131646 CrossRef CAS.
- J. M. An, M. Jeong, J. Jung, S. G. Yeo, S. Park and D. Kim, ACS Appl. Mater. Interfaces, 2024, 16, 4493–4504 CrossRef CAS PubMed.
- C. Wang, X. Wang, J. Lu, D. Wei, N. Zhou, Y. Li, Y. Wang and H. Z. He, Sens. Actuators, B, 2023, 392, 134040 CrossRef CAS.
- S. Jiao, S. Yang, Y. Y. Wang and A. Ma, Sens. Actuators, B, 2023, 374, 132790 CrossRef CAS.
- J. Jongkhumkrong, I. Thaveesangsakulthai, W. Sukbangnop, C. Kulsing, T. Sooksimuang, C. Aonbangkhen, S. Sahasithiwat, T. Sriprasart, T. Palaga, N. Chantaravisoot and B. Tomapatanaget, ACS Appl. Mater. Interfaces, 2022, 14, 49495–49507 CrossRef CAS PubMed.
- J. Huang, J. Li, Y. Lyu, Q. Miao and K. Pu, Nat. Mater., 2019, 18, 1133–1143 CrossRef CAS PubMed.
- P. Cheng, Q. Miao, J. Huang, J. Li and K. Pu, Anal. Chem., 2020, 92, 6166–6172 CrossRef CAS PubMed.
- K. Yamada, T. Takata, T. Iyama, S. Hamada, Y. Mae, T. Sugihara and H. Isomoto, Int. J. Mol. Sci., 2022, 23, 8150 CrossRef CAS PubMed.
- S. Sarkar, A. Shil, Y. L. Jung, S. Singha and K. H. Ahn, ACS Sens., 2022, 7, 3790–3799 CrossRef CAS PubMed.
- H. Wang, J. Wang, G. Ma, J. Zhou, L. Du, H. Wu, X. Zhang, Y. He and J. Zhou, Chem. Eng. J., 2023, 464, 142551 CrossRef CAS.
- Y. Tu, Y. Yu, Z. Zhou, S. Xie, B. Yao, S. Guan, B. Situ, Y. Liu, R. T. K. Kwok, J. W. Y. Lam, S. Chen, X. Huang, Z. Zeng and B. Z. Tang, ACS Appl. Mater. Interfaces, 2019, 11, 29619–29629 CrossRef CAS PubMed.
- H. Xu, G. Shen, C. Peng, X. Han, L. Duan and T. Cheng, Dyes Pigm., 2022, 197, 109915 CrossRef CAS.
- X. Hong, P. Geng, N. Tian, X. Li, M. Gao, L. Nie, Z. Sun and G. Liu, Anal. Chem., 2024, 96, 1576–1586 CrossRef CAS PubMed.
- Y. F. Cheng, J. H. Xie, K. H. Lee, R. L. Gaur, A. G. Song, T. T. Dai, H. J. Ren, J. N. Wu, Z. G. Sun, N. Banaei, D. Akin and J. H. Rao, Sci. Transl. Med., 2018, eaar4470 CrossRef PubMed.
- M. Kamariza, P. Shieh, C. S. Ealand, J. S. Peters, B. Chu, F. P. Frances, P. Rodriguez-Rivera, M. R. B. Sait, W. V. Treuren, N. Martinson, R. Kalscheuer, B. D. Kana and C. R. Bertozzi, Sci. Transl. Med., 2018, 10, eaam6310 CrossRef PubMed.
- J. W. A. Schoenmakers, M. Lopez-Alvarez, I. J. FFA, M. Wouthuyzen-Bakker, J. O. McNamara, 2nd, M. van Oosten, P. C. Jutte and J. M. van Dijl, Eur. J. Nucl. Med. Mol. Imaging, 2024, 51, 2988–2997 CrossRef CAS PubMed.
- Y. Yang, M. Wu, Y. Zhang, L. Wang, Y. Song, H. Xiao and E. Song, Chem. Eng. J., 2024, 485, 149539 CrossRef CAS.
- G. Liu, W. Li, S. Li, J. Xu, X. Wang, H. Xu, D. Liu and H. Gao, Biosens. Bioelectron., 2024, 257, 116300 CrossRef CAS PubMed.
- Y. Liu, L. Teng, C. Xu, H. W. Liu, S. Xu, H. Guo, L. Yuan and X. B. Zhang, Chem. Sci., 2019, 10, 10931–10936 RSC.
- M. Chen, C. Wang, Z. Ding, H. Wang, Y. Wang and Z. Liu, ACS Cent. Sci., 2022, 8, 837–844 CrossRef CAS PubMed.
- J. Shi, Q. Deng, Y. Li, Z. Zheng, H. Shangguan, L. Li, F. Huang and B. Tang, Chem. Commun., 2019, 55, 6417–6420 RSC.
- J. Shi, Q. Deng, Y. Li, M. Zheng, Z. Chai, C. Wan, Z. Zheng, L. Li, F. Huang and B. Tang, Anal. Chem., 2018, 90, 13775–13782 CrossRef CAS PubMed.
- N. Hamano, M. Murata, T. Kawano, J. S. Piao, S. Narahara, R. Nakata, T. Akahoshi, T. Ikeda and M. Hashizume, ACS Appl. Mater. Interfaces, 2016, 8, 5114–5123 CrossRef CAS PubMed.
- Z. Yuwen, Q. Zeng, Q. Ye, Y. Zhao, J. Zhu, K. Chen, H. Liu and R. Yang, Angew. Chem. Int. Ed., 2023, 62, e202302957 CrossRef CAS PubMed.
- S. Li, K. Yang, Y. Liu, P. Wang, D. Cheng and L. He, Sens. Actuators, B, 2023, 379, 133253 CrossRef CAS.
- M. S. Attia, Biosens. Bioelectron., 2017, 94, 81–86 CrossRef CAS PubMed.
- O. Raitakari, K. Pahkala and C. G. Magnussen, Nat. Rev. Cardiol., 2022, 19, 543–554 CrossRef PubMed.
- Y. Ma, W. Sun, Z. F. Ye, L. H. Liu, M. H. Li, J. H. Shang, X. Y. Xu, H. Cao, L. Xu, Y. C. Liu, X. Q. Kong, G. S. Song and X. B. Zhang, Sci. Adv., 2023, 9, eadh1037 CrossRef CAS PubMed.
- L. Chen, W. H. Tse, Y. Chen, M. W. McDonald, J. Melling and J. Zhang, Biosens. Bioelectron., 2017, 91, 393–399 CrossRef CAS PubMed.
- J. An, K. Kim, H. J. Lim, H. Y. Kim, J. Shin, I. Park, I. Cho, H. Y. Kim, S. Kim, C. McLean, K. Y. Choi, Y. Kim, K. H. Lee and J. S. Kim, Nat. Commun., 2024, 15, 1004 CrossRef CAS PubMed.
- C. Li, S. Zhou, J. Chen and X. Jiang, Chem. Biomed. Imaging, 2023, 1, 495–508 CrossRef CAS PubMed.
- S. Y. Liu, A. M. Yan, W. Y. Guo, Y. Y. Fang, Q. J. Dong, R. R. Li, S. N. Ni, Y. Sun, W. C. Yang and G. F. Yang, ACS Nano, 2020, 14, 4244–4254 CrossRef CAS PubMed.
- R. Vankayala and K. C. Hwang, Adv. Mater., 2018, 30, e1706320 CrossRef PubMed.
- J. Kramer, R. Kang, L. M. Grimm, L. De Cola, P. Picchetti and F. Biedermann, Chem. Rev., 2022, 122, 3459–3636 CrossRef PubMed.
- D. Liang, Y. Wang and K. Qian, Interdiscip. Med., 2023, 1, e20230020 CrossRef.
- Q. Wang, S. Yang, F. Li and D. Ling, Interdiscip. Med., 2023, 1, e20220004 CrossRef.
- S. Lee, E. Kim, C. E. Moon, C. Park, J. W. Lim, M. Baek, M. K. Shin, J. Ki, H. Cho, Y. W. Ji and S. Haam, Nat. Commun., 2023, 14, 8153 CrossRef CAS PubMed.
- Y. X. Hu, J. Yu, M. K. Xu and K. Y. Pu, J. Am. Chem. Soc., 2024, 146, 12656–12663 CrossRef CAS PubMed.
- C. R. Hoopes, F. J. Garcia, A. M. Sarkar, N. J. Kuehl, D. T. Barkan, N. L. Collins, G. E. Meister, T. R. Bramhall, C. H. Hsu, M. D. Jones, M. Schirle and M. T. Taylor, J. Am. Chem. Soc., 2022, 144, 6227–6236 CrossRef CAS PubMed.
- J. Ouyang, L. H. Sun, F. Zeng and S. Z. Wu, Coord. Chem. Rev., 2022, 458, 214438 CrossRef CAS.
- Z. R. Zhu, Q. Wang, X. Y. Chen, Q. Wang, C. X. Yan, X. L. Zhao, W. J. Zhao and W. H. Zhu, Adv. Mater., 2022, 34, 2107444 CrossRef CAS PubMed.
- C. Yan, Z. Zhu, Y. Yao, Q. Wang, Z. Guo and W.-H. Zhu, Acc. Mater. Res., 2024, 5, 64–75 CrossRef CAS.
- A. R. Sekhar, Y. Chitose, J. Janos, S. I. Dangoor, A. Ramundo, R. Satchi-Fainaro, P. Slavícek, P. Klan and R. Weinstain, Nat. Commun., 2022, 13, 3614 CrossRef CAS PubMed.
- B. H. Li, H. K. Liu, Y. L. He, M. Y. Zhao, C. Ge, M. R. Younis, P. Huang, X. Y. Chen and J. Lin, Angew. Chem., Int. Ed., 2022, 61, e202200025 CrossRef CAS PubMed.
- B. Valeur and M. N. Berberan-Santos, Molecular Fluorescence: Principles and Applications, 2012 Search PubMed.
- E. A. Jares-Erijman and T. M. Jovin, Nat. Biotechnol., 2003, 21, 1387–1395 CrossRef CAS PubMed.
- Y. Hong, J. W. Y. Lam and B. Z. Tang, Chem. Soc. Rev., 2011, 40, 5361–5388 RSC.
- R. L. Siegel, A. N. Giaquinto and A. Jemal, Ca-Cancer J. Clin., 2024, 74, 203 CrossRef PubMed.
- S. N. Lone, S. Nisar, T. Masoodi, M. Singh, A. Rizwan, S. Hashem, W. El-Rifai, D. Bedognetti, S. K. Batra, M. Haris, A. A. Bhat and M. A. Macha, Mol. Cancer, 2022, 21, 79 CrossRef CAS PubMed.
- B. L. Wang, S. Q. Hu, Y. Teng, J. L. Chen, H. Y. Wang, Y. Z. Xu, K. Y. Wang, J. G. Xu, Y. Z. Cheng and X. Gao, Signal Transduction Targeted Ther., 2024, 9, 200 CrossRef PubMed.
- M. Touray and A. Touray, Clinical Work and General Management of a Standard Minimal-Resource Facility, 2021 Search PubMed.
- Y. Zhou, L. Tao, J. H. Qiu, J. Xu, X. Y. Yang, Y. Zhang, X. Y. Tian, X. Q. Guan, X. B. Cen and Y. L. Zhao, Signal Transduction Targeted Ther., 2024, 9, 132 CrossRef PubMed.
- L. W. Ma, H. L. Guo, Y. X. Zhao, Z. B. Liu, C. R. Wang, J. H. Bu, T. Sun and J. W. Wei, Signal Transduction Targeted Ther., 2024, 9, 336 CrossRef PubMed.
- H. Yan, H. Ma, B. He, B. Yu, Y. Q. Shen and H. L. Cong, Nano Res., 2023, 16, 7075–7084 CrossRef.
- C. Grimm, G. Hofstetter, S. Aust, I. Mutz-Dehbalaie, M. Bruch, G. Heinze, J. Rahhal-Schupp, A. Reinthaller, N. Concin and S. Polterauer, Br. J. Cancer, 2013, 109, 610–614 CrossRef CAS PubMed.
- J. Lin, I. M. Lee, Y. Q. Song, N. R. Cook, J. Selhub, J. E. Manson, J. E. Buring and S. M. Zhang, Cancer Res., 2010, 70, 2397–2405 CrossRef CAS PubMed.
- M. Maas, T. Todenhöfer and P. C. Black, Nat. Rev. Urol., 2023, 20, 597–614 CrossRef PubMed.
- L. Guzman-Rojas, R. Rangel, A. Salameh, J. K. Edwards, E. Dondossola, Y. G. Kim, A. Saghatelian, R. J. Giordano, M. G. Kolonin, F. I. Staquicini, E. Koivunen, R. L. Sidman, W. Arap and R. Pasqualini, Proc. Natl. Acad. Sci. U. S. A., 2012, 109, 1637–1642 CrossRef CAS PubMed.
- T. W. Rockett, M. Almahyawi, M. L. Ghimire, A. Jonnalagadda, V. Tagliaferro, S. J. Seashols-Williams, M. F. Bertino, G. A. Caputo and J. E. Reiner, ACS Sens., 2024, 9, 860–869 CrossRef CAS PubMed.
- S. R. Barthel, G. K. Wiese, J. H. Cho, M. J. Opperman, D. L. Hays, J. Siddiqui, K. J. Pienta, B. Furie and C. J. Dimitroff, Proc. Natl. Acad. Sci. U. S. A., 2009, 106, 19491–19496 CrossRef CAS PubMed.
- Y. Zhang, J. Sun, C. C. Lin, E. Abemayor, M. B. Wang and D. T. W. Wong, Periodontology 2000, 2016, 70, 38–52 CrossRef PubMed.
- M. Arif, B. M. Vedamurthy, R. Choudhari, Y. B. Ostwal, K. Mantelingu, G. S. Kodaganur and T. K. Kundu, Chem. Biol., 2010, 17, 903–913 CrossRef CAS PubMed.
- W. T. Liu, Y. P. Cao, X. H. Zhou and D. Han, Adv. Sci., 2022, 9, 2100617 CrossRef PubMed.
- M. Friedel, I. A. P. Thompson, G. Kasting, R. Polsky, D. Cunningham, H. T. Soh and J. Heikenfeld, Nat. Biomed. Eng., 2023, 7, 1541–1555 CrossRef PubMed.
- M. Hakim, Y. Y. Broza, O. Barash, N. Peled, M. Phillips, A. Amann and H. Haick, Chem. Rev., 2012, 112, 5949–5966 CrossRef CAS PubMed.
- A. B. Sanz, M. D. Sanchez-Nino, A. M. Ramos and A. Ortiz, Nat. Rev. Nephrol., 2023, 19, 281–299 CrossRef CAS PubMed.
- S. L. Wood, M. A. Knowles, D. Thompson, P. J. Selby and R. E. Banks, Nat. Rev. Urol., 2013, 10, 206–218 CrossRef CAS PubMed.
- B. Thomas and D. Tolley, Nat. Clin. Pract. Urol., 2008, 5, 668–675 CrossRef PubMed.
- M. A. Bjurlin and R. S. Matulewicz, Comprehensive Diagnostic Approach to Bladder Cancer, Molecular Imaging and Biomarkers, 2021 Search PubMed.
- M. Sitara, W. Zhang, H. Gao, J. Li and J. Tian, Chem. Biomed. Imaging, 2024, 2, 526–541 CrossRef CAS PubMed.
- V. S. Vaidya, J. S. Ozer, F. Dieterle, F. B. Collings, V. Ramirez, S. Troth, N. Muniappa, D. Thudium, D. Gerhold, D. J. Holder, N. A. Bobadilla, E. Marrer, E. Perentes, A. Cordier, J. Vonderscher, G. Maurer, P. L. Goering, F. D. Sistare and J. V. Bonventre, Nat. Biotechnol., 2010, 28, 478–485 CrossRef CAS PubMed.
- E. E. Mulvihill and D. J. Drucker, Endocr. Rev., 2014, 35, 992–1019 CrossRef CAS PubMed.
- J. H. Suh and J. H. Miner, Nat. Rev. Nephrol., 2013, 9, 470–477 CrossRef CAS PubMed.
- R. E. Baker, A. S. Mahmud, I. F. Miller, M. Rajeev, F. Rasambainarivo, B. L. Rice, S. Takahashi, A. J. Tatem, C. E. Wagner, L. F. Wang, A. Wesolowski and C. J. E. Metcalf, Nat. Rev. Microbiol., 2022, 20, 193–205 CrossRef CAS PubMed.
- A. M. Caliendo, D. N. Gilbert, C. C. Ginocchio, K. E. Hanson, L. May and T. C. Quinn, Clin. Infect. Dis., 2014, 58, 1346 CrossRef.
- W. O. C. M. Cookson, M. J. Cox and M. F. Moffatt, Nat. Rev. Microbiol., 2018, 16, 111–120 CrossRef CAS PubMed.
- J. B. Humbwavali, N. J. Trujillo, B. S. Paim, F. H. Wolff and N. T. Barcellos, Lancet Infect. Dis., 2011, 11, 160 CrossRef PubMed.
- V. Dartois and T. Dick, Nat. Rev. Drug Discovery, 2024, 23, 381–403 CrossRef CAS PubMed.
- D. L. Goldenberg, Lancet, 1998, 351, 197–202 CrossRef CAS PubMed.
- H. K. Kwon, I. Lee, K. E. Yu, S. V. Cahill, K. D. Alder, S. Lee, C. M. Dussik, J. Back, J. Choi, L. Song, T. R. Kyriakides and F. Y. Lee, Sci. Adv., 2021, 7, eabf2665 CrossRef CAS PubMed.
- E. Y. H. Xin, G. Kwek, X. An, C. Sun, S. Liu, N. S. Qing, S. Lingesh, L. Jiang, G. Liu and B. Xing, Angew. Chem., Int. Ed., 2024, 63, e202406843 CrossRef CAS PubMed.
- W. C. Albrich, C. R. Kahlert, S. Nigg, L. F. Boesel and G. Giovannini, Anal. Chem., 2024, 96, 20578–20586 CrossRef CAS PubMed.
- L. Mendive-Tapia, D. Mendive-Tapia, C. Zhao, D. Gordon, S. Benson, M. J. Bromley, W. Wang, J. Wu, A. Kopp, L. Ackermann and M. Vendrell, Angew. Chem., Int. Ed., 2022, 61, e202117218 CrossRef CAS PubMed.
- Y. C. Wang, Y. T. Huang, R. C. Chase, T. Li, D. Ramai, S. Li, X. Q. Huang, S. O. Antwi, A. P. Keaveny and M. Y. Pang, Gastroenterology, 2023, 165, 773–783 CrossRef PubMed.
- S. D. Melton, R. M. Genta and R. F. Souza, Nat. Rev. Gastroenterol. Hepatol., 2010, 7, 620–628 CrossRef CAS PubMed.
- M. S. Petrov and D. Yadav, Nat. Rev. Gastroenterol. Hepatol., 2019, 16, 175–184 CrossRef PubMed.
- C. Wüster, H. Y. Shi, C. M. Kühlbrey, E. A. Biesel, U. T. Hopt, S. Fichtner-Feigl and U. A. Wittel, Ann. Surg., 2020, 272, 863–870 CrossRef PubMed.
- A. Henderson, Lancet, 1996, 348, s1–s4 CrossRef PubMed.
- L. Wu, Y. Ishigaki, Y. Hu, K. Sugimoto, W. Zeng, T. Harimoto, Y. Sun, J. He, T. Suzuki, X. Jiang, H. Y. Chen and D. Ye, Nat. Commun., 2020, 11, 446 CrossRef CAS PubMed.
- D. J. Polhemus and D. J. Lefer, Circ. Res., 2014, 114, 730–737 CrossRef CAS PubMed.
- A. Y. Y. Cheng, M. B. Gomes, S. Kalra, A. P. Kengne, C. Mathieu and J. E. Shaw, Nat. Rev. Endocrinol., 2023, 19, 194–200 CrossRef PubMed.
- M. Casciaro, E. Di Salvo, E. Pace, E. Ventura-Spagnolo, M. Navarra and S. Gangemi, Immun. Ageing, 2017, 14, 21 CrossRef PubMed.
- D. Rutkowski, R. Scholey, J. Davies, D. Pye, F. Blackhall, R. B. Warren, F. Jimenez, C. E. M. Griffiths and R. Paus, Br. J. Dermatol., 2024, 191, 791–804 CrossRef PubMed.
- D. Choi, O. Waksman, A. Shaik, P. Mar, Q. Z. Chen, D. J. Cho, H. Kim, R. L. Smith, S. N. Goonewardena and R. S. Rosenson, J. Am. Coll. Cardiol., 2022, 80, 316–328 CrossRef CAS PubMed.
- M. X. Liang, Q. Wang, S. Zhang, Q. Lan, R. J. Wang, E. C. Tan, L. Zhou, C. P. Wang, H. Wang and Y. Y. Cheng, Adv. Mater., 2024, 36, 2409015 CrossRef CAS PubMed.
- L. Zhu and W. Lin, Sens. Actuators, B, 2022, 352, 131042 CrossRef CAS.
- S. K. Nandi, D. Singh, J. Upadhay, N. Gupta, N. Dhiman, S. K. Mittal and N. Mahindroo, Int. J. Biol. Macromol., 2021, 193, 838–846 CrossRef CAS PubMed.
- A. Lleó, E. Cavedo, L. Parnetti, H. Vanderstichele, S. K. Herukka, N. Andreasen, R. Ghidoni, P. Lewczuk, A. Jeromin, B. Winblad, M. Tsolaki, B. Mroczko, P. J. Visser, I. Santana, P. Svenningsson, K. Blennow, D. Aarsland, J. L. Molinuevo, H. Zetterberg and B. Mollenhauer, Nat. Rev. Neurol., 2015, 11, 41–55 CrossRef PubMed.
- C. L. Masters, R. Bateman, K. Blennow, C. C. Rowe, R. A. Sperling and J. L. Cummings, Nat. Rev. Dis. Primers, 2015, 1, 15059 CrossRef PubMed.
| This journal is © The Royal Society of Chemistry 2025 |