Time-resolved vSFG of the water–air interface in an external field
Received
19th May 2025
, Accepted 30th July 2025
First published on 30th July 2025
Abstract
In the present work we have studied the effect of an external electric field of strength ±0.01 V Å−1 on the water molecules at the water–air interface using ab initio molecular dynamics. We calculated the vibrational sum-frequency generation spectra using surface-specific velocity–velocity correlation functions and used this to interpret the preferential orientation of interfacial water molecules in the presence of the field. Further, we use the time-averaged frequency distribution and frequency correlation functions to calculate the rate of vibrational correlation loss. The rate at which hydrogen bonds undergo breaking and reformation at the interface and in the presence of the field is explored using time-dependent vibrational sum-frequency generation spectroscopy. We find that OH modes show a faster rate of frequency correlation loss with a timescale of 4.7 ps in the presence of an external field, as compared to 5.7 ps under ambient conditions.
1 Introduction
The role of water as a solvent and its ability to facilitate chemical reactions at interfaces/surfaces is of huge significance in chemical, physical, atmospheric and biological sciences.1,2 In contrast to bulk, water molecules at an interface are characterized by a nonuniform density, asymmetrical solvent environment and weaker hydrogen bonding which may play a vital role in surface-specific reactive processes like “on-water” catalysis.3–6 The molecular orientation, vibrational Eigenstates and the hydrogen-bonding within the water molecules at interfaces can be studied using the technique of vibrational sum-frequency generation (vSFG) spectroscopy which involves simultaneous irradiation of the system with a visible and infrared radiation.7–9 Moreover, ultrafast vibrational energy transfer and interfacial reaction catalysis can also be monitored using time-resolved vSFG which is implemented using an infrared (IR) pump vSFG probe sequence.10,11 In computational studies, the second order susceptibility as a response of simultaneous vis/IR pulse irradiation is obtained from dipole–polarisability cross-correlation functions.12–14 Further, instantaneous fluctuations in dipole moment and polarisability tensor components of the irradiated molecules are obtained using empirically established linear maps between dipole moment/polarisability and force/potential acting on the molecule during the course of classical simulations.14–16 Similarly, ab initio molecular dynamics (AIMD) based approaches use maximally localized Wannier functions (MLWFs) of the molecules to obtain instantaneous fluctuation in dipole moments.17 The polarisability tensor components can be obtained by finite difference method based differentiation of the dipole moment with respect to an externally applied static electric field. The spread of the maximally localized Wannier functions/centers can also be correlated to the fluctuation in the polarisability tensor component for the given mode and thus used to obtain ‘on-the-fly’ vSFG of the interfacial molecules in a computationally inexpensive manner.18 Furthermore, time-dependent vSFG (TD-vSFG) can also be computationally obtained by selectively sampling the vibrational modes in an Eigenstate which is experimentally equivalent to irradiation by the corresponding pump pulse.19 Subsequently, the vibrational spectral diffusion, interconversion rates to different accessible vibrational states and interconversion rate from one molecular orientation to the thermodynamically equilibrium state can be obtained.19–21
AIMD based simulations have shown that the presence of a strong static electric field of the strength 0.35 V Å−1 or greater can lead to water dissociation.22 Also, a field strength of 0.25 V Å−1 leads to strong structural ordering in the local hydrogen bond network as seen in radial distribution functions as well as vibrational spectra and molecular entropy.23 For a static electric field of strength 0.25 V Å−1, the vibrational distribution of the OD stretch of liquid D2O shows a redshift of 90 cm−1 and a slower vibrational spectral diffusion rate of nearly 5 ps as compared to that of 2 ps under ambient conditions.23,24 The infrared and Raman spectra of liquid water in the presence of an electric field has also been studied using AIMD simulations.25 The spectral region corresponding to the OH stretch demonstrated a red shift owing to the strong hydrogen-bond network or ‘ice-like’ local molecular structure. Also the spectra of librational modes corresponding to collective motion of water molecules demonstrated a strong shoulder peak due to induced dipolar interactions.25 The asymmetrical solvent environment at the aqueous interface leads to an intrinsic electric field. The preferential orientation of water molecules, preferential solvation of ions on the interface and ‘on-water’ catalysis are examples of intrinsic potential driven chemical processes. In contrast, the rate of chemical reactions and the associated free-energy barrier can also be modified by applying ultrafast electric field pulses or by a static external field.26,27 The strength and direction of an external field can be manipulated in experiments in contrast to an internally generated field. Accordingly, to develop an understanding of chemical reactions at interfaces it is necessary to characterize the structure, dynamics and local hydrogen bond network of water molecules near interfaces. However, experimental characterization of interfacial water molecules in the presence of a strong field is a challenging task. In this regard, molecular dynamics based simulations by incorporating the external field potential in the Hamiltonian of the system can be easily used to study the structure, dynamics and spectroscopy of interfacial molecules under extreme conditions.28–30 Further, in AIMD based simulations, forces for temporal propagation of the system are calculated by solving the electronic wavefunction of the complete system within the ambits of density functional theory and the field–matter interaction is included in the total Hamiltonian of the system using Berry-phase formulation of electric polarization which enables us to study the interface in the presence of perturbation in an accurate manner.31,32
Here we present a time-resolved vibrational spectroscopic study of water molecules at the water–air/water–vacuum interface in the presence of a static electric field of the strength ±0.01 V Å−1 using AIMD. The preferential orientation of water molecules on the interface is interpreted using the vSFG spectrum of the OH modes at the water–air interface. Further, we also calculate the time-averaged vibrational spectral density which is equivalent to the vSFG spectrum within inhomogeneous limits. The vibrational spectral density also gives an estimate of the time-averaged orientation of dipoles on the interfaces. Further, the vibrational frequency distribution of OH modes is obtained using the wavelet transform of the time-series generated from the simulation trajectory. The rate at which the interfacial hydrogen bond network undergoes rearrangement is also obtained by calculating the interfacial OH mode correlation function decay. We also use TD-vSFG to obtain the interconversion rates between the hydrogen-bonded and free OH modes for the interfacial water molecules in the presence of an external field. The air–water interface is simulated in the presence of a homogeneous static electric field of the strength ±0.01 V Å−1, and compared to the air–water interface in ambient conditions without any external field perturbation. The chosen electric field strength is such that it can modify the reaction barriers without dissociating water.22,23
2 Computational details
The AIMD simulations of the air–water interface comprising 216 water (H2O) molecules at the liquid water density were performed using CP2K.33 The air–water interface was generated by creating a rectangular box of edgelength 18.65 Å along the x and y dimensions and 93.22 Å in the z dimension. The electronic structure calculations were performed using the QUICKSTEP module which is based on the mixed Gaussian and plane waves (GPW) approach.34 The valence Kohn–Sham orbitals were expanded in the terms of contracted Gaussians using the DZVP-MOLOPT basis set.35 The core electrons were represented using the norm-conserving Goedecker–Teter–Hutter (GTH) pseudopotentials36,37 and a density cutoff of 300 Ry was used for the auxiliary plane wave basis set. The contributions of the unknown exchange correlation functional were incorporated using the generalized gradient approximation based BLYP functional along with Grimme's third order correction to dispersion.38–40 It is important to note that the structure, dynamics, phase diagram and infrared spectrum of the liquid water as obtained from the AIMD simulations duly incorporating the London dispersion corrections were found to be in greater agreement with the experiments.41 The static electric field of strength ±0.01 V Å−1 was applied along the z-axis based on the Berry phase formulation and implemented in CP2K.31,32 The water–air interface under ambient conditions and without any external perturbation was also simulated for the purpose of comparison. The three systems were equilibrated in an NVT ensemble for a duration of 10 ps using a timestep of 0.5 fs. The correlation functions, vibrational frequency using wavelet transforms were obtained from the 25 ps long simulation trajectory generated in an NVE ensemble. The interfacial water molecules were categorized using the identification of truly interfacial molecules (ITIM)42 scheme using a probe sphere of 2 Å as done in our earlier studies.18–20,43 The water molecules at the interface are identified at each step from the simulated trajectory to take into account the dynamic nature of the interfacial water layer. The number of water molecules at the interface for the 0.01, −0.01 V Å−1, and in ambient conditions were 64, 63 and 63 respectively. In Fig. 1, a representative snapshot of the topmost layer of water molecules at the interface as obtained using ITIM on the AIMD trajectory is shown.
 |
| | Fig. 1 A representative snapshot of the water–air interface obtained from AIMD simulation in the presence of a static field of strength 0.01 V Å−1. The topmost layer identified using the ITIM algorithm. | |
3 Results
The orientational profile of the interfacial molecules can be indirectly revealed using the imaginary part of the second order susceptibility from molecular simulations.7–9 In Fig. 2, we have shown the imaginary component of the second order susceptibility for the air–water interface in the presence of the electric field of strength ±0.01 V Å−1 and compared the spectra with that of the interfacial system in the absence of an external field. The second order susceptibility is calculated using the surface-specific velocity–velocity correlation function (ssVVCF)19–21,44 approach. Mathematically it is given as| | 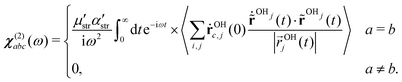 | (1) |
Here, rOHj and ṙOHj refer to the intramolecular distance and velocity, respectively, of a given OH mode. Further, χ(2),  and
and  are the second order susceptibility, dipole moment and the polarisability of the OH stretching mode respectively. The vSFG spectrum of the air–water interface in the absence of an electric field has been widely studied in simulations as well in experiments.7–9,14,18–20 The instantaneous fluctuations in the derivative of the dipole moment of the OH mode (
![[small mu, Greek, dot above]](https://www.rsc.org/images/entities/i_char_e153.gif) k) is approximated μstr·ṙOHki.e. the kth component of the velocity vector along the OH mode. Similarly, the diagonal components of the polarisability tensor are approximated as the inner product of ṙOHj and unit vector
k) is approximated μstr·ṙOHki.e. the kth component of the velocity vector along the OH mode. Similarly, the diagonal components of the polarisability tensor are approximated as the inner product of ṙOHj and unit vector  . The ssVVCF approach and its theoretical foundation are discussed in detail in ref. 44. To calculate the vSFG spectrum, we selectively calculate the dipole moment and polarisability for the OH modes of interfacial water molecules only as identified using the ITIM algorithm. In our previous work,43 we have shown that the contributions from the second and third interfacial layer to the vSFG spectrum are marginal. The pre-integral constants, i.e. μstr and αstr, are assumed to be unity in our calculations. As seen in Fig. 2, the spectrum is characterized by a positive intensity peak centered around 3700 cm−1 which is often attributed to the free/dangling OH modes and are projecting towards the vacuum/air.14,18 Further, there is a broad negative intensity peak centered around 3500 cm−1. The OH modes which have intermolecular hydrogen bonds and the dipoles pointing inwards toward the bulk water molecules contribute to this region of the spectrum.18 The OH modes which are parallel to the water–air interface or which have dipole vectors along the xy plane are insensitive to vSFG probe.19 Now we examine the vSFG spectrum of interfacial water molecules in the presence of an external field. For the field strength of +0.01 V Å−1 along the z-axis, water molecules are energetically stabilized on aligning the dipole vectors towards the air/vacuum. Accordingly, in comparison to the water–air interface under ambient conditions, the positive peak centered around 3700 cm−1 remains predominantly unchanged but for the spectral region in between 3100–3700 cm−1, the intensity magnitude is essentially of positive magnitude. The change in intensity of the vSFG spectrum in the presence of 0.01 V Å−1 in the spectral range of 3100–3700 cm−1, implies that the interfacial water molecules which are hydrogen bonded are also aligned toward the vacuum. Further, for the interfacial water molecules in the presence of −0.01 V Å−1, the energetically favorable orientation is such that the water dipoles are aligned towards the bulk. Accordingly, the peak intensity of the broad peak centered around 3500 cm−1 shows significant increase. On the other hand, the sharp peak around 3700 cm−1 has comparable loss in peak intensity. In a nutshell, the orientation of water molecules at the interface can be modified using an external field. The change in the orientational profile of the interfacial water molecules by application of an external field along different directions demonstrates that the reactions at interfaces and their mechanism and free energy barrier can be systematically modulated by using external fields. The connection between the orientation of the dipole vector of OH modes and the vSFG spectrum can be elucidated using the vibrational spectral density5 of the interfacial water molecules which is mathematically defined as
| | | Wijk(ω) = 〈αij(0)·μk(0)·δ(ω − ω(0))〉, | (2) |
where Wijk is the vibrational spectral density, αij and μk are the polarisability component along the ij axis and dipole vector projected along the k axis at a given time instant t = 0. Similarly, ω(0) is the vibrational frequency of the given mode at time instant t = 0. The vibrational frequency of OH modes is obtained using the wavelet transform of the time-series constructed as the complex function with its real and imaginary parts corresponding to the instantaneous bond length and the momentum projected along the OH mode, i.e.| | | f(t) = δrOH(t) + iδpOH(t). | (3) |
The method is described in detail in our earlier works.45–47 Mathematically, we can define the vibrational spectral density (Wxxz(ω)) as the time-averaged frequency distribution of interfacial OH modes weighted by their respective dipole-polarisability (μk·αxx) inner product. Here, the μ(k), which is the kth component of the OH dipole vector, determines how the contributions enhance the overall sign of the vibrational spectral intensity. For the cases in which the OH dipole vector is oriented towards the air/vacuum, the μ(k) is positive valued whereas for the cases in which the OH mode dipole is pointing towards the bulk it takes a negative value. This is evident in Fig. 3(a) where the spectral density of interfacial OH modes in the absence of external field is shown. The distribution captures both peaks of the vSFG spectrum of the water–air interface in ambient conditions originating from the free OH dipoles aligned towards the air and bonded OH dipoles which are pointing inwards in the bulk. Next we analyze how the field can modify the overall orientational profile of the interfacial water molecules. For the field of −0.01 V Å−1, we again notice that the frequency region corresponding to hydrogen-bonded OH modes around 3000–3700 cm−1 has an overall increase in intensity with respect to ambient conditions as also seen in the vSFG spectrum. Finally, we examine the third case corresponding to field strength of 0.01 V Å−1. While the frequency domain of 3700–3900 cm−1 has its characteristic peak related to free/dangling OH modes, the region in between 3000–3700 cm−1 has a relatively flat distribution. This is mainly due to the fact that in the presence of an external field the orientation towards the air/vacuum is energetically favored. Since the vibrational spectral density is defined as the inner product of the instantaneous OH frequency with the associated dipole moment and polarizability component, its convergence and agreement with vSFG spectra is expected to improve further with increased sampling.
 |
| | Fig. 2 The imaginary xxz component of the second order susceptibility (χ2xxz) of the OH mode of water molecules at the water–air interface in the presence of an external field of strength ±0.01 V Å−1 and in ambient conditions. | |
 |
| | Fig. 3 Time averaged vibrational spectral density of the OH modes of the interfacial molecules in the presence of an external field of strength (a) 0.00, (b) −0.01, and (c) +0.01 V Å−1 respectively. | |
Moving ahead, we analyze the time-averaged vibrational frequency distribution of the interfacial OH modes as obtained from the wavelet transform for all three systems as shown in Fig. 4. The time-averaged frequency of the OH modes in the topmost interfacial layer for the field strength of 0.01 V Å−1 irrespective of the field vector direction is 3494 cm−1. In contrast, the average vibrational frequency of OH modes at the interface in ambient conditions is 3484 cm−1. Thus we can infer that there is a marginal blue shift of nearly 10 cm−1 induced by the external field. Further, with respect to bulk with average frequency of 3424 cm−1, the interfacial water molecules show a blue shift of 70 cm−1. Finally, if we qualitatively examine the frequency distribution of OH modes for all three systems, the distribution is predominantly Gaussian with a sharp shoulder peak around 3700 cm−1 corresponding to free/dangling OH modes.
 |
| | Fig. 4 Time-averaged vibrational frequency distribution of the OH modes of the water molecules at the water–air interface in the presence of an external field of strength (a) 0.00, (b) −0.01 and (c) +0.01 V Å−1 respectively. | |
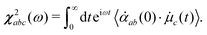
While the static orientational or structural profile of water molecules can be modified using the perturbative electric field, can we modify the dynamics of interfacial water molecules using the field? In the next step, we have tried to answer the question by calculating the frequency–frequency correlation function (Cωω(t)) of the OH modes of the water molecules at the interface as well as of the water molecules in the bulk in the presence of the external field and in the ambient conditions. The frequency correlation function is mathematically defined as
| | | Cωω(t) = 〈δω(0)·δω(t)〉. | (4) |
The time-dependent decay of frequency correlation for the interfacial as well as non-interfacial water molecules for different field strengths is shown in
Fig. 5. The temporal decay of frequency correlation at the interface is slower in comparison to that of water molecules in bulk. Nevertheless, the frequency correlation function for the interface as well as bulk water molecules shows two characteristic features. There is an ultra-fast sub 100 fs regime which corresponds to hindered/frustrated oscillations of OH modes with their intact hydrogen bonds. Further there is a slower component of the correlation decay which extends up to several picoseconds which is predominantly related to the hydrogen-bond lifetime. The timescale associated with these two regimes can be obtained using a bi-exponential fit function as shown below
| | 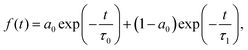 | (5) |
where
τ0 and
τ1 are the time-constants corresponding to the characteristic timescale associated with the restricted vibrational motion and the life time of a hydrogen bond for the water molecules at the interface as well as in the bulk. For the OH modes of water molecules in the bulk as well as the interface the ultrafast sub 100 fs motion is not influenced by the electric field perturbation. The time constant
τ0 was found to be nearly 70 fs for all six cases corresponding to bulk and interface at different field strength. The timescale (
t1) corresponding to hydrogen bond rearrangement for the OH modes in the bulk excluding the water molecules at the interface was found to be 2.5 ps for ambient conditions as also reported in earlier simulation and experimental studies. In contrast, for water molecules in the bulk at the field strength of 0.01 and −0.01 V Å
−1 it was found to be marginally faster
i.e., 2.00 and 2.20 ps respectively. Using the same fit function, we obtained the timescale associated with hydrogen bond dynamics at the interfaces and the time-constant (
t2) for the field strength of 0.00, 0.01 and −0.01 V Å
−1 is 5.70, 5.00 and 4.70 ps respectively. The water molecules at the interface are in an asymmetrical environment such that on average the water molecule is not tetrahedrally hydrogen bonded with the neighboring water molecules. Accordingly, the rate of breaking and reformation of the hydrogen bond is reduced at the interface and thus the slower time constants for hydrogen-bond rearrangement as mentioned above. Further, when the electric field is the negative field, which energetically favors water molecules to orient towards the bulk, we observe relatively faster hydrogen bond dynamics and thus a time-constant of 4.7 ps.
 |
| | Fig. 5 Time-dependent decay of the frequency correlation function of the OH modes of water molecules for field strengths of 0.00, 0.01 and −0.01 V Å−1 at the (a) water–air interface and (b) in bulk. | |
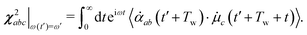
The frequency correlation functions as obtained for the interface and bulk provide the timescale at which water molecules undergo loss of the memory of their initial vibrational state. These time-constants are obtained by averaging over all the OH modes irrespective of the fact whether they were initially hydrogen-bonded or dangling/free/non-hydrogen bonded. The method of time-dependent vSFG (TD-vSFG) can be used to study the temporal evolution of frequency resolved OH modes based on their initial vibrational state (being hydrogen bonded or not). In the context of the present study, we will like to understand at what timescale an OH mode of the water molecule at the water–air interface which is initially hydrogen-bonded/non-hydrogen bonded breaks/reforms the hydrogen bond in the presence of external perturbation. The time-averaged vSFG spectrum is mathematically given as13,14
| |  | (6) |
Here as mentioned before,
χ2 is the second-order susceptibility,
μ is the transition dipole moment and
α is the polarizability of the chromophore irradiated. The time-dependent vSFG
19,20 can be obtained by modifying
eqn (6) and explicitly incorporating a time parameter
Tw,
| |  | (7) |
Accordingly, we can compute the second-order susceptibility of a given vibrational oscillator provided that the oscillator was vibrating at a frequency
ω′ at a time instant
t′. The time parameter
Tw enables us to temporally resolve the vSFG of the OH mode. We can calculate the vSFG of the OH mode for different values of
Tw after selecting the OH modes which are at the time instant
t′ in the vibrational state
ω′. The time-dependent vibrational frequency of the OH modes as required in
eqn (7) is already calculated using the short-window wavelet transform of the time-series constructed using the fluctuations in the bond length and momentum projected along the OH mode. The concept and application of computational TD-vSFG are discussed elsewhere.
19–21
Now we discuss the TD-vSFG spectra of the OH modes interfacial water molecules for the cases corresponding to the field strengths of 0.00, −0.01 and 0.01 V Å−1. We calculate the TD-vSFG of the OH modes by dividing the OH stretching frequency domain of 3000–3900 cm−1 into two domains of 3000–3700 and 3701–3900 cm−1 corresponding to the bonded and free/dangling OH modes respectively and the TD-vSFG spectra are shown in Fig. 6. Computationally, we have calculated the vSFG spectra of the water molecules based on their vibrational excitation frequency within the range of 3000–3700 cm−1 corresponding to a broadband IR pulse excitation. The TD-vSFG spectra of the hydrogen-bonded OH modes of the interfacial water molecules corresponding to the waiting times Tw = 0, 100, 500, 1000, 2000 and 3000 fs at 0.00 V Å−1 field strength are shown in Fig. 6(a). The vSFG spectrum of the bonded OH modes for the waiting time of Tw = 0 fs corresponding to the impulsive limit is a broad mono peak of negative intensity centered around 3400 cm−1. However, with the increase in waiting times like Tw = 100, 500 fs, bonded OH modes can undergo breaking of hydrogen bonds and thus a positive intensity peak centered around 3700 cm−1 arises. Further, for Tw = 1 ps we see that peak intensity continues to increase and eventually saturates to the equilibrium peak height by 3 ps. Thus we infer, a non-equilibrium state prepared by a broadband IR pulse of 3000–3700 cm−1 reaches an equilibrium hydrogen bond network in 3 ps. Next we look at the case of temporal evolution free/dangling OH modes in TD-vSFG for the waiting times Tw = 0, 100, 500, 1000, 2000 fs respectively. For the waiting time Tw = 0 fs, there is a strong positive intensity peak centered around 3700 cm−1 indicating all the OH modes contributing to the spectrum are free or dangling OH modes within their orientation along the vacuum/air. For the TD-vSFG spectra measured after the interval of 100 and 500 fs, we see the broad negative intensity peak in the frequency domain of 3000–3700 cm−1 becomes observable and gradual increases in intensity in proportion to the waiting time. Finally, for the large waiting times of 2 ps, the intensity of the broad peak for the bonded OH modes becomes comparable to the time-averaged vSFG spectrum.
 |
| | Fig. 6 TD-vSFG spectra of the air–water interface in the presence of an external electric field of strength 0.00 V Å−1 for (a) hydrogen-bonded OH modes and (b) free OH modes, and −0.01 V Å−1 for (c) hydrogen-bonded OH modes and (d) free OH modes, and +0.01 V Å−1 for (e) hydrogen-bonded OH modes and (f) free OH modes. | |
Further, we now explore the TD-vSFG spectra of the bonded OH modes of the interfacial water molecules in the presence of the external field of strength −0.01 V Å−1 as shown in Fig. 6(c). We have calculated the TD-vSFG of the bonded OH modes with the vibrational frequency within the range of 3000–3700 cm−1 for the waiting times Tw = 0, 100, 500, 2500 and 4000 fs respectively. For Tw = 0 fs, again we have a broad negative intensity peak implying within impulsive limits all the OH modes are in their initial HB bonded state and oriented towards the bulk. For waiting times 100 and 500 fs, we see an increase in the positive intensity peak centered around 3700–3900 cm−1. The bonded OH modes allowed to relax for longer waiting times of the duration 2500 or 4000 fs show saturated peak intensity of free/dangling OH modes. Similarly, we calculated the TD-vSFG spectra of free OH modes by exciting the OH modes with an IR pulse of range 3700–3900 cm−1 for waiting times Tw = 0, 100, 500, 1000, 1750 and 4000 fs respectively as shown in Fig. 6(d). For the impulsive limit of Tw = 0 fs, we observe a positive high intensity peak centered around 3700 cm−1 which implies all the OH modes in the high frequency domain are pointing towards the air/vacuum interface. Further, for Tw = 100 and 500 fs, the high frequency peak intensity shows a consistent drop and the negative intensity region shows an observable increase which indicates that the free OH modes undergo rearrangement to form hydrogen bonds. Further, for Tw = 1750 fs, we note that the intensities for both peaks have converged. To illustrate the fact, we also show the TD-vSFG corresponding to 4000 fs waiting time. Thus we infer that the free OH modes undergo fast rearrangement within 1.75 ps in the presence of an external field of −0.01 V Å−1.
Finally, we explore the TD-vSFG of the interfacial OH modes of the water–air interface in the presence of +0.01 V Å−1. For the hydrogen-bonded OH modes we have broadband IR pulse excitation corresponding to the range of 3000–3700 cm−1 and calculated TD-vSFG for Tw = 0, 100, 500, 1000, 1500, 3000, and 4000 fs respectively as shown in Fig. 6(e). For the waiting time Tw = 0 fs, the TD-vSFG spectrum has a low intensity negative peak around 3400 cm−1 and a similar positive intensity peak around 3550 cm−1. Clearly, for the water molecules at the interface under +0.01 V Å−1, the bonded OH modes are oriented towards the bulk as well as towards the vacuum owing to greater field induced stabilization. Furthermore, for waiting times Tw = 100, 500 fs, we also see a characteristic peak around 3700 cm−1 corresponding to those free OH modes which are oriented towards the vacuum. On the other hand, the intensity in the region as divided between the bonded OH modes oriented toward the bulk and vacuum remains predominantly unchanged. The peak positioned at 3700 cm−1 continues to gain intensity for the cases of 1000 and 1500 fs and eventually saturates around 3000 fs which implies that the bonded OH modes show a similar interconversion rate as in the ambient condition. We similarly examine the interconversion dynamics of free/dangling OH modes to hydrogen-bonded OH modes using TD-vSFG as shown in Fig. 6(f). We calculate the TD-vSFG of free OH modes for the waiting times Tw = 0, 100, 500, 1000, 1500 and 3000 fs by sampling the OH modes which have vibrational frequency within the range of 3700–3900 cm−1. For the case of Tw = 0 fs, we have a single peak centered around 3700 cm−1 which is also oriented towards the air/vacuum. With the increase in waiting time i.e. 100, 500 fs, the negative intensity peak in the region 3000–3700 cm−1 becomes more observable along with a consistent decrease in the intensity of the free OH modes peak around 3700–3900 cm−1. We note that by 1500 fs, the negative peak around 3400 cm−1, and shallow positive peak around 3550 cm−1 are distinctly visible and the peak intensity of the peak around 3700–3900 cm−1 has also saturated and doesn't change significantly even after 3000 fs. The formation of hydrogen bonds leads to stabilization and thus the free OH modes have a stronger propensity to form hydrogen bonds as seen in all cases from TD-vSFG. For water molecules in bulk as well as the water–air interface, nuclear quantum effects (NQEs) are known to affect the structure, dynamics and vibrational spectrum significantly.24,43 On inclusion of NQEs, the vibrational dynamics of OH modes at the water–air interface show 35% faster timescales as compared to that obtained with classical nuclei.43 Similarly, the vSFG spectrum of OH modes also shows overall broadened peaks owing to fluxional nuclei in path-integral MD as compared to classical simulations.43 In our present TD-vSFG study, we have not incorporated the NQEs as the nuclei are treated classically which we aim to address in future. The interconversion rates for breaking and reformation of OH modes under ambient conditions as well as in an external field will be investigated using path-integral MDs such that NQEs are accounted for.
4 Summary
To summarize, we have studied the vibrational spectroscopy of interfacial water molecules in the presence of a static electric field of strength ±0.01 V A−1. The vSFG spectra and vibrational spectral density of the interfacial water molecules indicate that the water molecules orient towards or away from the bulk based on the electric field direction. Further, the frequency distribution of interfacial OH modes shows a marginal blue shift of 10 cm−1 from 3484 to 3494 cm−1 in the presence of the field. The vibrational dynamics of interfacial water molecules get faster in the presence of the field from 5.7 ps to 4.7 ps corresponding to the change from ambient conditions to a field of −0.01 V A−1. The time-dependent vSFG spectra also show that the water molecules have faster interconversion rates to break and reform the hydrogen bonds. The role of field strength and field direction as explored in this work opens the avenues to a deeper theoretical understanding of electric field driven processes on water interfaces.
Conflicts of interest
Authors declare no conflicts of interest.
Data availability
The AIMD input files and the initial configuration of the water–air interface are available in the ZENODO repository with DOI: https://doi.org/10.5281/zenodo.15462946.
Acknowledgements
The authors would like to thank the Paderborn Center for Parallel Computing (PC2) for providing computing time on the Noctua 2 at Paderborn University.
References
-
P. Ball, Life's Matrix: A Biography of Water, Univ of California Press, 2001 Search PubMed.
-
D. S. Eisenberg and W. Kauzmann, The Structure and Properties of Water, Oxford, 1999 Search PubMed.
- G. R. Medders and F. Paesani, J. Am. Chem. Soc., 2016, 138, 3912–3919 CrossRef CAS PubMed.
- J. Bredenbeck, A. Ghosh, H.-K. Nienhuys and M. Bonn, Acc. Chem. Res., 2009, 42, 1332–1342 CrossRef CAS PubMed.
- J. L. Skinner, P. A. Pieniazek and S. M. Gruenbaum, Chem. Rev., 2011, 45, 93–100 Search PubMed.
- Y. Jung and R. A. Marcus, J. Am. Chem. Soc., 2007, 129, 5492–5502 CrossRef CAS PubMed.
- Q. Du, R. Superfine, E. Freysz and Y. R. Shen, Phys. Rev. Lett., 1993, 70, 2313–2316 CrossRef CAS PubMed.
- Y. R. Shen and V. Ostroverkhov, Chem. Rev., 2006, 106, 1140–1154 CrossRef CAS PubMed.
- V. Ostroverkhov, G. A. Waychunas and Y. R. Shen, Phys. Rev. Lett., 2005, 94, 046102 CrossRef PubMed.
- J. Bredenbeck, A. Ghosh, H.-K. Nienhuys and M. Bonn, Acc. Chem. Res., 2009, 42, 1332–1342 CrossRef CAS PubMed.
- C.-S. Hsieh, M. Okuno, J. Hunger, E. H. G. Backus, Y. Nagata and M. Bonn, Angew. Chem., Int. Ed., 2014, 53, 8146–8149 CrossRef CAS PubMed.
-
A. Morita, Theory of Sum Frequency Generation Spectroscopy, Springer, Singapore, 2018 Search PubMed.
- A. Morita and J. T. Hynes, J. Phys. Chem. B, 2002, 106, 673–685 CrossRef CAS.
- T. Ishiyama, T. Imamura and A. Morita, Chem. Rev., 2014, 114, 8447–8470 CrossRef CAS PubMed.
- G. L. Richmond, Chem. Rev., 2002, 102, 2693–2724 CrossRef CAS PubMed.
- P. A. Pieniazek, C. J. Tainter and J. L. Skinner, J. Am. Chem. Soc., 2011, 133, 10360–10363 CrossRef CAS PubMed.
- M. Sulpizi, M. Salanne, M. Sprik and M. P. Gaigeot, J. Phys. Chem. Lett., 2013, 1, 83–87 CrossRef.
- D. Ojha and T. D. Kühne, Molecules, 2020, 25, 3939 CrossRef CAS PubMed.
- D. Ojha, N. K. Kaliannan and T. D. Kühne, Commun. Chem., 2019, 2, 116 CrossRef.
- D. Ojha and T. D. Kühne, Sci. Rep., 2021, 11, 2456 CrossRef CAS PubMed.
- D. Ojha, C. Penschke and P. Saalfrank, Phys. Chem. Chem. Phys., 2024, 26, 11084–11093 RSC.
- A. M. Saitta, F. Saija and P. V. Giaquinta, Phys. Rev. Lett., 2012, 108, 207801 CrossRef PubMed.
- D. Ojha and T. D. Kühne, Phys. Chem. Chem. Phys., 2023, 25, 13442–13451 RSC.
- D. Ojha, A. Henao and T. D. Kühne, J. Chem. Phys., 2018, 148, 102328 CrossRef PubMed.
- G. Cassone, J. Sponer, S. Trusso and F. Saija, Phys. Chem. Chem. Phys., 2019, 21, 21205–21212 RSC.
- S. Yu, P. Vermeeren, T. A. Hamlin and F. M. Bickelhaupt, Chem. – Eur. J., 2021, 27, 5683 CrossRef CAS PubMed.
- A. C. Aragonès, N. Haworth, N. Darwish, S. Ciampi, N. J. Bloomfield, G. G. Wallace, I. Diez-Perez and M. L. Coote, Nature, 2016, 531, 88–91 CrossRef.
- R. Resta, J. Phys.: Condens.
Matter, 2000, 12, R107 CrossRef CAS.
- R. Resta, Rev. Mod. Phys., 1994, 66, 899–915 CrossRef CAS.
- R. Resta, M. Posternak and A. Baldereschi, Phys. Rev. Lett., 1993, 70, 1010–1013 CrossRef CAS PubMed.
- P. Umari and A. Pasquarello, Phys. Rev. Lett., 2002, 89, 157602 CrossRef CAS PubMed.
- I. Souza, J. Iniguez and D. Vanderbilt, Phys. Rev. Lett., 2002, 89, 117602 CrossRef.
- T. D. Kühne,
et al.
, J. Chem. Phys., 2020, 152, 194103 CrossRef PubMed.
- J. VandeVondele, M. Krack, F. Mohamed, M. Parrinello, T. Chassaing and J. Hutter, Comput. Phys. Commun., 2005, 167, 103–128 CrossRef CAS.
- J. VandeVondele and J. Hutter, J. Chem. Phys., 2007, 127, 114105 CrossRef PubMed.
- S. Goedecker, M. Teter and J. Hutter, Phys. Rev. B: Condens. Matter Mater. Phys., 1996, 54, 1703–1710 CrossRef CAS PubMed.
- K. Krack, Theor. Chem. Acc., 2005, 114, 145–152 Search PubMed.
- A. D. Becke, Phys. Rev. A: At., Mol., Opt. Phys., 1988, 38, 3098–3100 CrossRef CAS.
- C. T. Lee, W. T. Yang and R. G. Parr, Phys. Rev. B: Condens. Matter Mater. Phys., 1988, 37, 785–789 CrossRef CAS.
- S. Grimme, J. Comput. Chem., 2006, 27, 1787–1799 CrossRef CAS PubMed.
- L. R. Pestana, N. Mardirossian, M. Head-Gordon and T. Head-Gordon, Chem. Sci., 2017, 8, 3554–3565 RSC.
- M. Sega, S. S. Kantorovich, P. Jedlovszky and M. Jorge, J. Chem. Phys., 2013, 138, 044110 CrossRef PubMed.
- D. Ojha, A. Henao, F. Zysk and T. D. Kühne, J. Chem. Phys., 2024, 160, 204114 CrossRef CAS PubMed.
- T. Ohto, K. Usui, T. Hasegawa, M. Bonn and Y. Nagata, J. Chem. Phys., 2015, 143, 124702 CrossRef PubMed.
- A. Semparithi and S. Keshavamurthy, Phys. Chem. Chem. Phys., 2003, 5, 5051–5062 RSC.
- D. Ojha, K. Karhan and T. D. Kühne, Sci. Rep., 2018, 8, 16888 CrossRef PubMed.
- D. Ojha and P. Saalfrank, Sci. Rep., 2025, 15, 28144 CrossRef CAS.
|
| This journal is © the Owner Societies 2025 |
Click here to see how this site uses Cookies. View our privacy policy here. 
 Open Access Article
 This Open Access Article is licensed under a
  *ac and
Thomas D.
Kühne
ab
*ac and
Thomas D.
Kühne
ab


 and
and  are the second order susceptibility, dipole moment and the polarisability of the OH stretching mode respectively. The vSFG spectrum of the air–water interface in the absence of an electric field has been widely studied in simulations as well in experiments.7–9,14,18–20 The instantaneous fluctuations in the derivative of the dipole moment of the OH mode (
 . The ssVVCF approach and its theoretical foundation are discussed in detail in ref. 44. To calculate the vSFG spectrum, we selectively calculate the dipole moment and polarisability for the OH modes of interfacial water molecules only as identified using the ITIM algorithm. In our previous work,43 we have shown that the contributions from the second and third interfacial layer to the vSFG spectrum are marginal. The pre-integral constants, i.e. μstr and αstr, are assumed to be unity in our calculations. As seen in Fig. 2, the spectrum is characterized by a positive intensity peak centered around 3700 cm−1 which is often attributed to the free/dangling OH modes and are projecting towards the vacuum/air.14,18 Further, there is a broad negative intensity peak centered around 3500 cm−1. The OH modes which have intermolecular hydrogen bonds and the dipoles pointing inwards toward the bulk water molecules contribute to this region of the spectrum.18 The OH modes which are parallel to the water–air interface or which have dipole vectors along the xy plane are insensitive to vSFG probe.19 Now we examine the vSFG spectrum of interfacial water molecules in the presence of an external field. For the field strength of +0.01 V Å−1 along the z-axis, water molecules are energetically stabilized on aligning the dipole vectors towards the air/vacuum. Accordingly, in comparison to the water–air interface under ambient conditions, the positive peak centered around 3700 cm−1 remains predominantly unchanged but for the spectral region in between 3100–3700 cm−1, the intensity magnitude is essentially of positive magnitude. The change in intensity of the vSFG spectrum in the presence of 0.01 V Å−1 in the spectral range of 3100–3700 cm−1, implies that the interfacial water molecules which are hydrogen bonded are also aligned toward the vacuum. Further, for the interfacial water molecules in the presence of −0.01 V Å−1, the energetically favorable orientation is such that the water dipoles are aligned towards the bulk. Accordingly, the peak intensity of the broad peak centered around 3500 cm−1 shows significant increase. On the other hand, the sharp peak around 3700 cm−1 has comparable loss in peak intensity. In a nutshell, the orientation of water molecules at the interface can be modified using an external field. The change in the orientational profile of the interfacial water molecules by application of an external field along different directions demonstrates that the reactions at interfaces and their mechanism and free energy barrier can be systematically modulated by using external fields. The connection between the orientation of the dipole vector of OH modes and the vSFG spectrum can be elucidated using the vibrational spectral density5 of the interfacial water molecules which is mathematically defined as


