
 Open Access Article
 This Open Access Article is licensed under a
 Creative Commons Attribution 3.0 Unported Licence
Structure of chemisorbed 1,3-butadiene on the Cu(111) surface†
Mohammad Rahat
Hossain
 a,
Ahmad
Arshadi
b,
Ye
Xu
*b and
Michael
Trenary
*a
a,
Ahmad
Arshadi
b,
Ye
Xu
*b and
Michael
Trenary
*a
aDepartment of Chemistry, University of Illinois Chicago, 845 West Taylor Street, Chicago, IL 60607, USA. E-mail: mtrenary@uic.edu
bDepartment of Chemical Engineering, Louisiana State University, Patrick F. Taylor Hall, Baton Rouge, LA 70803, USA. E-mail: yexu@lsu.edu
First published on 30th June 2025
Abstract
The adsorption of 1,3-butadiene (BD, C4H6) on Cu(111) was studied experimentally with reflection absorption infrared spectroscopy (RAIRS) and temperature programmed desorption (TPD) and computationally with density functional theory (DFT). The TPD results show that submonolayer BD desorbs at 217 K for the lowest BD coverages, while 2nd-layer and multilayer BD desorbs in the range of about 180 to 112 K. No carbon was observed with Auger electron spectroscopy (AES) after desorption of BD indicating that it does not dissociate on Cu(111). For multilayer coverages, the RAIRS peaks are close to those of solid BD. Comparing the multilayer RAIR spectra with calculated vibrational spectra of gas-phase BD indicates that the molecules are mostly oriented with their molecular planes parallel to the surface as the most intense peaks are due to out-of-plane bending modes. At low exposures at 85 K and after annealing the multilayer to 130 K, a set of peaks are observed that are distinct from those of gas-phase BD. This indicates that BD interacts with the surface in a way that significantly alters the molecule's internal bonding. Possible adsorption structures for BD on Cu(111) were explored through DFT calculations. A comparison of experimental and simulated RAIR spectra suggests that BD adsorbs as a mixture of s-trans and s-cis di-π, and possibly s-trans tetra-σ, structures. The s-trans and s-cis di-π structures were nearly iso-energetic, despite the s-cis isomer being less stable in the gas phase. An s-trans tetra-σ structure was found to be less stable by 0.2 eV than the di-π structures at 1/6 monolayer and become unstable at a lower coverage.
1. Introduction
The hydrogenation of unsaturated hydrocarbons plays a crucial role in industrial catalytic processes. In particular, they are predominantly employed in the downstream units in the refining and petrochemical industries, such as catalytic crackers.1 These processes include the selective hydrogenation of acetylenes, methyl acetylenes, 1,3-butadienes, and C5 unsaturated compounds. These molecules are produced in significant quantities due to their applications as fuels, and precursors for fuels and polymers.2 When dealing with molecules that have multiple chemical end-products, the challenge lies not only in achieving high reaction activity but also in ensuring selective hydrogenation of the targeted unsaturated bond. The C4-rich streams containing 1-butene are currently used as precursors for polybutene production and as co-monomers for low-density polyethylene.3 However, the presence of 1,3-butadiene (BD) in the C4 stream deactivates the active sites of polymerization catalysts, inhibiting the kinetics and also reducing the overall quality of the polymers. Therefore, there is considerable interest in the development of new and improved catalysts that are active and stable to selectively convert 1,3-butadiene into 1-butene. Since bonding modes can play a pivotal role in dictating reaction selectivity towards desired products, study of the adsorption of reactants in catalytically relevant processes is crucial.The adsorption of BD on different metals has been widely investigated.2–8 Several adsorption modes have been proposed to explain the molecular chemisorption on those surfaces. Hrbek et al. explored the adsorption of 1,3-butadiene on Ag(111) at 80 K under UHV conditions.9 They found that butadiene adsorbs weakly as an s-trans conformer, with the first layer oriented parallel to the silver surface, and that it desorbs without decomposition. In this notation, the “s” in “s-trans”, refers to the single bond separating the two double bonds. The study revealed a molecular ordering within the diluted adsorbed layer, likely due to weak π-bonding interactions with the surface and intermolecular repulsive forces. In a related study, Osaka et al. identified specific adsorption configurations of 1,3-butadiene on both Au(111) and Ag(111) surfaces, delineating the α-state at terrace locations and the β-state at defect sites.10 Molecular alignments and surface interactions were elucidated via CH2 out-of-plane vibrations, providing insights into surface diffusion and migration mechanisms of 1,3-butadiene on these surfaces. Similar adsorption structures were also reported on Pd(110) by Katano et al.11 Weiss et al. observed that a multilayer of 1,3-butadiene desorbs from Ru(001) within the temperature range of 110–160 K, leaving adsorbed butadiene in a 1,4-di-σ configuration.12 Comparison of the high resolution electron energy loss spectrum of this surface species with those of (CH)4 metallacycles suggests that the thermal decomposition of 1,3-butadiene on Ru(001) leads to the formation of a similar intermediate. Valcárcel et al. used DFT calculations to determine the binding modes of 1,3-butadiene and butene isomers on Pt(111) and Pd(111) surfaces.13 For 1,3-butadiene on Pt(111), the 1,2,3,4-tetra-σ adsorption mode is found to be the most favorable configuration. On the Pd(111) surface, previous experiments suggested a di-π adsorption mode, but the DFT calculations indicate a σ-type interaction with moderate molecular distortion, consistent with the experimental findings.
In previous work, we reported the selective hydrogenation of 1,3-butadiene to 1-butene over a Pd/Cu(111) single atom alloy (SAA) catalyst under ambient pressure conditions.14 In an SAA, a low coverage on the order of 1% of an active metal such as Pd is substituted into the topmost atomic layer of a host metal such as Cu to achieve desirable catalytic properties not possessed by either metal by itself.15–20 In the range of temperatures (360–390 K) used for the reaction, no RAIRS peaks were observed suggesting that BD was only transiently adsorbed such that its coverage during reaction conditions was too low to be detectable. Therefore, the goal of the present study was to characterize BD adsorption at low temperature in UHV to establish its structure on Cu(111). Lucci et al. showed through molecular cork experiments that on the Pt/Cu(111) SAA surface the hydrogenation of BD occurs on the Cu sites.16 Therefore, the structure of BD chemisorbed on Cu(111) is relevant to its hydrogenation chemistry on the SAA surfaces. As Cu is generally more reactive than Ag or Au, but less reactive than metals such as Ru, Pd, or Pt, our study seeks to determine how the structure of BD chemisorbed on Cu(111) compares to the structure found on the other metals studied. Through comparison of experimental RAIR spectra with the results of DFT calculations, we find that BD adsorbs as a mixture of s-trans di-π, s-cis di-π, and s-trans tetra-σ configurations.
2. Methods
2.1. Experimental
All the experiments were done within a dual-stainless-steel chamber ultra-high vacuum (UHV) system, as previously described in detail.21,22 The RAIRS experiments were conducted in the lower chamber, which is used as an IR cell. The RAIRS data was obtained using a Bruker Vertex 70v FTIR and mercury cadmium telluride (MCT) detector. As the focus of the present study was on adsorbed species, only p-polarized light was used whereas in our previous study s- and p-polarized light were used to enable detection of both adsorbed and gas-phase molecules. All RAIRS results are presented as absorbance spectra, labeled as p-absorbance vs. wavenumber, and were obtained with 1024 scans and a resolution of 4 cm−1.TPD experiments were carried out in the upper UHV chamber with a base pressure of 1.0 × 10⁻⁹ Torr with a quadrupole mass spectrometer (QMS). The fragmentation pattern of 1,3-butadiene was obtained at 1.1 × 10⁻⁷ Torr and is presented in the ESI† of our previous publication.14 For the TPD experiments, a linear heating rate of 1 K s−1 was used and BD desorption was monitored at a mass-to-charge (m/z) ratio of 54. BD (≥99.9%) was purchased from Millipore Sigma and utilized without further purification. The Cu(111) single crystal (99.9999% purity) with a diameter of 15 mm and thickness of 2.5 mm (Surface Preparation Laboratory), was mounted and cleaned as described previously.23
2.2. Computational
Self-consistent, periodic DFT calculations were performed using the Vienna Ab Initio Simulations Package (VASP, version 5.4.4)24 using the generalized gradient approximation (GGA) functional PBE25 and the optB86b-vdW functional.26 Core electrons were described by the projector augmented wave (PAW) method,27 and the Kohn–Sham valence states (Cu(4s 3d), C(2s 2p), and H(1s)) were expanded in a plane wave basis up to different cutoff energies, as specified in the text below. The electronic states were smeared by applying a first-order Methfessel–Paxton method with a smearing parameter of 0.2 eV.28 All total energies were extrapolated back to 0 K.The equilibrium lattice constant and cohesive energy for bulk Cu were 3.633 Å and 3.49 eV29 according to GGA-PBE, and 3.602 Å and 3.76 eV30 according to optB86b-vdW, respectively, compared to the experimental values of 3.61 Å31 and 3.49 eV.32 The fcc(111) surface was modeled using a four-layer slab with a (3 × 2) or (3 × 3) surface unit cell, such that one molecule adsorbed on each surface unit cell corresponded to 1/6 or 1/9 monolayer (ML) coverage, respectively. The surface Brillouin zone was sampled on several Γ-centered Monkhorst–Pack k-point meshes. The total energy of BD adsorbed on the (3 × 3) Cu(111) surface unit cell increased monotonically from 400 eV cutoff with a 5 × 5 × 1 k-point mesh, to 650 eV cutoff and 7 × 7 × 1 k-point mesh by up to 0.1 eV. For better comparison with the experimental results, the more stringent convergence criteria were used below, i.e., 650 eV cutoff and a 7 × 7 × 1 k-point mesh for the (3 × 3) surface unit cell, and 650 eV cutoff and a 7 × 9 × 1 k-point mesh for the (3 × 2) surface unit cell. A vacuum space of ∼20 Å was included in the z direction to avoid interactions of periodic images, along with electrostatic decoupling applied in the same direction.33 The top two layers of metal atoms were fully relaxed, while the bottom two layers were fixed to mimic bulk Cu. Geometric optimization was converged to 0.01 eV Å−1 for each relaxed degree of freedom. Adsorption energies were calculated as ΔE = Etotal − Eslab − Emol, where Etotal represents the energy of the slab with the adsorbate, Eslab is the energy of the clean slab, and for ease of comparison, Emol is the energy of an isolated s-trans isomer of BD in the gas phase. A more negative ΔE indicates stronger adsorption. The s-cis isomer was calculated to be 0.15 eV less stable than the s-trans isomer in the gas phase according to optB86b-vdW, in good agreement with the CCSD(T) result of 0.13 eV difference reported by Feller et al.34
The climbing-image nudged elastic band (CI-NEB)35 method and the dimer36 method were used to model and calculate the minimum-energy reaction pathway for the trans–cis isomerization step. The CI-NEB method was used with 8 intermediate images. The GGA-PBE converged transition state was then re-optimized using the dimer method with optB86b-vdW. The CI-NEB and dimer calculations were converged to below 0.03 eV Å−1 for each relaxed degree of freedom. The activation energy was calculated as Ea = ETS − EIS, where IS and TS denote the initial state and transition state, respectively.
The simulated IR spectra of surface adsorbates were generated using the atomic simulation environment (ASE).37 Those calculated using optB86b-vdW are presented herein. Vibrational normal modes and associated frequencies were calculated within the harmonic approximation using a finite difference approximation of the Hessian matrix with a displacement of 0.01 Å applied to each relaxed degree of freedom. The IR intensities were calculated from a finite difference approximation of the gradient of the dipole moment of each vibrational mode in a given direction. For BD adsorbed on a Cu(111) surface, thus, only those vibrational modes that give rise to a dipole gradient perpendicular to the surface are IR-active. Zero-point energies (ZPE) were calculated from the vibrational frequencies of the molecule using the equation shown below where h is Planck's constant and νi is the fundamental frequency of the ith vibrational normal mode.

3. Results and discussion
As the exposure of BD to Cu(111) at 85 K is steadily increased, the first layer will be in contact with the Cu surface, whereas higher layers will involve only intermolecular interactions as in solid BD. Fig. 1 shows RAIR spectra following the indicated exposures of 1,3-butadiene to Cu(111) at 85 K. At this temperature, the spectrum for the higher exposures is expected to be that of the molecular solid and the peaks can be assigned accordingly as indicated in Table 1, which also lists the peak positions for BD in the gas phase and adsorbed on Ag(111).9 The isolated s-trans molecule is planar with double bonds between C1 and C2 and between C3 and C4 and single bonds between C2 and C3. As the molecule belongs to the C2h point group, the IR active modes are of Au (out of plane) and Bu (in plane) symmetry. In the 5.0 L spectrum, the most intense peaks are at 914, 1020, 1378, and 1591 cm−1 and are readily assigned to CH2 wagging and CH bending modes of Au symmetry and to CH2 scissoring and C![[double bond, length as m-dash]](https://www.rsc.org/images/entities/char_e001.gif) C stretching modes of Bu symmetry, respectively. For even higher exposures up to 25 L, the spectra in Fig. S1 in the ESI† show that peaks due to the out of plane CH2 wagging and CH bending modes, now at 921 and 1023 cm−1, are an order of magnitude more intense than the other peaks, again indicating that molecules in the multilayer are predominantly parallel to the surface, a conclusion also reached in the earlier RAIRS studies of BD on Ag(111).9,10
C stretching modes of Bu symmetry, respectively. For even higher exposures up to 25 L, the spectra in Fig. S1 in the ESI† show that peaks due to the out of plane CH2 wagging and CH bending modes, now at 921 and 1023 cm−1, are an order of magnitude more intense than the other peaks, again indicating that molecules in the multilayer are predominantly parallel to the surface, a conclusion also reached in the earlier RAIRS studies of BD on Ag(111).9,10
 | ||
| Fig. 1 RAIR spectra after the Cu(111) surface at 85 K was exposed up to 5.0 L of 1,3-butadiene. | ||
| Symm. | Mode | Description | Gas phase s-trans/gauche40 | Solid38 | Crystalline phase I (at 15 K)41 | Cu(111)a multilayer | Ag(111)9 |
|---|---|---|---|---|---|---|---|
| a This study. 25 L exposure. | |||||||
| Au | ν10 | (CH) bend | 1013.8/982 | 1014, 1018 | 1014.6, 1020.1 | 1023 | 1021, 1016 |
| ν11 | (CH2) wag | 908.1/915 | 911, 917 | 919.8, 912.2 | 921 | 924, 912 | |
| ν12 | (CH2) twist | 524.5/732 | 547 | 550.5, 547.9 | — | 550, 548 | |
| ν13 | (C–C) torsion | 162.5 | 163 | 192 | — | — | |
| Bu | ν17 | (CH2) a-stretch | 3100.5 | 3079 | 3077.5 | 3080 | 3086 |
| ν18 | (CH) stretch | 3054.7 | 3041 | 3039.2 | 3043 | 3043 | |
| ν19 | (CH2) s-stretch | 3010 | 2968 | 2967.1 | 2972 | 2966 | |
| ν20 | (CC) a-stretch |
1596.7/1632 | 1587 | 1589.1, 1582.9 | 1591 | 1590 | |
| ν21 | (CH2) scissors | 1380.8/1401 | 1377 | 1370.6, 1369.0 1377.7 | 1371 | 1378 | |
| ν22 | (CH) bend | 1295.0 | 1285 | 1286.7, 1284.7 | 1286 | 1287 | |
| ν23 | (CH2) rock | 990.2/1087 | 994 | 994.8 | 995 | 995 | |
| ν24 | (CC–C) deform |
291 | 302 | 303.2 | — | — | |
Simulated spectra with the vibrational intensities proportional to the square of the dipole gradients that are either out of or in the molecular plane of BD are presented in Fig. S2 (ESI†). These simulated spectra are relevant to the case of the molecules adsorbed on the Cu surface, but not interacting with it. Only the out-of-plane modes have calculated intensity for an orientation where the molecular plane is parallel to the surface, but the in-plane modes are most intense when the molecular plane is perpendicular to the surface. The observation of both Au and Bu modes in the experimental multilayer spectra indicates that at least for some molecules in the multilayer, the molecular plane is not strictly parallel to the surface.
The peaks observed at the lowest exposures at 943, 1228 and 1507 cm−1 do not match those of gas-phase or solid BD. This indicates that the interaction of BD with the Cu(111) surface alters the bonding within the molecules to yield vibrational frequencies distinct from those of an isolated molecule. These peaks are also not observed in the RAIRS studies of BD on the (111) surfaces of Ag9,10 and Au.10 For 2.5 L and above, the IR peaks at 911 cm−1 and 943 cm−1 converge to a single peak at 914 cm−1, while the one at 1015 cm−1 shifts slightly to 1020 cm−1, and the peaks assigned to the (CH2) scissoring and (CC) anti-symmetric stretching modes at 1378 and 1591 cm−1, respectively, gain intensity. Weak peaks at 989 and 1286 cm−1 for in-plane (CH2) rocking and in-plane (C–H) bending modes of Bu symmetry, respectively, are seen in the 5.0 L spectrum with the latter peak first appearing in the 2.5 L spectrum. Additionally, the C–H stretch region for the multilayer shows five peaks, which are most readily observed for the 25 L spectrum in Fig. S1 (ESI†). In the 5.0 L spectrum in Fig. 1, the ones at 2977, 3001 and 3090 cm−1 correspond to (CH2) stretches and the ones at 3023 and 3047 cm−1 correspond to (CH) stretches.38
The RAIRS results in Fig. 1 reveal a clear distinction between BD adsorbed directly to the Cu(111) surface and multilayers of BD. This is further supported by the TPD results in Fig. 2(a). For the lowest exposure of 0.3 L, BD desorbs as a single peak at 217 K. As the exposure increases, additional desorption occurs at lower temperatures, until distinct new peaks appear at 126 and 112 K for a 5.0 L exposure, which are interpreted as second layer and multilayer desorption, respectively. Using the method of Redhead39 for first-order desorption and assuming a pre-exponential of 1013 s−1 yields activation energies for desorption of 0.30, 0.34, and 0.59 eV for the peak desorption temperatures of 112, 126, and 217 K, respectively. Post desorption measurements with AES as shown in Fig. S3 (ESI†) shows no carbon on the surface, indicating that BD desorbs from Cu(111) without dissociation.
 | ||
| Fig. 2 (a) TPD spectra obtained at a heating rate of 1 K s−1 after the indicated exposures of 1,3-butadiene to Cu(111) at 85 K. (b) RAIR spectra after the Cu(111) surface at 85 K was exposed to 5.0 L of 1,3-butadiene and annealed to the indicated temperatures momentarily and then cooled again to 85 K where the spectra were acquired. | ||
The TPD results in Fig. 2(a) can be correlated with the RAIRS results in Fig. 2(b) after exposing the Cu(111) surface to 5.0 L of BD followed by annealing to the indicated temperatures then cooling back to 85 K where the spectra were acquired. The initial spectrum is, as expected, almost identical to the 5.0 L spectrum in Fig. 1, which was obtained after a cumulative exposure of 5.0 L, whereas in Fig. 2(b) the surface was exposed to 5.0 L directly. The different procedure leads to the small differences between the two spectra. Annealing to 100 K causes a slight decrease in intensity of the peaks, but the ones assigned to the out of plane CH2 wagging and CH bending modes are still most intense. After the 110 K anneal, the peak at 1236 cm−1 becomes most intense whereas it was barely visible in the previous two spectra. The TPD results imply that a 110 K anneal should desorb some but not all the multilayer leaving both monolayer and multilayer BD on the surface. The spectra after the 120 and 130 K anneals support this as the peak at 1020 cm−1 is absent in these spectra and the peak at 914 cm−1 is greatly diminished after the 120 K anneal and absent in the 130 K spectrum. From the TPD results, we conclude that the spectra for temperatures ≥ 120 K in Fig. 2(b) correspond to the chemisorbed molecule, which has a peak desorption temperature of 217 K for low BD exposures. The higher intensity of the RAIRS peak at 1228–1238 cm−1 after annealing compared to the adsorption at 85 K as in Fig. 1, is likely due to a kinetic barrier for converting a weakly adsorbed BD to the chemisorbed form or to less screening by the multilayer as it is desorbed.
The chemisorption of BD on Cu(111) was explored through DFT calculations. Several chemisorption configurations were considered, including di-π, 1,2-di-σ-3,4-π, and 1,2,3,4-tetra-σ. The di-π state corresponds to the molecular structure in the gas phase, in which CC bonds occur at the C1–C2 and C3–C4 positions, while the C2–C3 bond is noticeably longer. Replacing one of the CC bonds with a single C–C bond yields the 1,2-di-σ-3,4-π (referred to simply as di-σ below) state, while the loss of both CC bonds yields the tetra-σ state. The conversion of a CC bond to a C–C bond requires a C–metal interaction to substitute for the lost bond, so a more reactive metal is expected to be more likely to produce the di-σ or tetra-σ state, while less reactive metals should favor di-π. The tetra-σ state has been found theoretically to be the minimum-energy state on Pt(111) and Pd(111) by Valcárcel et al.13
At a low coverage of 1/9 ML, an s-trans di-π state (Fig. 3a) and an s-cis di-π state (Fig. 3b) are found to be the only stable configurations on Cu(111), each having ΔE of −1.00 eV according to optB86b-vdW (Table 2). When the coverage increases to 1/6 ML, which is close to saturation in the chemisorbed layer based on the footprint of the molecule, an additional state, tetra-σ (Fig. 3(c)), becomes stabilized by lateral interactions. Increasing coverage beyond 1/6 ML results in the desorption of any additional BD molecule regardless of the functional used. The di-π states (Fig. 3(d) and (e)) remain the more stable structures, being ca. 0.2 eV lower in energy than the tetra-σ (Table 2). The bond lengths differ from those of the gas-phase molecule, with the C1–C2 and C3–C4 bonds notably lengthened compared to a CC bond, while the C2–C3 bond somewhat contracted compared to a C–C single bond. The two Cu atoms located beneath the C1–C2 and C3–C4 bonds respectively in all three states reside 0.2 Å higher than the rest of the surface Cu atoms on average (visible in the side views in Fig. 3), indicative of strong C–Cu covalent interaction. While BD is free to rotate about the C–C single bond in the gas phase, it is not expected to easily do so when chemisorbed on Cu(111) because the surface significantly reduces the range of rotation about the middle C–C bond. This expectation was confirmed through calculation of the isomerization barrier, which was obtained with both GGA-PBE and optB86b-vdW functionals as shown in Fig. S4 (ESI†). As the calculated barriers are higher than the desorption barrier, the chemisorbed isomers are not expected to interconvert under the experimental conditions.
 | ||
| Fig. 3 Minimum-energy adsorption states for 1,3-butadiene calculated using the optB86b-vdW functional, in top (upper panels) and side (lower panels) views: at 1/9 ML, (a) s-trans di-π; (b) s-cis di-π; at 1/6 ML, (c) s-trans tetra-σ, (d) s-trans di-π, and (e) s-cis di-π. The lengths of the C–C bonds (in Å) are as indicated. Colour code: brown = Cu, black = C, white = H. | ||
| Coverage | State | GGA-PBE | OptB86b-vdW | ||||||
|---|---|---|---|---|---|---|---|---|---|
| ΔE | d C1–C2 | d C2–C3 | d C3–C4 | ΔE | d C1–C2 | d C2–C3 | d C3–C4 | ||
| a Calculated C–C bond lengths for the s-trans isomer of 1,3-butadiene in the gas phase are included for comparison. The experimental values are 1.341, 1.463, and 1.341 Å.42 | |||||||||
| Gas phasea | — | 1.345 | 1.451 | 1.345 | — | 1.344 | 1.451 | 1.344 | |
| 1/6 ML | s-trans tetra-σ | — | — | — | — | −0.69 | 1.420 | 1.427 | 1.431 |
| s-trans di-π | −0.06 | 1.400 | 1.435 | 1.400 | −0.90 | 1.402 | 1.435 | 1.402 | |
| s-cis di-π | −0.08 | 1.409 | 1.434 | 1.408 | −0.94 | 1.413 | 1.435 | 1.412 | |
| 1/9 ML | s-trans di-π | −0.22 | 1.400 | 1.438 | 1.399 | −1.00 | 1.403 | 1.438 | 1.403 |
| s-cis di-π | −0.22 | 1.404 | 1.441 | 1.404 | −1.00 | 1.407 | 1.441 | 1.407 | |
The peak desorption temperature of 217 K at low coverage (Fig. 2a) corresponds to an adsorption energy of ca. −0.59 eV. In comparison, BD in the di-π states under-binds Cu(111) according to GGA-PBE, but over-binds the surface with ΔE of ca. −0.9 eV according to optB86b-vdW at 1/6 ML. According to the adaptive sum approach of Hensley et al.,30 the optB86b-vdW prediction is more reliable than the GGA-PBE one on account of significant contribution to adsorption by van der Waals interactions. The inclusion of ZPE correction would make ΔE more exothermic by less than −0.1 eV for all three adsorption states. The tetra-σ state has ΔE of −0.69 eV, which is somewhat closer to the TPD results.
The annealing experiments suggests that a BD exposure with the surface at 130 K should give exclusively the chemisorbed molecule. The experimental spectrum in Fig. 4 was obtained at 130 K after the Cu(111) surface at 130 K was exposed to 1.0 L of BD, with the background spectrum also obtained at 130 K. This procedure tends to give better signal-to-noise ratios than in annealing experiments. The resulting spectrum allows additional peaks to be observed, but the general features are the same as in the annealing experiment spectra in Fig. 2. Only the spectral region from 800 to 1650 cm−1 is shown because no identifiable peaks, particularly no peaks in the C–H stretch region, were observed outside this range. The peak at 1236 cm−1 is still the most intense one, but a shoulder is now resolved at 1222 cm−1. Distinct peaks at 1399, 1460 and 1505 cm−1 are seen in Fig. 4, whereas they were broad and unresolved in Fig. 2(b). Compared to the multilayer spectra (Fig. 1 and Fig. S2, ESI†), the most notable difference is the presence of peaks in the 1399–1505 cm−1 range where no IR-active peaks were observed for multilayer BD. Therefore, these peaks are indicative of the perturbed internal bonding of the BD molecule through its interaction with the Cu surface, as manifested by the distinctly different vibrational frequencies.
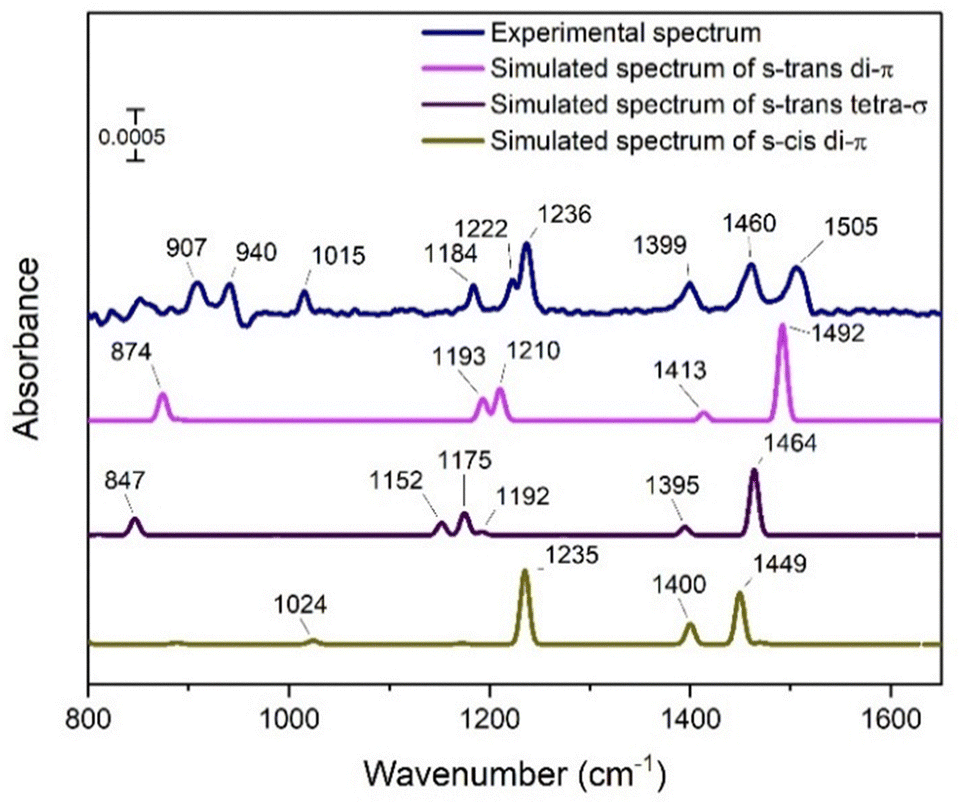 | ||
| Fig. 4 Comparison of experimental and simulated spectra for the s-trans di-π, s-trans tetra-σ and s-cis di-π structures at 1/6 ML as shown in Fig. 3(c)–(e). The experimental RAIR spectrum was obtained by exposing the surface held at 130 K to 1.0 L of 1,3-butadiene. The background spectrum was also obtained at 130 K. The intensities of the simulated spectra have been scaled to match the experimental spectrum. | ||
The observation of the three peaks at 1399, 1460 and 1505 cm−1 in the experimental spectrum contrasts with the simulated spectra where only two peaks are observed in this range for each of the adsorbed states (s-trans and s-cis di-π; s-trans tetra-σ) of BD in Fig. 4. However, since the adsorbed structures are calculated to be quite close in energy, it is plausible that they are all present in the chemisorbed monolayer at certain proportions, with s-trans di-π likely being the dominant state since the s-trans conformation is more stable in the gas phase. The 1492 cm−1 peak for the s-trans di-π structure would correspond to the 1505 cm−1 experimental peak, whereas the 1460 cm−1 experimental peak is assigned to the 1464 cm−1 peak of the s-trans tetra-σ structure or the 1449 cm−1 peak of the s-cis di-π structure. The 1399 cm−1 experimental peak may have unresolved components corresponding to the 1413, 1395, and 1400 cm−1 peaks in the simulated spectra of the s-trans di-π, s-trans tetra-σ, and s-cis di-π BD, respectively. The experimental peaks at 1222 and 1236 cm−1 in the experimental spectra are not well matched to peaks in the simulated spectra for the s-trans di-π or s-trans tetra-σ structures, but they are close to the most intense peak at 1235 cm−1 in the simulated spectra for the s-cis di-π structure. Table 3 summarizes the peak assignments of the experimental spectra of the chemisorbed molecule to the peaks of the three calculated structures.
| Description of mode | Experimental peak | Calculated peak | ||
|---|---|---|---|---|
| s-trans di-π | s-trans tetra-σ | s-cis di-π | ||
| (CH) wag, out-of-plane | 907 | 874 | 847 | — |
| (CH) wag, in-plane | 1184, 1222, 1236 | 1193, 1210 | 1152, 1175, 1192 | 1235 |
| (CH2) scissors + (CH) wag, out-of-plane (out-of-phase) | 1399 | 1413 | 1395 | 1400 |
| (CH2) scissors + (CH) wag, out-of-plane (in-phase) | 1460, 1505 | 1492 | 1464 | 1449 |
The three other peaks labeled in the experimental spectrum at 907, 940, and 1015 cm−1 are weak and are in a region of the spectrum where artefacts are often observed, which makes their assignments uncertain. As the 907 cm−1 peak matches the C–H out-of-plane wag modes of the π species reasonably well, it is included in Table 3, but the 940 and 1015 cm−1 peaks are not.
Regardless of the imperfect match between the experimental and simulated spectra, the most important consideration is that both the experiment and theory yield spectra for the chemisorbed BD that are quite distinct from a weakly adsorbed molecule. It is also significant that both the experimental and simulated spectra agree that there is negligible intensity for the C–H stretches. There are a variety of reasons that could explain why the agreement is not exact. The adsorbate–adsorbate interactions that invariably influence the experimental spectra may not be fully accounted for in the calculations. The simulated spectra are based on harmonic potentials, whereas anharmonicity affects the experimental spectra. The over-binding of the optB86b-vdW functional is a further factor. On balance, however, the comparison in Fig. 4 supports the presence of BD chemisorbed on Cu(111) as a mixture of s-trans di-π, s-trans tetra-σ, and s-cis di-π species.
4. Conclusions
The combination of TPD, RAIRS, and DFT reveals that 1,3-butadiene chemisorbs on Cu(111) in a way that is intermediate from cases of weak physisorption such as on Ag(111) or Au(111), and strong chemisorption as observed on surfaces such as Mo(100), Pd(110), and Pt(111). On the latter surfaces, after chemisorption the molecules dissociates upon heating to leave carbon on the surface. On Ag(111) and Au(111) the RAIRS spectra display frequencies that are essentially the same as for solid 1,3-butadiene indicating that there is little perturbation of the internal bonding of the molecule through interaction with the metal surface. On Cu(111), the interaction is strong enough to give a distinct set of vibrational peaks not observed for the isolated molecule. However, the interaction is weak enough that 1,3-butadiene desorbs from the chemisorbed state without dissociation. Comparison of spectra simulated from DFT calculations with the experimental spectra indicate that 1,3-butadiene chemisorbs as a mixture of s-trans di-π, s-trans tetra-σ, and s-cis di-π species.Author contributions
M. R. H. conducted the experiments and wrote the original draft. A. A. and Y. X. carried out the DFT calculations and contributed to the writing and review of the final manuscript. M. T. contributed to the review and editing of the manuscript, supervised the experimental work, and acquired funding for the project.Conflicts of interest
There are no conflicts to declare.Data availability
Data are available upon request from the author.Acknowledgements
This work was supported by a grant from the National Science Foundation, CHE-2102622. Computational work used high performance computing resources provided by LSU (hpc.lsu.edu).References
- D. Pérez, C. Olivera-Fuentes, S. Curbelo, M. J. Rodríguez and S. Zeppieri, Fuel, 2015, 149, 34–45 CrossRef.
- P. Selvakannan, L. Hoang, V. V. Kumar, D. Dumbre, D. Jampaiah, J. Das and S. K. Bhargava, in Catalysis for Clean Energy and Environmental Stability- Petrochemicals and Refining Processes, ed. K. K. Pant, S. K. Gupta and E. Ahmad, Springer Nature Switzerland, 2021, vol. 2, pp. 205–228 Search PubMed.
- J. A. Alves, S. P. Bressa, O. M. Martínez and G. F. Barreto, J. Ind. Eng. Chem., 2012, 18, 1353–1365 CrossRef CAS.
- S. Chen and B. Yang, Catal. Today, 2020, 347, 134–141 CrossRef CAS.
- V. Maurice and C. Minot, Langmuir, 1989, 5, 734–741 CrossRef CAS.
- G. Bredael, W. Tysoe and F. Zaera, Langmuir, 1989, 5, 899–903 CrossRef CAS.
- J. Chen, J. Catal., 1995, 154, 80–90 CrossRef CAS.
- A. Bhattacharya and D. Pyke, J. Mol. Catal. A: Chem., 1998, 129, 279–285 CrossRef CAS.
- J. Hrbek, Z. Chang and F. M. Hoffmann, Surf. Sci., 2007, 601, 1409–1418 CrossRef CAS.
- N. Osaka, M. Akita and K. Itoh, J. Phys. Chem. B, 1998, 102, 6817–6824 CrossRef CAS.
- S. Katano, S. Ichihara, H. Ogasawara, H. S. Kato, T. Komeda, M. Kawai and K. Domen, Surf. Sci., 2002, 502, 164–168 CrossRef.
- M. J. Weiss, C. J. Hagedorn and W. H. Weinberg, J. Vac. Sci. Technol., A, 2000, 18, 1443–1447 CrossRef CAS.
- A. Valcárcel, A. Clotet, J. M. Ricart, F. Delbecq and P. Sautet, Surf. Sci., 2004, 549, 121–133 CrossRef.
- M. R. Hossain and M. Trenary, J. Phys. Chem. C, 2024, 128, 19204–19209 CrossRef CAS.
- G. Kyriakou, B. B. Matthew, D. J. April, A. L. Emily, J. L. Timothy, E. B. Ashleigh, L. T. Heather, F.-S. Maria and E. C. H. Sykes, Science, 2012, 335, 1209–1212 CrossRef CAS PubMed.
- F. R. Lucci, J. L. Liu, M. D. Marcinkowski, M. Yang, L. F. Allard, M. Flytzani-Stephanopoulos and E. C. H. Sykes, Nat. Commun., 2015, 6, 8550–8556 CrossRef PubMed.
- M. T. Darby, M. Stamatakis, A. Michaelides and E. C. H. Sykes, J. Phys. Chem. Lett., 2018, 9, 5636–5646 CrossRef CAS PubMed.
- G. Giannakakis, M. Flytzani-Stephanopoulos and E. C. H. Sykes, Acc. Chem. Res., 2019, 52, 237–247 CrossRef CAS PubMed.
- J. Liu, M. B. Uhlman, M. M. Montemore, A. Trimpalis, G. Giannakakis, J. Shan, S. Cao, R. T. Hannagan, E. C. H. Sykes and M. Flytzani-Stephanopoulos, ACS Catal., 2019, 9, 8757–8765 CrossRef CAS.
- R. T. Hannagan, G. Giannakakis, M. Flytzani-Stephanopoulos and E. C. H. Sykes, Chem. Rev., 2020, 120, 12044–12088 CrossRef CAS PubMed.
- A. Islam, M. K. Abdel-Rahman and M. Trenary, J. Phys. Chem. C, 2021, 125, 18786–18791 CrossRef CAS.
- J. D. Krooswyk, I. Waluyo and M. Trenary, ACS Catal., 2015, 5, 4725–4733 CrossRef CAS.
- A. Islam, D. L. Molina and M. Trenary, Phys. Chem. Chem. Phys., 2022, 24, 24383–24393 RSC.
- G. Kresse and J. Furthmüller, Phys. Rev. B: Condens. Matter Mater. Phys., 1996, 54, 11169 CrossRef CAS PubMed.
- J. P. Perdew, K. Burke and M. Ernzerhof, Phys. Rev. Lett., 1996, 77, 3865 CrossRef CAS PubMed.
- J. Klimeš, D. R. Bowler and A. Michaelides, Phys. Rev. B: Condens. Matter Mater. Phys., 2011, 83, 195131 CrossRef.
- P. E. Blöchl, Phys. Rev. B: Condens. Matter Mater. Phys., 1994, 50, 17953–17979 CrossRef.
- M. Methfessel and A. T. Paxton, Phys. Rev. B: Condens. Matter Mater. Phys., 1989, 40, 3616–3621 CrossRef CAS.
- M. S. Rahman and Y. Xu, Catal. Today, 2023, 416, 113891 CrossRef CAS.
- A. J. R. Hensley, K. Ghale, C. Rieg, T. Dang, E. Anderst, F. Studt, C. T. Campbell, J.-S. McEwen and Y. Xu, J. Phys. Chem. C, 2017, 121, 4937–4945 CrossRef CAS.
- N. W. Ashcroft and N. D. Mermin, Solid State Physics, Holt, Rinehart and Winston, New York, 1976 Search PubMed.
- C. Kittel, Introduction to Solid State Physics, John Wiley & Sons, Inc., Hoboken, NJ, 2005 Search PubMed.
- J. Neugebauer and M. Scheffler, Phys. Rev. B: Condens. Matter Mater. Phys., 1992, 46, 16067–16080 CrossRef CAS PubMed.
- D. Feller and N. C. Craig, J. Phys. Chem. A, 2009, 113, 1601–1607 CrossRef CAS.
- G. Henkelman, B. P. Uberuaga and H. Jónsson, J. Chem. Phys., 2000, 113, 9901–9904 CrossRef CAS.
- G. Henkelman and H. Jónsson, J. Chem. Phys., 1999, 111, 7010–7022 CrossRef CAS.
- A. Hjorth Larsen, J. Jørgen Mortensen, J. Blomqvist, I. E. Castelli, R. Christensen, M. Dułak, J. Friis, M. N. Groves, B. Hammer, C. Hargus, E. D. Hermes, P. C. Jennings, P. Bjerre Jensen, J. Kermode, J. R. Kitchin, E. Leonhard Kolsbjerg, J. Kubal, K. Kaasbjerg, S. Lysgaard, J. Bergmann Maronsson, T. Maxson, T. Olsen, L. Pastewka, A. Peterson, C. Rostgaard, J. Schiøtz, O. Schütt, M. Strange, K. S. Thygesen, T. Vegge, L. Vilhelmsen, M. Walter, Z. Zeng and K. W. Jacobsen, J. Phys.: Condens. Matter, 2017, 29, 273002 CrossRef PubMed.
- V. E. Bondybey and J. W. Nibler, Spectrochim. Acta A, 1973, A29, 645–658 CrossRef.
- P. A. Redhead, Vacuum, 1962, 12, 203–211 CrossRef CAS.
- G. R. De Maré, Y. N. Panchenko and J. Vander Auwera, J. Phys. Chem. A, 1997, 101, 3998–4004 CrossRef.
- M. Citroni, M. Ceppatelli, R. Bini and V. Schettino, Chem. Phys. Lett., 2003, 367, 186–192 CrossRef CAS.
- K. Kuchitsu, T. Fukuyama and Y. Morino, J. Mol. Struct., 1968, 1, 463–479 CrossRef CAS.
Footnote |
| † Electronic supplementary information (ESI) available. See DOI: https://doi.org/10.1039/d5cp01712b |
| This journal is © the Owner Societies 2025 |