
 Open Access Article
 This Open Access Article is licensed under a Creative Commons Attribution-Non Commercial 3.0 Unported Licence
Proton delocalization in short hydrogen bonds assembling HSeO4− anions into supramolecular adducts†
Roberta
Beccaria
 a,
Andrea
Pizzi
a,
Edem
Chakalov
b,
Giuseppe
Resnati
*a and
Peter
Tolstoy
*b
a,
Andrea
Pizzi
a,
Edem
Chakalov
b,
Giuseppe
Resnati
*a and
Peter
Tolstoy
*b
aNFMLab, Dept. Chemistry, Materials, and Chemical Engineering “Giulio Natta”, Politecnico di Milano, Via L. Mancinelli 7, I-20131 Milano, Italy. E-mail: giuseppe.resnati@polimi.it
bInstitute of Chemistry, St. Petersburg State University, 26 Universitetskii prospect, Petergof, St. Petersburg 198504, Russia. E-mail: peter.tolstoy@spbu.ru
First published on 6th June 2025
Abstract
Four hydrogen-bonded complexes of selenic acid with N-heterocycles (pyridine, 4,4′-bipyridil, quinoline and 2,2,6,6-tetramethylpyperidine) were studied in the crystalline state by single crystal X-ray diffraction, Fourier-transform infrared spectroscopy, and density functional theory with periodic boundary conditions. In all cases short SeO–H⋯OSe hydrogen bonds (≤2.61 Å) were found, either ‘isolated’ ones or within infinite chains. The coherent quasi-adiabatic proton transfer pathways were computed providing broad asymmetric single-well or (low-barrier) double-well potentials with significantly delocalized protons. The ground state vibrationally-averaged proton positions are noticeably shifted from the equilibrium ones towards hydrogen bond centres, and for asymmetric low-barrier double wells, a proton transfer in the first vibrationally excited state is established. The computed O–H stretching frequencies lie in the range of 1600–3050 cm−1 and are in semi-quantitative agreement with experiment. Moreover, in case of low-barrier double-well potentials, a rather exotic H/D isotope effect, namely, a higher vibrational frequency for the O–D stretching than for the O–H stretching, is predicted. The mutual influence of neighboring SeO–H⋯OSe and SeO⋯H–N bonds affecting the bridging proton position in both bonds has also been addressed, indicating the vivid geometric cooperativity in complexes with ‘isolated’ SeO–H⋯OSe hydrogen bonds.
Introduction
Inorganic and hybrid organic–inorganic hydrogen sulphates (HSO4−) and hydrogen selenates (HSeO4−) salts are studied for their proton conductivity or, when they form non-centrosymmetric crystals, for their nonlinear optical properties.1 The phenomenon of proton conductivity is efficient in the presence of an organized hydrogen bond (H-bond) pattern that sometimes assembles two or more anions into supramolecular adducts. For hydrogen selenates, the proton conductivity is facilitated by the formation of H-bonds between neighbouring selenate moieties assembled into dimers or infinite chains. For instance, it was established that in the dimeric selenates of alkali metals, the superprotonic conductivity at relatively low temperatures involves proton transfer along the SeO–H⋯OSe bond as well as proton hops between neighbouring selenate dimers over the dynamically disordered network of H-bonds.2 Both processes are believed to occur via phonon-assisted proton tunneling.3–7Anion⋯anion self-assembly is frequently directed by H-bond,8 and this is typically the case for HSO4−, H2PO4−, and HCO3− anions. Recently, it has been described that also σ-hole interactions can drive anion⋯anion self-assembly,9 and even hybrid motifs have been reported where both H-bonds and σ-hole bonds contribute to the formation of anion⋯anion supramolecular adducts.10 In the Cambridge Structural Database, a non-minor fraction of the structures containing the HSeO4− anion shows the presence of anion⋯anion adducts formed under H-bond control. For instance, SeO–H⋯OSe bonds assemble HSeO4− anions into supramolecular infinite chains in guanidinium,11 2-amino-5-chloropyridinium,12 2-amino-3-nitropyridinium,13 4-benzylpyridinium,14 1,2,4-triazolium15 and imidazolium16 hydrogen selenates, as well as in divalent metal hydrogen selenates M(HSeO4)2 (M = Mg, Zn, Mn).17 Anion⋯anion dimers are instead formed by (ureido)guanidinium,18 di-n-butyl-ammonium19 and tetra-n-alkyl-ammonium1 hydrogen selenates, as well as by alkali metal hydrogen selenates encapsulated within the cavity of 18-crown-6 ether: [18-crown-6·M]HSeO4·H2O (M = Rb, Cs).20
While the number of structures containing the HSeO4− anion is rather small to draw statistically reliable conclusions, it can be surmised that the HSeO4− anion is prone to self-assemble under H-bond control.
The resulting H-bond network plays a key role in the proton conductivity of such materials. In turn, the proton conductivity depends on H-bond strength, on the mutual coupling of neighbouring H-bonds, on the degree of proton delocalization in each H-bond and on the other factors that might alter the proton position. A detailed insight into any and all of these factors would afford useful information for the rational design and functional optimization of the materials containing the HSeO4−⋯HSeO4− supramolecular synthon. In this paper, we aimed to focus on the degree of proton delocalization within the O–H⋯O bond and the resulting facilitation of proton transfer along it. The study was started by preparing four hybrid organic–inorganic hydrogen selenates 1a·2a, 1a·2b, 1a·1b·2c and 1a·2d (see Scheme 1). Single crystal X-ray analyses showed the presence of the SeO–H⋯OSe bonds in all four salts, proving that H-bond can drive the self-assembly of HSeO4− anions when the cation (a protonated nitrogen base) is either aromatic or aliphatic.
 | ||
| Scheme 1 Structural formulas of components in obtained crystals. | ||
The paper is organized as follows. Firstly, we describe the X-ray structures of the studied crystals. Secondly, we turn to the density functional theory (DFT) calculations with periodic boundary conditions (PBC) in order to construct a model for investigation of proton dynamics. Thirdly, we calculate the quasi-adiabatic potentials for proton transfer in order to describe the effects of proton delocalization. Fourthly, we predict anharmonic vibrational frequencies of the SeO–H stretching modes and the corresponding H/D isotope effects on them, which might be used to characterize the potential of the bridging hydron (proton or deuteron) transfer, and discuss the experimental Fourier-transform infrared (FT-IR) spectra. Finally, we concisely outline cooperativity effects of the coupled SeO–H⋯OSe and SeO⋯H–N bonds and the interdependence of bridging proton positions in both bonds.
Results and discussion
X-ray: H-bond network in crystal packing
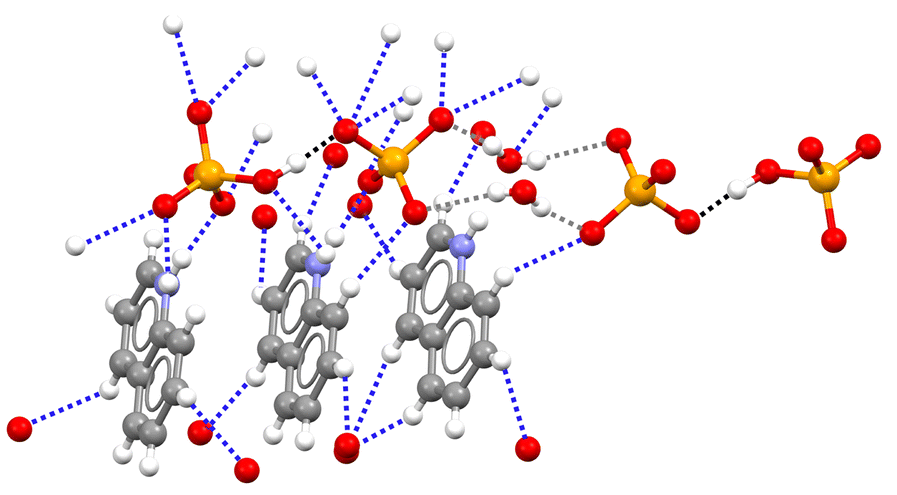
The pyridinium hydrogen selenates 1a·2a and the 4,4′-bipyridinium analogue 1a·2b crystallize in the monoclinic C2/c space group and their overall crystal packing show some similarities (see Fig. 1). Cations and anions are held in their position by the electrostatic attraction between their opposite charges and by a network of the N–H⋯O and C–H⋯O bonds involving the pyridinium moiety. As expected, the former interactions are shorter than the latter, the N…O separations of the N–H⋯O bonds are 2.717 Å in 1a·2a and 2.644 Å in 1a·2b, while the mean values of the C…O separations of the C–H⋯O bonds are 3.343 Å and 3.362 Å, respectively. Importantly, in both 1a·2a and 1a·2b crystals, the HSeO4− anions are assembled into infinite H-bonded supramolecular chains. As H-bonding occurs between anions, i.e. entities with the same net charge, such hydrogen bonds were called ‘anti-electrostatic’ in the literature.21 Close contacts between anions and cations contribute to disperse the anion negative charge, allowing for short SeO–H⋯OSe bonds: 2.610 Å in 1a·2a and 2.605 Å in 1a·2b. | ||
| Fig. 1 Partial view of the H-bonded anion chains in 1a·2a (top) and 1a·2b (bottom); one cation unit is also shown. H-bonds formed by the cation and one anion unit are indicated; those assembling the supramolecular anion chain are black dotted lines; those between cation and anion units are blue dotted lines. Colour code: grey, carbon; whiteish, hydrogen; red, oxygen; indigo, nitrogen; orange, selenium. | ||
The salt 1a·1b·2c crystallizes in the triclinic P![[1 with combining macron]](https://www.rsc.org/images/entities/char_0031_0304.gif) space group. The cation–anion assembly is secured by a tight net of the N–H⋯O and C–H⋯O bonds as in 1a·2a and 1a·2b, while the anion⋯anion assembly is different from that of the two hydrogen selenates discussed above. The HSeO4− and SeO42− anions 1a and 1b form H-bonded dimers. Two such dimers further couple back-to-back via two water molecules bridging the SeO42− units (see Fig. 2). Interestingly, the O…O separation in the SeO–H⋯OSe supramolecular synthon which forms the anion dimers in 1a·1b·2c is 2.538 Å long, namely, it is even shorter than in 1a·2a and 1a·2b. This is rather counterintuitive as it may be expected that the Coulombic repulsion in an anion⋯dianion adduct is greater than in anion⋯anion adducts. However, this distance is similar to those reported for dimers formed by doubly negatively-charged anions such as HPO42− or HAsO42−.21 The short distance observed in 1a·1b·2c salt is probably related to the pronounced acidic character of HSeO4− (pKa ∼ 1.9) in combination with the marked basic behaviour of SeO42− (pKb ∼ 12).
space group. The cation–anion assembly is secured by a tight net of the N–H⋯O and C–H⋯O bonds as in 1a·2a and 1a·2b, while the anion⋯anion assembly is different from that of the two hydrogen selenates discussed above. The HSeO4− and SeO42− anions 1a and 1b form H-bonded dimers. Two such dimers further couple back-to-back via two water molecules bridging the SeO42− units (see Fig. 2). Interestingly, the O…O separation in the SeO–H⋯OSe supramolecular synthon which forms the anion dimers in 1a·1b·2c is 2.538 Å long, namely, it is even shorter than in 1a·2a and 1a·2b. This is rather counterintuitive as it may be expected that the Coulombic repulsion in an anion⋯dianion adduct is greater than in anion⋯anion adducts. However, this distance is similar to those reported for dimers formed by doubly negatively-charged anions such as HPO42− or HAsO42−.21 The short distance observed in 1a·1b·2c salt is probably related to the pronounced acidic character of HSeO4− (pKa ∼ 1.9) in combination with the marked basic behaviour of SeO42− (pKb ∼ 12).
 | ||
| Fig. 2 Partial view of the crystal packing in 1a·1b·2c showing two anion⋯dianion dimers linked by two bridging water molecules. Three quinolinium units are shown, which are involved in the tight net of H-bonds with both 1a anion and 1b dianion; H-bonds forming anion⋯dianion dimers are black dotted lines, anion⋯water H-bonds are grey dotted lines, other H-bonds are blue dotted lines. Colour code as in Fig. 1. | ||
Of note, in these three structures, π-stacking interactions between aromatic moieties favour the formation of distinct cationic and anionic regions, and thus the anion⋯anion pairing.
Similar to the three salts described above, in the 2,2,6,6-tetramethylpyperidinium hydrogen selenate 1a·2d (monoclinic space group P21/n), a tight network of C–H⋯O and N–H⋯O bonds contributes to locking cations and anions in their position. The ability of HSeO4− unit to act as both donor and acceptor of H-bonds, i.e. its amphoteric character, is robust enough to drive the self-assembly of two HSeO4− units into a supramolecular dimer with ‘dangling’ SeO–H bond. A water molecule further bridges the two HSeO4− units of this dimer and an H-bonded cyclic array is produced. Two such cyclic arrays are linked together via their respective water molecules (see Fig. 3). The O…O separation is 2.590 Å in the anion⋯anion H-bond, while the mean value of the O…O separations in the anion⋯water H-bonds is 2.748 Å.
 | ||
| Fig. 3 Partial view of the anion supramolecular assemblies in 1a·2d. H-bonds formed by anions with another anion, with a cation, and with water are black, blue, and grey dotted lines, respectively. Colour code as in Fig. 1. | ||
X-ray crystallographic data can hardly provide a realistic description of the degree of delocalization of the hydrogen atoms involved in the anion⋯(di)anion H-bonds. As the quantum nature of proton plays profound role in the H-bonding and proton transfer processes, a firm cooperation between experimental and theoretical methods is required in order to achieve deeper insight into both phenomena. In the following subsections we describe the results of our DFT computations with PBC for the reported structures aiming to understand the bridging proton dynamics and cooperativity effects of neighbouring H-bonds.
Fully optimized crystal structures: comparison with experiment
The optimized crystal structures stay very similar to the experimental ones and their overall bonding motif is preserved (visual comparison between X-ray and DFT data is given in Fig. S1–S4 in ESI†). All four crystals are composed of large unit cells with low point group symmetry: 4 symmetry operators for 1a·2a and 1a·2b, 2 symmetry operators for 1a·1b·2c and 1a·2d. All structures are held by various non-covalent interactions exhibiting broad range of lengths and strengths: (i) dominating O–H⋯O and N–H⋯O interactions, (ii) π-stacking-type dispersive interactions between protonated aromatic N-heterocycles (pyridine, 4,4′-bipyridil and quinoline in 1a·2a, 1a·2b, and 1a·1b·2c, respectively), and (iii) numerous additional C–H⋯O contacts. The SeO–H⋯OSe bonds are fairly linear (the OHO angles cover the 169°–176° range) and are formed along the directions of the expected lone pair localizations on the proton-accepting O atoms.The equilibrium O…O separation of 2.512–2.544 Å can be considered as the boundary between moderate and short strong H-bonds.22 A similar O…O separation of 2.54 Å was observed in the crystal structures of H-bonded dimeric selenates of alkali metals: experimentally in Cs3L(SeO4)2 (L = H/D) by Matsui et al.6,7 and computationally in Rb3H(SeO4)2 by Pavlenko et al.5
In 1a·2a and 1a·2b, the infinite chains of HSeO4− anions are assembled by the O–H⋯O bonds along the crystallographic b axis. Together with cations, they form a herringbone structure (see Fig. 4); in the crystals, neighbouring herringbone structures are antiparallel. 1a·1b·2c and 1a·2d feature ‘isolated’ H-bonds between selenate moieties. These bonds are formed between SeO42− and HSeO4− (1a·1b·2c) or between two HSeO4− ions (1a·2d). In both structures there are also H-bonds with water molecule that occurs once per the irreducible fragment (see Fig. 5).
 | ||
| Fig. 4 Optimized structures of 1a·2a and 1a·2b (for clarity, chain fragments are shown). Colour code: grey, carbon; whiteish, hydrogen; red, oxygen; blue, nitrogen; orange, selenium. | ||
 | ||
| Fig. 5 Optimized structures of 1a·1b·2c and 1a·2d (for clarity, irreducible fragments are shown). Colour code as in Fig. 4. | ||
The lattice parameters for the minimum-energy and X-ray crystal structures of 1a·2a, 1a·2b, 1a·1b·2c and 1a·2d along with percent changes between them are listed in Table 1. Although the packing and structural arrangement is generally well reproduced, the optimized cell volumes are noticeably smaller than the experimental ones (net contraction from 5.9% for 1a·2d to 9.5% for 1a·2b). The factors affecting this can be arranged into the following clauses.
| 1a·2a | 1a·2b | 1a·1b·2c | 1a·2d | |||||||||
|---|---|---|---|---|---|---|---|---|---|---|---|---|
| X-ray | B3LYP-D3 | Δ | X-ray | B3LYP-D3 | Δ | X-ray | B3LYP-D3 | Δ | X-ray | B3LYP-D3 | Δ | |
| a Space group. b Number of irreducible atoms. c Total number of atoms in the unit cell. | ||||||||||||
| SGa | Monoclinic C2/c | Monoclinic C2/c | Triclinic P |
Monoclinic P21/n | ||||||||
| NIAb | 18 | 17 | 68 | 75 | ||||||||
| TNAc | 72 | 68 | 136 | 300 | ||||||||
| a | 19.8196(2) | 19.5524 | −1.3 | 18.0562(2) | 18.0958 | +0.2 | 9.91309(16) | 9.66092 | −2.5 | 15.70227(9) | 14.97982 | −4.6 |
| b | 6.26820(10) | 5.94464 | −5.2 | 5.15783(5) | 5.03361 | −2.4 | 10.3638(2) | 10.2068 | −1.5 | 10.12297(5) | 9.79767 | −3.2 |
| c | 13.2167(2) | 12.6145 | −4.6 | 16.9795(2) | 16.2880 | −4.1 | 14.6046(3) | 14.1464 | −3.1 | 16.96831(9) | 17.32988 | +2.1 |
| α | 90.0 | 90.0 | 90.0 | 90.0 | 76.9481(16) | 75.6802 | −1.6 | 90.0 | 90.0 | |||
| β | 109.0590(10) | 106.7255 | −2.1 | 115.2773(14) | 117.5110 | +1.9 | 89.2209(14) | 91.8124 | +2.9 | 102.9938(6) | 103.5649 | +0.6 |
| γ | 90.0 | 90.0 | 90.0 | 90.0 | 71.1833(16) | 70.4968 | −1.0 | 90.0 | 90.0 | |||
| V | 1551.95 | 1404.18 | −9.5 | 1429.91 | 1315.86 | −8.0 | 1380.70 | 1264.04 | −8.4 | 2628.11 | 2472.51 | −5.9 |
(i) The studied crystals are held together by networks of H-bonds, in which heavy atoms are subject to displacements under the influence of weak intermolecular forces. In calculations, these forces are reproduced with varying degrees of precision and thus the optimized H-bond lengths are among the most fluxional structural parameters. Thus, for 1a·2a, the largest unit cell dimension change is observed along the b axis, which is mostly parallel to the chain of O–H⋯O bonds. In contrast, for 1a·2b, the largest unit cell dimension change is due to adjustments of N–H⋯O bonds, which extend along the c axis (see Table 1). Nevertheless, the full geometry optimization should be imperative as it ensures the optimized crystal structures to become true minima on the potential energy surface (PES).
(ii) Our DFT calculations were performed at an effective temperature of 0 K neglecting the presence of zero-point motions (for re-introduction of these motions in the SeO–H⋯OSe bonds, vide infra), whereas the experimental crystal structures were obtained at 298 K and thus the atomic positions are affected by the non-negligible thermal diffuse scattering effects. As a consequence, theoretical prediction of the crystal volume is expected to be smaller with respect to the experimental one, as was shown by the estimated thermal expansion for various systems, ranging between 1 and 8% from 0 K to room temperature.23–25 Acknowledging that single crystal X-ray diffraction may not be particularly tailored for proton localization, we recollected some of the structures at 100 K for further confirmation of the data obtained at 298 K and showcasing the unit cell volume contraction (see Tables S1–S7, ESI†). Of note, 1a·2b undergoes transition into a different polymorphic phase at 100 K, where the supramolecular motif of the H-bonded HSeO4− infinite chains is fully maintained. This observation confirms the robustness of the synthon and hence the reliability of proton localization in this motif.
(iii) As the B3LYP functional in general poorly models weak long-range van der Waals interactions,26,27 this deficiency is compensated here by a mandatory inclusion of a posteriori empirical corrections for dispersive forces via the Grimme's approach.28–30 These corrections, however, are known for their propensity to overestimate long-range attractive forces (see, e.g., recent ref. 31 and 32), possibly causing an underestimation of the lattice parameters in comparison with experiment. Further system-dependent tuning of the dispersion parameters could help to achieve results closer to experimental ones as demonstrated by Civalleri et al.;33 nevertheless, this was not pursued here in order to present a systematic study with consistent parameters across all the studied systems.
In this light, the observed deviations of the cell parameters can be considered acceptable.
QTAIM analysis of the SeOH⋯OSe bonds
For charge-assisted H-bonds, the topological properties of the electron density and various functions derived from it at the bond critical point (BCP) of the (3, −1) type are of particular interest as they provide valuable information on the very chemical nature of the interatomic interaction.34 For 1a·2a, 1a·2b, 1a·1b·2c and 1a·2d, the values of the electron density and its Laplacian, ρbcp and ∇2ρbcp, the local electron kinetic, potential and total energy densities, Gbcp, Vbcp, and Hbcp, and the bond degree index, Hbcp/ρbcp, at the SeO–H⋯OSe intermolecular BCPs are listed in Table 2.| 1a·2a | 1a·2b | 1a·1b·2c | 1a·2d | |
|---|---|---|---|---|
| ρ bcp | 0.0728 | 0.0725 | 0.0829 | 0.0715 |
| ∇2ρbcp | 0.1401 | 0.1437 | 0.1363 | 0.1454 |
| G bcp | 0.0592 | 0.0595 | 0.0650 | 0.0592 |
| V bcp | −0.0834 | −0.0830 | −0.0959 | −0.0820 |
| |Vbcp|/Gbcp | 1.4085 | 1.3959 | 1.4754 | 1.3858 |
| H bcp | −0.0242 | −0.0235 | −0.0309 | −0.0228 |
| H bcp/ρbcp | −0.3323 | −0.3249 | −0.3727 | −0.3193 |
| E OHO | 66.69 | 66.99 | 73.18 | 66.68 |
The SeO–H⋯OSe bonds are characterized by 0.10 > ρbcp > 0.06 a.u. and ∇2ρbcp > 0 a.u., which corresponds to the transition region separating the closed-shell (non-covalent) and shared (covalent) interatomic interactions.37–39 On the one hand, relatively high values of ρbcp indicate a significant overlap of the closed shells of hydrogen and oxygen atoms.40,41 On the other hand, positive values of ∇2ρbcp are a signature of non-covalent interactions.42 These findings are in accordance with the relative values of the local electron kinetic and potential energy densities, as well as the bond degree index. Namely, inequalities 2 > |Vbcp|/Gbcp > 1 and Hbcp/ρbcp < 0 are also indicative of the character of the H-bonds, intermediate between covalent and non-covalent interactions.37,43 This is further confirmed by the H-bond energies, EOHO (see Fig. 6), estimated from the Gbcp values.35,36EOHO values are around 70 kJ mol−1 and are close to each other: the span is only 6.5 kJ mol−1. This allows us to firmly classify such H-bonds as moderately strong ones. For completeness, the 2D maps of ρ and ∇2ρ around the SeO–H⋯OSe bonds for all four studied systems in their equilibrium geometries are shown Fig. S5 and S6 (ESI†).
 | ||
| Fig. 6 The optimized H-bond interatomic distances (in Å) for 1a·2a, 1a·2b, 1a·1b·2c and 1a·2d. The values of the SeO–H⋯OSe bond energies, EOHO, estimated from the local electron kinetic energy density values at BCP, Gbcp, are given below the structures. | ||
In order to provide a more complete picture of the non-covalent interactions in the studied systems, we additionally performed a comparative QTAIM analysis of the anion⋯cation and anion⋯water interactions within the H-bond networks, as well as the π-stacking type C⋯C and C⋯N dispersive interactions between aromatic cation units (see Fig. S7 and the following discussion in ESI†).
Delocalization of bridging hydrons within the SeOH(D)⋯OSe bonds
In this subsection we focus on the bridging proton quantum delocalization within the SeO–H⋯OSe bonds, additionally exploring the changes in the H-bond geometry and bridging particle delocalization, caused by proton–deuteron substitution.Here, we consider the proton delocalization as the result of its motion in an effective potential along a proton transfer reaction coordinate. The latter was chosen for the following considerations.
The bridging proton position and the heavy atom distance are closely linked to each other,44 which is manifested, for example, by the quite strong coupling between the ν(O–H) and νσ(OH…O) vibrational modes.45 This means that neither the displacement of the proton with fixed heavy atoms, nor the displacement of heavy atoms with fixed O…H distance are good candidates for the reaction coordinate. A more realistic choice is given by so-called quasi-adiabatic pathway46 along which the light proton position is adjusted ‘on a fly’ to the instantaneous heavy atom positions, in a sort of Born–Oppenheimer separation of nuclear from electronic motions. Thus, we modelled the bridging proton transfer by changing the O…H distance r1 in a step-wise fashion and optimizing all the other geometric parameters, including the H…O distance r2. As the calculations were performed with PBC, all symmetry-related bridging protons were displaced simultaneously. Such process can be called coherent or synchronous proton transfer (previously studied experimentally, e.g., by Fillaux et al.47–52) and in the case of the H-bonded HSeO4− infinite chains mentally visualized as an infinite Newton's cradle. To the best of our knowledge, this is the first time such an approach has been employed in the solid-state simulations.
Previously, the anharmonic O–H stretching in periodic systems was treated as a non-adiabatic bridging particle transfer with O–H distance as a pure normal coordinate decoupled from the manifold of all other modes (mostly in crystals and slabs, see, e.g., ref. 53–60). A more sophisticated – albeit prohibitively demanding – treatment of the correlation between the O–H and O…O distances via solving a two-dimensional vibrational problem (see, e.g., ref. 61–65) is beyond the thrust of this paper.
In the following, the resulting reaction was expressed as a proton motion along the q1 ≡ 0.5·(r1 − r2) coordinate, which is accompanied by the corresponding adjustments of the overall O⋯O distance, q2 ≡ (r1 + r2). The calculated 1D potentials, U(q1), along the q1 coordinate for 1a·2a, 1a·2b, 1a·1b·2c and 1a·2d are shown in Fig. 7 and 8 together with the zero-point energy (ZPE) and the first excited state energy levels, ε|0〉 and ε|1〉 (hereafter, we refer to them as |0〉 and |1〉 vibrational states, respectively), squares of corresponding vibrational wave functions, Ψ|0〉2(q1,L) and Ψ|1〉2(q1,L), L = H/D, as well as fundamental transition frequencies, ν01, for O–H stretching. For more on solution of the vibrational problem see DFT calculations subsection. Note that ZPE values correspond to only one vibrational mode, namely, OH/OD stretching mode in the irreducible part of the unit cell. Similar plots including the data for bridging deuterons are shown in Fig. S8 and S9 (ESI†), while the geometrical parameters of the H-bonds and relative total energies per unit cell at each q1 point are summarized in Tables S8–S11 (ESI†).
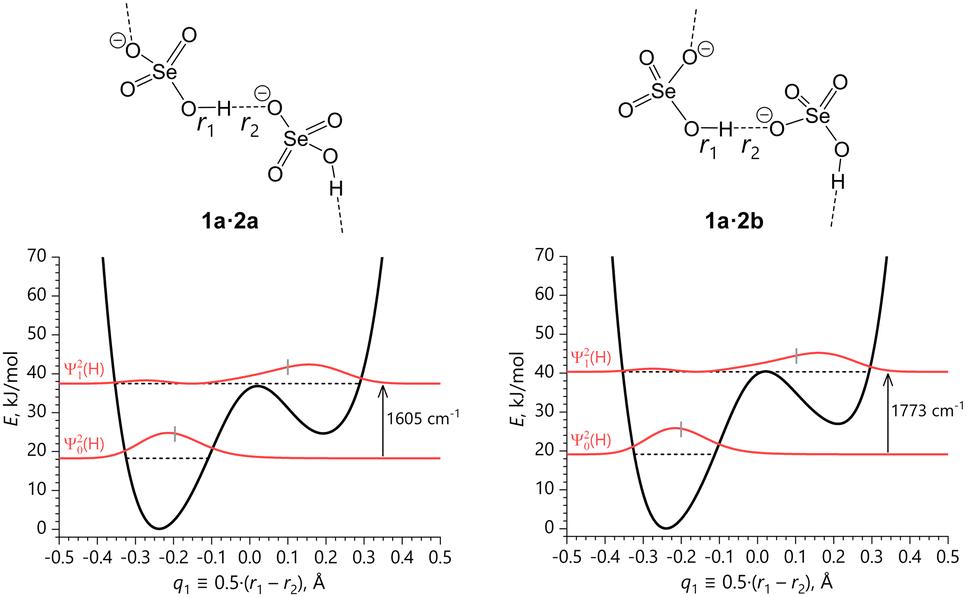 | ||
| Fig. 7 Asymmetric double-well potentials of the coherent quasi-adiabatic transfer of the bridging protons within the infinite SeO–H⋯OSe bond chains along the q1 coordinate with the corresponding |0〉 and |1〉 vibrational states (horizonal dashed lines at ε|0〉 and ε|1〉) and fundamental transition frequencies pertaining to 1a·2a and 1a·2b. Short grey vertical bars indicate the vibrationally-averaged positions of the proton q1 coordinate. | ||
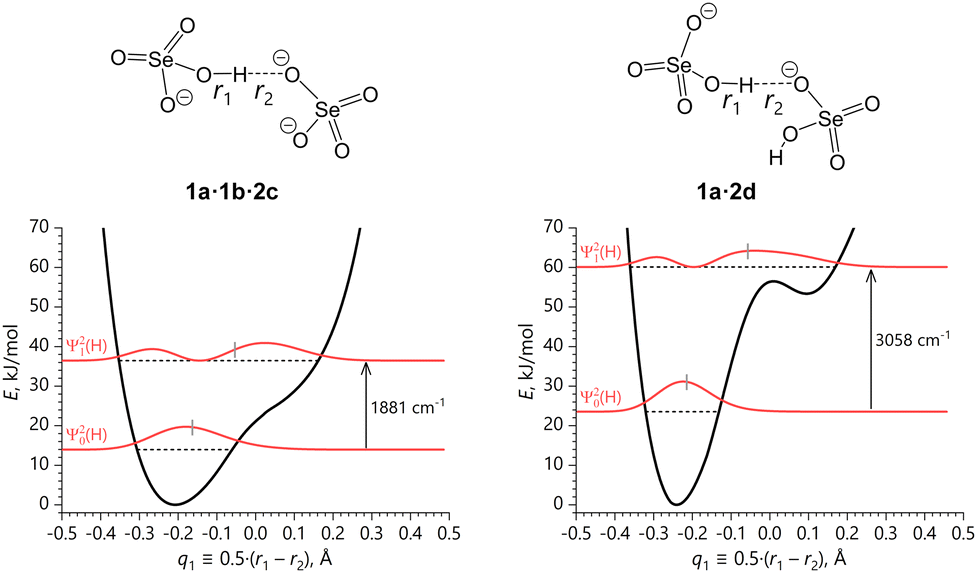 | ||
| Fig. 8 Asymmetric single-well potentials of the coherent quasi-adiabatic transfer of the bridging protons within the ‘isolated’ SeO–H⋯OSe bonds along the q1 coordinate with the corresponding |0〉 and |1〉 vibrational states (horizonal dashed lines at ε|0〉 and ε|1〉) and fundamental transition frequencies pertaining to 1a·1b·2c and 1a·2d. Short grey vertical bars indicate the vibrationally-averaged positions of the proton q1 coordinate. | ||
The two cases of 1a·2a and 1a·2b (see Fig. 7) featuring infinite H-bond chains are very similar to each other and exhibit bridging proton delocalization in the asymmetric double-well potential, where two energy minima are separated by a barrier which is barely as high as the first vibrationally excited level. The potentials do not show two wells of equal depth because of the asymmetry in crystal packing of selenates and cations. The shape of Ψ|0〉2(q1,H) indicates that in the ground state the bridging proton is localized in the left potential well (q1 < 0), while in the first excited state it is localized in the right well (q1 > 0), though the Ψ|1〉2(q1,H) is quite broad, has a node and a second maximum at negative q1.
From the energy difference between lowest two energy levels, i.e. ν01 frequencies, it follows that the |0〉 states, being localized in the deeper well, are by far the largest contributors in thermal equilibrium at temperatures around 300 K: the Boltzmann populations of |0〉 states are p|0〉 = 0.9995 for 1a·2a and p|0〉 = 0.9998 for 1a·2b, i.e. the populations of |1〉 states remain negligible. At the same time, it means that vibrational excitation (optical phonon excitation) could lead to multiple synchronous proton transfers within the crystal, without large amplitude librations of the SeO4 tetrahedra and molecular cations that would exchange the roles of proton-donating and proton-accepting oxygen atoms (i.e. without the ‘flip’ of the double-well potential itself). Furthermore, the density distributions of the first excited states, Ψ|1〉2(q1,H), are predominantly localized in the shallower well in proximity of the barrier top in both cases, which means that energy of the |1〉 states is high enough to allow for energy-free ‘cross’ transitions between the two possible off-centre sites, as suggested by the non-negligible probability distribution in the deeper well. A similar description is valid for bridging deuterons (see Fig. S8, ESI†), though the vibrationally excited wave function Ψ|1〉2(q1,D) is more smeared over two local minima.
We propose therefore that the bridging hydrons in 1a·2a and 1a·2b ought not to be regarded as moving independently in individual double-well potentials, but as participating in a collective mode that is promoted by a vibrational perturbation. This mode is the coherent hydron transfer from the more stable configuration SeO–H(D)⋯OSe to the vibrationally excited configuration SeO⋯H(D)–OSe. The latter also meets the spatial periodicity of the crystal lattice and has a limited lifetime.
The SeO–H⋯OSe bond in 1a·1b·2c is shorter than in 1a·2a or 1a·2b and the barrier between the two potential minima is absent, making the proton transfer potential an asymmetric single-well shown in Fig. 8, left. In comparison with 1a·2a and 1a·2b, the broader potential minimum corresponds to a more delocalized |0〉 state with wider Ψ|0〉2(q1,H) distribution along the q1 coordinate. Despite the absence of the second potential minimum, due to the asymmetry of the potential the average proton position in the first excited state is substantially shifted towards the accepting oxygen atom, and the most probable proton position (i.e. the maximum of Ψ|1〉2(q1,H)) is located virtually in the H-bond centre, making it effectively a central-symmetric H-bond with a shared proton. A similar observation remains true for the bridging deuterons (see Fig. S9, left, ESI†), though the domain spanned by the vibrationally excited wave function Ψ|1〉2(q1,D) is more contracted as opposed to the case of 1a·2a and 1a·2b.
Finally, the SeO–H(D)⋯OSe bond potential in 1a·2d incorporates the features outlined in the preceding three potentials, possessing a second local minimum – though an utmost shallow – as in 1a·2a and 1a·2b, but a rather steep potential shape along the q1 coordinate, making the Ψ|1〉2(q1,H) distribution akin to the one in the single-well potential in 1a·1b·2c (see Fig. 8, right). This leads to the dramatically high ν01 frequency of the O–H stretching mode featuring pronounced negative anharmonicity66 in comparison with the shallower harmonic potential, and to the narrowest Ψ|0〉2(q1,H) distribution in the series (vide infra).
Let us now summarize how the motions of the three atoms forming OLO bridges (L = H/D) influence the effective H-bond geometry. The four studied crystals vary from each other in the H-bond length, which is determined by the crystal packing and the positioning of the counterions. However, there are also three important common features.
(i) Account for hydron delocalization yields quantum-mechanically induced contraction and symmetrization of the SeO–L⋯OSe bond (see Fig. 9 and Table 3, Table S12, ESI†). The heavy atom distance decreases by 0.05–0.09 Å, while the bridging proton shifts ca. 0.08 Å closer to the H-bond centre.
 | ||
| Fig. 9 Effects of the bridging hydron delocalization on the SeO–L⋯OSe (L = H/D) bond geometry in 1a·2a, 1a·2b, 1a·1b·2c and 1a·2d. The FWHM for the Ψ|0〉2(H) and Ψ|0〉2(D) distributions is given in Å. | ||
| X-ray | B3LYP-D3 (equilibrium distances) | B3LYP-D3 (|0〉 vibrationally-averaged distances) | |||||
|---|---|---|---|---|---|---|---|
| O…O | O…O | O–H | H…O | 〈O…O〉 | 〈O–H〉 | 〈H…O〉 | |
| 1a·2a | 2.610 | 2.544 | 1.034 | 1.510 | 2.518 | 1.064 | 1.457 |
| 1a·2b | 2.605 | 2.543 | 1.032 | 1.511 | 2.512 | 1.059 | 1.461 |
| 1a·1b·2c | 2.538 | 2.512 | 1.049 | 1.463 | 2.492 | 1.084 | 1.411 |
| 1a·2d | 2.590 | 2.537 | 1.028 | 1.509 | 2.523 | 1.050 | 1.479 |
(ii) Due to significant anharmonicity of the potentials, the main effect of replacing deuteron over proton is a shift of the Ψ|0〉2(q1,D) maxima towards the energy minimum (see grey vertical bars in Fig. S8 and S9, ESI†), leading to the negative primary geometric isotope effect (primary GIE):
| Δ〈q1〉 = 〈qD1〉 − 〈qH1〉 < 0, |
| Δ〈q2〉 = 〈qD2〉 − 〈qH2〉 > 0. |
(iii) As quantum-mechanical property of deuteron is suppressed in comparison with proton, the full width at half maximum (FWHM) for Ψ|0〉2(q1,D) is smaller than that for Ψ|0〉2(q1,H), i.e. deuteron is less delocalized than proton.
In the following section we discuss the optical spectral manifestations of the delocalized SeO–H(D)⋯OSe bridging protons (deuterons) on the basis of the calculated anharmonic stretching frequencies, and compare them with the experimental FT-IR spectra.
Anharmonicity of the vibrational O–H(D) frequencies
The broad and strongly anharmonic shapes of the bridging hydron potentials (some with low barriers and shallow second minima) lead to the following three interesting phenomena.(i) Extreme difference between harmonic and anharmonic ν(O–L) frequencies. On the one hand, the bottom wells of the calculated potentials are rather broad, even for the narrowest one in 1a·2d, so already the DFT-calculated harmonic O–L stretching frequencies, νharm(O–L), are low enough to indicate that the intermolecular SeO–L⋯OSe bonds in all considered crystals are quite strong,44,69 in accordance with the equilibrium geometries and QTAIM analysis. On the other hand, taking into account the anharmonicity lowers the frequencies even further (see νanharm(O–L) in Table 4); these values were obtained from Ugliengo's ANHARM code70 as described in the ESI,† below Table S13. However, these values are still higher than those obtained using the full shape of the hydron stretching potentials (see ν01(O–L) in Table 4). This is understandable, since the position of the first excited level is strongly influenced by the shape of the stretching potential far from the equilibrium, i.e. the overall shape of the potential on the other side of the H-bond being apparently the strongest influence.
| 1a·2a | 1a·2b | 1a·1b·2c | 1a·2d | |
|---|---|---|---|---|
| a Δν(O–L) ≡ ν01(O–L) − νanharm(O–L). | ||||
| ν harm(O–H) | 2581 | 2616 | 2373 | 2742 |
| ν anharm(O–H) | 1806 | 1863 | 1814 | 2231 |
| ν 01(O–H) | 1605 | 1773 | 1881 | 3058 |
| ν harm(O–D) | 1894 | 1918 | 1752 | 2000 |
| ν anharm(O–D) | 1454 | 1501 | 1408 | 1721 |
| ν 01(O–D) | 1650 | 1828 | 1484 | 2638 |
| Δν(O–H)a | -201 | -90 | 67 | 828 |
| Δν(O–D)a | 196 | 327 | 76 | 917 |
It is of interest to overlay the calculated vibrational frequencies with the experimental FT-IR absorption spectra (see Fig. S10–S13, ESI†), recorded for powder samples of four studied crystals between 4000 and 400 cm−1 at 298 K (the region 1900–2500 cm−1 is omitted due to the strong absorption of the diamond UATR crystal). In the range 3500–1500 cm−1, all spectra show several broad absorptions of selenate OH groups, countercation NH groups, as well as water molecules (in case of 1a·1b·2c and 1a·2d). The positions and shapes of many of these bands are hard to discern, especially for exceedingly broad bands of OH groups involved in short and strong H-bonds.
Nevertheless, the overall shapes of the experimental spectra (more precisely, the part appearing due to the stretching vibrations of bridging protons) are reasonably consistent with the calculated vibrational frequencies, as shown in Fig. S10–S13 (ESI†): for visual clarity, Lorentzian lineshapes with arbitrary integral intensities were placed as red and blue traces at ν01(O–H) and νanharm![[thin space (1/6-em)]](https://www.rsc.org/images/entities/char_2009.gif) av.(N–H) wavenumbers, respectively.71
av.(N–H) wavenumbers, respectively.71
For each system the νanharmav.(N–H) values were calculated as mean ones over ungerade νanharmav.(N–H) frequencies, computed for all unique SeO⋯HN bonds: one in 1a·2a and 1a·2b, three in 1a·1b·2c, and four in 1a·2d, see Table S14 (ESI†). As expected from the equilibrium distances, the anharmonic N–H stretching frequencies decrease in the 1a·2d → 1a·2a → 1a·2b → 1a·1b·2c sequence. Judging from the experimental band shapes in the region 3000–2500 cm−1, the NH band is probably strongly structured, especially for 1a·2a and 1a·2d. Apart of that, evidently, the bands of the ν(N–H) modes are superimposed with the characteristic and quite intensive bands of ν(C–H) modes (2750–3150 cm−1 region) and, in the spectra of 1a·1b·2c and 1a·2d, also by the ν(O–H) bands of structural water molecules (3250–3650 cm−1 region).
The presence of extremely broad OH band manifests itself mostly as a raised background around 2000 cm−1 and below, matching reasonably well (semi-quantitatively) with the region where our calculations of delocalised protons place the ν01(O–H) transitions, shifting to lower frequencies in the 1a·2d → 1a·1b·2c → 1a·2b → 1a·2a order. It is worth noting that for 1a·2a, 1a·2b, and 1a·2d, some of the band broadening likely stems from the Fermi resonance between the ν01(O–H) and γ02(O–H), δ02(O–H) modes (i.e. between the fundamental of stretching vibration and the overtone of the bending modes), which was shown by Ikeda et al. to be a common phenomenon for OHO bonds with the length of ∼2.6 Å in a solid state.72,73
The most unexpected result is obtained for 1a·2d. The spectrum shows a unique asymmetric absorption band around 3150–2500 cm−1 with complex structure and the absorption maximum at 3019 cm−1, which matches well with the calculated the ν01(O–H) value of 3058 cm−1, arising from one of the SeO–H⋯OSe stretching modes with negative anharmonicity, meaning that both νharm(O–H) = 2742 cm−1 and νanharm(O–H) = 2231 cm−1 frequencies are considerably lower. On the contrary, the calculated the νanharm(O–H) frequency for the SeO–H⋯Owater stretching (1720 cm−1) in 1a·2d seems to be in a good agreement with the experimental spectrum, see Table S15 and Fig. S13 (ESI†).
Thereby, we conclude that a reasonable agreement between observed and calculated vibrational stretching frequencies of the short and moderately strong SeO–H(D)⋯OSe bonds requires thorough account of the bridging proton (deuteron) transfer dynamics extending virtually from one oxygen site to another.
For reference, all computed harmonic wavenumbers, IR and Raman intensities, and band assignments are summarized in Tables S16–S20 (ESI†). The corresponding IR and Raman spectra are visualized in Fig. S14–S17 (ESI†).
(ii) Absence of the correlation between O–L vibrational frequencies and O…L distances. It can be considered a general and well-accepted knowledge that a close-to-linear correlation exists between structural and vibrational properties of O–L bonds: the longer is the equilibrium O⋯L distance, the smaller is the O–L stretching frequency.74–76
In our case, such correlation seems to hold for calculated harmonic frequencies (νharm(O–L) vs. 〈O–L〉; see Fig. 10a). It means that regardless of whether there is a second local minimum on the stretching potential or not, the local minimum pertaining to the equilibrium geometry becomes broader (shallower) for larger O…L equilibrium distances (shorter O…O distances). However, the ν01(O–L) vs. 〈O–L〉 distance correlation is broken (see Fig. 10b). This is due to the fact that transition from the ground state to the first excited state dramatically broadens the potentials especially in case of low-barrier double-well systems 1a·2a and 1a·2b, and thus the energy gap between the vibrational levels for these systems is not as large as for the effectively single-well systems 1a·1b·2c and 1a·2d. It means that caution ought to be exercised when interpreting experimental vibrational frequencies: for systems with asymmetric double-well potentials the larger O–L vibrational frequency does not necessarily mean a shorter O–L distance.
 | ||
| Fig. 10 Dependencies of the (a) harmonic νharm(O–L) and (b) anharmonic ν01(O–L) stretching frequencies of Ag symmetry on the vibrationally-averaged 〈O–L〉 distances in 1a·2a, 1a·2b, 1a·1b·2c and 1a·2d. The picture does not change qualitatively if one uses equilibrium O–L distances instead of vibrationally-averaged ones. | ||
(iii) Anomalous H/D isotope effect on ν01(O–H). In cases of low-barrier double-well potentials in 1a·2a and 1a·2b, we have predicted a rather exotic H/D isotope effect, viz. the higher ν01(O–D) frequency than the ν01(O–H) frequency, see Fig. S8 (ESI†) and Table 5. Here the isotopic ratio is γ = ν01(O–H)/ν01(O–D) ∼ 0.97, in a good agreement with the previously reported record-low values of γ ∼ 0.90 for several systems with the low-barrier O–H⋯O bonds exhibiting stretching frequency in the range of ca. 1200–1650 cm−1.77 The reason for the anomalous H/D isotope effect could be rationalized as follows: for 1a·2a and 1a·2b, approximately at the position of the |1〉 state the U(q1) potential becomes significantly broader, which makes the vibrationally excited OH and OD levels closer to each other than the ground levels. As a result, the ε|1〉–ε|0〉 energy difference for D becomes larger than that for H. This phenomenon is further discussed in ESI,† below Fig. S8.
| 1a·2a | 1a·2b | 1a·1b·2c | 1a·2d | |
|---|---|---|---|---|
| γ | 0.97 | 0.97 | 1.27 | 1.16 |
Cooperativity effects of the SeO–H⋯OSe and SeO⋯H–N bonds
Above, we have considered the pivotal features of the SeO–H⋯OSe bond, but have not yet addressed the question of how the proton transfer in it affects the H-bonding with counterions. In other words, in this subsection we consider the H-bond cooperativity effects (see, e.g., recent ref. 78–82). The OHO and OHN bonds are interconnected through the SeO4 tetrahedra. As a result, upon the SeO–H⋯OSe ⇔ SeO⋯H–OSe transfer, the geometries of the SeO⋯H–N bonds are also adjusted ‘on the fly’. The displacement directions of the N-heterocycle molecular cations are shown in Fig. S18 and S19 (ESI†), and the explanation is the following.In the case of ‘isolated’ OHO bonds in 1a·1b·2c and 1a·2d, the proton transfer in the OHO bond implies deprotonation of one SeO4 tetrahedron and protonation of the neighbouring one. The resulting changes of charges on oxygen atoms determine the direction of the NH proton donor displacement. Thus, the cation shifts closer to the SeO4 tetrahedron gaining an additional negative charge, and, vice versa, shifts away from the SeO4 tetrahedron, whose (formal) charge increases by unity. The resulting range of changes in the N⋯O interatomic distances is ca. 0.10–0.15 Å.
In the case of infinite SeO–H⋯OSe bond chains in 1a·2a and 1a·2b, the proton transfer does not change the SeO4 tetrahedron charge: deprotonation on its one side is compensated by protonation on the opposite side. As a result, the adjustment of the SeO⋯H–N bond geometry is rather trifle: the N…O interatomic distances vary by ca. 0.02–0.03 Å. Furthermore, these changes are influenced by additional non-covalent interactions in the crystal structure, viz. weak C–H⋯O contacts between the aromatic protons of the cations and various oxygen atoms of the nearest SeO4 tetrahedra. As a result, the direction of the cation shift may seem intuitively unexpected. For example, for 1a·2b the symmetrization of the OHO bond weakens the OHN bond.
A more detailed description of the cooperativity effects of the SeO–H⋯OSe and SeO⋯H–N bonds is provided in the ESI,† below Fig. S19.
Conclusions
In this paper, we have endeavoured to shed light on the salient, but largely unexplored issue of the bridging proton (deuteron) delocalization in the infinite and ‘isolated’ short and strong SeO–H(D)⋯OSe bonds of hydrogen selenate salts in the crystalline state, employing the novel strategy for anharmonic treatment of the O–H(D) stretching modes, which implies the quasi-adiabatic potential energy calculations with a subsequent numerical solution of the vibrational Schrödinger equation for the bridging hydron. The obtained results can be summarized as the following.(i) The bridging proton (deuteron) delocalizations in SeO–H(D)⋯OSe bonds are caused by the zero-point vibrations within broad and shallow stretching potentials, ranging from an asymmetric low-barrier double well to an asymmetric single well or high-barrier double well. The shape of the potential sensitively responds to the change in the O…O distance: its contraction by only a few hundredths of Å leads to the disappearance of potential barrier and to a greater hydron delocalization in the ground state. In turn, the O…O distance could be adjusted by the placement of OHN-bonded counterions due to the mutual coupling of OHO and OHN bonds.
(ii) The calculated equilibrium OH distances are 0.03–0.05 Å longer than those obtained by the automatic placement of hydrogen atoms in X-ray refinement procedure. In turn, the vibrationally averaged OH distances are longer still, by additional 0.03–0.05 Å. The quantum delocalization of hydrogens, estimated from the width of the vibrational wave function, is in the order of 0.2 Å. Since the zero-point energy depends on the nuclear masses, one observes an isotope dependence of the H-bond distances, i.e. the H-bond strength is (slightly) modified.
(iii) The O–H stretching frequencies lie in the range of 1600–3050 cm−1, which is substantially determined by the width of the potential at the height of the first vibrationally excited level. Because of this, in case of low-barrier double-well potentials the frequency of the fundamental transition for the lighter proton is lower than that for the heavier deuteron by ca. 50 cm−1, i.e. ν01(O–H) < ν01(O–D). In the experimental IR spectra, the OH/NH stretching bands are very broad and sometimes barely distinguishable from the background. Because of it, instead of using experimental IR spectra to validate calculations, one could use calculations to assign ambiguous experimental IR spectra in the region of broad OH/NH stretching bands.
(iv) An optical phonon excitation to the first excited state dramatically affects the OHO/ODO bridging hydron position. In the case of ‘isolated’ bonds featuring effectively single-well potentials, the hydron is shifted towards the H-bond centre, making it almost equally shared between two oxygen atoms. In the case of infinite chains of H-bonded selenates with double-well potentials, the hydron is almost entirely transferred across the H-bond centre. One can thus deduce that the degree of the excited-state hydron transfer in hydrogen selenates can be fine-tuned by changing the separation of oxygen sites, which, in turn, is controlled by the counterions.
In conclusion, an ordered H-bond network in the hydrogen selenate salts introduces strong anharmonic effects in the SeO–H(D)⋯OSe bonds, which are reflected in the hydron position and delocalization extent, in H-bond vibrational spectral properties, and in the peculiarities of hydron transfer. We were able to account for these anharmonic effects only by utilizing the entire shape of the hydron stretching potential extending far from the equilibrium, all the way to another oxygen site.
Experimental
Materials and methods
All compounds were purchased from commercial suppliers (Sigma-Aldrich, TCI America, and Merck) and used without further purification.The B3LYP89,90 functional with the two-body D3(BJ)-damping approach28,29,91 for the long-range dispersion correction was employed. All-electron BSSE-corrected GTO basis sets POB-TZVP for Se, O, N, C and H atoms (latest 2019 versions92 taken from the CRYSTAL web page93) were used. The chosen combination of the DFT functional and the atomic basis set has been proven to reproduce the H-bond geometric features in a solid state with sufficient accuracy, see, e.g., recent ref. 94–98. Calculations of the Coulomb and Hartree–Fock exchange series were done with the accuracy controlled by a set of overlap tolerances, which were taken to be (10−9, 10−9, 10−9, 10−9, 10−18).99 The maximum order of multipolar expansion100–102 in the long-range zone for the electron–electron Coulomb interaction was set to 6. Calculation of the DFT exchange–correlation contribution over the unit cell volume was done with the XLGRID DFT grid specification (a pruned grid comprising 75 radial points and five angular shells with a maximum of 974 angular points generated through the Gauss–Legendre radial quadrature and Lebedev two-dimensional angular point distributions, respectively99,103), chosen for its accuracy, which is better than 0.0001% for the integrated charge density; tolerances for the DFT density and the DFT grid weight were taken to be 10−10, 10−18. Integration in the Brillouin zone was performed using the Monkhorst–Pack scheme104 for a 12 × 12 × 12 k-point grid, corresponding to 476, 476, 868 and 518 reciprocal space points at which the Hamiltonian matrix was diagonalized for 1a·2a, 1a·2b, 1a·1b·2c and 1a·2d, respectively. Tolerance on energy controlling the SCF convergence (employing the DIIS extrapolator technique105,106) for geometry optimizations and phonon frequencies calculations was set to 10−8 and 10−10 Hartree, respectively.
Experimental single-crystal X-ray structures at 298 K were used as the starting point for the DFT calculations. The lattice parameters and atomic centres were optimized with tight convergence criteria (maximum/RMS forces and displacements of atoms smaller than 0.000075/0.000050 a.u. and 0.000225/0.000150 a.u., respectively) and symmetry constraints imposed by a monoclinic space group C2/c for 1a·2a and 1a·2b, a monoclinic space group P21/n for 1a·2d, and a triclinic space group P for 1a·1b·2c. Analytical energy gradients107–109 within a quasi-Newton approach110 combined with the BFGS111–115 algorithm for Hessian updating were used. Consistency between the optimized geometries and the aforementioned overlap tolerances for integrals’ evaluation was ensured by the FINALRUN option with the value of 4.99
For optimized structures, phonon frequencies within the harmonic approximation were calculated numerically at the Γ point using the direct mode-following (frozen-phonon) method.116 For deriving the dynamical matrix, the 0.006 Å displacement was chosen both for the two-point (central difference) approach for 1a·2a and 1a·2b and for the one-point (right difference) approach for 1a·1b·2c and 1a·2d.99 The analytical IR117 and Raman118–120 intensities for normal modes were calculated from the dipole moment and polarizability derivatives determined using CPHF approach121 for constructing the Born charge and Raman tensors, respectively. Integrated Raman intensities were normalized to a maximum value of 1000. The spectra were constructed adopting a pseudo-Voight functional form with the default VOIGT and DAMPFAC variables of 1.0 (pure Lorentzian functions) and 8.0 (FWHM used for the spectra), respectively. Vibrational mode assignments were based on visual inspection of the corresponding atomic displacements.
The SeO–H⋯OSe bridging proton transfer pathways (potentials) were calculated in the quasi-adiabatic manner by stepwise elongating/contracting the frozen O–H/H…O distance with an increment of 0.02–0.04 Å. All the other degrees of freedom (internal coordinates) were optimized at each step employing the conjugate gradient BKTRNSF2 algorithm99 with the fixed lattice parameters and integrals’ classification (FIXINDEX directive)99 pertaining to the corresponding optimized structures. To secure the optimization stability, the maximum coordinate change allowed between steps was constrained to 0.05 a.u. Such a procedure envisages the anharmonic coupling in the potential energy between the νσ(OO) and ν(OH) modes, and ensures physically sound modelling of coherent transfer of the symmetry-related bridging protons without reducing the unit cell symmetry. The four unique 1D pointwise potentials thereby calculated were subjected to polynomial fitting in order to get a suitable form for further processing.
Assuming perfect fulfilment with the Born–Oppenheimer approximation (i.e. when the only conceivable source of the isotope effect on the H-bond characteristics is the isotope mass dependence of the vibrational motion), the Schmidt's WavePacket MATLAB package122,123 was employed for numerical solution of the one-dimensional vibrational time-independent Schrödinger equations both for protons and deuterons with the calculated proton transfer potentials U(q1) represented as the grids of 1024 potential energy values, evenly tempered within the corresponding range of the q1 coordinate:

Quantum-topological analysis (Quantum Theory of Atoms in Molecules analysis; QTAIM)126,127 of periodic electron density was performed using TOPOND14128 module implemented in the CRYSTAL17 code. The following electron density features at the SeO–H⋯OSe intermolecular BCPs were considered: the values of (i) the electron density, ρbcp, (ii) the Laplacian of the electron density, ∇2ρbcp, and (iii) the local electron kinetic, potential and total energy densities, Gbcp, Vbcp and Hbcp. The two-dimensional ρ and ∇2ρ distribution maps around the SeO–H⋯OSe bonds were plotted with the CRYSPLOT129 tool.
Manipulation and visualization of the four crystal structures was performed with the BIOVIA's Materials Studio software.130 Graphs were plotted with the Origin software.131
Data availability
The authors confirm that the data supporting the findings of this study are available within the article and ESI,† where the authors have cited additional ref. 132–152. Deposition numbers 2417665 and 2417668 (for 1a·2a), 2417669 and 2417697 (for 1a·2b), 2417671 (for 1a·1b·2c), 2417672 and 2417674 (for 1a·2d) contain the supplementary crystallographic data for this paper. These data are provided free of charge by the joint Cambridge Crystallographic Data Centre and Fachinformationszentrum Karlsruhe Access Structures service.Conflicts of interest
There are no conflicts to declare.Acknowledgements
This work was financially supported by the Russian Science Foundation (RSF) grant no. 23-13-00095. Quantum-chemical calculations were performed at the Computing Centre of St. Petersburg University Research Park (https://www.cc.spbu.ru/). We would like to express our gratitude to Dr A. V. Bandura for illuminating discussions.Notes and references
- J. Stejskal, D. Havlíček, I. Císařová and I. Matulková, Vibrational Spectroscopic and X-Ray Single Crystal Diffraction Investigation of Tetra-n-Alkylammonium Hydrogen Selenates, J. Chem. Crystallogr., 2017, 47, 59–68, DOI:10.1007/s10870-017-0680-4.
- A. V. Belushkin, C. J. Carlile and L. A. Shuvalov, A quasielastic neutron scattering study of protonic transport in hydrogen-bonded alkali metal hydrogen sulphates and selenates, Ferroelectrics, 1995, 167, 21–31, DOI:10.1080/00150199508007716.
- S. Ikeda and Y. Yamada, Phase transition in hydrogen-bonded ferroelectric compounds—Quantum fluctuations versus thermal fluctuations, Phys. B, 1995, 213–214, 652–657, DOI:10.1016/0921-4526(95)00240-A.
- N. I. Pavlenko, Protonic conductivity at the superionic phase transitions in the M3H(XO4)2 crystal group, J. Phys.: Condens. Matter, 1999, 11, 5099–5110, DOI:10.1088/0953-8984/11/26/311.
- N. Pavlenko, A. Pietraszko, A. Pawlowski, M. Polomska, I. V. Stasyuk and B. Hilczer, Hydrogen transport in superionic system Rb3H(SeO4)2: a revised cooperative migration mechanism, Phys. Rev. B: Condens. Matter Mater. Phys., 2011, 84, 1–10, DOI:10.1103/PhysRevB.84.064303.
- H. Matsui, K. Shimatani, Y. Ikemoto, T. Sasaki and Y. Matsuo, Phonon-assisted proton tunneling in the hydrogen-bonded dimeric selenates of Cs3H(SeO4)2, J. Chem. Phys., 2020, 152, 154502, DOI:10.1063/1.5145108.
- H. Matsui, K. Fukuda, S. Takano, Y. Ikemoto, T. Sasaki and Y. Matsuo, Mechanisms of the antiferro-electric ordering in superprotonic conductors Cs3H(SeO4)2 and Cs3D(SeO4)2, J. Chem. Phys., 2022, 156, 204504, DOI:10.1063/5.0088230.
- W. Zhao, A. H. Flood and N. G. White, Recognition and applications of anion–anion dimers based on anti-electrostatic hydrogen bonds (AEHBs), Chem. Soc. Rev., 2020, 49, 7893–7906, 10.1039/D0CS00486C.
- A. Pizzi, A. Dhaka, R. Beccaria and G. Resnati, Anion⋯anion self-assembly under the control of σ- and π-hole bonds, Chem. Soc. Rev., 2024, 53, 6654, 10.1039/D3CS00479A.
- R. Beccaria, A. Dhaka, M. Calabrese, A. Pizzi, A. Frontera and G. Resnati, Chalcogen and Hydrogen Bond Team up in Driving Anion⋯Anion Self-Assembly, Chem. – Eur. J., 2024, 30, e202303641, DOI:10.1002/chem.202303641.
- M. Drozd and J. Baran, Polarized IR-microscope spectra of guanidinium hydrogenselenate single crystal, Spectrochim. Acta, Part A, 2005, 61, 2953–2965, DOI:10.1016/j.saa.2004.11.007.
- J. Lorenc, I. Bryndal, M. Marchewka, E. Kucharska, T. Lis and J. Hanuza, Crystal and molecular structure of 2-amino-5-chloropyridinium hydrogen selenate—its IR and Raman spectra, DFT calculations and physicochemical properties, J. Raman Spectrosc., 2008, 39, 863–872, DOI:10.1002/jrs.1925.
- S. Akriche and M. Rzaigui, 2-Amino-3-nitropyridinium hydrogen selenate, Acta Crystallogr., Sect. F: Struct. Biol. Cryst. Commun., 2009, 65, o1648, DOI:10.1107/S1600536809022879.
- W. Maalej, A. Ben Rached, T. Mhiri, A. Daoud, N. Zouari and Z. Elaoud, Vibrational study, phase transitions and electrical properties of 4-benzylpyridinium monohydrogenselenate, J. Phys. Chem. Solids, 2016, 96–97, 92–99, DOI:10.1016/j.jpcs.2016.05.010.
- V. Arjunan, S. Thirunarayanan, M. K. Marchewka and S. Mohan, Crystal structure, vibrational spectra and DFT studies of hydrogen bonded 1,2,4-triazolium hydrogenselenate, J. Mol. Struct., 2017, 1145, 211–221, DOI:10.1016/j.molstruc.2017.05.107.
- R. Yankova and I. Tankov, Structural characterization, Hirshfeld surface description and chemical reactivity for the new ionic liquid (C3H5N2)(HSeO4), J. Mol. Struct., 2023, 1290, 135955, DOI:10.1016/j.molstruc.2023.135955.
- I. Morosov, S. Troyanov, A. Stiewe and E. Kemnitz, Synthese und Kristallstruktur von Hydrogenselenaten zweiwertiger Metalle – M(HSeO4)2 (M = Mg, Mn, Zn) und M(HSeO4)2·H2O (M = Mn, Cd), Z. Anorg. Allg. Chem., 1998, 624, 135–140, DOI:10.1002/(SICI)1521-3749(199801)624:1
![[double bond splayed right]](https://www.rsc.org/images/entities/char_e00a.gif) 135::AID-ZAAC135
135::AID-ZAAC135![[double bond splayed left]](https://www.rsc.org/images/entities/char_e009.gif) 3.0.CO;2-M.
3.0.CO;2-M. - I. Matulková, M. Fridrichová, I. Císařová, P. Vaněk, F. Uhlík and I. Němec, Vibrational spectroscopic and crystallographic study of the novel guanylurea salts with sulphuric and selenic acids, J. Mol. Struct., 2017, 1131, 294–305, DOI:10.1016/j.molstruc.2016.11.041.
- W. Diallo, L. Diop, C. A. K. Diop, L. Plasseraud and H. Cattey, Two new organic-selenate salts: syntheses and crystal structures of bis(di-iso-propylammonium) selenate and di-n-butylammonium hydrogenoselenate, Z. Naturforsch., B: J. Chem. Sci., 2017, 72, 425–432, DOI:10.1515/znb-2017-0032.
- S. Ocak, D. Braga and S. d’Agostino, Effect of supramolecular complexation of alkali hydrogenselenates with crown ethers and solid-solutions with their hydrogensulfate counterparts on the solid-to-solid phase transition behaviors, CrystEngComm, 2024, 26, 4525–4532, 10.1039/D4CE00514G.
- N. G. White, Antielectrostatically hydrogen bonded anion dimers: counter-intuitive, common and consistent, CrystEngComm, 2019, 21, 4855–4858, 10.1039/C9CE01118H.
- M. V. Vener and N. B. Librovich, The structure and vibrational spectra of proton hydrates: H5O2+ as a simplest stable ion, Int. Rev. Phys. Chem., 2009, 28, 407–434, DOI:10.1080/01442350903079955.
- J. G. Brandenburg, T. Maas and S. Grimme, Benchmarking DFT and semiempirical methods on structures and lattice energies for ten ice polymorphs, J. Chem. Phys., 2015, 142, 124104, DOI:10.1063/1.4916070.
- A. Erba, J. Maul and B. Civalleri, Thermal properties of molecular crystals through dispersion-corrected quasi-harmonic ab initio calculations: the case of urea, Chem. Commun., 2016, 52, 1820–1823, 10.1039/C5CC08982D.
- Y. N. Heit, K. D. Nanda and G. J. O. Beran, Predicting finite-temperature properties of crystalline carbon dioxide from first principles with quantitative accuracy, Chem. Sci., 2016, 7, 246–255, 10.1039/C5SC03014E.
- Y. Zhao and D. G. Truhlar, Comparative DFT Study of van der Waals Complexes: Rare-Gas Dimers, Alkaline-Earth Dimers, Zinc Dimer, and Zinc-Rare-Gas Dimers, J. Phys. Chem. A, 2006, 110, 5121–5129, DOI:10.1021/jp060231d.
- A. D. Boese, Density Functional Theory and Hydrogen Bonds: Are We There Yet?, ChemPhysChem, 2015, 16, 978–985, DOI:10.1002/cphc.201402786.
- S. Grimme, J. Antony, S. Ehrlich and H. Krieg, A consistent and accurate ab initio parametrization of density functional dispersion correction (DFT-D) for the 94 elements H-Pu, J. Chem. Phys., 2010, 132, 154104, DOI:10.1063/1.3382344.
- S. Grimme, S. Ehrlich and L. Goerigk, Effect of the damping function in dispersion corrected density functional theory, J. Comput. Chem., 2011, 32, 1456–1465, DOI:10.1002/jcc.21759.
- S. Grimme, A. Hansen, J. G. Brandenburg and C. Bannwarth, Dispersion-Corrected Mean-Field Electronic Structure Methods, Chem. Rev., 2016, 116, 5105–5154, DOI:10.1021/acs.chemrev.5b00533.
- M. Cutini, L. Maschio and P. Ugliengo, Exfoliation Energy of Layered Materials by DFT-D: Beware of Dispersion, J. Chem. Theory Comput., 2020, 16, 5244–5252, DOI:10.1021/acs.jctc.0c00149.
- D. Gemeri, A. Živković, I. Lukačević, H. Bahmann and H. E. King, Density functional theory demonstrates orientation effects in the Raman spectra of hydroxy- and carbonated apatite, J. Raman Spectrosc., 2023, 54, 159–170, DOI:10.1002/jrs.6465.
- B. Civalleri, C. M. Zicovich-Wilson, L. Valenzano and P. Ugliengo, B3LYP augmented with an empirical dispersion term (B3LYP-D*) as applied to molecular crystals, CrystEngComm, 2008, 10, 405–410, 10.1039/B715018K.
- S. J. Grabowski, What Is the Covalency of Hydrogen Bonding?, Chem. Rev., 2011, 111, 2597–2625, DOI:10.1021/cr800346f.
- I. Mata, I. Alkorta, E. Espinosa and E. Molins, Relationships between interaction energy, intermolecular distance and electron density properties in hydrogen bonded complexes under external electric fields, Chem. Phys. Lett., 2011, 507, 185–189, DOI:10.1016/j.cplett.2011.03.055.
- M. V. Vener, A. N. Egorova, A. V. Churakov and V. G. Tsirelson, Intermolecular hydrogen bond energies in crystals evaluated using electron density properties: DFT computations with periodic boundary conditions, J. Comput. Chem., 2012, 33, 2303–2309, DOI:10.1002/jcc.23062.
- E. Espinosa, I. Alkorta, J. Elguero and E. Molins, From weak to strong interactions: a comprehensive analysis of the topological and energetic properties of the electron density distribution involving X–H⋯F–Y systems, J. Chem. Phys., 2002, 117, 5529–5542, DOI:10.1063/1.1501133.
- C. Gatti, Chemical bonding in crystals: new directions, Z. Kristallogr., 2005, 220, 399–457, DOI:10.1524/zkri.220.5.399.65073.
- M. V. Vener, A. V. Manaev, A. N. Egorova and V. G. Tsirelson, QTAIM Study of Strong H-Bonds with the O–H⋯A Fragment (A = O, N) in Three-Dimensional Periodical Crystals, J. Phys. Chem. A, 2007, 111, 1155–1162, DOI:10.1021/jp067057d.
- J. Hernández-Trujillo and R. F. W. Bader, Properties of Atoms in Molecules: Atoms Forming Molecules, J. Phys. Chem. A, 2000, 104, 1779–1794, DOI:10.1021/jp994096z.
- A. M. Pendás, M. A. Blanco and E. Francisco, The nature of the hydrogen bond: a synthesis from the interacting quantum atoms picture, J. Chem. Phys., 2006, 125, 184112, DOI:10.1063/1.2378807.
- R. F. W. Bader and H. Essén, The characterization of atomic interactions, J. Chem. Phys., 1984, 80, 1943–1960, DOI:10.1063/1.446956.
- D. Cremer and E. Kraka, A description of the chemical bond in terms of local properties of electron density and energy, Croat. Chem. Acta, 1984, 57, 1259–1281 Search PubMed.
- T. Steiner, The Hydrogen Bond in the Solid State, Angew. Chem., Int. Ed., 2002, 41, 48–76, DOI:10.1002/1521-3773(20020104)41:148::AID-ANIE483.0.CO;2-U.
- A. Novak, Hydrogen bonding in solids. Correlation of spectroscopic and crystallographic data, in: Large Molecules, Struct. Bonding, 1974, 18, 177–216, DOI:10.1007/BFb0116438.
- E. R. Chakalov, R. P. Shekurov, V. A. Miluykov and P. M. Tolstoy, Evidence of extremely short hydrogen bond in the homoconjugated ferrocene-1,1′-diyl-bisphosphinic acid anion: sign change of the H/D isotope effect on the 31P NMR chemical shift, Phys. Chem. Chem. Phys., 2023, 25, 29486–29495, 10.1039/D3CP03714B.
- F. Fillaux, M. H. Limage and F. Romain, Quantum proton transfer and interconversion in the benzoic acid crystal: vibrational spectra, mechanism and theory, Chem. Phys., 2002, 276, 181–210, DOI:10.1016/S0301-0104(01)00605-X.
- F. Fillaux, A. Cousson and M. J. Gutmann, Macroscopic quantum tunnelling of protons in the KHCO3 crystal, J. Mol. Struct., 2006, 790, 122–128, DOI:10.1016/j.molstruc.2005.11.041.
- F. Fillaux, A. Cousson and M. J. Gutmann, Macroscopic quantum entanglement and ‘super-rigidity’ of protons in the KHCO3 crystal from 30 to 300 K, J. Phys.: Condens. Matter, 2006, 18, 3229–3249, DOI:10.1088/0953-8984/18/12/006.
- F. Fillaux, A. Cousson and M. J. Gutmann, Proton transfer across hydrogen bonds: From reaction path to Schrödinger's cat, Pure Appl. Chem., 2007, 79, 1023–1039, DOI:10.1351/pac200779061023.
- F. Fillaux and A. Cousson, Nonlocal protons and deuterons opposed to disorder: a single-crystal neutron diffraction study of KH0.76D0.24CO3 and a theoretical framework, J. Phys.: Condens. Matter, 2008, 20, 252202, DOI:10.1088/0953-8984/20/25/252202.
- F. Fillaux and A. Cousson, Where are Protons and Deuterons in KHpD1−pCO3? A Neutron Diffraction Study, Z. Phys. Chem., 2008, 222, 1279–1290, DOI:10.1524/zpch.2008.5388.
- A. Lichanot, P. Baranek, M. Mérawa, R. Orlando and R. Dovesi, V OH and VOD centers in alkaline-earth oxides: An ab initio supercell study, Phys. Rev. B: Condens. Matter Mater. Phys., 2000, 62, 12812–12819, DOI:10.1103/PhysRevB.62.12812.
- P. Ugliengo, F. Pascale, M. Mérawa, P. Labéguerie, S. Tosoni and R. Dovesi, Infrared Spectra of Hydrogen-Bonded Ionic Crystals: Ab Initio Study of Mg(OH)2 and β-Be(OH)2, J. Phys. Chem. B, 2004, 108, 13632–13637, DOI:10.1021/jp047514v.
- F. Pascale, S. Tosoni, C. Zicovich-Wilson, P. Ugliengo, R. Orlando and R. Dovesi, Vibrational spectrum of brucite, Mg(OH)2: a periodic ab initio quantum mechanical calculation including OH anharmonicity, Chem. Phys. Lett., 2004, 396, 308–315, DOI:10.1016/j.cplett.2004.08.047.
- J. Panek, J. Stare and D. Hadži, From the Isolated Molecule to Oligomers and the Crystal: A Static Density Functional Theory and Car–Parrinello Molecular Dynamics Study of Geometry and Potential Function Modifications of the Short Intramolecular Hydrogen Bond in Picolinic Acid N-Oxide, J. Phys. Chem. A, 2004, 108, 7417–7423, DOI:10.1021/jp0495794.
- Y. Nöel, R. Demichelis, F. Pascale, P. Ugliengo, R. Orlando and R. Dovesi, Ab initio quantum mechanical study of γ-AlOOH boehmite: structure and vibrational spectrum, Phys. Chem. Miner., 2009, 36, 47–59, DOI:10.1007/s00269-008-0257-z.
- G. Sastre, N. Katada and M. Niwa, Computational Study of Brønsted Acidity of Mordenite. Effect of the Electric Field on the Infrared OH Stretching Frequencies, J. Phys. Chem. C, 2010, 114, 15424–15431, DOI:10.1021/jp104316e.
- M. De La Pierre and C. Pouchan, Ab initio periodic modelling of the vibrational spectra of molecular crystals: the case of uracil, Theor. Chem. Acc., 2018, 137, 25, DOI:10.1007/s00214-017-2191-y.
- A. Živković, D. Gemeri, H. Bahmann, I. Lukačević and H. E. King, Identifying surface phonons in the vibrational spectra of carbonated apatite using density functional theory, Mater. Today Commun., 2023, 36, 106596–106609, DOI:10.1016/j.mtcomm.2023.106596.
- J. Stare, A. Jezierska, G. Ambrožič, I. J. Košir, J. Kidrič, A. Koll, J. Mavri and D. Hadži, Density Functional Calculation of the 2D Potential Surface and Deuterium Isotope Effect on 13C Chemical Shifts in Picolinic Acid N-Oxide. Comparison with Experiment, J. Am. Chem. Soc., 2004, 126, 4437–4443, DOI:10.1021/ja021345f.
- G. Gajewski, P. D. Mitev and K. Hermansson, 2D calculation of anharmonic OH vibrations in a layered hydroxide crystal, J. Chem. Phys., 2008, 129, 064502, DOI:10.1063/1.2913518.
- K. Hermansson, M. M. Probst, G. Gajewski and P. D. Mitev, Anharmonic OH vibrations in Mg(OH)2 (brucite): Two-dimensional calculations and crystal-induced blueshift, J. Chem. Phys., 2009, 131, 244517, DOI:10.1063/1.3266507.
- P. D. Mitev, K. Hermansson and W. J. Briels, Calculation of anharmonic OH phonon dispersion curves for the Mg(OH)2 crystal, J. Chem. Phys., 2010, 133, 034120, DOI:10.1063/1.3458001.
- J. Stare, A. Gradišek and J. Seliger, Nuclear quadrupole resonance supported by periodic quantum calculations: a sensitive tool for precise structural characterization of short hydrogen bonds, Phys. Chem. Chem. Phys., 2020, 22, 27681–27689, 10.1039/D0CP04710D.
- A. Zwolenik and A. Makal, Tracking anharmonic oscillations in the structure of β-1,3-diacetylpyrene, IUCrJ, 2025, 12, 23–35, DOI:10.1107/S2052252524010443.
- A. R. Ubbelohde and I. Woodward, Structure and Thermal Properties Associated with Some Hydrogen Bonds in Crystals. IV. Isotope Effects in Some Acid Phosphates, Proc. R. Soc. London, Ser. A, 1942, 179, 399–407 CAS.
- A. R. Ubbelohde and K. J. Gallagher, Acid-base effects in hydrogen bonds in crystals, Acta Crystallogr., 1955, 8, 71–83, DOI:10.1107/S0365110X55000340.
- S. Bratos, H. Ratajczak and P. Viot, Properties of H-bonding in the infrared spectral range, Hydrogen-Bonded Liquids, Springer, Netherlands, Dordrecht, 1991, pp. 221–235 Search PubMed.
- P. Ugliengo, ANHARM. A program to solve the monodimensional nuclear Schrödinger equation (Unpublished), 1989 Search PubMed.
- The frequencies of the calculated fundamental transitions (ν01(O–H) and νanharm(O–H)) correspond to the Raman active fully-symmetric Ag mode. Harmonic O–H stretching frequencies of Ag and Au modes (in 1a·1b·2c), Ag and Au, Bg, Bu modes (in 1a·2a, 1a·2b, and 1a·2d) are close to each other, suggesting that all the anharmonic frequencies, including the IR active Au and Bu modes, are close as well.
- S. Ikeda, H. Sugimoto and Y. Yamada, Isotope Effects and Fermi Resonance in Hydrogen Bonds: A New Model, Phys. Rev. Lett., 1998, 81, 5449–5452, DOI:10.1103/PhysRevLett.81.5449.
- S. Ikeda, Isotope effects and Fermi resonance in hydrogen bonds—hydrogen potential and wave function, J. Phys. Chem. Solids, 1999, 60, 1403–1406, DOI:10.1016/S0022-3697(99)00133-X.
- G. C. Pimentel and A. L. McClellan, The Hydrogen Bond, Reinhold Publishing Corp., New York, 1960 Search PubMed.
- L. Ojamäe and K. Hermansson, Water molecules in different crystal surroundings: vibrational O–H frequencies from ab initio calculations, J. Chem. Phys., 1992, 96, 9035, DOI:10.1063/1.462262.
- M. Mérawa, B. Civalleri, P. Ugliengo, Y. Noël and A. Lichanot, Structural, electronic, and vibrational properties of solid Sr(OH)2 calculated with different Hamiltonians, J. Chem. Phys., 2003, 119, 1045–1052, DOI:10.1063/1.1577538.
- N. D. Sokolov, M. V. Vener and V. A. Savel’ev, Tentative study of strong hydrogen bond dynamics: Part II. Vibrational frequency considerations, J. Mol. Struct., 1990, 222, 365–386, DOI:10.1016/0022-2860(90)85046-L.
- L. Trevisan, A. D. Bond and C. A. Hunter, Quantitative Measurement of Cooperativity in H-Bonded Networks, J. Am. Chem. Soc., 2022, 144, 19499–19507, DOI:10.1021/jacs.2c08120.
- F. E. Hanna, A. J. Root, M. Schade and C. A. Hunter, Negative cooperativity in the formation of H-bond networks involving primary anilines, Chem. Sci., 2024, 15, 12036–12041, 10.1039/D4SC03719G.
- B. Hachuła, P. Włodarczyk, K. Jurkiewicz, J. Grelska, D. Scelta, S. Fanetti, M. Paluch, S. Pawlus and K. Kamiński, Pressure-Induced Aggregation of Associating Liquids as a Driving Force Enhancing Hydrogen Bond Cooperativity, J. Phys. Chem. Lett., 2024, 15, 127–135, DOI:10.1021/acs.jpclett.3c03037.
- E. Y. Tupikina, M. V. Sigalov and P. M. Tolstoy, Simultaneous Estimation of Two Coupled Hydrogen Bond Geometries from Pairs of Entangled NMR Parameters: The Test Case of 4-Hydroxypyridine Anion, Molecules, 2022, 27, 3923, DOI:10.3390/molecules27123923.
- E. Y. Tupikina, M. V. Sigalov, O. Alkhuder and P. M. Tolstoy, Charge Relay Without Proton Transfer: Coupling of Two Short Hydrogen Bonds via Imidazole in Models of Catalytic Triad of Serine Protease Active Site, ChemPhysChem, 2024, 25, e202300970, DOI:10.1002/cphc.202300970.
- A. L. Spek, Structure validation in chemical crystallography, Acta Crystallogr., Sect. D: Biol. Crystallogr., 2009, 65, 148–155, DOI:10.1107/S090744490804362X.
- O. V. Dolomanov, L. J. Bourhis, R. J. Gildea, J. A. K. Howard and H. Puschmann, OLEX2: a complete structure solution, refinement and analysis program, J. Appl. Crystallogr., 2009, 42, 339–341, DOI:10.1107/S0021889808042726.
- G. M. Sheldrick, Crystal structure refinement with SHELXL, Acta Crystallogr., Sect. C: Struct. Chem., 2015, 71, 3–8, DOI:10.1107/S2053229614024218.
- G. M. Sheldrick, SHELXT – Integrated space-group and crystal-structure determination, Acta Crystallogr., Sect. A: Found. Adv., 2015, 71, 3–8, DOI:10.1107/S2053273314026370.
- C. F. MacRae, I. Sovago, S. J. Cottrell, P. T. A. Galek, P. McCabe, E. Pidcock, M. Platings, G. P. Shields, J. S. Stevens, M. Towler and P. A. Wood, Mercury 4.0: from visualization to analysis, design and prediction, J. Appl. Crystallogr., 2020, 53, 226–235, DOI:10.1107/S1600576719014092.
- R. Dovesi, A. Erba, R. Orlando, C. M. Zicovich-Wilson, B. Civalleri, L. Maschio, M. Rérat, S. Casassa, J. Baima, S. Salustro and B. Kirtman, Quantum-mechanical condensed matter simulations with CRYSTAL, Wiley Interdiscip. Rev.: Comput. Mol. Sci., 2018, 8, e1360, DOI:10.1002/wcms.1360.
- A. D. Becke, A new mixing of Hartree-Fock and local density-functional theories, J. Chem. Phys., 1993, 98, 1372–1377, DOI:10.1063/1.464304.
- A. D. Becke, Density-functional thermochemistry. III. The role of exact exchange, J. Chem. Phys., 1993, 98, 5648–5652, DOI:10.1063/1.464913.
- A. D. Becke and E. R. Johnson, A density-functional model of the dispersion interaction, J. Chem. Phys., 2005, 123, 154101, DOI:10.1063/1.2065267.
- D. Vilela Oliveira, J. Laun, M. F. Peintinger and T. Bredow, BSSE-correction scheme for consistent Gaussian basis sets of double- and triple-zeta valence with polarization quality for solid-state calculations, J. Comput. Chem., 2019, 40, 2364–2376, DOI:10.1002/jcc.26013.
- CRYSTAL – Basis Sets Library, can be found under, 2025, https://www.crystal.unito.it/basis_sets.html.
- C. Cervinka and V. Štejfa, Sublimation Properties of α,ω-Diamines Revisited from First-Principles Calculations, ChemPhysChem, 2020, 21, 1184–1194, DOI:10.1002/cphc.202000108.
- V. V. Mulloyarova, A. M. Puzyk, A. A. Efimova, A. S. Antonov, R. A. Evarestov, I. S. Aliyarova, R. E. Asfin and P. M. Tolstoy, Solid-state and solution-state self-association of dimethylarsinic acid: IR, NMR and theoretical study, J. Mol. Struct., 2021, 1234, 130176, DOI:10.1016/j.molstruc.2021.130176.
- M. Ernst and G. Gryn’ova, Strength and Nature of Host–Guest Interactions in Metal–Organic Frameworks from a Quantum-Chemical Perspective, ChemPhysChem, 2022, 23, e202200098, DOI:10.1002/cphc.202200098.
- R. Gajda, A. Piekara, D. Tchoń, K. Woźniak and W. A. Sławiński, Charge density studies of single and transient (single to double) boron–oxygen bonds in (NH4)2B4O5(OH)4.2H2O, Dalton Trans., 2022, 51, 14865–14874, 10.1039/D2DT02442J.
- R. Gajda, J. Parafiniuk, P. Fertey, P. Dera and K. Woźniak, Electron density changes accompanying high-pressure phase transition in AlOOH, Mineral. Mag., 2024, 88, 288–301, DOI:10.1180/mgm.2024.22.
- R. Dovesi, V. R. Saunders, C. Roetti, R. Orlando, C. M. Zicovich-Wilson, F. Pascale, B. Civalleri, K. Doll, N. M. Harrison, I. J. Bush, P. D’Arco, M. Llunell, M. Causà, Y. Noël, L. Maschio, A. Erba, M. Rerat and S. Casassa, CRYSTAL17 User's Manual, University of Turin, Turin, 2018 Search PubMed.
- P. P. Ewald, Die Berechnung optischer und elektrostatischer Gitterpotentiale, Ann. Phys., 1921, 369, 253–287, DOI:10.1002/andp.19213690304.
- R. Dovesi, C. Pisani and C. Roetti, Treatment of Coulomb interactions in Hartree-Fock calculations of periodic systems, Phys. Rev. B: Condens. Matter Mater. Phys., 1983, 28, 5781–5792, DOI:10.1103/PhysRevB.28.5781.
- V. R. Saunders, C. Freyria-Fava, R. Dovesi, L. Salasco and C. Roetti, On the electrostatic potential in crystalline systems where the charge density is expanded in Gaussian functions, Mol. Phys., 1992, 77, 629–665, DOI:10.1080/00268979200102671.
- M. D. Towler, A. Zupan and M. Causà, Density functional theory in periodic systems using local Gaussian basis sets, Comput. Phys. Commun., 1996, 98, 181–205, DOI:10.1016/0010-4655(96)00078-1.
- H. J. Monkhorst and J. D. Pack, Special points for Brillouin-zone integrations, Phys. Rev. B: Condens. Matter Mater. Phys., 1976, 13, 5188–5192, DOI:10.1103/PhysRevB.13.5188.
- P. Pulay, Improved SCF convergence acceleration, J. Comput. Chem., 1982, 3, 556–560, DOI:10.1002/jcc.540030413.
- L. Maschio, Direct inversion of the iterative subspace (DIIS) convergence accelerator for crystalline solids employing Gaussian basis sets, Theor. Chem. Acc., 2018, 137, 60, DOI:10.1007/s00214-018-2238-8.
- K. Doll, V. R. Saunders and N. M. Harrison, Analytical Hartree–Fock gradients for periodic systems, Int. J. Quantum Chem., 2001, 82, 1–13, DOI:10.1002/1097-461X(2001)82:11::AID-QUA10173.0.CO;2-W.
- K. Doll, Implementation of analytical Hartree–Fock gradients for periodic systems, Comput. Phys. Commun., 2001, 137, 74–88, DOI:10.1016/S0010-4655(01)00172-2.
- K. Doll, R. Dovesi and R. Orlando, Analytical Hartree–Fock gradients with respect to the cell parameter for systems periodic in three dimensions, Theor. Chem. Acc., 2004, 112, 394–402, DOI:10.1007/s00214-004-0595-y.
- H. B. Schlegel, Geometry optimization, Wiley Interdiscip. Rev.: Comput. Mol. Sci., 2011, 1, 790–809, DOI:10.1002/wcms.34.
- C. G. Broyden, The Convergence of a Class of Double-rank Minimization Algorithms 1. General Considerations, J. Inst. Math. Its Appl., 1970, 6, 76–90, DOI:10.1093/imamat/6.1.76.
- C. G. Broyden, The Convergence of a Class of Double-rank Minimization Algorithms: 2. The New Algorithm, J. Inst. Math. Its Appl., 1970, 6, 222–231, DOI:10.1093/imamat/6.3.222.
- R. Fletcher, A new approach to variable metric algorithms, Comput. J., 1970, 13, 317–322, DOI:10.1093/comjnl/13.3.317.
- D. Goldfarb, A family of variable-metric methods derived by variational means, Math. Comput., 1970, 24, 23–26, DOI:10.1090/S0025-5718-1970-0258249-6.
- D. F. Shanno, Conditioning of quasi-Newton methods for function minimization, Math. Comput., 1970, 24, 647–656, DOI:10.1090/S0025-5718-1970-0274029-X.
- F. Pascale, C. M. Zicovich-Wilson, F. López Gejo, B. Civalleri, R. Orlando and R. Dovesi, The calculation of the vibrational frequencies of crystalline compounds and its implementation in the CRYSTAL code, J. Comput. Chem., 2004, 25, 888–897, DOI:10.1002/jcc.20019.
- L. Maschio, B. Kirtman, R. Orlando and M. Rèrat, Ab initio analytical infrared intensities for periodic systems through a coupled perturbed Hartree-Fock/Kohn-Sham method, J. Chem. Phys., 2012, 137, 204113, DOI:10.1063/1.4767438.
- M. Ferrero, M. Rérat, R. Orlando and R. Dovesi, The calculation of static polarizabilities of 1-3D periodic compounds. the implementation in the crystal code, J. Comput. Chem., 2008, 29, 1450–1459, DOI:10.1002/jcc.20905.
- L. Maschio, B. Kirtman, M. Rérat, R. Orlando and R. Dovesi, Ab initio analytical Raman intensities for periodic systems through a coupled perturbed Hartree–Fock/Kohn–Sham method in an atomic orbital basis. I. Theory, J. Chem. Phys., 2013, 139, 164101, DOI:10.1063/1.4824442.
- L. Maschio, B. Kirtman, M. Rérat, R. Orlando and R. Dovesi, Ab initio analytical Raman intensities for periodic systems through a coupled perturbed Hartree–Fock/Kohn–Sham method in an atomic orbital basis. II. Validation and comparison with experiments, J. Chem. Phys., 2013, 139, 164102, DOI:10.1063/1.4824443.
- M. Ferrero, M. Ŕerat, R. Orlando and R. Dovesi, Coupled perturbed Hartree–Fock for periodic systems: the role of symmetry and related computational aspects, J. Chem. Phys., 2008, 128, 014110, DOI:10.1063/1.2817596.
- MATLAB R2021b, The MathWorks, Natick, MA, USA Search PubMed.
- B. Schmidt and U. Lorenz, WavePacket: A Matlab package for numerical quantum dynamics. I: Closed quantum systems and discrete variable representations, Comput. Phys. Commun., 2017, 213, 223–234, DOI:10.1016/j.cpc.2016.12.007.
- J. C. Light, I. P. Hamilton and J. V. Lill, Generalized discrete variable approximation in quantum mechanics, J. Chem. Phys., 1985, 82, 1400–1409, DOI:10.1063/1.448462.
- J. C. Light and T. Carrington, Discrete-Variable Representations and their Utilization, Adv. Chem. Phys., John Wiley & Sons, Inc., 2000, pp. 263–310 DOI:10.1002/9780470141731.ch4.
- R. F. W. Bader, Atoms in Molecules - A Quantum Theory, of International Series of Monographs in Chemistry, Oxford University Press, Oxford, UK, vol. 22, 1990 Search PubMed.
- L. Bertini, F. Cargnoni and C. Gatti, Chemical insight into electron density and wave functions: software developments and applications to crystals, molecular complexes and materials science, Theor. Chem. Acc., 2007, 117, 847–884, DOI:10.1007/s00214-006-0208-z.
- C. Gatti and S. Casassa, TOPOND14 User's Manual, (CNR-ISTM Milano, Milano, 2014), 2017 Search PubMed.
- G. Beata, G. Perego and B. Civalleri, CRYSPLOT: a new tool to visualize physical and chemical properties of molecules, polymers, surfaces, and crystalline solids, J. Comput. Chem., 2019, 40, 2329–2338, DOI:10.1002/jcc.25858.
- Materials Studio (17.1.0.48). BIOVIA, Dassault Systèmes, San Diego, CA, USA, 2017 Search PubMed.
- Origin, OriginLab, Northampton, MA, USA, 2018 Search PubMed.
- B. Lindberg, A new efficient method for calculation of energy eigenvalues and eigenstates of the one-dimensional Schrödinger equation, J. Chem. Phys., 1988, 88, 3805–3810, DOI:10.1063/1.453880.
- P. M. Morse, Diatomic Molecules According to the Wave Mechanics. II. Vibrational Levels, Phys. Rev., 1929, 34, 57–64, DOI:10.1103/PhysRev.34.57.
- G. Herzberg, Molecular Spectra and Molecular Structure I. Diatomic Molecules, Prentice-Hall, New York, 1939 Search PubMed.
- B. Civalleri and P. Ugliengo, First Principles Calculations of the Adsorption of NH3 on a Periodic Model of the Silica Surface, J. Phys. Chem. B, 2000, 104, 9491–9499, DOI:10.1021/jp002353q.
- M. Mérawa, P. Labeguerie, P. Ugliengo, K. Doll and R. Dovesi, The structural, electronic and vibrational properties of LiOH and NaOH: an ab initio study, Chem. Phys. Lett., 2004, 387, 453–459, DOI:10.1016/j.cplett.2004.01.123.
- S. Tosoni, F. Pascale, P. Ugliengo, R. Orlando, V. R. Saunders and R. Dovesi, Quantum mechanical calculation of the OH vibrational frequency in crystalline solids, Mol. Phys., 2005, 103, 2549–2558, DOI:10.1080/00268970500180808.
- M. Corno, C. Busco, B. Civalleri and P. Ugliengo, Periodic ab initio study of structural and vibrational features of hexagonal hydroxyapatite Ca10(PO4)6(OH)2, Phys. Chem. Chem. Phys., 2006, 8, 2464–2472, 10.1039/B602419J.
- M. D’Amore, C. Bisio, G. Talarico, M. Cossi and L. Marchese, Interface Between Alkylammonium Ions and Layered Aluminophosphates Materials: A Combined Theoretical and Experimental Study, Chem. Mater., 2008, 20, 4980–4985, DOI:10.1021/cm8009594.
- A. Erba, S. Casassa, R. Dovesi, L. Maschio and C. Pisani, Periodic density functional theory and local-MP2 study of the librational modes of Ice XI, J. Chem. Phys., 2009, 130, 074505, DOI:10.1063/1.3076921.
- F. Leydier, C. Chizallet, A. Chaumonnot, M. Digne, E. Soyer, A.-A. Quoineaud, D. Costa and P. Raybaud, Brønsted acidity of amorphous silica–alumina: the molecular rules of proton transfer, J. Catal., 2011, 284, 215–229, DOI:10.1016/j.jcat.2011.08.015.
- G. Ulian, G. Valdré, M. Corno and P. Ugliengo, The vibrational features of hydroxylapatite and type A carbonated apatite: a first principle contribution, Am. Mineral., 2013, 98, 752–759, DOI:10.2138/am.2013.4315.
- S. Tosoni, K. Doll and P. Ugliengo, Hydrogen Bond in Layered Materials: Structural and Vibrational Properties of Kaolinite by a Periodic B3LYP Approach, Chem. Mater., 2006, 18, 2135–2143, DOI:10.1021/cm060227e.
- A. Pedone, M. Corno, B. Civalleri, G. Malavasi, M. C. Menziani, U. Segre and P. Ugliengo, An ab initio parameterized interatomic force field for hydroxyapatite, J. Mater. Chem., 2007, 17, 2061–2068, 10.1039/B617858H.
- P. Ugliengo, C. M. Zicovich-Wilson, S. Tosoni and B. Civalleri, Role of dispersive interactions in layered materials: a periodic B3LYP and B3LYP-D* study of Mg(OH)2, Ca(OH)2 and kaolinite, J. Mater. Chem., 2009, 19, 2564–2572, 10.1039/B819020H.
- G. Ulian, S. Tosoni and G. Valdrè, Comparison between Gaussian-type orbitals and plane wave ab initio density functional theory modeling of layer silicates: Talc[Mg3Si4O10(OH)2] as model system, J. Chem. Phys., 2013, 139, 204101, DOI:10.1063/1.4830405.
- M. De La Pierre, C. Carteret, L. Maschio, E. André, R. Orlando and R. Dovesi, The Raman spectrum of CaCO3 polymorphs calcite and aragonite: a combined experimental and computational study, J. Chem. Phys., 2014, 140, 164509, DOI:10.1063/1.4871900.
- M. De La Pierre, R. Demichelis and R. Dovesi, Vibrational Spectroscopy of Minerals Through Ab Initio Methods, Molecular Modeling of Geochemical Reactions, 2016, pp. 341–374 DOI:10.1002/9781118845226.ch10.
- K. B. Beć, J. Grabska, M. A. Czarnecki, C. W. Huck, M. J. Wójcik, T. Nakajima and Y. Ozaki, IR Spectra of Crystalline Nucleobases: Combination of Periodic Harmonic Calculations with Anharmonic Corrections Based on Finite Models, J. Phys. Chem. B, 2019, 123, 10001–10013, DOI:10.1021/acs.jpcb.9b06285.
- E. Y. Tupikina, G. S. Denisov and P. M. Tolstoy, NMR Study of CHN Hydrogen Bond and Proton Transfer in 1,1-Dinitroethane Complex with 2,4,6-Trimethylpyridine, J. Phys. Chem. A, 2015, 119, 659–668, DOI:10.1021/jp511493m.
- E. Y. Tupikina, P. M. Tolstoy, A. A. Titova, M. A. Kostin and G. S. Denisov, Estimations of FH⋯X hydrogen bond energies from IR intensities: Iogansen's rule revisited, J. Comput. Chem., 2021, 42, 564–571, DOI:10.1002/jcc.26482.
- M. A. Kostin, S. A. Pylaeva and P. M. Tolstoy, Phosphine oxides as NMR and IR spectroscopic probes for the estimation of the geometry and energy of PO⋯H–A hydrogen bonds, Phys. Chem. Chem. Phys., 2022, 24, 7121–7133, 10.1039/d1cp05939d.
Footnote |
| † Electronic supplementary information (ESI) available: Data on experimental and computed crystal structures; QTAIM analyses, calculated potentials and geometries of hydrogen bonds; computed IR features. CCDC 2417665, 2417668, 2417669, 2417697, 2417671, 2417672 and 2417674. For ESI and crystallographic data in CIF or other electronic format see DOI: https://doi.org/10.1039/d5cp01211b |
| This journal is © the Owner Societies 2025 |