
 Open Access Article
 This Open Access Article is licensed under a Creative Commons Attribution-Non Commercial 3.0 Unported Licence
On the structure of hybrid water-in-salt electrolytes†
Raúl
Lois-Cuns‡
 ab,
Antía
Santiago-Alonso‡
abc,
Martín
Otero-Lema
ab,
Juan J.
Parajó
ab,
Josefa
Salgado
ab,
Hadrián
Montes-Campos
*ab,
Trinidad
Méndez-Morales
*ab and
Luis M.
Varela
ab
ab,
Antía
Santiago-Alonso‡
abc,
Martín
Otero-Lema
ab,
Juan J.
Parajó
ab,
Josefa
Salgado
ab,
Hadrián
Montes-Campos
*ab,
Trinidad
Méndez-Morales
*ab and
Luis M.
Varela
ab
aGrupo de Nanomateriais, Fotónica e Materia Branda, Departamento de Física de Partículas – Universidade de Santiago de Compostela, Campus Vida s/n E-15782, Santiago de Compostela, Spain. E-mail: hadrian.montes@usc.es; trinidad.mendez@usc.es
bInstituto de Materiais (iMATUS) – Universidade de Santiago de Compostela, Avenida do Mestre Mateo 25 E-15782, Santiago de Compostela, Spain
cABCR Laboratorios, Lg. Vilapouca (PG Industrial) E-36550, Forcarei, Spain
First published on 16th June 2025
Abstract
Water-in-salt electrolytes are promising candidates for next-generation lithium-ion batteries due to their enhanced safety and cost-effectiveness. However, optimizing the performance of hybrid aqueous/non-aqueous water-in-salt electrolytes remains a challenge. This work investigates the structural characteristics of mixtures of a LiTFSI water-in-salt based electrolyte (21 m) with several common solvents (e.g. carbonates, dimethyl sulfoxide, acetonitrile) using molecular dynamics simulations combined with experimental measurements. Our analysis reveals a correlation between the ability of a given cosolvent to solvate lithium cations and its Lewis basicity. A strong Lewis basicity favours the formation of free water cluster aggregates in the system, which reduces the electrochemical performance of the electrolyte. Moreover, the relative permittivity of the cosolvents also plays an important role in modifying the ionic interaction.
1 Introduction
Maintaining and raising the current life quality standard worldwide comes with a growing demand for energy, which must be efficiently used to avoid further aggravation of the climate crisis. In this context, electrochemical energy storage (EES) devices, such as batteries and supercapacitors, are very important to enable the shift away from fossil fuels and to provide solutions to sustainable and green energy sectors, particularly for covering periods of high demand or low generation and for portable applications and electric vehicles.1 Many approaches have been followed with the aim of optimizing the performance of EES systems in terms of efficiency, cost, safety and sustainability, which includes the development of innovative electrolytes and electrode materials. Compared to the substantial efforts devoted to the implementation of advanced electrode materials, research on electrolytes has received less attention, even though they are a crucial component that can govern the performance of EES devices.2Important characteristics for electrolyte selection include good ionic conductivity, a wide electrochemical stability window (ESW), a wide working temperature range, high safety, good chemical stability, minimal environmental hazard and low cost. Traditional organic electrolytes have been often employed for the development of commercial EES technologies owing to their wide ESWs. Nevertheless, they should be replaced due to high levels of toxicity, environmental polluting potential and safety issues caused by their high flammability.3,4 Ionic liquids exhibit advantages such as non-flammability, high thermal stability, and a wide ESW (up to 6.0 V), but their widespread application is limited by high cost, viscosity, and low ionic conductivity.5,6 Aqueous electrolytes seem to be viable candidates for advanced EES devices due to their safety, low cost, high ionic conductivity and ease of fabrication.7 However, they come with an intrinsic ESW as narrow as ∼1.23 V, which seriously limits the improvement of the energy density of batteries and supercapacitors and thus hinders their practical applications.8 In this context, during the last decade, intensive efforts have been dedicated to the search of effective methods to broaden the ESW of aqueous electrolytes.
Thus, in 2015, Suo et al.9 pioneeringly proposed a highly concentrated aqueous electrolyte whose ESW was expanded up to ∼3.0 V upon the formation of an electrode–electrolyte interphase. This “water-in-salt” electrolyte (WiSE) was developed by dissolving lithium bis(trifluoromethane sulfonyl)imide (LiTFSI) at extremely high concentrations (molality > 20 m). These binary systems exhibit unique solvation mechanisms where most water molecules participate in metal-ion solvation, reducing the amount of free H2O molecules that could undergo decomposition. Thus, the decomposition of salt anions leads to the formation of a protective solid–electrolyte interphase (SEI), which further prevents the reduction of water and expands the ESW. Accordingly, the solvation structure, especially that involving water, emerges as a key factor influencing the performance of the electrolyte. Following this work, this type of WiSE has been extensively investigated by both experimental and computational means.10–17 In addition, alternative formulations of WiSEs were proposed by including more sustainable and cost-effective ions.18–29
To further improve SEI formation and energy density, additional salts have been introduced, forming “water-in-bisalt” electrolytes (WiBSEs).30–40 However, these systems increase viscosity and reduce ionic conductivity, necessitating alternative strategies. One promising approach is the addition of organic cosolvents to WiSEs, forming superconcentrated hybrid aqueous/non-aqueous electrolytes that enhance ion dynamics by decreasing cation–anion interactions.41–44 In addition, these WiS-based hybrid aqueous/non-aqueous electrolytes possess the intrinsic merits of each system: the aqueous portion provides the non-flammability and non-toxicity attributes, whereas the non-aqueous portion supports the formation of an interface protecting the anode surface.
The first hybrid electrolyte, proposed by Wang et al.45 in 2018, incorporated dimethyl carbonate (DMC) into WiSE, expanding the ESW to 4.1 V. Similarly, Dou et al.46 added acetonitrile (ACN) to WiSE, improving conductivity, viscosity, and temperature stability while preserving ESW. Molecular dynamics (MD) simulations confirmed that ACN enhances ion diffusion by disrupting cation–anion interactions.47 More recently, Tang et al.48 developed hybrid WiSEs with dimethyl sulfoxide (DMSO), demonstrating superior energy densities and wider working temperature ranges. These hybrid electrolytes have also been explored for sodium49–51 and zinc52–54 EES technologies, showing ESWs of ∼3 V and promising electrochemical performance.
Even though there is an increasing interest in this kind of hybrid aqueous/non-aqueous electrolytes due to their outstanding properties, up to now most of the studies have been carried out by experimental means. Scarce computational results have focused on the solvation shell of the salt cation at a given concentration. Furthermore, a systematic molecular-level examination of the physical properties of a large number of organic cosolvents mixed with a WiSE at different concentrations is still missing. Therefore, with the aim of obtaining the optimal formulation of an organic/water hybrid electrolyte, a series of organic solvents [ACN, DMC, DMSO, dimethylformamide (DMF), ethylene carbonate (EC), propylene carbonate (PC), vinylene carbonate (VC) and diethyl carbonate (DEC)] at three different concentrations [(LiTFSI)1.0/(H2O)2.6/(solvent)x, with x being the solvent-to-salt molar ratio and taking values of x = 1.0, 2.6 and 3.5] were added to the traditional WiSE (21 m LiTFSI/H2O). A schematic representation of the eight different cosolvents is shown in Fig. 1. A detailed study of the microscopic structure at 298.15 K was performed by means of MD simulations with a focus on the composition of the solvation shells of cations and water molecules. In addition, experimental measurements of the density and nuclear magnetic resonance (NMR) of the 1H chemical shift in water molecules were carried out in order to validate and compare them with the computational results.
 | ||
| Fig. 1 3D models of the cosolvents used in the hybrid WiS electrolytes. Gray, blue, white, red, and yellow correspond to carbon, nitrogen, hydrogen, oxygen, and sulfur atoms, respectively. | ||
2 Materials and methods
2.1 Experimental details
LiTFSI was purchased from Iolitec with a purity > 99%, and it was purified under high vacuum for at least 48 h to remove volatile impurities. The 21 m LiTFSI mixture was prepared with Milli-Q water. After the water mixture was prepared, the organic cosolvent was added in three different molar fractions of 1, 2.6 and 3.5 with respect to 21 m LiTFSI. DMF, EC, ACN and VC were purchased from Acros Organics (the first three with purities > 99% and the latter with 98% purity). DMSO and PC were purchased from Scharlau with purities of 99.9% and 99%, respectively. DEC and DMC were purchased from Sigma-Aldrich with a purity of 99% for both compounds.Images of all the mixtures after one month are shown in Fig. S1 of the ESI.† After mixing and obtaining a homogeneous mixture, all samples were stored at room temperature for one month before taking the pictures. After one month, crystals were formed in the 21 m LiTFSI sample. As reported by Guo et al.,55 the melting point of 21 m LiTFSI is near room temperature (293–303 K), so the mixture melts upon slight warming by hand, as shown in the ESI.† As for the other mixtures, all of them were in the liquid state and perfectly homogeneous, except for VC2.6 and VC3.5, which were precipitated.
2.2 Computational details
Atomistic MD simulations of hybrid WiS electrolytes were carried out using the GROMACS 2021.6 package57,58 with the OPLS-AA force field.59 The simulation box of the 21 m LiTFSI/H2O electrolyte was composed of 1000 salt ion pairs and 2600 water molecules, whereas for the hybrid WiS electrolytes 1000, 2600 and 3500 solvent molecules were added to the 21 m WiS to obtain solvent-to-salt molar fractions of x = 1.0, 2.6 and 3.5, respectively. Several water models were compared in order to determine the one that most accurately reproduces the experimental properties of the 21 m WiS electrolyte,15,16 and the TIP4P water model60 was ultimately selected for this work (see Table S1 and Fig. S1 in the ESI†).The parametrization of the TFSI anion61,62 was adopted from the CL&P force field.63 The metal cation was modeled as a single-site particle with Lennard-Jones parameters σ = 0.125992 nm and ε = 26.15 kJ mol−1.64 The charge of both ions was scaled by a factor of 0.8 in order to improve the dynamics of the studied systems, as shown in previously reported works.65 The parameters for the cosolvent ACN are shown in Table S2 (ESI†), while for the remaining cosolvents, the parameters were obtained using fftool and parametrizations from the OPLS-AA force field.59,66–71
All the calculations followed the same simulation protocol. Initially, simulation boxes were generated using PACKMOL,72 followed by energy minimization in GROMACS using a steepest descent algorithm with a force constant of 0.1 kJ mol−1 nm−1 and an initial step size of 0.01 nm. Subsequently, a 20 ns equilibration in the NPT ensemble was performed, followed by a 20 ns production run in the NVT ensemble. A time step of 1 fs was employed throughout all MD simulations. Temperature was held at 298.15 K by means of the V-rescale thermostat73 with a 0.1 ps coupling constant, while pressure was kept at 1.0 atm by employing an isotropic Parrinello–Rahman barostat74 with a coupling time of 1.0 ps.
Long-range Coulomb interactions were computed using the smooth particle-mesh Ewald (PME)75 method with a real-space cut-off radius of 1.1 nm. The Fourier grid spacing was 0.12 nm with cubic interpolation. A Verlet cutoff scheme was used to optimize the grid spacing and Coulomb cut-off. van der Waals forces were considered within a cut-off radius of 1.1 nm. Finally, the linear constraint solver (LINCS) algorithm,76,77 with a fourth-order expansion of the constraint coupling matrix, was employed to fix all bond lengths involving hydrogen atoms.
3 Results and discussion
3.1 Density
To address the validity of the chosen parametrization, the density of all systems was determined both experimentally and from MD simulations. A comparison of these measurements across different cosolvent concentrations is shown in Fig. 2. As can be seen from the figure, there exists an excellent agreement between the experimental and computational results for all analyzed systems, in both tendency and magnitude, with the largest deviation among all systems being −2.05% for a 2.6 molar fraction of DEC. In light of these results, the chosen parametrizations were deemed adequate to model the behaviours of the analyzed mixtures.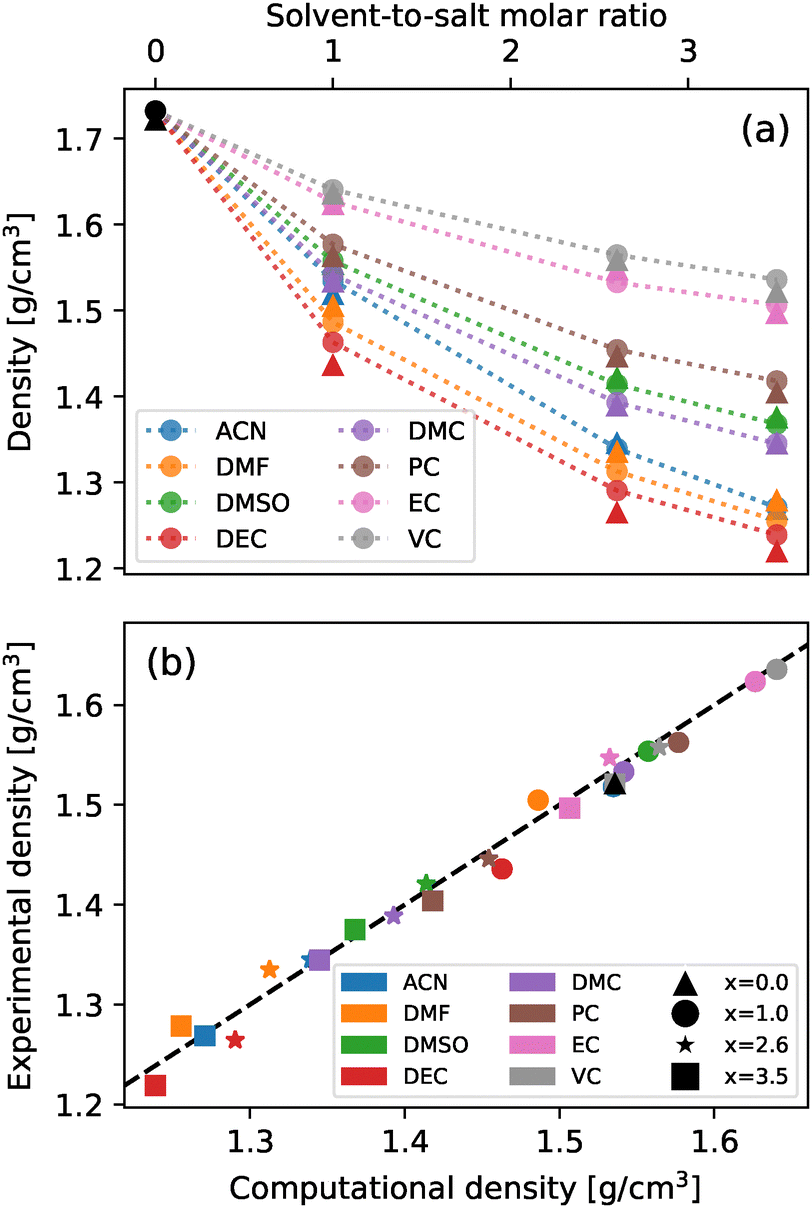 | ||
| Fig. 2 (a) Simulated (circle) and experimental (triangles) densities at T = 298.15 K for different concentrations. Expanded standard uncertainties are 0.0050 g cm−3 (0.95 level of confidence) for experimental data. Dotted lines are included as a guide for the eye. (b) Comparison between computational and experimental densities at T = 298.15 K for different concentrations. The black dashed line corresponds to matching values and is meant as a visual aid. Each color corresponds to a different cosolvent and each marker to a different value of the molar ratio. | ||
3.2 Long-range structures
To investigate the structural changes induced by the addition of cosolvents, the total structure factor was calculated as follows:78 | (1) |
The results are depicted in Fig. 3 for all mixtures. Three distinct features are observed in the structure factor: a peak at low q values (around 0.5 Å−1), associated to larger length-scale correlations (such as long-range water structures); a mid-range peak (around 1.5 Å−1), related to the spatial correlations between the solvation shells of neighboring ions; and a high-q peak (around 2.5 Å−1), corresponding to molecule adjacency and the solvation shell of Li+ cations.
 | ||
| Fig. 3 Total structure factor S(q) as a function of the wave vector modulus q. Each subplot compares the structure factor for the different organic cosolvents at each cosolvent concentration. | ||
For most cosolvents, the positions and intensities of these peaks exhibit minimal variations with its concentration, suggesting only slight alterations to the local structure of the mixtures. However, this does not happen for systems with DMSO or DMF as cosolvents. In these cases, increasing the cosolvent concentration leads to a noticeable redshift of the low-q peak, accompanied by a substantial increase in its peak intensity. This behaviour indicates the emergence of large-scale structural features within the simulations, such as extensive molecular clustering, which has significant implications for the microscopic interactions and organization of the system. The pronounced changes in the structure factors for DMSO and DMF indicate that these cosolvents induce greater structural reorganization at higher concentrations, potentially resulting in more extensive water clustering – a phenomenon that will be analyzed in detail later on.
The second peak remains independent of cosolvent concentration, with no significant changes in either intensity or position, which suggests that the structural organization between the solvation shells of neighboring ions is largely unaffected by the amount of cosolvent in the mixture. On the other hand, some noticeable changes are found in the high-q peak, which can be related to changes in the first solvation shell of Li+ cations and H2O molecules. Special attention is required in the DEC systems. As the concentration of this solvent increases, its molecules begin to compete with the cation for water coordination (as will be discussed later), thus disrupting the well-structured solvation shells of the metal. This reduction in short-range order likely contributes to the weakening and eventual disappearance of the third peak.
Computational X-ray structure factors can be derived from the total structure factor computed from the simulations if the molar fraction of each atomic element within the systems is taken into account, as explained in the ESI.† The computational X-ray structure factors for all systems can be found in Fig. S3 of the ESI,† allowing potential comparison with future experiments, since to our knowledge no current X-ray data are available for the studied systems. There is an apparent difference between this spectrum and the one shown in Fig. 3. Notably, in the former, the long range structures formed in systems involving DMF and DMSO are not collected. X-Ray scattering may not be the optimal method for analyzing these systems because it can result in a loss of information. Therefore, alternative scattering techniques, such as neutron or electron scattering, would be necessary for a comprehensive analysis of the systems.
To understand the nature of the long-range structures and, in particular, those found in mixtures with DMF and DMSO, an analysis of the partial structure factors can be performed, where the total S(q) is decomposed into contributions from each individual pair of atoms. Fig. 4 displays the partial structure factors for systems with high cosolvent concentrations. The corresponding results for lower cosolvent concentrations are provided in Fig. S4 and S5 of the ESI.† A close examination of the H2O–H2O contribution clearly shows that the shoulder observed in the total structure factor at low q-values for DMSO and DMF arises from the formation of large water clusters, which are absent in other cosolvents and concentrations. This clustering likely occurs, as will be discussed during the analysis of the cation solvation structure, due to the strong solvation preference of DMF and DMSO for Li+, which forces water molecules to interact primarily with other water molecules rather than with the ions or cosolvent.
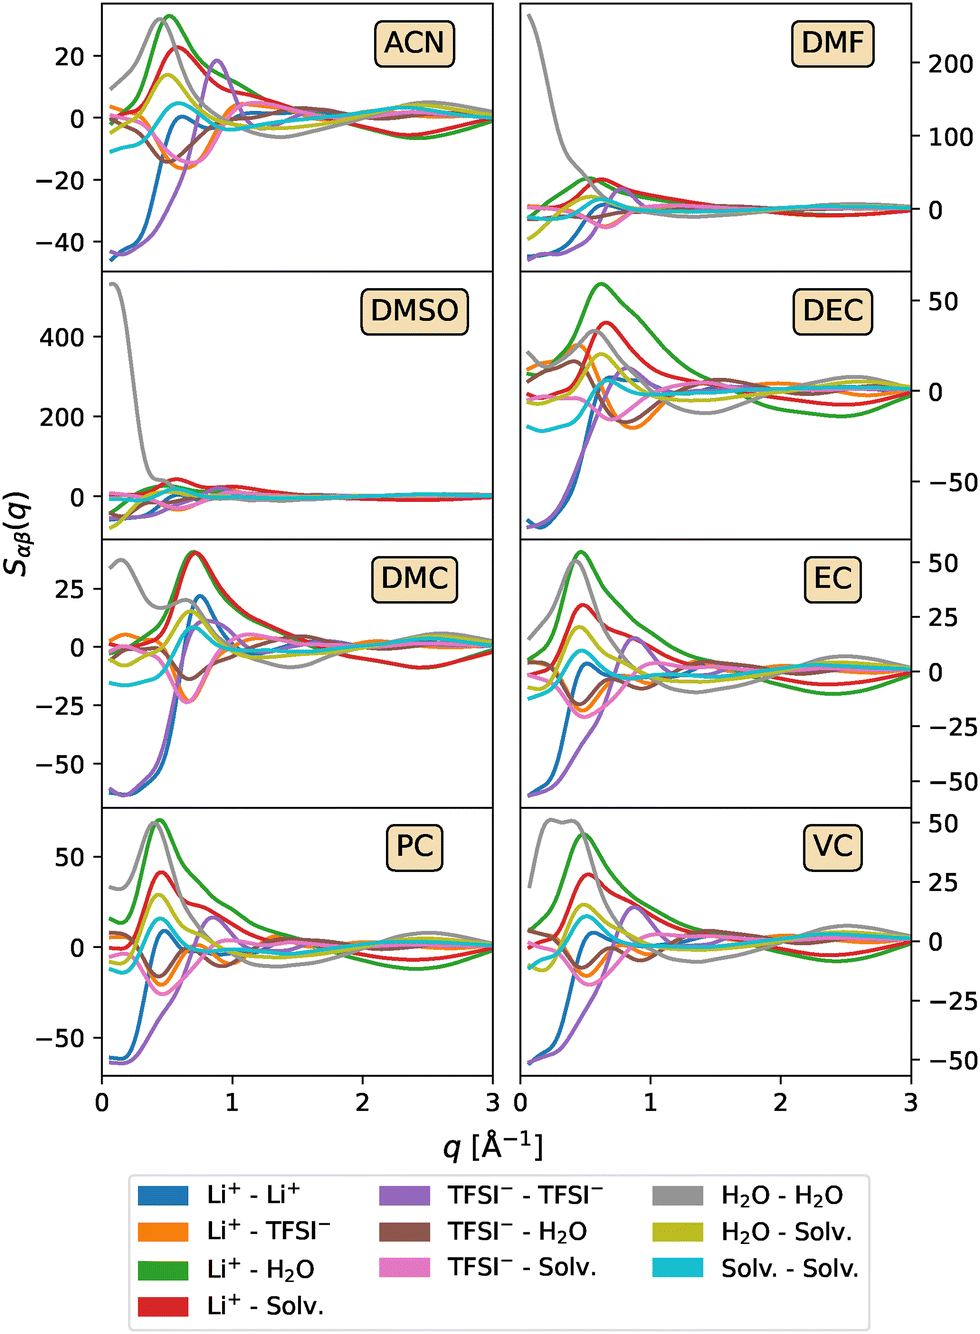 | ||
| Fig. 4 Partial structure factors Sαβ(q) as a function of the wave vector modulus q for the LiTFSI1/(H2O)2.6/(Solv)3.5 systems. | ||
While low-q features can originate from various physical phenomena, including nanophase separation or ion aggregation, in the case of DMSO and DMF, these features arise predominantly from enhanced H2O–H2O correlations, indicating the formation of extended water clusters at high cosolvent concentrations. This behaviour, as will be discussed later, is attributed to the strong preferential solvation of Li+ by these cosolvents rather than water molecules, which limits the availability of water in the first solvation shell and promotes self-association between water molecules. The formation of such free water-rich domains can be detrimental to electrochemical stability. Free or loosely coordinated water molecules have been shown to facilitate parasitic side reactions, reduce the ESW, and promote hydrogen evolution processes.9,79
In order to quantify the degree of aggregation between water molecules throughout the systems, we follow the approach proposed by Carrete et al.80 For each simulation frame, an undirected graph is constructed, with each node representing an oxygen atom in a water molecule. Two nodes are connected if the distance between the particles they represent is less than a given cutoff, which was set to 4 Å, corresponding to the first minimum of the radial distribution functions (RDFs) between these components, which are depicted in Fig. S6 of the ESI.† In this framework, a cluster of size N is defined as a group of N connected nodes that are isolated from the rest of the graph. Probability distribution functions of finding a water molecule in a cluster of a given size for the different cosolvent concentrations are shown in Fig. 5. From these functions, cumulative distribution functions F(x) can be defined in order to represent the probability of finding a water molecule in a cluster with a size not greater than N. Accordingly, in Fig. S7 of the ESI,† the probabilities of finding a water molecule in clusters larger than certain sizes, 1 − F(X), are depicted for clusters involving more than 2.5%, 5.0%, and 10.0% of the water molecules in the system.
 | ||
| Fig. 5 Probability distribution functions of finding a H2O molecule in a cluster of a given size (number of H2O molecules on it) for the different cosolvent concentrations (increasing from left to right). Each subplot corresponds to a cosolvent, from top to bottom: ACN, DMF, DMSO, DEC, DMC, EC, PC and VC. Note the logarithmic scale in the y-axis. | ||
Comparing the water cluster distributions of the different mixtures (Fig. 5) reveals notable differences in the clustering behaviour based on concentration and solvent type. Lower cosolvent concentrations exhibit larger water clusters, which break apart when concentration is increased for almost all systems, signaling a reduction in the coordination of water molecules with one another, thus leading to the homogenization of the system. Only for DMSO and DMF mixtures, a significant percentage of large water clusters is found at these concentrations. More specifically, in DMSO mixtures, around 40% of water molecules form large aggregates that include at least 10% of the total water content. In contrast, while high concentrations of DMF also enhance water aggregation compared to lower concentrations, the number of water molecules involved remains lower than in DMSO. It is important to highlight that the MD simulations for VC systems do not reveal any significant long-range structures, contrarily to experimental results where certain heterogeneities were found. This discrepancy may be attributed to the spatial resolution of MD simulations, which could not capture large aggregates that affect light scattering.
The size of these water aggregates can be estimated from their radii of gyration, using them as a measure of their spatial range. The results are shown in Fig. S8 of the ESI,† where the radii of gyration for each cluster size and system are represented. As shown in the figure, nearly all cosolvents exhibit similar growth ratios and sizes across all concentrations, differing only in the maximum cluster extension observed. However, for DMF and, notably, DMSO, a trend shift is observed at high concentrations, specifically in the cluster region corresponding to approximately 10–20% of the total size. Moreover, it should be noted that this discussion of the connectivity of the water network does not reveal information about the composition of these water clusters, as other species could be involved in these structures. In fact, this reported shift is due to a change in the composition of water clusters, from mixed aggregations that also involve other moieties to aggregations consisting almost exclusively of water molecules. Although this aspect will be further explored when studying the solvation environment of the molecules within the system, 1H NMR can be employed to analyse the environment of water molecules to determine the composition of the solvation shell of the lithium cations.
1H NMR was used to explore the formation of free H2O clusters and the hydrogen bonding interactions within the mixtures. In Fig. 6, the chemical shift of water molecules is displayed, whereas complete NMR measurements are shown in Fig. S9 (ESI†). As shown in Fig. 6, the chemical shift is reduced from 4.7 ppm of pure water protons to 2.93 ppm of the 21 m LiTFSI sample when an almost complete shielding of the protons in the water molecules solvating Li+ cation is produced. In this saturated mixture, water molecules are located in the first hydration shell and simultaneously bonded with the cations and anions due to an increase in the induced partial electric charges on oxygen and hydrogen atoms, so the 1H NMR water signal corresponds to a single ion-bond species.81 A scheme of these water–ion interactions is shown in Fig. 7(a). This unexpected behaviour was already observed in previous works82 in LiTFSI-based WiSEs and could be justified in the interaction of water molecules with TFSI− anions, which enhances the water electronic density.
 | ||
| Fig. 6 Normalized NMR spectra of LiTFSI1/(H2O)2.6/(Solv)3.5 systems showing the 1H chemical shift of water molecules. | ||
 | ||
| Fig. 7 Schematic of the water interactions in the first hydration shell of lithium: (a) 21 m LiTFSI and (b) LiTFSI1/(H2O)2.6/PC3.5. | ||
When the cosolvent mole fraction is increased, a down-field tendency is observed as the cosolvent molecules modify the water environment. Instead of interacting uniquely with ions, water molecules start interacting with ions and solvents with less charge density, which provokes a deshielding and moves the 1H peak to low fields (see Fig. 7(b)). The chemical shift between pure water and the water/solvent mixtures differs depending on the organic solvent. However, none of the electrolytes presents the aforementioned pure water peak at 4.7 ppm. Instead of observing two separate peaks for coordinated and uncoordinated water molecules, a single weighted average peak is observed for each cosolvent, which correlates with the mole fraction of water molecules coordinated to the lithium cation. This indicates that the time scale of NMR spectroscopy is slower than the rapid exchange of coordinated and uncoordinated water molecules to the lithium cation.83,84 Regarding the 1H chemical shift of water, the different cosolvents could be classified into three different groups according to their chemical structure.
The first one is formed by ring-structured solvents such as EC, VC and PC and stable bonds, such as ACN. This type of organic solvent induces strong shields that shift the water resonance to strong fields. In the case of ACN, this strong shielding is caused by a strong hydrogen bond with water due to the triple bond within the molecule. Since ACN interacts with H2O molecules, if the ACN concentration is increased, fewer water clusters are formed and the chemical shift related to water is displaced to strong fields. Regarding the cyclic carbonates, EC has the largest chemical shift. The double bond within VC generates an anisotropy in the magnetic field, so the protons situated above or below the double bond system will shift towards a higher field in comparison with EC. Since PC shares the same structure with EC, except for a methyl substituent, that is an electron-releasing group, the shielding will be increased and the chemical shift moved to strong fields.
The second type of solvent includes those containing linear alkyl-carbonate chains in their molecular structure such as DEC and DMC. Unlike cyclic carbonates that produce strong coordination environments, leading to low chemical shifts of water and due to specific solvation and intermolecular interactions, linear carbonates have less rigid structures resulting in a small shift due to their weaker ion coordination capabilities and slightly different solvation behaviours. The polarity of the molecules also plays a key role in chemical shifts. Since linear carbonates have relative permittivities lower than 15,84,85 they are considered non-polar compounds, which limits their mixing with water molecules. In these WiS mixtures, it can be found that these cosolvents, particularly DEC, preferentially solvate water molecules instead of cations. This interaction alters the water environment and results in a shift of the 1H water peak to lower magnetic field strengths.
The last group represents those containing linear chains with high electronegativity elements such as sulfur and nitrogen in the substituents, namely, DMSO and DMF, respectively. The substituents with electron-withdrawing ability will decrease the electron density around the proton and cause deshielding so that the chemical shift will appear downfield. Any potential hydrogen-bond acceptor will tend to shift the water signal downfield, particularly in the case of non-polar solvents.86
Finally, in order to relate in a more precise way the effects of water clustering on the NMR spectra, two different toy models are presented to predict the 1H shift of water molecules from the fractions of water molecules that are found to be coordinating Li+ cations. The first model is a simple one where it is assumed that the shift found in the experimental NMR calculations is due to two contributions: a free water contribution of the molecules that are not part of the cation solvation shell and a “water-in-salt contribution” of water molecules in the solvation shell of Li+:
| δ1H = δ1HWiS·f + δ1Hw·(1 − f) = 4.7·f + 2.93·(1 − f) | (2) |
A more complex model can be taken into account if water–cosolvent interactions are considered in such a way that:
| δ1H = δ1HWiS·f + δ1Hw·f′ + δ1Hsw·(1 − f − f′) | (3) |
The comparison between both models and experimental NMR shifts can be found in Fig. 8. As can be seen from the figure, quite a good agreement is found for most solvents across both models. The fact that the two- and three-contribution models yield very similar predictions suggests that the water–cosolvent interaction term, introduced in the three-contribution model, plays only a minor role in determining the overall 1H chemical shift of water in these mixtures. Despite the simplicity of the approach, this framework is able to reproduce the experimental values with remarkable accuracy, highlighting that the dominant contribution to the NMR signal arises from the population of free water molecules. Therefore, even though the model neglects specific molecular details, it still captures the essential physics governing the chemical shift trends. The discrepancies observed for some systems, such as DMF and DEC, may arise from the simplifications inherent in this ideal approximation. Notably, the model does not account for the presence and influence of the TFSI− anion, which should affect the local environment and therefore the NMR shifts. Additionally, these approaches assume the additivity and linearity of contributions, which may not fully describe the complexity of interactions in concentrated or strongly interacting systems. Beyond these simplifications, other solvent-specific effects, must be behind the discrepancies between model and experiment, though no clear cause emerges and further experiments would be needed for a detailed analysis.
 | ||
| Fig. 8 Comparison between the two models for predicting NMR shifts from water fractions. The results of the two-contribution model defined in eqn (2) (top) and the three-contribution model defined in eqn (3) (bottom) are plotted against the experimental shifts found in NMR experiments. | ||
3.3 Solvation structure
In order to gain further insights into the microscopic surroundings of the different molecules in our system, the solvation structure will be studied. For that purpose, minimum-distance distribution functions (MDDFs)87 were computed using the ComplexMixtures.jl package.88 The main advantage of MDDFs over traditional RDFs lies in the fact that the former take into account the irregular shape of the molecules, which enables a clearer view of the local interactions between the molecules within the system. Thus, due to the structural diversity of the different solvents considered in this work, MDDFs were deemed more suitable for capturing the features of the solvation structures in a more precise way.MDDFs between Li+ cations and other molecules in the system are depicted in Fig. 9. As can be seen, the first solvation shell of the cation is located at 2.6 Å and its position remains unchanged with cosolvent molar fraction. At low amounts of cosolvent, the shapes obtained for the MDDFs representing cation–anion and cation–water interactions agree with those found in the literature for pure WiS electrolytes.15
 | ||
| Fig. 9 MDDFs between Li+ cations and TFSI− anions (top), H2O molecules (middle) and cosolvent molecules (bottom) for different concentrations (increasing from left to right). | ||
In examining the Li+–TFSI− interaction across the different cosolvents, DEC and DMSO emerge as distinctive cases. First, DEC shows minimal influence on the ion pairing between Li+ and TFSI−, even as its concentration increases. This stability is due to the preference of DEC molecules to associate with water rather than with the cations. This behaviour enables TFSI− anions to remain in the proximity of Li+, even when the mole fraction of the cosolvent is high. This contrasts with other cosolvents, which gradually disrupt ion coordination as their concentrations increase, emphasizing DEC as an outlier that has a minimal effect on Li+–TFSI− coordination.
In contrast, DMSO exhibits a nearly opposite behaviour, strongly damping the ionic interactions. As DMSO mole fraction increases, ion pairing is increasingly disrupted, as DMSO molecules strongly compete for solvation around the Li+ cation, shifting TFSI− to a more peripheral position. This suggests that, at high concentrations, DMSO dominates the cation solvation shell, effectively displacing the anion and promoting a more separated ionic configuration. The resulting increased separation between ions highlights the strong coordinating effect of DMSO, effectively restructuring the electrolyte by weakening and spatially extending ion pairing in the system, allowing new long range water structures to form, as previously discussed. This behaviour was reported in previous works involving WiSEs based on LiTFSI with low mole fractions of DMSO.48
Quantitative information about the Li+ surroundings can be obtained if coordination numbers, which can be extracted from MDDFs, are evaluated at the first solvation shell (r = 2.6 Å). These are depicted in Fig. 10. The coordination numbers indicate that all analyzed cosolvents progressively displace TFSI− anions from the immediate solvation shell of Li+ cations as cosolvent concentration increases. This displacement reconfigures the coordination environment of the cation, pushing the anions to more distant regions and thereby reducing ionic interactions. While water molecules in the solvation shell are initially less affected, their presence also diminishes at higher cosolvent concentrations, though to a lesser extent than TFSI−. Notably, it can be seen that the well-known Li+ tetrahedral coordination is always preserved independently of the cosolvent. Among cosolvents, DEC and DMSO exhibit distinct impacts on ionic interactions, as previously discussed. Specifically, DEC minimally disrupts ionic pairing, in contrast to DMSO, whose strong coordinating effect modifies the ionic surroundings, displacing almost all other species within the system except from itself.
 | ||
| Fig. 10 Coordination numbers for the Li+ cations across different systems (indicated in the x-axis) and molar fractions (increasing from top to bottom). Each column represents the coordination number of a distinct molecular species within the system. | ||
The coordination numbers provided may offer an average representation of the solvation environment surrounding cations. However, the actual environment experienced by the Li+ cations is inherently dynamic and subject to time variations. Consequently, distinct Li+ cations encounter diverse local solvation conditions. As these environments significantly impact electrolyte performance by influencing cation diffusion, it is essential to investigate the specific influence of each cosolvent within the system. To do so, the probability of the most favoured local solvation configurations found during the simulations was assessed. Fig. 11 presents these configurations across different systems and molar fractions, where each bar represents one of the four most probable solvation configurations for each system. The bars are segmented to illustrate the compositions around the Li+ cation, with color-coded sections indicating the presence of TFSI−, H2O and cosolvent molecules. This approach allows a more precise comparative evaluation of how each cosolvent alters the solvation structure surrounding the cation, highlighting significant compositional shifts and similar/distinctive solvation behaviours. As can be observed, at low molar fractions of cosolvent, there are hardly any differences in the resulting arrangements around the cations. At these lower concentrations, water molecules dominate the solvation shell, with cosolvent molecules only occasionally replacing H2O and TFSI− ions. This tendency aligns with the coordination number findings, indicating a stable water-rich environment in initial stages. Most notable differences can be found when increasing the cosolvent concentrations.
 | ||
| Fig. 11 Most favoured solvation configurations around Li+ cations across different systems (indicated in the x-axis) and molar fractions (increasing from top to bottom). Each bar represents one of the four most probable configurations. In order to depict the composition of each one, bars are divided into four different segments representing the molecules that can be found around the cation. Then, each segment is coloured to differentiate the species it represents: TFSI− (red), H2O (blue) and cosolvent (green). | ||
Although the strong coordinating behaviour of DMSO was already made clear previously, from Fig. 11 it can be seen that DMF also displaces H2O molecules and TFSI− anions from the immediate vicinity of the cation. At the highest mole fraction, both cosolvents favour configurations dominated by three organic molecules, with DMSO also strongly favouring the configuration with four DMSO molecules, effectively excluding both H2O and TFSI− from the immediate coordination sphere. In contrast, systems with DEC or DMC cosolvents retain at least one TFSI− ion within the solvation shell even at higher concentrations, reflecting the relatively weaker coordination with the Li+ of DEC and DMC. This preservation of TFSI− alongside cosolvent molecules suggests that these aliphatic solvents lack the polar and coordinating strength seen in DMSO or DMF, where TFSI− is effectively excluded from the solvation structure.
The effect of the cosolvent on the solvation shells of metal cations, as well as their coordinating behaviour with respect to the anions, can be rationalized through Kamlet–Taft parameters,89–91 Gutmann donor numbers (DNs)92 and the dielectric permittivities of the cosolvents. The values of these parameters for the different cosolvents as well as water are shown in Table 1. On the one hand, Kamlet–Taft parameters serve as three complementary scales: α, β and π*, which take into account the overall solvent effects, combining its polarity and hydrogen-bonding capabilities. Specifically, α represents the solvent's hydrogen-bond donating ability, β its hydrogen-bond accepting capacity, and π* its dipolarity/polarizability. In this context, the β parameter is articulated as a metric of the basicity of solvents. As can be seen, DMSO and DMF present greater β values between all of the analysed cosolvents and, moreover, they are the only compounds that present greater β values than that of water. As these compounds present an anomalous behaviour with respect to water cluster formation, these observations underscore the significance of solvent basicity in dictating molecular interactions. To further elucidate this aspect, DNs can be taken into account as a quantitative metric of the electron-donating capabilities of the solvents. As can be seen, the same trend as that found for the β parameter is also observed for DNs. This indicates that these cosolvents have a higher affinity than water to coordinate with lithium cations, making them preferentially located in the proximity of these atoms rather than water molecules. When the DN of a given cosolvent exceeds that of water, it will preferentially coordinate with lithium cations, displacing water molecules from the primary solvation shell. Therefore, the DN is not only a qualitative descriptor of solvation strength, but also a robust indicator to predict the formation of long-range water structures in the system.
| System | α | β | π* | DN [kcal mol−1] | ε r |
|---|---|---|---|---|---|
| ACN | 0.1993 | 0.4093 | 0.6693 | 14.194 | 36.6495 |
| DMF | 0.0093 | 0.6993 | 0.8893 | 26.693 | 38.2595 |
| DMSO | 0.0093 | 0.7693 | 1.0093 | 29.893 | 47.2495 |
| DEC | 0.0096 | 0.4096 | 0.4596 | 16.093 | 2.82095 |
| DMC | 0.0097 | 0.3897 | 0.4797 | 17.294 | 3.08795 |
| PC | 0.0098 | 0.3898 | 0.9098 | 15.193 | 66.1495 |
| EC | 0.0098 | 0.3298 | 0.9998 | 16.494 | 89.7895 |
| VC | — | — | — | — | 12795 |
| Water | 1.1793 | 0.4793 | 1.0993 | 18.094 | 80.195 |
On the other hand, with respect to π* values, linear carbonates exhibit distinct values compared to their cyclic counterparts, highlighting the differences in their solvation behaviour. The π* parameter represents the solvents dipolarity and polarizability, providing insights into its ability to stabilize charge distributions through non-specific electrostatic interactions. While this parameter captures important aspects of solute–solvent interactions, the dielectric permittivity offers a more direct measure of the solvent's ability to modulate electrostatic forces between charged species. Notably, this effect is quantitatively reflected in its correlation with the Bjerrum length. A higher dielectric permittivity reduces the Bjerrum length, reflecting the weakened Coulomb interactions between cations and anions. In systems where the dielectric permittivity of the cosolvent is significantly lower, as in the case of non-polar compounds like DEC or DMC, the reduced screening effect strengthens the ion pairing allowing TFSI− anions to remain in the first solvation shell of the cation, increasing the effective distance between ions. Therefore, electrolytes incorporating cosolvents with low dielectric permittivities tend to increase the number of TFSI− anions in the first solvation shell of the Li+ cation.
The displacement of TFSI− from the solvation shell is especially advantageous for electrolyte performance, as it leaves the cation free to migrate independently toward the electrode, enhancing ionic transport. When Li+ and TFSI− ions remain in close association, they behave as a neutral unit, reducing conductivity and limiting the efficiency of ion migration within the electrolyte. Thus, cosolvents that effectively separate Li+ from TFSI− may significantly improve lithium transport to the electrodes, supporting higher-performance electrolyte systems.99 In this regard, non-polar cosolvents, and more precisely DEC, would not be the most suitable cosolvents, as their weaker coordination with Li+ allows TFSI− to remain in the solvation shell, potentially limiting ionic mobility. However, cosolvents presenting higher DNs than water molecules (such as DMSO and DMF) are also suboptimal because, while they efficiently exclude TFSI−, they also displace water from the immediate solvation environment around Li+, increasing the amount of free water molecules in the system. As stated before, the presence of free water is critical to consider as it hinders some of the electrochemical properties of the electrolytes. Indeed, Xiao et al. have demonstrated that, for a LiTFSI1/(H2O)2.6/DMF3.5 WiSE, the appearance of these structures narrowed the ESW of these solutions42 with respect to the pure 21 m WiS LiTFSI.
In this context, cyclic carbonates, which display an identical behaviour when increasing their molar fraction, are shown to be the most suitable candidates in order to effectively remove the TFSI− from the cation vicinity while simultaneously retaining water molecules within the solvation shell. As can be seen from Fig. 11, the inclusion of cyclic carbonates favours configurations incorporating at least two water molecules, and in some of their most stable configurations, maintaining up to four water molecules, even at elevated cosolvent concentrations. This persistent retention of water suggests that the structural features of these cyclic carbonates, including their rigid ring systems and orientations of functional groups, may restrict their ability to fully displace H2O around Li+. Unlike linear solvents, which may more readily conform to the solvation shell geometry around the cation and thus replace H2O effectively, the cyclic nature of these carbonates could reduce their spatial adaptability and decrease their competitiveness for coordination sites near Li+ cations. Furthermore, the higher dielectric constant of cyclic carbonates compared to their linear counterparts can explain why cyclic carbonates are more efficient displacing TFSI− anions from the vicinity of the Li+ cations than their linear counterparts.
An analysis of the water environment can also reveal relevant information about electrolyte performance, particularly concerning the fate of water molecules that leave the cation solvation layers as cosolvent mole fraction increases. The coordinating behaviour of these molecules is especially crucial when assessing whether a given electrolyte is suitable for use in electrochemical devices, since large aggregations of water can trigger decomposition reactions at the electrodes that will compromise their performance. Therefore, it is crucial to determine whether water molecules that abandon Li+ cations have tendencies to coordinate among themselves, or if they are homogeneously distributed throughout the system, incorporated with the solvent and anion networks.
To obtain a general view of the water solvation mechanism, MDDFs between water molecules and the other moieties in the system and their related coordination numbers were computed. MDDFs are depicted in Fig. S10 of the ESI† and indicate a progressive reorganization of water molecules around different components in the electrolyte when increasing the cosolvent mole fraction. From these MDDFs, coordination numbers can be computed using a cutoff distance of 2.7 Å for all the systems, which defines the first solvation layer. The coordination numbers for the varying mole fractions are depicted in Fig. 12. Similar to the findings related to cation solvation, it is clear that, at low cosolvent mole fractions, the structural configurations around water show similarities across the different additives. As the mole fraction grows, a greater variety of distinct behaviours can be observed.
 | ||
| Fig. 12 Coordination numbers for the H2O molecules across different systems (indicated in the x-axis) and molar fractions (increasing from top to bottom). Each column represents the coordination number of a distinct molecular species within the system. | ||
The formation of water clusters is reaffirmed in systems containing DMF and, in particular, DMSO, as the presence of other water molecules in the solvation shell is highly intensified, which is in perfect agreement with the structural factors shown in Fig. 3. These cosolvents demonstrate strong coordination with Li+ and actively displace water from its immediate coordination sphere. These H2O molecules tend to form extended connected clusters rather than being fully dispersed as isolated water molecules. As these clusters are harmful for the electrode survival,9,79 the use of these cosolvents should be limited to low concentrations for use as electrolytes in electrochemical devices. However, operating at low concentrations is not particularly advantageous, as it restricts the amount of salt that could be incorporated into the system.
The cation coordination analysis, illustrated in Fig. 10 and 11, revealed that all the analysed cyclic carbonates exhibit a consistent pattern of coordinating behaviour across different concentrations and, in particular, at high cosolvent mole fractions. However, when analyzing water coordination in Fig. 12, it becomes evident that VC presents a distinct behaviour compared to the other carbonates. Notably, VC shows a reduced ability to occupy the solvation shell of water molecules when compared to EC and PC. Consequently, EC and PC are more effective at isolating water molecules from one another by displacing them, thereby decreasing the formation of water aggregates within the system. These distinct behaviours could be due to the differences in the dipole moment of these molecules, with VC presenting smaller values (∼4.5 D100) than the ones exhibited by EC and PC (∼4.9 D101). The distinctions may not be relevant when examining the interaction with the cation, primarily due to its Coulombic nature. However, these differences become significant in the context of interactions with water molecules, where dipolar interactions play a crucial role. Since the value for the dipole moment of VC is more similar to that of water molecules, the interaction is likely to be less preferential compared to interactions involving higher dipole moments, such as those associated with EC and PC, reducing the overall cosolvent presence around water molecules.
The analysis of the structure, particularly regarding solvation in our systems, can be summarized using two key parameters: the free water fraction and the number of H2O–H2O hydrogen bonds, which are depicted in Fig. 13. In this context, the free water fraction is defined as the number of water molecules that are not included in the first solvation shell of the cations. As shown in Fig. 13a, the presence of clusters in DMSO systems is reflected here as a substantial increase in the free water fraction, which, as previously noted, is harmful to the resilience of the electrode. The formation of clusters in DMF is not clearly reflected by this parameter, since compounds such as DMC reach similar values for the free water fraction. This can be attributed to the considerably smaller size of the clusters formed in these systems compared to those where DMSO is added, as can be seen from Fig. 5. Consequently, it is evident that cyclic carbonates, as previously discussed, retain more water bound to the cations due to their limited spatial adaptability compared to linear or smaller cosolvents. Additionally, systems where DEC is added show low free water fractions, which can be explained by its reduced interaction with the cation compared with H2O molecules, resulting in the first solvation layer of lithium exhibiting the least variation among the examined cosolvents.
 | ||
| Fig. 13 (a) Free water fraction for different solvents and concentrations (the dotted line represents the free water fraction value for the 21 m LiTFSI mixture). (b) Average number of water–water hydrogen bonds for the different solvents and concentrations. | ||
The average number of H2O–H2O hydrogen bonds, normalized to the number of water molecules in the system, can be computed using a geometrical criterion. Specifically, two water molecules are considered to form a hydrogen bond if the distance between the donor and the acceptor is less than 3.5 Å and the angle formed by the hydrogen, the donor and the acceptor is less than 30°. The data indicate that the amount of hydrogen bonds increases with cosolvent concentration, which aligns with the expectation of encountering a greater number of free water molecules. As expected, the inclusion of DEC reduces the overall stability of the water network, as this cosolvent preferentially solvates water molecules rather than lithium cations. Thus, water molecules drift away from each other and the water hydrogen bond network is replaced by a mixed network where hydrogen bonds with DEC are also found. A higher number of these water–water hydrogen bonds is associated with an increase in the effective viscosity102 of the system and a reduction in the diffusion capacity of the ions. Therefore, in order to improve electrolyte performance, it is crucial to reduce water–water interactions. Finally, it is important to notice the difference between both linear carbonates. As stated, these cosolvents, as non-polar compounds, have a limited capability to break ion pairs, but a huge difference between DEC and DMC is observed in the coordination values shown in Fig. 10 and 12. This difference can be attributed to the distinct conformational behaviours of these solvents. In particular, DMC has been shown to promote a higher degree of salt dissociation compared to DEC, which has been linked to the greater formation of polar cis–trans conformers in DMC-based electrolytes.103 Such conformational isomerism plays a critical role in enhancing ionic conductivity, despite similar viscosities and permittivities among linear carbonates. This enhancement in ionic conductivity is also corroborated by the work of Xiao et al., where this property is compared with systems involving other cosolvents.42 Therefore, the structural preferences of DMC at the molecular level may explain its improved coordination with lithium ions and water molecules, ultimately leading to more favorable bulk transport properties.
Thus, and only taking into account the structural behaviour, the most suitable candidates among the studied cosolvents for enhancing the performance of the hybrid WiSE were found to be cyclic carbonates, which are already commonly utilized in traditional lithium batteries. Nevertheless, as reported by Xiao et al., the conductivity values of PC are not significantly enhanced, presenting lower values than that reported for ACN or DMC.42 Although this aspect requires further investigation, it is likely related to the high viscosity values reported for these compounds. Therefore, ACN emerges as the most promising candidate for use as a cosolvent, as it exhibits a solvation structure comparable to that of other systems, while displaying significantly higher reported conductivity values.46,47
4 Conclusions
In this work, a structural analysis of the behaviour of different WiS-based hybrid aqueous/non-aqueous electrolytes was performed with the aim of identifying the cosolvent that facilitates optimal performance. For that purpose, both experimental measurements and molecular dynamics simulations were carried out and eight popular organic cosolvents were tested. The analysis primarily focused on the solvation of lithium cations and the formation of free water clusters, as these structural elements are critical in limiting the performance of the electrolyte.Through the analysis of the structure factor and NMR measurements, it was found that two of the cosolvents, DMSO and DMF, facilitate the formation of free water clusters when high mole fractions of these cosolvents are included in the mixtures. The analysis of the solvation mechanism of the cations and water molecules revealed that this tendency can be related to the Lewis basicity through Gutmann DNs. When the cosolvent presents a higher DN, i.e. a greater tendency to share its lone pairs of electrons with Lewis acids and cations, it preferentially solvates lithium cations. When this number is greater than that of water, the cosolvent will displace these molecules from the solvation shell of the metal cations and form new aggregates of free water that are potentially harmful for the electrodes.
Nevertheless, DN values do not provide information about interactions with anions, and additional factors must be considered to fully determine the solvation of lithium cations. A more specific analysis of the effect of the cosolvent on the ionic interactions was conducted by examining the dielectric constant of these additives, as it is related to the Bjerrum length, which quantifies the extension of the electrostatic interaction between ions. Consequently, in the case of non-polar compounds, such as linear carbonates, an increase in the molar fraction of the cosolvent results in a greater number of anions being located in the first solvation shell of the cation. This diminishes the effective charge transport within the mixtures and, consequently, adversely affects the performance of the electrolyte.
The present study is limited in its ability to provide meaningful dynamic or electrochemical insights, as it focuses solely on the structural properties of the electrolyte. It is crucial to extend this work by analyzing the dynamics of the different components, as ion diffusion significantly influences electrolyte performance and conductivity. Furthermore, evaluating the impact of these cosolvents on key electrochemical properties, such as the electrochemical stability window, is essential for a comprehensive understanding of these systems and will be addressed in future work.
Author contributions
Raúl Lois-Cuns: formal analysis, investigation, methodology, software, validation, visualization, writing – original draft, writing – review & editing. Antía Santiago-Alonso: formal analysis, investigation, methodology, validation, visualization, writing – original draft, writing – review & editing. Martín Otero-Lema: formal analysis, software, writing – original draft, writing – review & editing. Juan J. Parajó: supervision, validation, writing – original draft, writing – review & editing. Josefa Salgado: funding acquisition, supervision, validation, writing – review & editing. Hadrián Montes-Campos: conceptualization, formal analysis, methodology, project administration, resources, supervision, validation, writing – original draft, writing – review & editing. Trinidad Méndez-Morales: conceptualization, formal analysis, funding acquisition, investigation, methodology, project administration, resources, supervision, validation, writing – original draft, writing – review & editing. Luis M. Varela: conceptualization, funding acquisition, project administration, resources, supervision, validation, writing – original draft, writing – review & editing.Data availability
Data for this article, including MD input files and experimental results, are available in Zenodo at https://doi.org/10.5281/zenodo.14266159.Conflicts of interest
There are no conflicts to declare.Acknowledgements
The financial support from the Spanish Ministry of Science, Innovation and Universities (PID2021-126148NA-I00 funded by MICIU/AEI/10.13039/501100011033/FEDER, UE) is gratefully acknowledged. This work is part of the project CNS2023-144785, funded by MICIU/AEI/10.13039/501100011033 and the European Union “NextGenerationEU”/PRTR. Moreover, this work was funded by the Xunta de Galicia (GRC ED431C 2024/06). This work was done within the framework of project HI_ MOV – “Corredor Tecnológico Transfronterizo de Movilidad con Hidrógeno Renovable”, with reference 0160_HI_MOV_1_E, co-financed by the European Regional Development fund (ERDF), in the scope of Interreg VI A Spain – Portugal Cooperation Program (POCTEP) 2021–2027. R. L. C. acknowledges his Predoctoral Contract under the framework of the projects PID2021-126148NA-I00 funded by MCIN/AEI/10.13039/501100011033/FEDER, UE; and CNS2023-144785, funded by MICIU/AEI/10.13039/501100011033 and the European Union “NextGenerationEU”/PRTR. A. Santiago-Alonso acknowledges funding to the Doutoramento Industrial program from GAIN-Xunta de Galicia. M. O. L. thanks the Xunta de Galicia for his “Axudas de apoio á etapa predoutoral” grant (ED481A 2022/236). J. J. Parajó (ED481D 2023/014) thanks the I2C postdoctoral program of the Xunta de Galicia for their support in funding the study. H. M. C. thanks the USC for his “Convocatoria de Recualificación do Sistema Universitario Español-Margarita Salas” postdoctoral grant under the “Plan de Recuperación Transformación” program funded by the Spanish Ministry of Universities with European Union's NextGenerationEU funds. This publication and the contract of T. M. M. are part of the grant RYC2022-036679-I, funded by MICIU/AEI/10.13039/501100011033 and FSE+. The authors acknowledge M. Martín (RIAIDT-USC) for the technical support in NMR measurements. Facilities provided by the Galician Supercomputing Centre (CESGA) are also acknowledged.Notes and references
- S. V. Venkatesan, A. Nandy, K. Karan, S. R. Larter and V. Thangadurai, Electrochem. Energy Rev., 2022, 5, 16 CrossRef CAS.
- L. Xia, L. Yu, D. Hu and G. Z. Chen, Mater. Chem. Front., 2017, 1, 584–618 RSC.
- J. Kalhoff, G. G. Eshetu, D. Bresser and S. Passerini, ChemSusChem, 2015, 8, 2154–2175 CrossRef CAS PubMed.
- X. Feng, M. Ouyang, X. Liu, L. Lu, Y. Xia and X. He, Energy Storage Mater., 2018, 10, 246–267 CrossRef.
- W. Zhou, M. Zhang, X. Kong, W. Huang and Q. Zhang, Adv. Sci., 2021, 8, 2004490 CrossRef CAS PubMed.
- K. Karuppasamy, J. Theerthagiri, D. Vikraman, C.-J. Yim, S. Hussain, R. Sharma, T. Maiyalagan, J. Qin and H.-S. Kim, Polymers, 2020, 12, 918 CrossRef CAS PubMed.
- J. Huang, Z. Guo, Y. Ma, D. Bin, Y. Wang and Y. Xia, Small Methods, 2019, 3, 1800272 CrossRef.
- M. Sajjad, M. I. Khan, F. Cheng and W. Lu, J. Energy Storage, 2021, 40, 102729 CrossRef.
- L. Suo, O. Borodin, T. Gao, M. Olguin, J. Ho, X. Fan, C. Luo, C. Wang and K. Xu, Science, 2015, 350, 938–943 CrossRef CAS PubMed.
- L. Suo, F. Han, X. Fan, H. Liu, K. Xu and C. Wang, J. Mater. Chem. A, 2016, 4, 6639–6644 RSC.
- W. Sun, L. Suo, F. Wang, N. Eidson, C. Yang, F. Han, Z. Ma, T. Gao, M. Zhu and C. Wang, Electrochem. Commun., 2017, 82, 71–74 CrossRef CAS.
- O. Borodin, L. Suo, M. Gobet, X. Ren, F. Wang, A. Faraone, J. Peng, M. Olguin, M. Schroeder and M. S. Ding, et al. , ACS Nano, 2017, 11, 10462–10471 CrossRef CAS PubMed.
- J. Lim, K. Park, H. Lee, J. Kim, K. Kwak and M. Cho, J. Am. Chem. Soc., 2018, 140, 15661–15667 CrossRef CAS PubMed.
- Z. Yu, L. A. Curtiss, R. E. Winans, Y. Zhang, T. Li and L. Cheng, J. Phys. Chem. Lett., 2020, 11, 1276–1281 CrossRef CAS PubMed.
- Y. Zhang, N. H. Lewis, J. Mars, G. Wan, N. J. Weadock, C. J. Takacs, M. R. Lukatskaya, H.-G. Steinrück, M. F. Toney and A. Tokmakoff, et al. , J. Phys. Chem. B, 2021, 125, 4501–4513 CrossRef CAS PubMed.
- Y. Zhang and E. J. Maginn, J. Phys. Chem. B, 2021, 125, 13246–13254 CrossRef CAS PubMed.
- A. Tot and L. Kloo, Chem. Commun., 2022, 58, 9528–9531 RSC.
- A. Triolo, V. Di Lisio, F. Lo Celso, G. B. Appetecchi, B. Fazio, P. Chater, A. Martinelli, F. Sciubba and O. Russina, J. Phys. Chem. B, 2021, 125, 12500–12517 CrossRef CAS PubMed.
- C. Zhang, J. Holoubek, X. Wu, A. Daniyar, L. Zhu, C. Chen, D. P. Leonard, I. A. Rodrguez-Pérez, J.-X. Jiang and C. Fang, et al. , Chem. Commun., 2018, 54, 14097–14099 RSC.
- X. Bu, L. Su, Q. Dou, S. Lei and X. Yan, J. Mater. Chem. A, 2019, 7, 7541–7547 RSC.
- J. Zheng, G. Tan, P. Shan, T. Liu, J. Hu, Y. Feng, L. Yang, M. Zhang, Z. Chen and Y. Lin, et al. , Chem, 2018, 4, 2872–2882 CAS.
- J. Guo, Y. Ma, K. Zhao, Y. Wang, B. Yang, J. Cui and X. Yan, ChemElectroChem, 2019, 6, 5433–5438 CrossRef CAS.
- M. H. Lee, S. J. Kim, D. Chang, J. Kim, S. Moon, K. Oh, K.-Y. Park, W. M. Seong, H. Park and G. Kwon, et al. , Mater. Today, 2019, 29, 26–36 CrossRef CAS.
- H. Zhang, S. Jeong, B. Qin, D. Vieira Carvalho, D. Buchholz and S. Passerini, ChemSusChem, 2018, 11, 1382–1389 CrossRef CAS PubMed.
- D. P. Leonard, Z. Wei, G. Chen, F. Du and X. Ji, ACS Energy Lett., 2018, 3, 373–374 CrossRef CAS.
- C. Lee and S.-K. Jeong, Chem. Lett., 2016, 45, 1447–1449 CrossRef CAS.
- F. Wang, X. Fan, T. Gao, W. Sun, Z. Ma, C. Yang, F. Han, K. Xu and C. Wang, ACS Cent. Sci., 2017, 3, 1121–1128 CrossRef CAS PubMed.
- A. Zhou, L. Jiang, J. Yue, Y. Tong, Q. Zhang, Z. Lin, B. Liu, C. Wu, L. Suo and Y.-S. Hu, et al. , ACS Appl. Mater. Interfaces, 2019, 11, 41356–41362 CrossRef CAS PubMed.
- T. Mendez-Morales, Z. Li and M. Salanne, Batteries Supercaps, 2021, 4, 646–652 CrossRef CAS.
- J. Forero-Saboya, E. Hosseini-Bab-Anari, M. E. Abdelhamid, K. Moth-Poulsen and P. Johansson, J. Phys. Chem. Lett., 2019, 10, 4942–4946 CrossRef CAS PubMed.
- J. Vatamanu and O. Borodin, J. Phys. Chem. Lett., 2017, 8, 4362–4367 CrossRef CAS PubMed.
- M. R. Lukatskaya, J. I. Feldblyum, D. G. Mackanic, F. Lissel, D. L. Michels, Y. Cui and Z. Bao, Energy Environ. Sci., 2018, 11, 2876–2883 RSC.
- Y. Yamada, K. Usui, K. Sodeyama, S. Ko, Y. Tateyama and A. Yamada, Nat. Energy, 2016, 1, 1–9 Search PubMed.
- L. Suo, O. Borodin, Y. Wang, X. Rong, W. Sun, X. Fan, S. Xu, M. A. Schroeder, A. V. Cresce and F. Wang, et al. , Adv. Energy Mater., 2017, 7, 1701189 CrossRef.
- L. Jiang, L. Liu, J. Yue, Q. Zhang, A. Zhou, O. Borodin, L. Suo, H. Li, L. Chen and K. Xu, et al. , Adv. Mater., 2020, 32, 1904427 CrossRef CAS PubMed.
- L. Chen, J. Zhang, Q. Li, J. Vatamanu, X. Ji, T. P. Pollard, C. Cui, S. Hou, J. Chen and C. Yang, et al. , ACS Energy Lett., 2020, 5, 968–974 CrossRef CAS.
- M. A. González, H. Akiba, O. Borodin, G. J. Cuello, L. Hennet, S. Kohara, E. J. Maginn, L. Mangin-Thro, O. Yamamuro and Y. Zhang, et al. , Phys. Chem. Chem. Phys., 2022, 24, 10727–10736 RSC.
- T. A. Nigatu, H. K. Bezabh, B. W. Taklu, B. W. Olbasa, Y.-T. Weng, S.-H. Wu, W.-N. Su, C.-C. Yang and B. J. Hwang, J. Power Sources, 2021, 511, 230413 CrossRef CAS.
- Q. Ni, H. Jiang, S. Sandstrom, Y. Bai, H. Ren, X. Wu, Q. Guo, D. Yu, C. Wu and X. Ji, Adv. Funct. Mater., 2020, 30, 2003511 CrossRef CAS.
- L. Suo, O. Borodin, W. Sun, X. Fan, C. Yang, F. Wang, T. Gao, Z. Ma, M. Schroeder and A. von Cresce, et al. , Angew. Chem., 2016, 128, 7252–7257 CrossRef.
- J. Chen, J. Vatamanu, L. Xing, O. Borodin, H. Chen, X. Guan, X. Liu, K. Xu and W. Li, Adv. Energy Mater., 2020, 10, 1902654 CrossRef CAS.
- D. Xiao, Q. Dou, L. Zhang, Y. Ma, S. Shi, S. Lei, H. Yu and X. Yan, Adv. Funct. Mater., 2019, 29, 1904136 CrossRef CAS.
- M.-L. Saboungi, O. Borodin, D. L. Price, B. Farago, M. A. González, S. Kohara, L. Mangin-Thro, A. Wildes and O. Yamamuro, J. Chem. Phys., 2023, 158, 124502 CrossRef CAS PubMed.
- Z. Ma, J. Chen, J. Vatamanu, O. Borodin, D. Bedrov, X. Zhou, W. Zhang, W. Li, K. Xu and L. Xing, Energy Storage Mater., 2022, 45, 903–910 CrossRef.
- F. Wang, O. Borodin, M. S. Ding, M. Gobet, J. Vatamanu, X. Fan, T. Gao, N. Eidson, Y. Liang and W. Sun, et al. , Joule, 2018, 2, 927–937 CrossRef CAS.
- Q. Dou, S. Lei, D.-W. Wang, Q. Zhang, D. Xiao, H. Guo, A. Wang, H. Yang, Y. Li and S. Shi, et al. , Energy Environ. Sci., 2018, 11, 3212–3219 RSC.
- P. Inoue, E. Fileti and T. Malaspina, J. Phys. Chem. B, 2020, 124, 5685–5695 CrossRef CAS PubMed.
- C. Tang, M. Li, J. Du, Y. Wang, Y. Zhang, G. Wang, X. Shi, Y. Li, J. Liu and C. Lian, et al. , J. Colloid Interface Sci., 2022, 608, 1162–1172 CrossRef CAS PubMed.
- Y. Sun, Y. Wang, L. Liu, B. Liu, Q. Zhang, D. Wu, H. Zhang and X. Yan, J. Mater. Chem. A, 2020, 8, 17998–18006 RSC.
- H. Zhang, B. Qin, J. Han and S. Passerini, ACS Energy Lett., 2018, 3, 1769–1770 CrossRef CAS.
- Q. Dou, Y. Lu, L. Su, X. Zhang, S. Lei, X. Bu, L. Liu, D. Xiao, J. Chen and S. Shi, et al. , Energy Storage Mater., 2019, 23, 603–609 CrossRef.
- L. Miao, R. Wang, S. Di, Z. Qian, L. Zhang, W. Xin, M. Liu, Z. Zhu, S. Chu and Y. Du, et al. , ACS Nano, 2022, 16, 9667–9678 CrossRef CAS PubMed.
- F. Ming, Y. Zhu, G. Huang, A.-H. Emwas, H. Liang, Y. Cui and H. N. Alshareef, J. Am. Chem. Soc., 2022, 144, 7160–7170 CrossRef CAS PubMed.
- X. Song, H. He, M. H. A. Shiraz, H. Zhu, A. Khosrozadeh and J. Liu, Chem. Commun., 2021, 57, 1246–1249 RSC.
- Y. Guo, M. W. Terban, I. Moudrakovski, A. Münchinger, R. E. Dinnebier, J. Popovic and J. Maier, J. Mater. Chem. A, 2023, 11, 3427–3436 RSC.
- S. B. Capelo, T. Méndez-Morales, J. Carrete, E. López Lago, J. Vila, O. Cabeza, J. R. Rodríguez, M. Turmine and L. M. Varela, J. Phys. Chem. B, 2012, 116, 11302–11312 CrossRef CAS PubMed.
- D. Van Der Spoel, E. Lindahl, B. Hess, G. Groenhof, A. E. Mark and H. J. Berendsen, J. Comput. Chem., 2005, 26, 1701–1718 CrossRef CAS PubMed.
- M. J. Abraham, T. Murtola, R. Schulz, S. Páll, J. C. Smith, B. Hess and E. Lindahl, SoftwareX, 2015, 1, 19–25 CrossRef.
- W. L. Jorgensen, D. S. Maxwell and J. Tirado-Rives, J. Am. Chem. Soc., 1996, 118, 11225–11236 CrossRef CAS.
- W. L. Jorgensen, J. Chandrasekhar, J. D. Madura, R. W. Impey and M. L. Klein, J. Chem. Phys., 1983, 79, 926–935 CrossRef CAS.
- J. N. Canongia Lopes and A. A. H. Pádua, J. Phys. Chem. B, 2004, 108, 16893–16898 CrossRef.
- A. S. L. Gouveia, C. E. S. Bernardes, L. C. Tomé, E. I. Lozinskaya, Y. S. Vygodskii, A. S. Shaplov, J. N. C. Lopes and I. M. Marrucho, Phys. Chem. Chem. Phys., 2017, 19, 29617–29624 RSC.
- J. N. Canongia Lopes, J. Deschamps and A. A. H. Pádua, J. Phys. Chem. B, 2004, 108, 2038–2047 CrossRef.
- J. Chandrasekhar, D. C. Spellmeyer and W. L. Jorgensen, J. Am. Chem. Soc., 1984, 106, 903–910 CrossRef CAS.
- C. Schröder, Phys. Chem. Chem. Phys., 2012, 14, 3089–3102 RSC.
- W. L. Jorgensen and N. A. McDonald, THEOCHEM, 1998, 424, 145–155 CrossRef CAS.
- N. A. McDonald and W. L. Jorgensen, J. Phys. Chem. B, 1998, 102, 8049–8059 CrossRef CAS.
- R. C. Rizzo and W. L. Jorgensen, J. Am. Chem. Soc., 1999, 121, 4827–4836 CrossRef CAS.
- E. K. Watkins and W. L. Jorgensen, J. Phys. Chem. A, 2001, 105, 4118–4125 CrossRef CAS.
- G. A. Kaminski, R. A. Friesner, J. Tirado-Rives and W. L. Jorgensen, J. Phys. Chem. B, 2001, 105, 6474–6487 CrossRef CAS.
- A. Padua, K. Goloviznina and Z. Gong, agiliopadua/fftool: XML force field files, 2021 DOI:10.5281/zenodo.4701065.
- L. Martínez, R. Andrade, E. G. Birgin and J. M. Martínez, J. Comput. Chem., 2009, 30, 2157–2164 CrossRef PubMed.
- G. Bussi, D. Donadio and M. Parrinello, J. Chem. Phys., 2007, 126, 014101 CrossRef PubMed.
- M. Parrinello and A. Rahman, J. Appl. Phys., 1981, 52, 7182–7190 CrossRef CAS.
- U. Essmann, L. Perera, M. L. Berkowitz, T. Darden, H. Lee and L. G. Pedersen, J. Chem. Phys., 1995, 103, 8577–8593 CrossRef CAS.
- B. Hess, H. Bekker, H. J. Berendsen and J. G. Fraaije, J. Comput. Chem., 1997, 18, 1463–1472 CrossRef CAS.
- B. Hess, J. Chem. Theory Comput., 2008, 4, 116–122 CrossRef CAS PubMed.
- H. Liu and S. J. Paddison, Phys. Chem. Chem. Phys., 2016, 18, 11000–11007 RSC.
- Z. Li, G. Jeanmairet, T. Méndez-Morales, B. Rotenberg and M. Salanne, J. Phys. Chem. C, 2018, 122, 23917–23924 CrossRef CAS.
- J. Carrete, T. Méndez-Morales, O. Cabeza, R. M. Lynden-Bell, L. J. Gallego and L. M. Varela, J. Phys. Chem. B, 2012, 116, 5941–5950 CrossRef CAS PubMed.
- N. Rezaei-Ghaleh, ChemistryOpen, 2022, 11, e202200080 CrossRef CAS PubMed.
- N. Dubouis, P. Lemaire, B. Mirvaux, E. Salager, M. Deschamps and A. Grimaud, Energy Environ. Sci., 2018, 11, 3491–3499 RSC.
- X. Bogle, R. Vazquez, S. Greenbaum, A. von Wald Cresce and K. Xu, J. Phys. Chem. Lett., 2013, 4, 1664–1668 CrossRef CAS PubMed.
- D. M. Seo, S. Reininger, M. Kutcher, K. Redmond, W. B. Euler and B. L. Lucht, J. Phys. Chem. C, 2015, 119, 14038–14046 CrossRef CAS.
- K. Hayamizu, J. Chem. Eng. Data, 2012, 57, 2012–2017 CrossRef CAS.
- G. R. Fulmer, A. J. M. Miller, N. H. Sherden, H. E. Gottlieb, A. Nudelman, B. M. Stoltz, J. E. Bercaw and K. I. Goldberg, Organometallics, 2010, 29, 2176–2179 CrossRef CAS.
- L. Martínez and S. Shimizu, J. Chem. Theory Comput., 2017, 13, 6358–6372 CrossRef PubMed.
- L. Martínez, J. Mol. Liq., 2022, 347, 117945 CrossRef.
- M. J. Kamlet and R. Taft, J. Am. Chem. Soc., 1976, 98, 377–383 CrossRef CAS.
- R. Taft and M. J. Kamlet, J. Am. Chem. Soc., 1976, 98, 2886–2894 CrossRef CAS.
- M. J. Kamlet, J. L. Abboud and R. Taft, J. Am. Chem. Soc., 1977, 99, 6027–6038 CrossRef CAS.
- V. Gutmann and V. Gutmann, The donor-acceptor approach to molecular interactions, Springer, 1978, vol. 228 Search PubMed.
- C. Reichardt and T. Welton, Solvents and solvent effects in organic chemistry, John Wiley & Sons, 4th edn, 2010 Search PubMed.
- Y. Marcus, The properties of solvents, John Wiley & Sons, Chichester, England, 1998 Search PubMed.
- W. M. Haynes, CRC Handbook of Chemistry and Physics, CRC Press, Hoboken, 95th edn, 2014 Search PubMed.
- M. J. Kamlet, J. L. M. Abboud, M. H. Abraham and R. Taft, J. Org. Chem., 1983, 48, 2877–2887 CrossRef CAS.
- W. Li, C. Molina-Fernandez, J. Estager, J.-C. M. Monbaliu, D. P. Debecker and P. Luis, J. Membr. Sci., 2020, 598, 117790 CrossRef CAS.
- H. L. Parker, J. Sherwood, A. J. Hunt and J. H. Clark, ACS Sustainable Chem. Eng., 2014, 2, 1739–1742 CrossRef CAS.
- V. A. Azov, K. S. Egorova, M. M. Seitkalieva, A. S. Kashin and V. P. Ananikov, Chem. Soc. Rev., 2018, 47, 1250–1284 RSC.
- K. L. Dorris, C. O. Britt and J. E. Boggs, J. Chem. Phys., 1966, 44, 1352–1355 CrossRef CAS.
- J. A. Riddick, W. B. Bunger and T. K. Sakano, Organic solvents: physical properties and methods of purification, Wiley-Interscience, 4th edn, 1986 Search PubMed.
- M. Li, X. Wang, J. Meng, C. Zuo, B. Wu, C. Li, W. Sun and L. Mai, Adv. Mater., 2024, 36, 2308628 CrossRef CAS PubMed.
- H. Lee, S. Hwang, M. Kim, K. Kwak, J. Lee, Y.-K. Han and H. Lee, J. Phys. Chem. Lett., 2020, 11, 10382–10387 CrossRef CAS PubMed.
Footnotes |
| † Electronic supplementary information (ESI) available. See DOI: https://doi.org/10.1039/d5cp00680e |
| ‡ These authors contributed equally to this work. |
| This journal is © the Owner Societies 2025 |