
 Open Access Article
 This Open Access Article is licensed under a
 Creative Commons Attribution 3.0 Unported Licence
Theoretical investigation of F430-catalyzed dehalogenation of chloro-alkanes. A comprehensive DFT benchmark†
Dominik
Dusza
a,
Mateusz
Pokora
 a,
Li
Ji
b and
Piotr
Paneth
*ac
a,
Li
Ji
b and
Piotr
Paneth
*ac
aInternational Center of Research on Innovative Biobased Materials (ICRI-BioM) – International Research Agenda, Lodz University of Technology, Stefanowskiego 2/22, 90-924 Lodz, Poland. E-mail: piotr.paneth@p.lodz.pl
bSchool of Environment Science and Spatial Informatics, China University of Mining and Technology, Xuzhou 221116, China
cInstitute of Applied Radiation Chemistry, Lodz University of Technology, Zeromskiego 116, 90-537 Lodz, Poland
First published on 23rd May 2025
Abstract
We conducted a comprehensive benchmarking study to assess the performance of 40 theoretical levels for modeling the mechanism of dehalogenation of chloromethane by octaethylisobacteriochlorin (OEtiBCh-Ni), a simplified model of the F430 cofactor. Our research has demonstrated a substantial impact of dispersion on the reaction barrier. Additionally, we have identified a correlation between the deformation of the isobacteriochlorin ring and the relative stability of the system. We observe relatively sizeable kinetic isotope effect (KIE) values in the range of 1.010–1.011, which is above the expected values for typical SN2 reactions. The optimal choice for modeling of this reaction is the MN15-L functional with the def2-TZVP basis set, which yields a relative error of less than 3% while exhibiting a high level of computational efficiency. The combination of M06-D3(0), PBE0-D3(BJ), and HSE06-D3(BJ) with 6-31+G(d) also represents a viable option, offering a computational cost comparable to MN15-L/def2TZVP. Calculations using the low-cost def2-SVP basis set are the fastest, but the resulting geometries are questionable.
1. Introduction
Halogenated organic compounds are commonly utilized in industrial and agricultural applications due to their unique physicochemical properties. The presence of halogen atoms in a molecular structure influences its properties,1 including its thermal conductivity, dielectric behavior, and overall chemical reactivity, largely due to the electron-withdrawing nature of these elements. Halogen atoms typically decrease the aqueous solubility of the molecule while enhancing its lipid solubility,2 resulting in a reduced rate of biodegradation as these compounds become sequestered in the fatty tissues of organisms. Such bioaccumulation and inherent toxicity of halogenated compounds make them a potential threat for both the environment and human life. Due to the binding to the lipid layer, the halogenated organic compounds are often classified as persistent organic pollutants (POPs). Nevertheless, the use of halogenated compounds is essential in various industrial processes due to their resistance to both biological and chemical degradation. The most common halogenated contaminants coming from solvents are tetra- and trichloroethylene, dichloroethane, chloroform, vinyl chloride, and carbon tetrachloride. The introduction of such halogenated compounds into the environment occurs through various pathways, including industrial discharges, accidental spills, improper disposal, and the use of biocides. Volatile halogenated compounds can enter the atmosphere and contribute to ozone depletion or other global environmental issues. Those that are less volatile may persist in soils and sediments, posing long-term risks to ecosystems.Over the past several decades, various methodologies for the dehalogenation and remediation of organic compounds have been developed. These include adsorption of volatile compounds3 and compounds in solution,4 photodegradation,5,6 electrochemical degradation,7 thermal degradation,8 and biodegradation, with a particular emphasis on microbial reductive dehalogenation due to their environmental abundance. Microorganisms such as methanogens can mediate processes that break the carbon–halogen bond, leading to the detoxification of organohalides. They inhabit various anaerobic environments including aquatic sediments,9 wetlands or hot springs and they can also be found in landfills10 or the digestive system of animals and humans.11 Central to the methanogenesis is methyl-coenzyme M reductase (MCR) that catalyzes the final step of methane production. This reaction is highly dependent on the presence of a nickel-containing tetrapyrrole cofactor, F430, which then undergoes a redox reaction to facilitate the reduction of methyl to methane. While the primary function of F430 in methanogenesis is well-established, its potential role in dehalogenation represents a frontier in microbial metabolism and environmental chemistry. Studies on methanogens have shown that halogenated compounds can undergo methyl-dismutation resulting in the formation of methane, carbon dioxide and halogenic anions.
One of the fundamental techniques for investigating dehalogenation processes is computational chemistry, particularly the application of efficient density functional theory (DFT) methods. The computational approach allows for the efficient examination of potential reaction mechanisms,12 the selection of optimal reaction conditions, and the preliminary assessment of the sensitivity of a given dehalogenation method. Despite numerous studies aiming at the theoretical modeling of the F430 cofactor reactivity,13–23 thus far no consensus theory level has been established for such modeling.
In this study, we present a comprehensive benchmark of 40 levels of theory (different functionals and basis sets), which were employed to evaluate the Gibbs free energy of activation of the dehalogenation of aliphatic chloroderivatives by the F430 cofactor. Additionally, chlorine kinetic isotope effects (Cl-KIEs) were computed and compared with expected values.24–29
2. Computational details
2.1. DFT calculations
All calculations were performed using the Gaussian 16 rev. C.01 package with default thresholds of convergence.30 Geometries of the reactants were optimized and subsequent vibrational analysis was performed within the harmonic approximation. The SMD continuum solvent model with DMF as the solvent was used.31 7 different DFT functionals, most frequently considered in calculations involving open-shell transition metals,32–35 were considered in the study (% of HF exchange is given in parenthesis): MN15L36 (0%), MN1537 (44%), M0638 (27%), B3LYP39–42 (20%), HSE0643–48 (25%), PBE049,50 (25%), and ωB97X-D51,52 (22%). Since some of them lack explicit dispersion correction, we also decided to verify its impact by applying Grimme's dispersion correction DFT-D353 (with the Becke–Johnson damping function when available).54 The D3(BJ) correction was employed to B3LYP, HSE06, and PBE0, whereas D3(0) was applied to M06.Four types of basis sets were employed in combination with each functional: def2-TZVP, def2-SVP,55 6-31+G(d)56–64 and a dual basis set (referred to henceforth as tzdz): 6-311+G(d,p)65–69 placed on Ni and N atoms in the complexes and Cl and C atoms from the MeCl molecule, while the remaining atoms were treated with 6-31+G(d,p). To ensure the convergence of the electronic structure, the quadratically convergent SCF procedure was used alongside with tight SCF convergence criteria. Default geometry convergence criteria were employed as well as a default integration grid (int = UltraFine) was used. The Wiberg bond orders were calculated using the NBO 3.1 module70 as implemented in Gaussian 16.
To describe the deviation from the planarity of the isobacteriochlorin ring, which occurred at some levels of theory, we use the molecular planarity parameter (MPP) as introduced by Lu.71 The MPP parameter is defined as the root mean square of deviation of the atoms from a fitting plane:
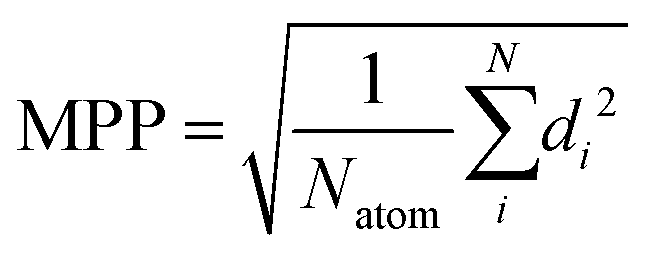 | (1) |
To investigate and visualize the type of interactions present in the system, we used the interaction region indicator (IRI) as described by Lu.72 IRI is defined as:
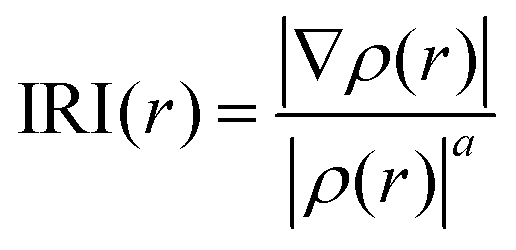 | (2) |
2.2. Isotope effect calculations
The Hessian matrices obtained from the vibrational analysis were used to calculate the theoretical 35Cl/37Cl KIEs at 296.65 K with the ISOEFF code.74 The program is based on the Bigeleisen–Mayer equation:75–77 | (3) |
 ; h and kB are the Planck and Boltzmann constants, respectively, T is the absolute temperature, vi is the real frequency, and v‡ is the imaginary frequency of the transition state. Indices L and H denote light and heavy species, respectively, and ‡ indicates the transition state. The index i runs over all normal modes.
2.3. F430 model
The experimental data are available in the literature only for the truncated model of F430, namely octaethylisobacteriochlorin (OEtiBCh-Ni, presented in Fig. 1) that was used to determine the kinetic rates of reactions with different halides.78 The rate constant for a reaction with methyl chloride in DMF at 296.65 K of 1.1 × 10⁴ M−1 s−1 with a 15% measurement error was converted to the ΔG‡ value according to the Eyring equation, and it corresponds to a value of 11.87 ± 1.78 kcal mol−1. Additionally, Stolzenberg et al. demonstrated that [OEiBCh-Ni(I)]− can serve as a synthetic catalyst that effectively mimics the reactivity of the F430 cofactor.79–82 | ||
| Fig. 1 (a) The chemical structure of OEtiBCh-Ni and the (b) side view of the three-dimensional model of the structure showing the spatial conformation of the ethyl groups. | ||
Since the starting structure of OEtiBCh-Ni is an anion (experimentally, the first step is the reduction of Ni(II) to Ni(I)\, which is skipped in our study), and the key reaction step is the transformation of reduced [OEtiBCh-Ni(I)]− to the 5-coordinated OEtiBCh-Ni(III) complex, both doublet low-spin (LS) and quartet high-spin (HS) states were considered in the pathways to ensure that no spin crossover occurs. An alternative pathway of OEtiBCh–Ni(II)–CH3· formation through the single electron transfer from the methyl substituent is theoretically possible, but Szatkowski and Hall showed this path to be energetically unfavorable.14 The single electron transfer was demonstrated to be unfavorable in the dehalogenation process catalyzed by cobalamin;83 therefore, our research was concentrated on the nucleophilic substitution mechanism exclusively. The pathway was modeled according to the equation in Scheme 1. Fig. 2 presents the structures of (a) complex-1, (b) complex-2, and the (c) transition state.
 | ||
| Scheme 1 Dehalogenation steps of the considered reaction where L = OEtiBCh. | ||
 | ||
| Fig. 2 Structures of (a) complex-1, (b) complex-2, and the (c) transition state. | ||
As the structure of [OEtiBCh-Ni(I)]− features flexible ethyl groups, it seems important to screen its conformational space to find the most stable conformer. We utilized CREST software84 to search for different conformers. The number of conformers obtained was narrowed down based on the RMSD criterion (using Kabsch's algorithm).85 These conformers were then optimized at the B3LYP-D3/def2-SVP level of theory. Using the criterion of energy, the 10 most stable conformers were optimized at the B3LYP-D3/def2-TZVP level of theory. The most stable conformer obtained in this manner was used in all subsequent calculations.
2.4. Estimation of errors
To estimate the overall performance of used functionals and basis sets, we assess their quality by using the following quantities:(a) mean absolute error (MAE):
 | (4) |
(b) relative error (RE):
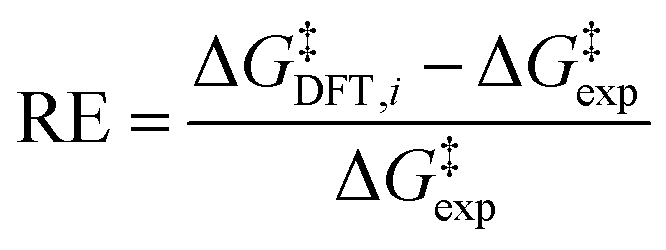 | (5) |
 | (6) |
 :
: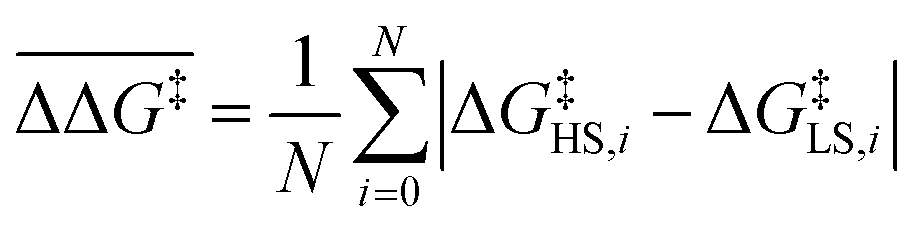 | (7) |
3. Results and discussion
3.1. Spin crossover
To eliminate any potential spin crossover complications, we first examine the discrepancies in the ΔG‡ values between the LS and HS states. The reaction pathways with relative energies, using the B3LYP-D3(BJ) functional with all four basis sets, are illustrated in Fig. 3. Here, zero represents the sum of the energies of the LS substrates (the pathways for the remaining functionals are presented in Section S1 of the ESI†). | ||
| Fig. 3 Reaction pathway as obtained for the LS and HS states at the B3LYP-D3(BJ) functional with various basis sets. | ||
The separation of the LS and HS states differs when different basis sets are employed. The difference between the HS substrates and LS transition state in the case of the presented B3LYP-D3(BJ) are 10.12 kcal mol−1, 5.13 kcal mol−1, 14.40 kcal mol−1, and 15.72 kcal mol−1 for def2-TZVP, def2-SVP, tzdz, and 6-31+G(d), respectively. To quantify the magnitude of this separation, the mean absolute error (MAE) of the Gibbs free energy of activation with respect to the experimental value for each state in each basis set and the mean difference of Gibbs free energy of activation between the HS and LS states  were calculated. The resulting values are presented in Table 1.
 and MAE values for all functionals within the given basis set
| Basis set |
|
State | MAE [kcal mol−1] |
|---|---|---|---|
| def2-TZVP | 11.42 | LS | 4.53 |
| HS | 15.95 | ||
| def2-SVP | 12.07 | LS | 2.90 |
| HS | 16.63 | ||
| 6-31+G(d) | 8.41 | LS | 3.00 |
| HS | 11.41 | ||
| tzdz | 7.01 | LS | 2.92 |
| HS | 10.40 |

As can be seen, the  values span from 7.01 kcal mol−1 to 12.07 kcal mol−1, and the HS Gibbs free energies of activation deviate from the experimental value by 11.42 kcal mol−1, 12.07 kcal mol−1, 8.41 kcal mol−1, and 7.48 kcal mol−1 for def2-TZVP, def2-SVP, 6-31+G(d), and tzdz, respectively, which indicates that there should not be any issue with spin-crossover occurring during the reaction. The ΔG‡ values for HS states are always greater than those for LS states (except for MN15/6-31+G(d) with values of 17.74 kcal mol−1 and 17.27 kcal mol−1 for LS and HS, respectively).
Another issue regarding the LS and HS state separation is the fact that HS substrates and complex-1 are energetically above the TS of the LS. However, in some cases, when using the def2-SVP basis set, the aforementioned trend weakens, and the HS substrates/complex-1 appear below the LS TS on the reaction pathway. The separation seems even stronger in the case of 6-31+G(d) and tzdz basis sets. Using a similar methodology as before for B3LYP-D3(BJ), we can determine the mean separation of HS substrates from the LS transition state for all basis sets. The obtained values are 4.36 kcal mol−1, –1.13 kcal mol−1, 10.18 kcal mol−1, and 8.85 kcal mol−1 for def2-TZVP, def2-SVP, tzdz, and 6-31+G(d), respectively. Although both def2-TZVP and def2-SVP predict the highest differences in the ΔG‡ between the LS and HS states, the separation of the substrates and complex-1 from the LS path appears to be the weakest.
While the reaction paths for LS and HS states are evidently separated when utilizing def2-TZVP, 6-31+G(d), and tzdz basis sets (specifically, HS complex 1 exhibits a higher energy than the TS LS), the situation is ambiguous in the case of the def2-SVP basis set. In order to examine the potential spin cross-over, we decided to perform minimum energy crossing point (MECP) analysis with the easymecp code86 (which is a Python wrapper for the original MECP program developed by Harvey et al.87). In two instances where the HS complex 1 is below the LS TS (PBE0/def2-SVP and PBE0-D3(BJ)/def2-SVP), MECP was identified with energies that are 1.14 kcal mol−1 and 1.23 kcal mol−1 (PBE0/PBE0-D3(BJ)) lower than the corresponding LS TS. It can be assumed that when using the def2-SVP basis set exclusively, the spin crossing-over may occur. Analogous MECP analysis for PBE0/def2-TZVP yielded MECP 5.25 kcal mol−1 higher than the LS TS, which may confirm that the visible reaction pathway separation is sufficient to ensure the spin-selective manner. It can be safely assumed that in the cases of 3 basis sets (def2-TZVP/tzdz/6-31+G(d)), the spin crossover should not occur, therefore, the remaining part of the discussion will focus exclusively on the LS states.
3.2. Gibbs free energy of activation
Fig. 4 depicts the ΔG‡ values of the LS state for all considered levels of theory (for exact values, see Table S1, ESI†). The ΔG‡ for all levels are calculated with respect to either isolated substrates or complex 1, depending on their relative energy (see Table S1, ESI†). The blue rectangle represents the area of the experimental value including the measured error (11.87 ± 1.78 kcal mol−1). Each square on the graph represents a different level of theory with colors denoting the basis sets. In the plot, we also included ωB97X-V88/def2-TZVP (with 16.7% of HF exchange) for which we did not obtain a full reaction path. | ||
| Fig. 4 ΔG‡ as obtained from every level of theory is considered in the study for the LS state only. The blue rectangles depict the area of the experimental measurement error (11.87 ± 1.78 kcal mol−1) with the dashed line having the 11.87 value. | ||
As can be seen, from among the considered functionals, matches with the experimental range come from M06-D3(0) with 6-31+G(d) (11.97 kcal mol−1), def2-SVP (10.98 kcal mol−1), and tzdz (10.78 kcal mol−1) basis sets, alongside with HSE06-D3(BJ) with def2-TZVP (13.61 kcal mol−1), 6-31+G(d) (11.93 kcal mol−1), and def2-SVP (10.56 kcal mol−1) basis sets. PBE0-D3(BJ)/6-31+G(d) and PBE0-D3(BJ)/def2-SVP yielded values of 11.71 kcal mol−1 and 10.92 kcal mol−1, respectively, whereas B3LYP-D3(BJ)/def2-TZVP, MN15-L/def2-TZVP, and ωB97X-D/tzdz predicted values 10.69 kcal mol−1, 11.52 kcal mol−1, and 13.68 kcal mol−1, respectively. In terms of the basis sets, 6-31+G(d), def2-TZVP, and def2-SVP in combination with the 3 functionals predicted the right value, and tzdz with only 2 functionals. In addition, we also checked the dispersion uncorrected BP8689,90 functional with the def2-TZVP basis set, which yielded Gibbs free energy of activation of 17.02 kcal mol−1.
To further assess what impacts the Gibbs free energy of activation, we performed additional tests. Firstly, we considered the impact of the low-valued frequency on thermochemistry, by applying (1) Truhlar's entropy extrapolation to 100 cm−1,91 (2) Grimme's quasi-RRHO entropy interpolation,92 (3) Minenkov's quasi-RRHO entropy and the internal energy interpolation,93 to the results from the def2-TZVP basis set. In each case, the average contribution to the ΔG‡ was around 1 kcal mol−1 (see Table S2 for details, ESI†).
The formation of complex 1 is associated with a loss of entropy within the range of 5.00–9.36 kcal mol−1 K−1 (with an average of 8.00 kcal mol−1 K−1 as predicted when using the def2-TZVP basis sets, see Table S2, ESI†). Applying Grimme's correction to low frequencies shifts this range to 8.50–10.70 kcal mol−1 K−1 (with an average of 9.95 kcal mol−1 K−1). Based on these results, it can be assumed that the low-valued frequencies may be left untreated without the loss of accuracy.
The impact of the continuum model solvent was also verified by applying the PCM model solvent to the MN15L/def2-TZVP level of theory. The ΔG‡ obtained in that way was lower by only 0.84 kcal mol−1 which means the choice of the solvent model has no impact on accuracy.
Finally, we also verified the impact of the HF exchange by varying its value in the B3LYP/def2-TZVP: BLYP (0%), B3LYP* (15%), and B3LYP (20%). The obtained ΔG‡ are 16.25 kcal mol−1, 17.05 kcal mol−1, and 20.34 kcal mol−1 for BLYP, B3LYP*, and B3LYP, respectively, which shows the tendency to overestimate the reaction barrier with the increasing amount of HF exchange.
We also tested the combination of the def2-TZVP single-point energy with thermal correction as calculated by the def2-SVP basis set for the chosen functionals. The results are gathered in Table 2. Generally, the difference between full def2-TZVP and combined def2-SVP/TZVP is around 1 kcal mol−1. Encouraged by the promising results, we investigated meta-GGA functionals (B97M-V94 and ωB97M-V88 with 15% of HF exchange) by the means of the basis set combination, and received the Gibbs free energy of activation of 20.46 kcal mol−1 and 10.69 kcal mol−1, respectively, the latter being within the experimental range.
| Functional | ΔG‡ (SVP/TZVP) | ΔG‡ (TZVP) | ΔΔG‡ |
|---|---|---|---|
| B3LYP-D3 | 12.04 | 10.68 | –1.36 |
| PBE0-D3 | 15.16 | 14.33 | −0.83 |
| HSE06-D3 | 14.83 | 13.61 | –1.22 |
| MN15L | 11.89 | 11.52 | –0.37 |
| M06 | 14.82 | 15.83 | 1.02 |
| ωB97M-V | 20.46 | – | – |
| B97M-V | 10.69 | – | – |
3.3. Significance of dispersion correction
From the functionals considered, it can be seen that all the variations lacking the empirical dispersion correction failed to predict the experimental value. In the case of the MN15 and MN15-L functionals, the inclusion of the D3(BJ) correction with the def2-TZVP basis set resulted in a change of the ΔG‡ value by less than 0.1 kcal mol−1; hence, we decided not to apply it in their case. The dispersion correction in their case also did not affect the geometry in any significant way. In the case of the functionals that were considered with and without the dispersion correction, the employment of the D3(BJ) method resulted in lowering the ΔG‡ value on average by 8.86 kcal mol−1, 5.34 kcal mol−1, and 4.74 kcal mol−1 for B3LYP, HSE06, and PBE0, respectively.To investigate the impact of the dispersion on the Gibbs free energy of activation, we performed the interaction region indicator (IRI) analysis of the TS structure at the B3LYP-D3(BJ)/def2-TZVP level of theory, which is presented in Fig. 5.
 | ||
| Fig. 5 Visualization of the interaction region indicator (IRI). Blue regions indicate attractive interactions (here: chemical bonds), green regions indicate van der Waals interactions and red regions indicate repulsive interactions. Both structures of TS without (a) and with the (b) IRI surfaces are taken from the B3LYP-D3(BJ)/def2-TZVP level of theory. | ||
The IRI analysis provides a graphical representation of the three principal types of interactions present within the system. The red, green, and blue surfaces indicate the presence of repulsive, dispersive, and attractive interactions, respectively. The IRI analysis indicates that the regions surrounding the ethyl group are the primary source of the dispersion interactions occurring within the system. It is noteworthy that the green regions are visible between the ethyl groups and the hydrogens of the iBCh ring, the ethyl groups themselves, and also between the ethyl groups and the pyrrole/pyrroline rings of the isobacteriochlorin ring.
Upon the introduction of methyl chloride, which leads to the transition state, a significant surface area of the interaction between the ethyl group and MeCl emerges (illustrated in Fig. 5b). However, there is also an interaction region between the nitrogen atoms, which could indicate some interactions with the π-electrons. This effect can explain the significant impact of the dispersion correction not only on the relative energy of the substrate but also on the resultant Gibbs free energy of activation. Given that the target F430 cofactor system comprises an even greater number of labile groups, it may be reasonably assumed that dispersive interactions will play an even more significant role in this system. Accordingly, any attempt to model such systems must take into account the potential influence of dispersive forces.
3.4. Impact of the planarity of the isobacteriochlorin ring
In several cases, a high deviation of the iBCh ring from the planarity was observed. When the deformation of the ring was a consequence of the geometry optimization of the substrate [OEtiBCh-Ni(I)]−, it had a significant impact on the Gibbs free energy of activation. The problem manifested itself mainly with the use of the MN15 functional in each basis set considered, but we also encountered this problem with preliminary calculations on the smaller iBCh model lacking side ethyl groups (see Section S4, ESI†). Fig. 6 depicts two configurations of the [OEtiBCh-Ni(I)]− structure at the MN15/tzdz level of theory with two distinct molecular planarity parameter (MPP) values.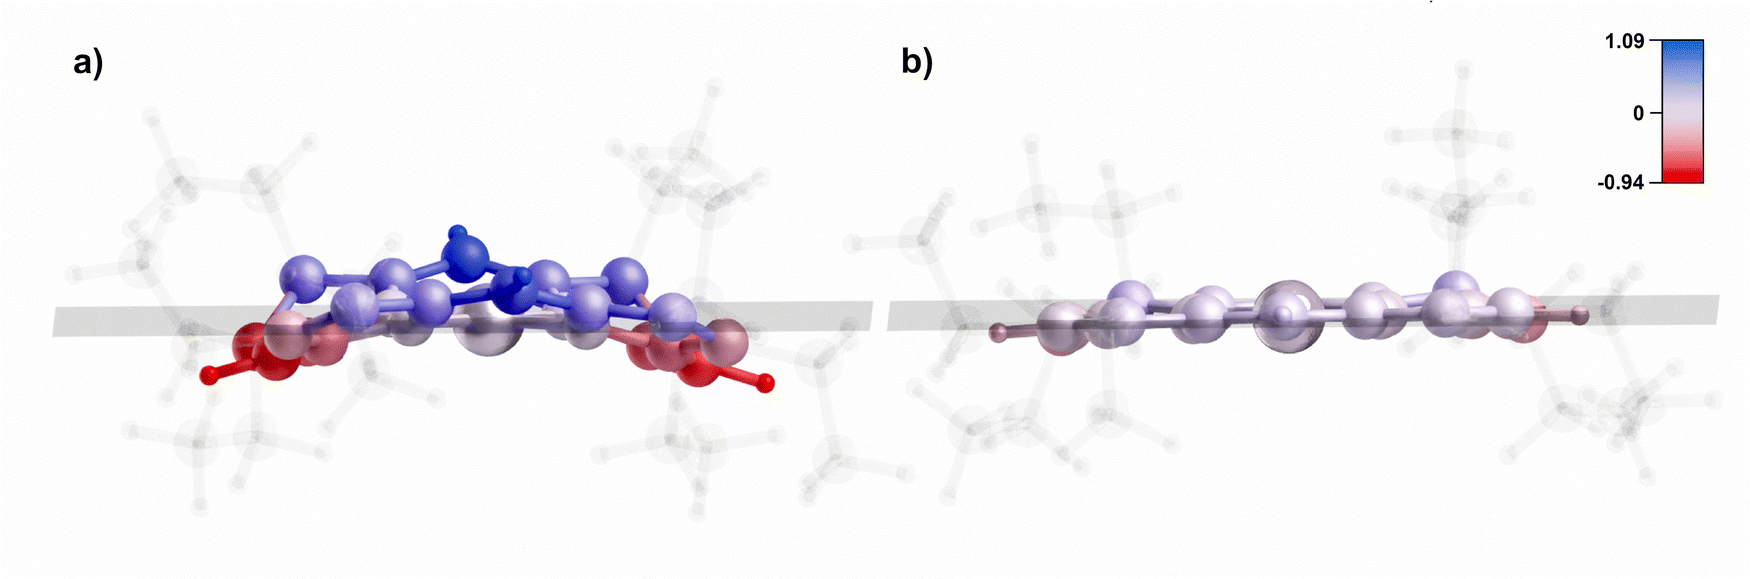 | ||
| Fig. 6 [OEtiBCh-Ni(I)]− structure obtained at the MN15/tzdz level of theory with the MPP value of (a) 0.534 Å and (b) 0.099 Å. The coloring indicates either positive (blue) or negative (red) deviation from the planarity (the scale is in Å). The ethyl groups are made semi-transparent for visual clarity. | ||
In the presented case of MN15/tzdz, the more planar structure is a minimum with a relative Gibbs free energy of –11.54 kcal mol−1. This results in a change of the ΔG‡ from 3.47 kcal mol−1 (with respect to the less planar structure) to 15.01 kcal mol−1 (with respect to the more planar structure). An additional spin population analysis (Fig. S3, ESI†) indicated that in the planar structure, the radical was formed on the nickel atom, whereas in the distorted structure it was spread on the isobacteriochlorin ring. This issue can be readily identified by examining the MPP values of the substrates (see Table S5 for MPP values for all considered structures, ESI†). While at some levels of theory it may be challenging to accurately capture the energetically more favorable structure of the planar [OEtiBCh-Ni(I)]− and may be time-consuming, it always appears to be a better minimum, effectively increasing the Gibbs free energy of activation. Nevertheless, despite our awareness of this issue, we were unable to identify the planar structure in the case of MN15/def2-TZVP. The apparent minimum found, although it had a low MPP value, showed an imaginary vibration frequency in the direction of bending the isobacteriochlorin ring plane, and the obtained ΔG‡ value is with respect to complex-1. Consequently, the reported value for MN15/def2-TZVP may be an underestimate.
In some cases, the MPP values allow us to estimate the relative energy of the structure. For example, in the case of M06-D3(0)/tzdz, we observed that complex-1 exhibits a lower Gibbs free energy than the isolated substrates by 0.92 kcal mol−1. The MPP values for the substrate and complex-1 are 0.092 Å and 0.078 Å, respectively. Another illustrative example is B3LYP-D3(BJ)/def2-SVP, wherein complex-1 exhibits Gibbs free energy that is 0.65 kcal mol−1 lower than that of the substrate, with the MPP values of the substrate and complex-1 being 0.118 Å and 0.113 Å, respectively. As the MPP difference increases, so does the Gibbs free energy difference: in the case of MN15/def2-TZVP, the MPP values for the substrate and complex-1 are 0.503 Å and 0.104 Å, respectively, with a G difference of 7.00 kcal mol−1. Unfortunately, this relationship is not maintained in the case of MN15-L/def2-SVP and tzdz with a difference in G of 0.36 kcal mol−1 and 2.29 kcal mol−1 favoring complex-1, respectively, but the MPP values for the substrate and complex-1 are 0.119 Å and 0.143 Å in the case of def2-SVP, respectively, and 0.096 Å and 0.120 Å for tzdz, respectively.
In the case of the MN15 functional, it can be observed that the deformation of the ring results in a reduction of the N–Ni bond lengths. In all other functionals in all basis sets, the N–Ni bond lengths are in the range of 2.04–2.06 Å. However, in the case of MN15, the bonds are shortened to 1.94 Å. While significant MPP values are observed also for TS structures obtained with the def2-SVP basis set, the N–Ni bonds are not shortened. It is noteworthy that the deviation from planarity, in this case, appears to have a different source than in the case of MN15 substrates. While the MN15 structures appear to be bent equally on both sides, in the case of the def2-SVP transition states, there is a significant bending of the neighborhood of the linking carbon atom between the pyrrolidine rings.
Although the MPP value may be useful in the estimation of the relative energy, and it appears that the deformation of the iBCh ring, if present, has a significant effect on the barrier value, complex-1 sometimes demonstrates greater stability than the isolated substrates, even though the ring within complex-1 exhibits higher deviation from the planarity. In addition to the planarity of the iBCh ring, other factors may contribute to the relative stability of the system.
3.5. Chlorine kinetic isotope effects (Cl-KIEs)
In the absence of experimental data regarding the Cl-KIE values for the dehalogenation reaction of chloromethane by the porphyrin nickel(I) derivative anion, it is necessary to rely on the typical range of KIEs for reactions which is reported to be 1.006–1.009.95 A more recent experimental study regarding the reduction of chlorine derivatives of alkanes by vitamin B12 (whose core, the corrin ring, resembles the porphyrin ring) reports values of 1.005.96The theoretical Cl-KIE values for the considered reaction span from 1.0089 to 1.0118. The def2-SVP basis set yielded both extreme values, with the lowest being obtained from M06-D3(0) and the highest from PBE0-D3(BJ). When the values are averaged across all basis sets, each functional yielded values in the range of 1.010 – 1.011, which is above the expected value of a typical SN2 reaction. The studies regarding the SN2 dehalogenation reactions of MeCl show a correlation between the computed KIE values and the Wiberg bond orders for the Cα–Cl bonds in the transition. The corresponding Wiberg bond orders range from 0.44 to 0.63, as evidenced by the plot of the Cl-KIEs as a function of the Wiberg bond order presented in Fig. 7 (for exact values, see Table S7, ESI†).
 | ||
| Fig. 7 Correlation of Cl-KIEs with the transition-state Wiberg Cα–Cl bond orders. The values outlined with a black circular border indicate the KIEs for 11 levels of theory that yielded the ΔG‡ value within the experimental range. | ||
The values presented here are partially in agreement with the study conducted by Szatkowski and Hall.14 The Cl-KIE values for the smaller model of iBCh (a model lacking the ethyl groups that was used in their study) were found to be in the range of 1.0084–1.0102. However, the low values of Wiberg bond orders, ranging from 0.0967 to 0.1218, are in stark contrast to the findings presented here. The Cl-KIE values presented here provide further insight into the dehalogenation process by porphyrin derivative ligands with nickel(I) anions, which particularly exhibit large values.
4. Conclusions
We have carried out a comprehensive benchmark of DFT functionals and basis sets for modeling the organo-chloride dehalogenation with a porphyrin derivative ligand nickel(I) anion [OEtiBCh-Ni(I)]− as a model of the F430 cofactor model. Through the use of the interaction region indicator (IRI) analysis, we were able to confirm the significance of dispersion effects on the reaction and the subsequent value of the Gibbs free energy of activation. It is clear that dispersion forces play a crucial role in stabilizing the transition state through interactions between the side ethyl groups and nitrogen atoms; therefore, the applied level of theory must take into account the dispersion forces.We showed a relationship between the planarity of the isobacteriochlorin ring and the relative stability of the substrate. A deviation of the structure from planarity can increase the relative energy, leading to the underestimated value of the ΔG‡. The deviation can be estimated easily by the molecular planarity parameter (MPP) that can be used to make a preliminary estimate of the relative energy of the substrates. When comparing the same type of structures with different values of the MPP (for example, two substrates), a lower MPP value indicates greater stability. However, when comparing two different types of structures (for example, the substrate and complex-1), this relationship is not always preserved. We identified two main types of deformation: simultaneous bending of the two sides (like a sheet of paper) exhibited by MN15 substrates and the folding of the neighborhood of the carbon atom connecting the pyrrolidine rings exhibited by def2-SVP transition states.
Of the total 40 levels of theory present in our study, 11 of them have yielded the ΔG‡ within the experimental range. These include PBE0-D3(BJ) functionals with the def2-SVP and 6-31+G(d) basis sets, M06-D3(0) functional with def2-SVP, 6-31+G(d), and tzdz basis sets, MN15-L/def2-TZVP, ωB97X-D/tzdz, HSE06-D3(BJ) functional with def2-TZVP, def2-SVP, and 6-31+G(d) basis sets, and B3LYP-D3(BJ)/def2-TZVP. In the light of the computational cost and obtained values of ΔG‡ and Cl-KIE, we recommend MN15-L/def2-TZVP as a solid and surprisingly inexpensive level of theory. The predicted ΔG‡ value deviates from the experimental value by only 0.35 kcal mol−1 with a predicted KIE value of 1.010, which is only slightly larger than the expected value.
The remaining alternatives are M06-D3(0), PBE0-D3(BJ), and HSE06-D3(BJ), which may be employed in conjunction with the 6-31+G(d) basis sets. Although these methods are slightly more computationally expensive, their predictions of ΔG‡ are even more accurate, differing by less than 0.2 kcal mol−1. The 6-31+G(d) basis set, although relatively small, appears to accurately predict the Gibbs free energy of activation and geometries. However, the predicted KIEs fall within the range of 1.010–1.012, which is considerably higher than expected.
The use of the def2-SVP basis set, despite its capacity to accurately predict ΔG‡ values, has been observed to frequently yield problematic geometries. This phenomenon manifests as a considerable deformation of the isobacteriochlorin ring in the transition states, which can result in underestimated barriers. Consequently, the choice of the def2-SVP basis set, while representing the most economical option within our benchmark analysis, may necessitate caution when interpreting its results, particularly in regard to geometrical accuracy. The predicted KIE values are also the highest among the 11 considered levels of theory. Therefore, we recommend the use of this basis set only for preliminary calculations, given its affordability and speed.
Data availability
The Cartesian coordinates of both the LS and HS states are available at Zenodo (https://doi.org/10.5281/zenodo.14138469).Conflicts of interest
There are no conflicts to declare.Acknowledgements
These studies were supported by the collaborative (P. P. & L. J.) grant 2023/48/Q/ST10/00247 from the National Research Council, Poland. This work has been completed while M. P. was a doctoral candidate in the Interdisciplinary Doctoral School at the Lodz University of Technology, Poland. We gratefully acknowledge Poland's high-performance Infrastructure, PLGrid ACK Cyfronet AGH (grant no. PLG/2024/017453), and the Poznan Supercomputing and Networking Center (grant no. pl0349-01) for providing computer facilities and support. Access to the resources of the Blueocean cluster at the Lodz University of Technology is also acknowledged.References
- M. M. Häggblom and I. D. Bossert, in Dehalogenation: Microbial Processes and Environmental Applications, Springer US, Boston, MA, 2003, pp. 3–29 Search PubMed.
- A. Priimagi, G. Cavallo, P. Metrangolo and G. Resnati, Acc. Chem. Res., 2013, 46, 2686–2695 CrossRef CAS PubMed.
- X. Yue, N. L. Ma, C. Sonne, R. Guan, S. S. Lam, Q. Van Le, X. Chen, Y. Yang, H. Gu, J. Rinklebe and W. Peng, J. Hazard. Mater., 2021, 405, 124138 CrossRef CAS PubMed.
- D. Q. Zhang, W. L. Zhang and Y. N. Liang, Sci. Total Environ, 2019, 694, 133606 CrossRef CAS PubMed.
- S. O. Obare and G. J. Meyer, J. Environ. Sci. Health, Part A: Toxic/Hazard. Subst. Environ. Eng., 2004, 39, 2549–2582 CrossRef PubMed.
- C. Solá-Gutiérrez, S. Schröder, M. F. San-Román and I. Ortiz, J. Environ. Manage., 2020, 260, 110101 CrossRef PubMed.
- C. Fang, M. Megharaj and R. Naidu, J. Adv. Oxid. Technol., 2017, 20, 2017001 Search PubMed.
- M. Altarawneh, A. Saeed, M. Al-Harahsheh and B. Z. Dlugogorski, Prog. Energy Combust. Sci., 2019, 70, 212–259 CrossRef.
- A. Söllinger and T. Urich, Biochem. Soc. Trans., 2019, 47, 1895–1907 CrossRef PubMed.
- E. R. Fielding, D. B. Archer, E. C. de Macario and A. J. L. Macario, Appl. Environ. Microbiol., 1988, 54, 835–836 CrossRef CAS PubMed.
- N. Belay, R. Johnson, B. S. Rajagopal, E. Conway de Macario and L. Daniels, Appl. Environ. Microbiol., 1988, 54, 600–603 CrossRef CAS PubMed.
- S. Zhang, W. Wen, X. Xia, W. Ouyang, B. Mai, L. Adrian and G. Schüürmann, Environ. Sci. Technol., 2023, 57, 10773–10781 CrossRef CAS PubMed.
- T. Wondimagegn and A. Ghosh, J. Am. Chem. Soc., 2000, 122, 6375–6381 CrossRef CAS.
- L. Szatkowski and M. B. Hall, Dalton Trans., 2016, 45, 16869–16877 RSC.
- A. Ghosh and J. Conradie, J. Inorg. Biochem., 2023, 243, 112199 CrossRef CAS PubMed.
- J. L. Craft, Y.-C. Horng, S. W. Ragsdale and T. C. Brunold, JBIC, J. Biol. Inorg. Chem., 2004, 9, 77–89 CrossRef CAS PubMed.
- J. L. Craft, Y.-C. Horng, S. W. Ragsdale and T. C. Brunold, J. Am. Chem. Soc., 2004, 126, 4068–4069 CrossRef CAS PubMed.
- J. Wu and S.-L. Chen, Chem. Commun., 2021, 57, 476–479 RSC.
- E. C. Duin and M. L. McKee, J. Phys. Chem. B, 2008, 112, 2466–2482 CrossRef CAS PubMed.
- M. Dey, R. C. Kunz, K. M. Van Heuvelen, J. L. Craft, Y.-C. Horng, Q. Tang, D. F. Bocian, S. J. George, T. C. Brunold and S. W. Ragsdale, Biochemistry, 2006, 45, 11915–11933 CrossRef CAS PubMed.
- S. Chen, V. Pelmenschikov, M. R. A. Blomberg and P. E. M. Siegbahn, J. Am. Chem. Soc., 2009, 131, 9912–9913 CrossRef CAS PubMed.
- T. Wondimagegn and A. Ghosh, J. Phys. Chem. B, 2000, 104, 10858–10862 CrossRef CAS.
- P. Bharadwaz, M. Maldonado-Domínguez, J. Chalupský and M. Srnec, J. Am. Chem. Soc., 2023, 145, 9039–9051 CrossRef CAS PubMed.
- Z. S. Jia, J. Rudziński, P. Paneth and A. Thibblin, J. Org. Chem., 2002, 67, 177–181 CrossRef CAS PubMed.
- P. Paneth, Acc. Chem. Res., 2003, 36, 120–126 CrossRef CAS PubMed.
- D. Sicinska, M. Rostkowski and P. Paneth, Curr. Org. Chem., 2005, 9, 75–88 CrossRef CAS.
- A. Pabis, P. Paluch, J. Szala and P. Paneth, J. Chem. Theory Comput., 2009, 5, 33–36 CrossRef CAS PubMed.
- ed. A. Kohen and H.-H. Limbach, in Isotope Effects In Chemistry and Biology, CRC Press, 2005 Search PubMed.
- L. Szatkowski, R. N. Manna, A. Grzybkowska, R. Kamiński, A. Dybala-Defratyka and P. Paneth, in Methods in Enzymology, ed. M. E. Harris and V. E. Anderson, Academic Press, 2017, vol. 596, pp. 179–215 Search PubMed.
- M. J. Frisch, G. W. Trucks, H. B. Schlegel, G. E. Scuseria, M. A. Robb, J. R. Cheeseman, G. Scalmani, V. Barone, G. A. Petersson, H. Nakatsuji, X. Li, M. Caricato, A. V. Marenich, J. Bloino, B. G. Janesko, R. Gomperts, B. Mennucci, H. P. Hratchian, J. V. Ortiz, A. F. Izmaylov, J. L. Sonnenberg, D. Williams-Young, F. Ding, F. Lipparini, F. Egidi, J. Goings, B. Peng, A. Petrone, T. Henderson, D. Ranasinghe, V. G. Zakrzewski, J. Gao, N. Rega, G. Zheng, W. Liang, M. Hada, M. Ehara, K. Toyota, R. Fukuda, J. Hasegawa, M. Ishida, T. Nakajima, Y. Honda, O. Kitao, H. Nakai, T. Vreven, K. Throssell, J. A. Montgomery Jr., J. E. Peralta, F. Ogliaro, M. J. Bearpark, J. J. Heyd, E. N. Brothers, K. N. Kudin, V. N. Staroverov, T. A. Keith, R. Kobayashi, J. Normand, K. Raghavachari, A. P. Rendell, J. C. Burant, S. S. Iyengar, J. Tomasi, M. Cossi, J. M. Millam, M. Klene, C. Adamo, R. Cammi, J. W. Ochterski, R. L. Martin, K. Morokuma, O. Farkas, J. B. Foresman and D. J. Fox, Gaussian 16 Revision C.01, 2016 Search PubMed.
- A. V. Marenich, C. J. Cramer and D. G. Truhlar, J. Phys. Chem. B, 2009, 113, 6378–6396 CrossRef CAS PubMed.
- Y. Ma, ChemRxiv, 2020, preprint DOI:10.26434/chemrxiv.11888838.v2.
- S. Havenridge and C. Liu, J. Phys. Chem. A, 2024, 128, 3947–3956 CrossRef CAS PubMed.
- M. Steinmetz and S. Grimme, ChemistryOpen, 2013, 2, 115–124 CrossRef CAS PubMed.
- D. A. Wappett and L. Goerigk, J. Chem. Theory Comput., 2023, 19, 8365–8383 CrossRef CAS PubMed.
- H. S. Yu, X. He and D. G. Truhlar, J. Chem. Theory Comput., 2016, 12, 1280–1293 CrossRef CAS PubMed.
- H. S. Yu, X. He, S. L. Li and D. G. Truhlar, Chem. Sci., 2016, 7, 5032–5051 RSC.
- D. G. Truhlar and Y. Zhao, Theor. Chem. Acc., 2008, 120, 215–241 Search PubMed.
- A. D. Becke, J. Chem. Phys., 1993, 98, 5648–5652 CrossRef CAS.
- C. Lee, W. Yang and R. G. Parr, Phys. Rev. B: Condens. Matter Mater. Phys., 1988, 37, 785–789 CrossRef CAS PubMed.
- S. H. Vosko, L. Wilk and M. Nusair, Can. J. Phys., 1980, 58, 1200–1211 CrossRef CAS.
- P. J. Stephens, et al. , J. Phys. Chem., 1994, 98, 11623–11627 CrossRef CAS.
- J. Heyd and G. E. Scuseria, J. Chem. Phys., 2004, 121, 1187–1192 CrossRef CAS PubMed.
- J. Heyd and G. E. Scuseria, J. Chem. Phys., 2004, 120, 7274–7280 CrossRef CAS PubMed.
- J. Heyd, J. E. Peralta, G. E. Scuseria and R. L. Martin, J. Chem. Phys., 2005, 123, 174101 CrossRef PubMed.
- T. M. Henderson, A. F. Izmaylov, G. Scalmani and G. E. Scuseria, J. Chem. Phys., 2009, 131, 044108 CrossRef PubMed.
- A. F. Izmaylov, G. E. Scuseria and M. J. Frisch, J. Chem. Phys., 2006, 125, 104103 CrossRef PubMed.
- A. V. Krukau, O. A. Vydrov, A. F. Izmaylov and G. E. Scuseria, J. Chem. Phys., 2006, 125, 224106 CrossRef PubMed.
- J. P. Perdew, K. Burke and M. Ernzerhof, Phys. Rev. Lett., 1996, 77, 3865–3868 CrossRef CAS PubMed.
- C. Adamo and V. Barone, J. Chem. Phys., 1999, 110, 6158–6170 CrossRef CAS.
- J.-D. Chai and M. Gordon-Head, Phys. Chem. Chem. Phys., 2008, 10, 6615–6620 RSC.
- J.-D. Chai and M. Head-Gordon, J. Chem. Phys., 2008, 128, 084106 CrossRef PubMed.
- S. Grimme, J. Antony, S. Ehrlich and H. Krieg, J. Chem. Phys., 2010, 132, 154104 CrossRef PubMed.
- S. Grimme, S. Ehrlich and L. Goerigk, J. Comput. Chem., 2011, 32, 1456–1465 CrossRef CAS PubMed.
- F. Weigend and R. Ahlrichs, Phys. Chem. Chem. Phys., 2005, 7, 3297 RSC.
- R. Ditchfield, W. J. Hehre and J. A. Pople, J. Chem. Phys., 1971, 54, 724–728 CrossRef CAS.
- W. J. Hehre, R. Ditchfield and J. A. Pople, J. Chem. Phys., 1972, 56, 2257–2261 CrossRef CAS.
- P. C. Hariharan and J. A. Pople, Theor. Chim. Acta, 1973, 28, 213–222 CrossRef CAS.
- P. C. Hariharan and J. A. Pople, Mol. Phys., 1974, 27, 209–214 CrossRef CAS.
- M. M. Francl, W. J. Pietro, W. J. Hehre, J. S. Binkley, M. S. Gordon, D. J. DeFrees and J. A. Pople, J. Chem. Phys., 1982, 77, 3654–3665 CrossRef CAS.
- R. C. Binning Jr. and L. A. Curtiss, J. Comput. Chem., 1990, 11, 1206–1216 CrossRef.
- J.-P. Blaudeau, M. P. McGrath, L. A. Curtiss and L. Radom, J. Chem. Phys., 1997, 107, 5016–5021 CrossRef CAS.
- V. A. Rassolov, J. A. Pople, M. A. Ratner and T. L. Windus, J. Chem. Phys., 1998, 109, 1223–1229 CrossRef CAS.
- V. A. Rassolov, M. A. Ratner, J. A. Pople, P. C. Redfern and L. A. Curtiss, J. Comput. Chem., 2001, 22, 976–984 CrossRef CAS.
- P. J. Hay, J. Chem. Phys., 1977, 66, 4377–4384 CrossRef CAS.
- K. Raghavachari and G. W. Trucks, J. Chem. Phys., 1989, 91, 1062–1065 CrossRef.
- A. D. McLean and G. S. Chandler, J. Chem. Phys., 1980, 72, 5639–5648 CrossRef CAS.
- R. Krishnan, J. S. Binkley, R. Seeger and J. A. Pople, J. Chem. Phys., 1980, 72, 650–654 CrossRef CAS.
- A. J. H. Wachters, J. Chem. Phys., 1970, 52, 1033–1036 CrossRef CAS.
- E. D. Glendening, J. K. Badenhoop, A. E. Reed, J. E. Carpenter and F. Weinhold, NBO Version 3.1 Search PubMed.
- T. Lu, J. Mol. Model., 2021, 27, 263 CrossRef CAS PubMed.
- T. Lu and Q. Chen, Chem. Methods, 2021, 1, 231–239 CrossRef CAS.
- T. Lu and F. Chen, J. Comput. Chem., 2012, 33, 580–592 CrossRef CAS PubMed.
- V. Anisimov and P. Paneth, J. Math. Chem., 1999, 26, 75–86 CrossRef CAS.
- J. Bigeleisen, J. Chem. Phys., 1949, 17, 675–678 CrossRef CAS.
- J. Bigeleisen, J. Chem. Phys., 1955, 23, 2264–2267 CrossRef CAS.
- J. Bigeleisen and M. Goeppert Mayer, J. Chem. Phys., 1947, 15, 261–267 CrossRef CAS.
- M. C. Helvenston and C. E. Castro, J. Am. Chem. Soc., 1992, 114, 8490–8496 CrossRef CAS.
- G. K. Lahiri and A. M. Stolzenberg, Inorg. Chem., 1993, 32, 4409–4413 CrossRef CAS.
- G. K. Lahiri, L. J. Schussel and A. M. Stolzenberg, Inorg. Chem., 1992, 31, 4991–5000 CrossRef CAS.
- A. M. Stolzenberg and M. T. Stershic, Inorg. Chem., 1987, 26, 3082–3083 CrossRef CAS.
- A. M. Stolzenberg and M. T. Stershic, J. Am. Chem. Soc., 1988, 110, 5397–5403 CrossRef CAS.
- L. Ji, C. Wang, S. Ji, K. P. Kepp and P. Paneth, ACS Catal., 2017, 7, 5294–5307 CrossRef CAS.
- P. Pracht, J. W. R. Morgan and D. J. Wales, J. Chem. Phys., 2023, 159, 064801 CrossRef CAS PubMed.
- W. Kabsch, Acta Crystallogr., Sect. A, 1976, 32, 922–923 CrossRef.
- J. Rodríguez-Guerra, jaimergp/easymecp (version v0.3.2) Zenodo, 2020 Search PubMed.
- J. N. Harvey, M. Aschi, H. Schwarz and W. Koch, Theor. Chem. Acc., 1998, 99, 95–99 Search PubMed.
- N. Mardirossian and M. Head-Gordon, Phys. Chem. Chem. Phys., 2014, 16, 9904–9924 RSC.
- A. D. Becke, Phys. Rev. A: At., Mol., Opt. Phys., 1988, 38, 3098–3100 CrossRef CAS PubMed.
- J. P. Perdew, Phys. Rev. B: Condens. Matter Mater. Phys., 1986, 33, 8822–8824 CrossRef PubMed.
- R. F. Ribeiro, A. V. Marenich, C. J. Cramer and D. G. Truhlar, J. Phys. Chem. B, 2011, 115, 14556–14562 CrossRef CAS PubMed.
- S. Grimme, Chem. – Eur. J., 2012, 18, 9955–9964 CrossRef CAS PubMed.
- A. A. Otlyotov and Y. Minenkov, J. Comput. Chem., 2023, 44, 1807–1816 CrossRef CAS PubMed.
- N. Mardirossian and M. Head-Gordon, J. Chem. Phys., 2015, 142, 074111 CrossRef PubMed.
- A. Dybala-Defratyka, L. Szatkowski, R. Kaminski, M. Wujec, A. Siwek and P. Paneth, Environ. Sci. Technol., 2008, 42, 7744–7750 CrossRef CAS PubMed.
- B. Heckel and M. Elsner, Environ. Sci. Technol., 2022, 56, 6325–6336 CrossRef CAS PubMed.
Footnote |
| † Electronic supplementary information (ESI) available: Figures showing the reaction pathways, exact values of Gibbs free energy of activation, the impact of the dispersion and planarity on the reaction barrier using the smaller iBCh model, exact values of kinetic isotope effects, Wiberg bond orders, Cα–Cl bond stretch values, and the C–Cl stretching frequencies of isolated MeCl molecules in the gas phase. See DOI: https://doi.org/10.1039/d4cp04500a |
| This journal is © the Owner Societies 2025 |