
 Open Access Article
 This Open Access Article is licensed under a
 Creative Commons Attribution 3.0 Unported Licence
Rational design of a methanation reactor by neutron imaging†
Marin
Nikolic
 *ab,
Florian
Kiefer
a,
Alessia
Cesarini
ac,
Ali J.
Saadun
a,
Filippo
Longo
ab,
Pavel
Trtik
d,
Markus
Strobl
d and
Andreas
Borgschulte
*a
*ab,
Florian
Kiefer
a,
Alessia
Cesarini
ac,
Ali J.
Saadun
a,
Filippo
Longo
ab,
Pavel
Trtik
d,
Markus
Strobl
d and
Andreas
Borgschulte
*a
aChemical Energy Carriers and Vehicle Systems Laboratory, Empa – Swiss Federal Laboratories for Material Science and Technology, Überlandstrasse 129, 8600 Dübendorf, Switzerland. E-mail: marin.hrs@gmail.com; andreas.borgschulte@empa.ch
bDepartment of Chemistry, University of Zürich, Winterthurerstrasse 190, 8057 Zürich, Switzerland
cInstitute for Chemical and Bioengineering, Department of Chemistry and Applied Biosciences, ETH Zürich, Vladimir-Prelog-Weg 1-5/10, 8093 Zürich, Switzerland
dPSI Center for Neutron and Muon Sciences, Forschungsstrasse 111, 5232 Villigen, Switzerland
First published on 8th April 2025
Abstract
The reaction conditions in industrial scale chemical reactors can differ markedly from the ones in a small laboratory scale reactor. The differences are both conceptual and practical, and can at best be analysed by studying a full reactor, which requires an analytical method capable of quantifying the distribution of reactants and products in a running reactor. For this, we introduce non-destructive operando neutron imaging in combination with modelling. As a representative reaction, we studied the hydrogenation of carbon dioxide to methane selected due to the large neutron cross-section of hydrogen and hydrogen-containing species. The integration of the measurement setup/reactor into the neutron beamline enables the temporally resolved measurement of the distribution of adsorbed water on the catalyst under operating conditions (p, T). The resulting quantitatively determined partial pressure of the water thus indirectly enables the spatial and temporal conversion of the processes. The knowledge gained from this experimental approach, combined with modelling, allows the design of reactor dimensions under optimized reaction conditions. The good agreement between simulation and experimental neutron imaging warrants the method as a reliable instrument for reactor characterization and design, with the prospect of its application on reactors on the industrial scale.
1 Introduction
With the growing awareness of climate change, CO2 capture and its use to produce carbon-based renewable fuels (“Power-to-X technology”) is becoming increasingly important.1–24 To achieve net zero, renewable fuel production rates have to match the huge production rates of fossil industry. Although a substantial part of the current energy infrastructure can continue to be used,1–24 this means a massive investment in new chemical plants. At the heart of such systems is the catalyst of the conversion reactions, which is therefore the focus of countless R&D projects.25–29 However, the process and reactor design for upscaling30–33 defines the energetic and economic efficiency, capital expenditures (CAPEX) and overall environmental footprint.The central element of a chemical reactor is the catalyst, which defines the basic parameters such as temperature, pressure and maximum performance of the envisioned reactor.29 Accordingly, most research effort is spent on catalyst research. To optimize the effort, the search for new catalysts is conducted in small lab-scale reactors. These lab-scale reactors are designed to mimic the conditions present in a large-scale reactor, that is, gas composition, pressure and temperature, which are supposed to be constant over the whole catalyst bed.34 This is a working hypothesis introduced to simplify analysis, which does not stand up to closer scrutiny. Already at microscopic scale, concentration, potential and temperature gradients in the large catalyst bed may exist, which reproduce with the growth in size.31,35,36 Local hot spots can occur in the bed, affecting both overall reactor performance as well as catalyst stability.23,35,37 Furthermore, a technical reactor is designed for highest conversion. Consequently, the local concentrations of reactants and products vary from very high to very low and vice versa, respectively, over the length of the reactor. In principle, these issues are considered by modelling of an upscaled reactor.38–41 However, the depth of detail of the parameters to be considered is only seldom accessible. Thus the behavior of many parameters such as catalyst conversion as a function of reactants/products concentration is usually extrapolated. Clearly, modelling requires experimental verification,42 preferably on the global as well as on the local scale.
Experimental insight into a running reactor can be gained by recording the temperature of the reactor bed at various locations in correlation with the analysis of product formation and distribution.31,43,44 However, the local intermediates and product distribution are difficult to access indirectly via locally resolved temperature measurements making imaging method a valuable help to optimize fixed bed reactor design parameters45–47 in the upscaling process. Li et al.48 designed a microfabricated catalytic reactor to obtain information on the size, shape and structural changes of heterogeneous catalysts under operation. The microfabricated reactor was equipped with optical windows that allowed operando analysis of the catalyst by synchrotron X-ray absorption spectroscopy and scanning transmission electron microscopy. Nevertheless, this system is only suitable for nanocatalysts and is therefore not scalable. Other approaches to monitor reactions in running reactors or to measure fluid dynamics with only support pellets, i.e. without reaction, have used magnetic resonance imaging to achieve temporal and spatial resolution of the processes in a packed bed reactor.49–51 The NMR technique comes with severe limitations such as being incompatible with paramagnetic catalysts and is thus limited to special model reactors.
In this work, we introduce neutron imaging as a general method to image the distribution of hydrogen containing compounds in reactors in operation. As a proof of concept we imaged a macroscopic reactor for the hydrogenation of CO2 to synthetic methane by neutron radiography. The large neutron scattering cross-section for hydrogen compared to other elements52–54 makes neutron radiography an ideal non-destructive tool to investigate both gaseous and condensed hydrogen-containing phases55,56 in a running reactor without further modifications.55,57 Recently, Cavaye et al. studied the ethene hydrogenation over a carbon-supported palladium catalyst by neutron imaging.58
To demonstrate the feasibility of the approach, we designed a versatile reactor with various macroscopic modifications of the catalyst bed to mimic the conditions in large scale reactors, i.e., macroscopic dimensions deviating from an ideal 1D reactor leading to local effects from mass – and heat transport, local catalyst deactivation, and dead zones.
2 Working principle
The working principle of the approach is at best explained along an experiment shown in Fig. 1. Fig. 1A schematically depicts the principle of neutron imaging in a pellet bed reactor. The neutron beam passes the reactor vessel perpendicular to the mean flow direction of the reactants and its attenuation is recorded. The attenuation is caused by hydrogen species in the reactor, present in gas phase or adsorbed on catalyst and catalyst support. The reactor is an aluminum container with two chambers, which can be individually operated. The neutron image in Fig. 1B reveals the two reactor chambers with the catalyst bed packing, the aluminium walls of the reactor with attached stainless steel screw connections and the adjacent heating jacket with thermocouples. The contrast imaging (Fig. 1C) derived by dividing the image of the reactor in operation by the background image without (or with specific amount) of hydrogen gas gives the distribution of hydrogen containing molecules perpendicular to the neutron beam, integrated over the depth of the reactor parallel to the neutron beam (for more details see Section 8.3). To highlight the working principle of the process, the two reactor chambers are filled differently. One side is filled with pure support pellets without a catalytic Ni coating, while the second reactor chamber is partially filled with a catalytic Ni coating (Fig. 1B). The two reactor chambers are connected by four small holes that allow exchange between the chambers (Fig. 1B and 6A). In this experimental setup, the valve to the left chamber containing the bare support pellets is closed, so that only the chamber containing the active catalyst material is flushed with reactants and thus also purged (Fig. 1B). This left reactor chamber can therefore be considered an extreme example of a dead zone. | ||
| Fig. 1 (A) Schematic representation of the macroscopic and microscopic processes visualized by neutron imaging. The intensity of the neutron beam is reduced in proportion to the quantity of hydrogen-containing molecules present on and within the catalyst. This approach enables insights into the process and the quantification of the hydrogenated species. (B) Neutron radiography of the reactor (for more details see Sections 8.2 and 8.3) with the corresponding catalyst bed packing. The valve for the reactor bed with support only was closed to demonstrate the working principle. (C) Neutron radiography images processed with a filter function (see Section 8.3) demonstrating the water diffusion over time into the reactor bed with support only at 300 °C and 5 bar. | ||
The products and intermediates are formed in the active catalyst bed, which is observed by an increase in neutron contrast (see Fig. 1C). Quickly, after few minutes, the complete active catalyst bed shows high contrast fast (dark area in the right hand side chamber), i.e. saturated with products and intermediates. Slowly after the saturation of the catalytically active sample, the connected non-active catalyst bed is increasing in contrast as well, indicating the diffusion and subsequent adsorption of hydrogen containing products. Eventually, both reactor chambers cannot be distinguished anymore. This observation is relevant for the interpretation of the results. The experimental configuration and procedure is designed to extract dynamic information, i.e., the evolution of contrast changes developing upon external stimuli. E.g., diffusivity of products in the catalyst pellets can be estimated by following the diffusion front in the non-catalytic bed. A diffusion parameter of D ≃ Δx2Δt−1 = 2.1 × 10⁻⁷ m2 s−1 is obtained (Fig. 1C). This finding aligns well with literature for water vapor diffusion into catalysts in a methane atmosphere at that temperature and partial pressure,59 indicating that the increase in contrast results mostly from water diffusion into the support pellets. In general, one cannot distinguish between methane and water as main products, nor whether the products are in the gas phase or adsorbed on the support/catalyst. However, the adsorption of methane at the operation temperature is negligible (see ESI,† Section S1).60–65 Furthermore, the density of protons as adsorbed water is much larger than the one in the gas phase (see Section S1, ESI†).61,62,66 In summary, the neutron images map the amount of locally adsorbed water.
3 Time dependent processes
The highest neutron contrast is observed during the start-up of a reactor. Though we are aiming at investigating the steady-state distribution (see Section 4), the change from initial to steady-state is ideal to calibrate the system, as the limit states are defined. For this and all subsequent experimental sequences, a different bed packing was used. One chamber is completely filled with the catalytically active sample, while the second chamber is filled with interruptions of the catalytically active material in order to better investigate the conversion along the reactor axis (Fig. 2C). The initial state is the dried reactor at reaction temperature. Steady-state is empirically defined as the state of reactor after long-time running without observable changes. The latter are measured by the change in neutron attenuation on one hand, and the flow of the products leaving the reactor on the other. | ||
| Fig. 2 (A) Theoretical produced water content at 100% conversion (solid line), total water content in the reactor bed (empty squares), and front position (solid squares) over time at 300 °C and 1 atm of the left reactor cell (catalyst only, see (C)). The total water content and front position were derived from neutron data. The front position was determined using a threshold of 0.98 in the neutron contrast (see eqn (3)). (B) Corresponding FTIR gas data with CO2 and CH4 in molar concentrations and H2O in arbitrary units recorded from both reactor cells. (C) Neutron radiography of the reactor (for more details see Section 8.2) with the corresponding catalyst bed packing. Gas was fed to both reactor sections. (D) Neutron radiography images processed with a filter function (see Section 8.3) at different times of the process. | ||
At a reaction temperature of ≃300 °C practically 100% conversion of the CO2 is reached as indicated by the negligible amount of CO2 in the exhaust stream (product gas composition analyzed by a FTIR gas analyzer, see Fig. 2B). While CH4 leaves the reactor, initially no water is measured. The neutron images confirm that this water is adsorbed in the catalyst visible as a front moving through the catalyst bed (Fig. 2D). Fig. 2A and Fig. S1 (ESI†) compare the position of the front over time with the total water content in the reactor as derived from the integrated neutron attenuation assuming that only adsorbed water contributes to the signal (see Section S1, ESI†).60–64,66 At t ≃ 800 s, the water front reaches the reactor outlet and the total water content equilibrates. At the same time, a sharp increase in the water concentration in the exhaust stream is detected (Fig. 2B). The good agreement between internal and external measurements delivers relevant process parameters such as the gas velocity of 0.080 cm s−1 (CH4 front by FTIR, Fig. 2B) and water front velocity of 0.015 cm s−1 (both by neutrons and FTIR, and for both catalyst bed packings Fig. 2A, B and Fig. S1, see Section S2, ESI†).
The agreement is somewhat surprising as a reactor configuration with two different bed filling was used (Fig. 2C). This configuration mimics the situation of dead zone resulting from long-term degradation and/or formation of hot spots. The small differences in velocity of the developing water fronts in the two catalyst beds (Fig. 2D) indicate that the main conversion takes place in the first few centimeters of the reactor, where both fillings are identical (Fig. 2C).
The neutron attenuation can be read in two ways: first, it is the amount of water adsorbed on the catalyst, while secondly, it is an indicator of the local water partial pressure being a function of the water adsorbed on the catalyst and in equilibrium a quantitative measure for the gas phase water content. To calibrate the water partial pressure calculated from neutron attenuation, we assume complete conversion over the whole reactor (verified by FTIR gas analysis, see Fig. S3B, ESI†). Thus the water partial pressure at the outlet of the reactor is given by the ratio of H2/CO2 at the inlet (eqn (1)), with xH2 being the excess fraction of hydrogen,
| (xH2 + 4)H2 + CO2 → CH4 + 2H2O + xH2H2 | (1) |
 | (2) |
The corresponding measurements and resulting calibration relating neutron attenuation to the water partial pressure in steady-state are given in the ESI† (Fig. S2 and Section S3). With this relation, we can map the local water partial pressure in the reactor.
4 Steady-state conversion
The primary objective of a reactor is to convert the mixture of reactants into products with the highest possible conversion and selectivity. In order to achieve this, the length of a plug flow reactor is extended as much as required. Unfortunately, the approach for reactor up-scaling, namely extrapolating a reactor with a small length to a large one, is not a linear process, since the concept of similitude cannot be rigorously applied. Furthermore, calculating the required length is not trivial.67 To reliably measure catalytic activity, the reaction is usually measured in laboratory-scale reactors at the lowest possible conversion to avoid a chemical gradient in the catalyst bed (as is also done here, see Section S5, ESI†). However, the catalytic activity decreases with increasing conversion in a complex way, due to kinetic (adsorption phenomena and mass transport limitations) and thermodynamic reasons, impeding the rational design of a reactor (“determining its length”). Modelling can bridge the missing gaps, however, the (empirical) parameter space is huge resulting in a high uncertainty (see Section 5).Our empirical approach to a rational reactor design is to oversize the reactor length and then determine the optimum length by imaging the local conversion. As described earlier, we cannot determine the conversion directly, but probe the local water partial pressure. A local increase in water partial pressure is caused by conversion of reactants. In good approximation this defines the active part of the reactor. A constant water partial pressure, i.e. a section without further increase in attenuation along the flow direction is an inactive part of the reactor; no conversion takes place. The local water partial pressure as derived from neutron attenuation measurement is shown as a function of the catalyst bed length in Fig. 3A. It is important to note that the measurements were carried out in steady-state, whereby the results are time-independent. Furthermore, only the left, fully active catalyst bed (Fig. 2C) was utilized for simulation (see Section 5). However, initiating the reactions at slightly different water loadings in the catalyst bed and thus through normalization (Section 8.3) leads to slightly lower water partial pressures than the expected ∼1.9 bar (eqn (2) and Section 8.2). The local water pressure saturates within the first centimeters. In principle, this length can be considered sufficient for the corresponding catalyst packing density.
 | ||
| Fig. 3 (A) Measured (line curves, see calibration in Fig. S2, ESI†) and fitted (dotted curves, Boltzmann sigmoid) water partial pressure in the first few centimeters of the left reactor cell (Fig. 2C) at steady-state, 300 °C, 5 bar, and various GHSVs. (B) Inflection points obtained from the fitted curves. | ||
Due to granular structure of the catalyst (pellets), the data fluctuates markedly. To quantify the results, the data is fitted with a Boltzmann sigmoidal function (Fig. 3A) with the inflection point (“half conversion”) as a performance parameter (Fig. 3B), which can be compared to simulation results. The steady-state is measured for various space velocities. As expected, the inflection points and thus optimum reactor length scale with it. An extrapolation to zero, i.e. a GHSV of 0 sccm h−1 gcat−1, gives an inflection point of 0.89 cm (Fig. 3B), which corresponds very well with the beginning of the active catalytic bed (Fig. 2C).
5 Simulations
The state of the art in reactor design is the modelling of the catalytic reaction based on empirical reaction kinetics depending on partial pressures of the reactants CO2, H2 and products CH4 and H2O and its extension to macroscopic dimensions by including mass and heat transport phenomena (see Section 8.4).68,69 The power of modelling is that geometries more complex than the simple one dimension used to analyze the neutron imaging (Fig. 4) can be modeled giving a more realistic view on the process (Fig. 5).70,71 | ||
| Fig. 4 (A) Simulated water mole fraction in the gas phase (dotted lines) compared to experimentally determined values after scaling to the expected partial water content at full conversion (full line, Fig. 3A, see Section 4) at 300 °C and 5 bar. (B) Simulated carbon dioxide mole fraction in the gas phase and the axial temperature distribution at 300 °C and 5 bar indicating the required length of the reactor bed needed for full conversion. | ||
 | ||
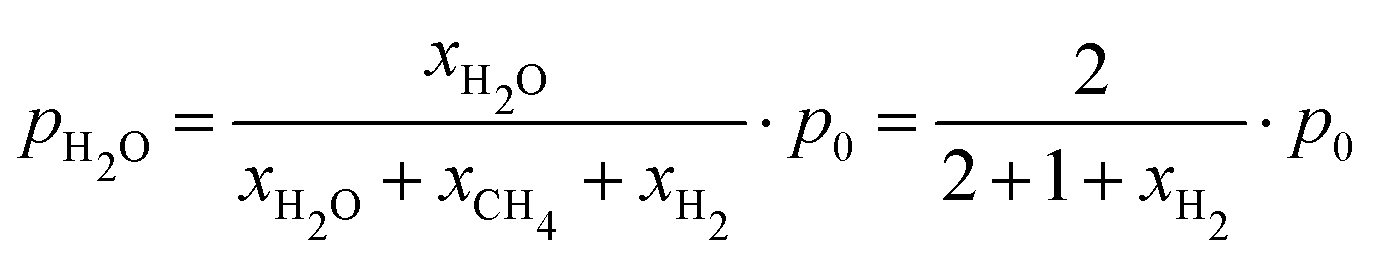
| Fig. 5 (A) The temperature field of a 2D domain of the simulation at the highest flow rate 705 sccm h−1 gcat−1, with an outer wall temperature of 300 °C and a pressure of 5 bar is presented. The temperature distribution of the different regions, which are indicated by colors, is shown above. The temperature distribution along the central reactor axis (dashed blue line) is shown in the Fig. 4B. (B) Averaged neutron radiography of the reactor in steady-state at 300 °C, 5 bar and a flow rate of 705 sccm h−1 gcat−1 with the same colored areas as selected for the simulation (A). (C) Corresponding neutron attenuation from the neutron radiography (in B) of the colored regions. | ||
The underlying thermo-chemical parameters are based on empirical measurements and fits to the corresponding the rate-equations (e.g., eqn (17), see Section 8.4.2) performed in lab-scale reactor by Koschany, et al.72 The concrete values depend markedly on the specific preparation method of the catalyst and thus vary significantly. To account for this uncertainty, the catalyst used in this work is measured in a lab-scale reactor (Section S5, ESI†). The resulting catalytic activity is similar to that of Koschany et al.72 the deviation mainly due to a different Ni-content is corrected by adapting the parameter fkin,exp in eqn (19). Main limitation of the modelling is that we omitted dynamic adsorption phenomena of products on the catalyst for the kinetic modelling. Although this is the basis of the spatially resolved water partial pressure measurements by neutron imaging, its effect on the steady-state conversion is only indirect, and is thus implicitly included using effective kinetic parameters.
Fig. 4 compares the experimental spatially resolved water partial pressure at finite space velocities with the ones from simulations for the simulated non-isothermal case, including the energy balance for the catalyst bed and assuming a constant temperature of 300 °C at the reactor walls. The modeled water partial pressure approximated with the reaction kinetics derived from ref. 72, agrees very well with the experimental results (Fig. 4A, Section 8.4). The local deviations can be attributed to the homogeneous porous media assumption applied in the model that cannot cover the local inhomogeneities apparent in the pellet bed. These inhomogeneities, clearly visible in Fig. 2C, stem from the large pellets and their arrangement in the catalyst bed. This also leads to uncertainties considering local heat and mass transfer. However, the model predicts the mean trends. An increase in the space velocity leads to a lower conversion for a given position, which is observed both experimentally and in the simulation. As a simple outcome, we can state that for the highest space velocity measured a length of the reactor of 3 cm is sufficient for this reactor design (Fig. 4B). In a similar way, also larger reactors can be analyzed.60
The comparison between modeled and experimental water partial pressure provides further insight into the distribution of CO2 throughout the entire reactor (Fig. 4B). The Sabatier reaction is strongly exothermic. Heat effects are to be expected (e.g., the so-called hot spots,73,74) but were neglected for the evaluation of experimental partial water pressures assuming an isothermal condition as the adsorption is temperature dependent. To prove the assumption, the temperature distribution within the reactor under steady-state conditions was calculated (Fig. 5A). At a first glance, a “hot spot” is indeed formed. However, the maximum temperature variation is less than 10 K (Fig. 5A), which is small enough to warrant the validity of the experimental approach. Though negligible, an experimental effect is visible if comparing the neutron attenuation perpendicular to the flow direction (Fig. 5B and C). The aluminum walls with high heat conductivity remove the heat from the reaction, and thus the wall temperature is approximated with a fixed value in the simulation and a similar behavior is assumed in the experiment. This leads to slightly lower temperature near to the walls (Fig. 5A). Lower temperatures lead to higher water adsorption, from which higher neutron attenuation near to the reactor walls are expected. However, the measured neutron attenuation is superimposed by the inhomogeneity of the catalyst bed with a high void fraction close to the reactor wall, but the gradient with a minimum in the center while scaling with the absolute position is clearly visible (Fig. 5C). The overall rather small temperature change of less than 10 K is due to the relatively small space velocity used in this experiment. Higher space velocities will lead to a more pronounced hot spot. While the influence of temperatures complicates the interpretation of the neutron images it is extremely helpful for identification of hot spots.
6 Outlook
We demonstrated the use of neutron imaging to map the distribution of products in a running reactor. The experiments were designed as a proof-of-concept, i.e., with a rather small reactor compared to industrial dimensions. We chose a width of the reactor (neutron path length) of 3.4 cm to reach proton densities giving a reasonable neutron attenuation contrast (see Sections 8.2 and 8.3). Larger diameters will improve the contrast. The same applies to higher pressures, which results in a higher density of neutron attenuating species, such as those used for power-to-liquid applications20,75,76 and ammonia synthesis.77 The rectangular dimensions of the reactor are ideal for neutron radiography (2D projection). Neutron imaging can be extended to tomography allowing the 3D mapping of any reactor shape.56 A particular advantage of the neutron operando imaging is that many changes taking place in the reactor during operation are practically inaccessible by measuring global parameters such as reactor output. We demonstrated how neutron images bridge this knowledge gap, e.g., how to localize inhomogeneities such as hot spots or dead zones in a running reactor. For strongly exothermic reactions such as the methanation reaction studied here, the local temperature increase may become problematic; in contrast, for endothermic reactions such as the reverse water gas shift reaction, the local temperature decrease is challenging78 being a perfect study object for neutron imaging. In addition, dynamic processes such as diffusion and adsorption, which are used for separation technologies, especially adsorption and membrane separation79 are accessible with time-resolved neutron imaging.Simple reactions such as methanation and ammonia synthesis are already well established, both in terms of technology readiness and scientific understanding. Neutron imaging is expected to push the scientific frontiers of reactor engineering of complex reactions such as the MtO process (methanol to olefins).80 Here, the number of product compounds increases over the length of the reactor and the different compounds influence each others.81 Similar to the methodology shown here, gradients in proton concentration can be used as an indicator to describe the local environment just as the partial water pressure in this paper. Furthermore, new developments in neutron imaging instrumentation opens new possibilities. There is a chemical contrast from neutron scattering. To access this information, time-of-flight neutron imaging can be used exploiting the wavelength-dependent, i.e. energy selective, neutron scattering cross-section of differently bonded hydrogen atoms.82,83
Apart from insights into reactor engineering, the methodology may be used as a precise method to determine the catalytic activity over the full parameter space relevant for upscaling.
Furthermore, the initiation of the reactor or pulsed operation (pulsed reactant flow) provides insights into the reaction kinetics that were not discussed in detail in this work.
7 Conclusion
Various aspects, including the non-linear scaling of the reaction conditions from small reactors on a laboratory scale to larger ones in order to achieve maximum conversion of the reactants into the desired products, must be considered and eventually optimized during scale-up. For this, we introduced a non-destructive time-resolved method using neutron imaging is demonstrated, which enables operando imaging to follow the distribution of hydrogen containing species in a running reactor.Due to the high neutron cross-section for hydrogen, hydrogenated species of the hydrogenation reaction of carbon dioxide to methane can be quantified at realistic operation conditions. The non-destructive operando method with the simple integration of the reactor at full scale enables the spatial and temporal resolution of water adsorption on the catalyst in steady-state (p, T). The resulting quantitatively determined partial pressure of the water thus indirectly reveals the spatial and temporal conversion of the processes. The knowledge gained from this experimental approach, in conjunction with the modelling, permits the estimation of the optimal reactor dimensions contingent on the desired reaction conditions. The good agreement between the simulation and experimental neutron imaging warrants the method as a reliable instrument for reactor characterization and design. The chemical sensitivity of reactants and products could be improved by energy-resolved neutron imaging, i.e. time-of-flight neutron imaging.
In principle, direct observation of gaseous species is also possible, as described in the ESI.† Nevertheless, in order to enhance the neutron attenuation of the gaseous phase, the density of the gas molecules should be increased, i.e. greater reactor thickness or higher reaction pressures.
8 Methods
8.1 Catalyst preparation
Aluminum oxide support pellets (43![[thin space (1/6-em)]](https://www.rsc.org/images/entities/char_2009.gif) 832, Thermoscientific) were calcinated at 500 °C for 5 hours (heating rate 5 °C min−1) before wet impregnation. Ni(NO3)2·6H2O (Sigma Aldrich) at a loading of 10-wt% (Ni) was added to the precalcinated Al2O3 pellets, dissolved in deionized water and stirred at 60 °C for 24 hours. The calcination of the impregnated samples was done in air with an oven temperature set to 450 °C for 5 hours (heating rate 5 °C min−1).84,85 The nickel loading, as determined by weighing the sample before and after impregnation, was 4.3-wt%.
832, Thermoscientific) were calcinated at 500 °C for 5 hours (heating rate 5 °C min−1) before wet impregnation. Ni(NO3)2·6H2O (Sigma Aldrich) at a loading of 10-wt% (Ni) was added to the precalcinated Al2O3 pellets, dissolved in deionized water and stirred at 60 °C for 24 hours. The calcination of the impregnated samples was done in air with an oven temperature set to 450 °C for 5 hours (heating rate 5 °C min−1).84,85 The nickel loading, as determined by weighing the sample before and after impregnation, was 4.3-wt%.
8.2 Reactor construction and experimental setup
The reactor was designed and built in our own workshop. It consisted of two separate chambers connected by 4 holes at equal distances to allow gas exchange (Fig. 1B, 2C and 6A). The dimensions were 10 × 2 × 4 cm × cm × cm for each chamber, including a wall thickness of 3 mm (Fig. 1B, 2C and 6A). The reactor was heated by a heating jacket equipped with two heating cartridges (280 W each) (Fig. 6B and C). The high power cartridges provided rapid heating and temperature control. The heating jacket contained 4 inlets on each side for thermocouples to measure the outer wall temperature (Fig. 6B and C). Thermal insulation was maintained by wrapping the reactor with several layers of aluminum, since other insulating materials used normally would absorb too much of the neutron beam. | ||
| Fig. 6 (A) Simplified P&ID of the experimental setup installed at NEUTRA (SINQ, PSI) and the reactor scheme. (B) Picture of the reactor in the neutron beamline. (C) Corresponding neutron radiography of the reactor. | ||
Gas flow and pressure were controlled with Bronkhorst thermal mass flow controllers and a backpressure regulator (Fig. 6A), connected to a Labview interface. The ratio between the reactant gases H2 and CO2 was in all experimental sequences 6.3/1 (H2/CO2). The temperature was controlled using a Eurotherm temperature controller and the additional temperatures measured on the outer wall of the reactor were read using a RedLab-TEMP device. The product gas composition was analyzed by a FTIR gas analyzer (Bruker Alpha).
8.3 Neutron imaging
Neutron radiography images of the reactor were acquired at the neutron imaging beam line NEUTRA at the Paul Scherrer Institute.86 After traversing the sample, the incoming neutron beam was detected using MIDI-camera box fitted with 20 μm thick Gd2O2S/6LiF scintillator screen. The scintillation light has been collected using CCD camera detector (Andor CCD). The imaging arrangement provided images with the field of view of 150 × 150 mm × mm in size, with the pixel size of 61.2 μm. The effective spatial resolution of the imaging setup was assessed based on images of Siemens star resolution test object to be about 75 μm.The images were continuously taken (approx. every 20 seconds) during the reactor in operation and allowed to follow the hydrogen and hydrogenated species operando without disturbing the system. Neutrons are attenuated mainly by scattering with hydrogen giving the neutron contrast Ac defined as:
 | (3) |
 | (4) |
 | (5) |
Image and data processing were performed with ImageJ software using built-in functions and Python scripts for the data extraction and calculations. To enhance the visibility of the effects, the images were processed with the filters (Gaussian Blur 3D) integrated in ImageJ (see Fig. 1C and 2D). However, no filtered images were used for data extraction and subsequent calculations.
8.4 Reactor modelling
The reactor was modeled using the finite element solver COMSOL Multiphysics 6.291 and compared with experimental results.| 0 = ∇(ρfu) | (6) |
| 0 = ∇[−pI + K] − μfκp−1u | (7) |
 | (8) |
 | (9) |
The energy balance, assuming local thermal equilibrium and averaging thermophysical properties over porous matrix and flow, writes as
| ρfcp,fu∇T + ∇q = Q | (10) |
 | (11) |
Since approximations for diluted species transport are not applicable, the full set of transport equations with mixture dependent properties were implemented:
| ∇·ji + ρ(u·∇)ωi = Ri. | (12) |
Multi-component diffusion was considered using the Maxwell–Stefan diffusion model and neglecting thermal diffusion and field forces
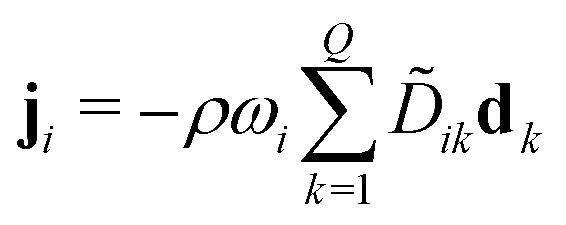 | (13) |
![[D with combining tilde]](https://www.rsc.org/images/entities/i_char_0044_0303.gif) ik and the diffusional driving force
ik and the diffusional driving force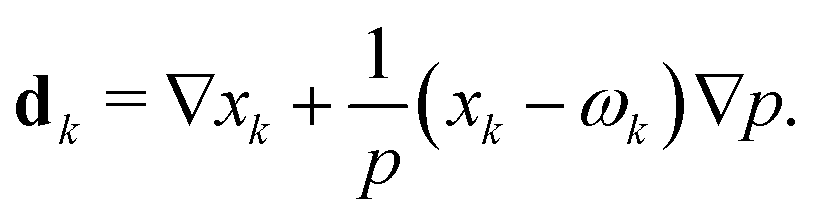 | (14) |
The mass constraint
 | (15) |
We used the Millington and Quirk model for the effective diffusivity in the pellet bed:94
| eff,ik = feff(εp, τF)D(ik) | (16) |
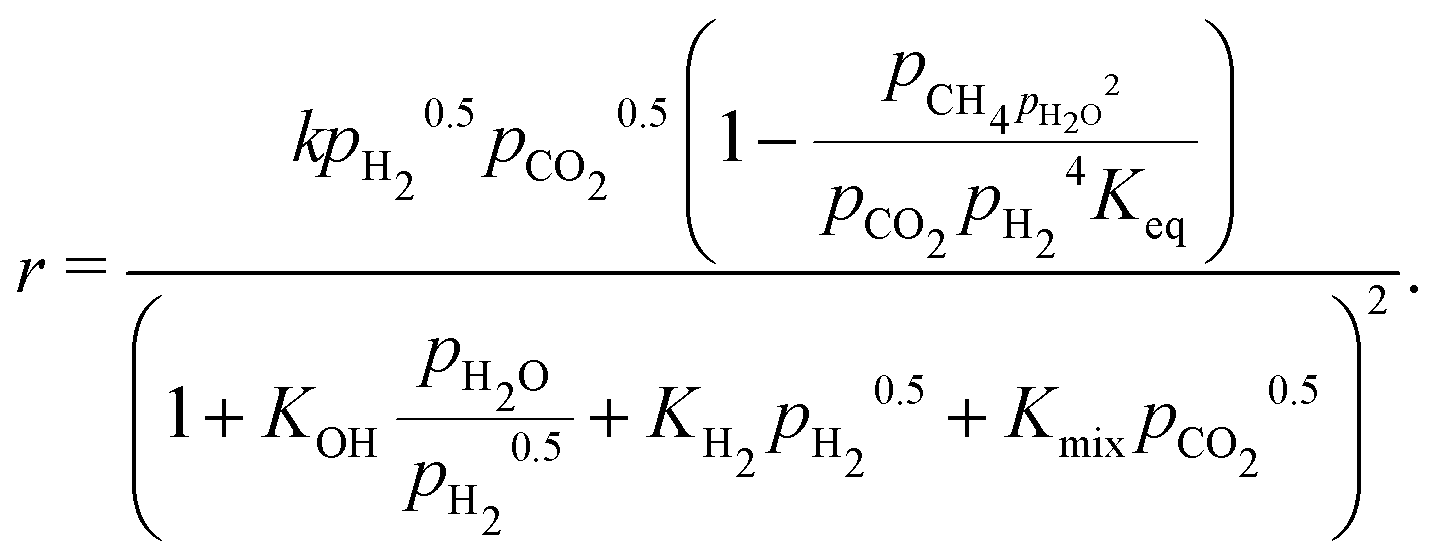 | (17) |
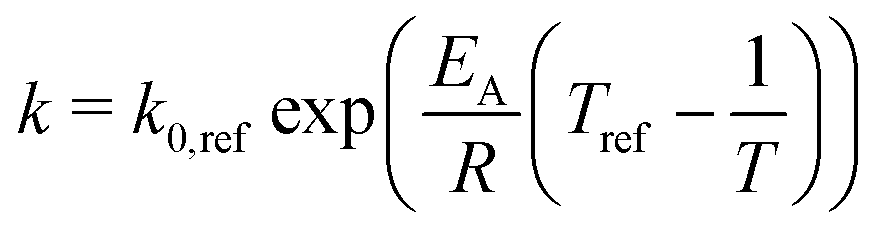 | (18) |
| k0,ref = fkin,expk0,ref,Koschany, | (19) |
As relevant solid matrix properties we assumed a thermal conductivity of the pellets kp = 3 W m−1 K, bed porosity εp = 0.3. The catalyst mass was 16.73 g with a nickel content of 4.3 wt%, filling a total bed volume of 39.98 cm−3, which results in a catalyst bed density of 0.42 g cm−3.
With the low thermal conductivity of 3 W m−1 K−1 for the catalyst pellets,95 this case can be considered as limited by heat transport over the gas phase. For increasing thermal conductivity of the solid matrix, the results approach those of the isothermal case. Increasing the thermal conductivity of the solid matrix to 10 W m−1 K−1 decreases the maximum temperature from 592 K as observed in Fig. 4 to 588 K.
The boundary conditions for the Brinkman equations are u = −u0n, [−pI + K]·n = −p0n, and u·n = 0 at the inlet, outlet and walls respectively, not resolving the velocity gradient at the wall. The boundary conditions for the species transport are ωi = ω0,i for the inlet, −n·ρDi∇ωi = 0 for the outlet, and −n·ji for the walls. The temperature boundary conditions are set accordingly, except for the wall we assumed a constant temperature T = Tw.
Data availability
Data for this article, including all numeric data of Fig. 2–6, and the ones of the ESI,† are available at https://doi.org/10.5281/zenodo.13985214.Conflicts of interest
The authors declare no conflicts of interest.Acknowledgements
The authors gratefully acknowledge financial support for the move-MEGA project and the Joint Strategic Initiative “Synthetic Fuels from Renewable Resources” from the ETH-Board (Board of the Swiss Federal Institutes of Technology). Additionally, parts of this research were carried out with the support of the Swiss Federal Office of Energy as part of the SWEET consortium reFuel.ch. The authors are solely responsible for the conclusions and the results presented in this publication.References
- A. Kätelhön, R. Meys, S. Deutz, S. Suh and A. Bardow, Proc. Natl. Acad. Sci. U. S. A., 2019, 116, 11187–11194 CrossRef PubMed.
- L. Schlapbach and A. Züttel, Nature, 2001, 414, 353–358 CrossRef CAS PubMed.
- A. Züttel, Mater. Today, 2003, 6, 24–33 CrossRef.
- Hydrogen as a Future Energy Carrier, ed. A. Züttel, A. Borgschulte and L. Schlapbach, Wiley, 2008 Search PubMed.
- J. Graetz, Chem. Soc. Rev., 2009, 38, 73–82 RSC.
- T. He, P. Pachfule, H. Wu, Q. Xu and P. Chen, Nat. Rev. Mater., 2016, 1, 16059 CrossRef CAS.
- M. Hirscher, V. A. Yartys, M. Baricco, J. B. von Colbe, D. Blanchard, R. C. Bowman, D. P. Broom, C. E. Buckley, F. Chang, P. Chen, Y. W. Cho, J.-C. Crivello, F. Cuevas, W. I. David, P. E. de Jongh, R. V. Denys, M. Dornheim, M. Felderhoff, Y. Filinchuk, G. E. Froudakis, D. M. Grant, E. M. Gray, B. C. Hauback, T. He, T. D. Humphries, T. R. Jensen, S. Kim, Y. Kojima, M. Latroche, H.-W. Li, M. V. Lototskyy, J. W. Makepeace, K. T. Møller, L. Naheed, P. Ngene, D. Noréus, M. M. Nygård, S. ichi Orimo, M. Paskevicius, L. Pasquini, D. B. Ravnsbæk, M. V. Sofianos, T. J. Udovic, T. Vegge, G. S. Walker, C. J. Webb, C. Weidenthaler and C. Zlotea, J. Alloys Compd., 2020, 827, 153548 CrossRef CAS.
- P. Sabatier and J. Senderens, C. R. Acad. Sci., 1902, 134, 689–691 Search PubMed.
- P. Sabatier and J. Senderens, C. R. Acad. Sci., 1902, 134, 514–516 CAS.
- T. A. Semelsberger, R. L. Borup and H. L. Greene, J. Power Sources, 2006, 156, 497–511 CrossRef CAS.
- P. Edwards, V. Kuznetsov and W. David, Philos. Trans. R. Soc., A, 2007, 365, 1043–1056 CrossRef CAS PubMed.
- F. S. Zeman and D. W. Keith, Philos. Trans. R. Soc., A, 2008, 366, 3901–3918 CrossRef CAS PubMed.
- G. A. Olah, A. Goeppert and G. K. S. Prakash, J. Org. Chem., 2009, 74, 487–498 CrossRef CAS PubMed.
- A. Züttel, A. Remhof, A. Borgschulte and O. Friedrichs, Philos. Trans. R. Soc., A, 2010, 368, 3329–3342 CrossRef PubMed.
- F. Schüth, Chem. Ing. Tech., 2011, 83, 1984–1993 CrossRef.
- W. Wang, S. Wang, X. Ma and J. Gong, Chem. Soc. Rev., 2011, 40, 3703 RSC.
- S. Rönsch, J. Schneider, S. Matthischke, M. Schlüter, M. Götz, J. Lefebvre, P. Prabhakaran and S. Bajohr, Fuel, 2016, 166, 276–296 CrossRef.
- M. D. Porosoff, B. Yan and J. G. Chen, Energy Environ. Sci., 2016, 9, 62–73 RSC.
- C. Wulf, J. Linßen and P. Zapp, Energy Proc., 2018, 155, 367–378 CrossRef.
- V. Dieterich, A. Buttler, A. Hanel, H. Spliethoff and S. Fendt, Energy Environ. Sci., 2020, 13, 3207–3252 RSC.
- P. M. Falcone, M. Hiete and A. Sapio, Curr. Opin. Green Sustainable Chem., 2021, 31, 100506 CrossRef CAS.
- F. Ueckerdt, C. Bauer, A. Dirnaichner, J. Everall, R. Sacchi and G. Luderer, Nat. Clim. Change, 2021, 11, 384–393 CrossRef CAS.
- P. Strucks, L. Failing and S. Kaluza, Chem. Ing. Tech., 2021, 93, 1526–1536 CrossRef CAS.
- S. Guffanti, C. G. Visconti, J. van Kampen, J. Boon and G. Groppi, Chem. Eng. J., 2021, 404, 126573 Search PubMed.
- G. Weatherbee, J. Catal., 1984, 87, 352–362 CrossRef CAS.
- U. Rodemerck, M. Holena, E. Wagner, Q. Smejkal, A. Barkschat and M. Baerns, ChemCatChem, 2013, 5, 1948–1955 Search PubMed.
- Z. Chehade, C. Mansilla, P. Lucchese, S. Hilliard and J. Proost, Int. J. Hydrogen Energy, 2019, 44, 27637–27655 CrossRef CAS.
- W. K. Fan and M. Tahir, J. Environ. Chem. Eng., 2021, 9, 105460 CrossRef CAS.
- J. K. Nørskov, F. Studt, F. Abild-Pedersen and T. Bligaard, Fundamental Concepts in Heterogeneous Catalysis, Wiley, 2014 Search PubMed.
- M. Götz, J. Lefebvre, F. Mörs, A. McDaniel Koch, F. Graf, S. Bajohr, R. Reimert and T. Kolb, Renewable Energy, 2016, 85, 1371–1390 CrossRef.
- F. Kiefer, M. Nikolic, A. Borgschulte and P. Dimopoulos Eggenschwiler, Chem. Eng. J., 2022, 449, 137872 CrossRef CAS.
- F. Kiefer, A. Borgschulte, M. Nikolic, P. Dimopoulos Eggenschwiler and C. Bach, EU Pat., EP4230287 A1, 2022 Search PubMed.
- Ullmann's Encyclopedia of Industrial Chemistry, Wiley, 2003 Search PubMed.
- S. Rebughini, M. Bracconi, A. Cuoci and M. Maestri, in Springer Series in Chemical Physics, ed. J. Frenken and I. Groot, Springer, 2017, ch. Catalysis Engineering: From the Catalytic Material to the Catalytic Reactor, p. 189 Search PubMed.
- D. Kunii and T. Furusawa, Chem. Eng. J., 1972, 4, 268–281 CrossRef CAS.
- L. Kiewidt and J. Thöming, Chem. Eng. Sci., 2015, 132, 59–71 CrossRef CAS.
- J. Bremer and K. Sundmacher, React. Chem. Eng., 2019, 4, 1019–1037 RSC.
- J. Kuipers, W. Prins and W. Van Swaaij, Chem. Eng. Sci., 1991, 46, 2881–2894 CrossRef CAS.
- J. A. M. Kuipers and W. P. M. van Swaaij, Rev. Chem. Eng., 1997, 13, 1–118 CAS.
- C. J. Taylor, A. Pomberger, K. C. Felton, R. Grainger, M. Barecka, T. W. Chamberlain, R. A. Bourne, C. N. Johnson and A. A. Lapkin, Chem. Rev., 2023, 123, 3089–3126 CrossRef CAS PubMed.
- E. Moioli and T. Schildhauer, Chem. Ing. Tech., 2023, 95, 631–641 CrossRef CAS.
- S. Poto, M. A. Llosa Tanco, D. A. Pacheco Tanaka, M. F. Neira d'Angelo and F. Gallucci, J. CO2 Util., 2023, 72, 102513 CrossRef CAS.
- M. Menzinger, V. Yakhnin, A. Jaree, P. Silveston and R. Hudgins, Chem. Eng. Sci., 2004, 59, 4011–4022 CrossRef CAS.
- S. Flaischlen and G. D. Wehinger, Int. J. Heat Mass Transfer, 2024, 221, 125091 CrossRef CAS.
- H. F. Rase, Fixed-Bed Reactor Design and Diagnostics, Elsevier, 1990 Search PubMed.
- P. Andrigo, Catal. Today, 1999, 52, 197–221 CrossRef CAS.
- D. A. Hickman, J. C. Degenstein and F. H. Ribeiro, Curr. Opin. Chem. Eng., 2016, 13, 1–9 CrossRef.
- Y. Li, D. Zakharov, S. Zhao, R. Tappero, U. Jung, A. Elsen, P. Baumann, R. Nuzzo, E. Stach and A. Frenkel, Nat. Commun., 2015, 6, 7583 CrossRef CAS PubMed.
- J. Ulpts, W. Dreher, L. Kiewidt, M. Schubert and J. Thöming, Catal. Today, 2016, 273, 91–98 Search PubMed.
- H. Ridder, C. Sinn, G. R. Pesch, J. Ilsemann, W. Dreher and J. Thöming, Rev. Sci. Instrum., 2021, 92, 043711 Search PubMed.
- S. V. Elgersma, A. J. Sederman, M. D. Mantle, C. M. Guédon, G. J. Wells and L. F. Gladden, Chem. Eng. J., 2023, 475, 145445 CrossRef CAS.
- P. C. H. Mitchell, S. F. Parker, A. J. Ramirez-Cuesta and J. Tomkinson, Vibrational Spectroscopy with Neutrons, World Scientific, 2005, vol. 3 Search PubMed.
- E. Lehmann, P. Vontobel and N. Kardjilov, Appl. Radiat. Isot., 2004, 61, 503–509 CrossRef CAS PubMed.
- S. F. Parker and D. Lennon, Physchem, 2021, 1, 95–120 CrossRef.
- M. Nikolic, F. Longo, E. Billeter, A. Cesarini, P. Trtik and A. Borgschulte, Phys. Chem. Chem. Phys., 2022, 24, 27394–27405 Search PubMed.
- M. Nikolic, A. Cesarini, E. Billeter, F. Weyand, P. Trtik, M. Strobl and A. Borgschulte, Angew. Chem., Int. Ed., 2023, 62, e202307367 CrossRef CAS PubMed.
- J. Terreni, E. Billeter, O. Sambalova, X. Liu, M. Trottmann, A. Sterzi, H. Geerlings, P. Trtik, A. Kaestner and A. Borgschulte, Phys. Chem. Chem. Phys., 2020, 22, 22979–22988 Search PubMed.
- H. Cavaye, C. E. Ballas, W. Kockelmann, S. F. Parker, P. Collier, A. P. E. York and D. Lennon, Sci. Rep., 2025, 15, 8579 CrossRef CAS PubMed.
- K. Hou, M. Fowles and R. Hughes, Chem. Eng. Res. Des., 1999, 77, 55–61 Search PubMed.
- A. Borgschulte, R. Delmelle, R. B. Duarte, A. Heel, P. Boillat and E. Lehmann, Phys. Chem. Chem. Phys., 2016, 18, 17217–17223 RSC.
- J. Terreni, M. Trottmann, R. Delmelle, A. Heel, P. Trtik, E. H. Lehmann and A. Borgschulte, J. Phys. Chem. C, 2018, 122, 23574–23581 CrossRef CAS.
- R. Delmelle, J. Terreni, A. Remhof, A. Heel, J. Proost and A. Borgschulte, Catalysts, 2018, 8, 341 CrossRef.
- J. Terreni, O. Sambalova, A. Borgschulte, S. Rudić, S. F. Parker and A. J. Ramirez-Cuesta, Catalysts, 2020, 10, 433 CrossRef CAS.
- H. Li, L. Shi, R. Ye, R. Zhang, G. Feng and J.-L. Zhang, J. Mater. Sci., 2022, 57, 16710–16724 CrossRef CAS.
- R. Rea, A. Tavitian, D. P. Broom, M. D. Gee, M. J. Benham, S. Brandani and E. Mangano, Adsorption, 2024, 30, 1529–1538 Search PubMed.
- K. Bellur, E. F. Médici, D. S. Hussey, D. L. Jacobson, J. LaManna, J. B. Leão, J. Scherschligt, J. C. Hermanson, C. K. Choi and J. S. Allen, Cryogenics, 2022, 125, 103517 Search PubMed.
- J. Terreni, A. Borgschulte, M. Hillestad and B. D. Patterson, ChemEngineering, 2020, 4, 16 Search PubMed.
- S. Flaischlen, J. Martin, B. Kreitz, T. Turek and G. D. Wehinger, 30th European Symposium on Computer Aided Process Engineering, Elsevier, 2020, vol. 48, pp. 499–504 Search PubMed.
- P. Bareschino, G. Piso, F. Pepe, C. Tregambi and E. Mancusi, Chem. Eng. Sci., 2023, 277, 118876 Search PubMed.
- N. Jurtz, S. Flaischlen, S. C. Scherf, M. Kraume and G. D. Wehinger, Processes, 2020, 8, 1528 Search PubMed.
- C. Parra-Cabrera, C. Achille, S. Kuhn and R. Ameloot, Chem. Soc. Rev., 2018, 47, 209–230 RSC.
- F. Koschany, D. Schlereth and O. Hinrichsen, Appl. Catal., B, 2016, 181, 504–516 CrossRef CAS.
- D. Sun, F. M. Khan and D. S. Simakov, Chem. Eng. J., 2017, 329, 165–177 CrossRef CAS.
- A. Alarcón, J. Guilera and T. Andreu, Chem. Eng. Res. Des., 2018, 140, 155–165 CrossRef.
- X. Cui and S. K. Kær, Chem. Eng. J., 2020, 393, 124632 CrossRef CAS.
- N. Delgado Otalvaro, M. Kaiser, K. Herrera Delgado, S. Wild, J. Sauer and H. Freund, React. Chem. Eng., 2020, 5, 949–960 RSC.
- A. Shamiri and N. Aliabadi, Chem. Eng. J. Adv., 2021, 8, 100177 CrossRef CAS.
- S. Thor Wismann, K.-E. Larsen and P. Mølgaard Mortensen, Angew. Chem., Int. Ed., 2022, 61, e202109696 CrossRef CAS PubMed.
- P. C. Wankat, Separation process engineering, Pearson Education, 2006 Search PubMed.
- M. Stöcker, Microporous Mesoporous Mater., 1999, 29, 3–48 CrossRef.
- C. W. P. Pare, P. Rzepka, P. Hemberger, A. Bodi, R. Hauert, J. A. van Bokhoven and V. Paunović, ACS Catal., 2024, 14, 463–474 CrossRef CAS.
- S. J. Seestrom, E. R. Adamek, D. Barlow, M. Blatnik, L. J. Broussard, N. B. Callahan, S. M. Clayton, C. Cude-Woods, S. Currie, E. B. Dees, W. Fox, M. Hoffbauer, K. P. Hickerson, A. T. Holley, C.-Y. Liu, M. Makela, J. Medina, D. J. Morley, C. L. Morris, R. W. Pattie, J. Ramsey, A. Roberts, D. J. Salvat, A. Saunders, E. I. Sharapov, S. K. L. Sjue, B. A. Slaughter, P. L. Walstrom, Z. Wang, J. Wexler, T. L. Womack, A. R. Young, J. Vanderwerp and B. A. Zeck, Phys. Rev. C, 2017, 95, 015501 CrossRef.
- E. R. C. Ruiz, J. Lee, M. Strobl, N. Stalder, G. Burca, L. Gubler and P. Boillat, Sci. Adv., 2023, 9, eadi0586 CrossRef PubMed.
- D. Hu, J. Gao, Y. Ping, L. Jia, P. Gunawan, Z. Zhong, G. Xu, F. Gu and F. Su, Ind. Eng. Chem. Res., 2012, 51, 4875–4886 CrossRef CAS.
- R.-P. Ye, W. Gong, Z. Sun, Q. Sheng, X. Shi, T. Wang, Y. Yao, J. J. Razink, L. Lin, Z. Zhou, H. Adidharma, J. Tang, M. Fan and Y.-G. Yao, Energy, 2019, 188, 116059 CrossRef CAS.
- E. H. Lehmann, P. Vontobel and L. Wiezel, Nondestr. Test. Eval., 2001, 16, 191–202 CrossRef.
- R. K. Adair, Rev. Mod. Phys., 1950, 22, 249–289 CrossRef CAS.
- Z. Rogalska, Physica, 1963, 29, 491–498 CrossRef CAS.
- M. Mattes and J. Keinert, Thermal neutron scattering data for the moderator materials H2O, D2O and ZrHx in ENDF-6 format and as ACE library for MCNP (X) codes, International atomic energy agency technical report, 2005 Search PubMed.
- D. Mannes, L. Josic, E. Lehmann and P. Niemz, Holzforschung, 2009, 63, 472–478 CrossRef CAS.
- COMSOL, Chemical Reaction Engineering Module User's Guide, Version COMSOL 2.6, 2023 Search PubMed.
- D. A. Nield and A. Bejan, Convection in Porous Media, Springer International Publishing, Cham, 2017 Search PubMed.
- J. Bear, Dynamics of Fluids in Porous Media, Dover, 1988 Search PubMed.
- R. J. Millington and J. P. Quirk, Trans. Faraday Soc., 1961, 57, 1200 RSC.
- R. A. Mischke and J. M. Smith, Ind. Eng. Chem. Fundam., 1962, 1, 288–292 CrossRef CAS.
Footnote |
| † Electronic supplementary information (ESI) available. See DOI: https://doi.org/10.1039/d4cp04086d |
| This journal is © the Owner Societies 2025 |