DOI:
10.1039/D4CE01206B
(Paper)
CrystEngComm, 2025,
27, 2333-2342
Analysis of axial resistivity during SiC crystal growth by the PVT method
Received
2nd December 2024
, Accepted 26th February 2025
First published on 26th February 2025
Abstract
Nitrogen doped n-type SiC substrates are extensively employed for high-power devices thanks to their excellent physical properties. However, the growth of SiC single crystals via the physical vapor transport method still faces large challenges including the control of temperature fields, regulation of the C/Si ratio at the growth front, and intra- and inter-substrate resistivity uniformity improvement. Numerical simulations have been performed to study the evolution of temperature, C/Si ratio and nitrogen incorporation at the growth front as a function of crystal length. Gas exchange across the crucible and crucible etching reaction were considered, and the effects on the crystal growth rate, temperature, C/Si ratio and N2 distribution at the growth front were illustrated. The computational results show unprecedented agreement with experimental observations. The factors influencing crystal resistivity have been demonstrated. The nitrogen doping efficiency in 4H-SiC crystal growth through the PVT method has been proposed through computed and measured nitrogen concentrations.
1 Introduction
With the increasing demand for high-temperature, high-frequency, and high-power RF electronics, such as 5G communications, electronic vehicles and photovoltaics,1–3 the physical limitations of silicon-based semiconductor devices have become more apparent. Higher power, smaller size and lower cost have become key concerns of the power semiconductor industry. The wide bandgap of 4H-SiC results in a higher critical electrical field, enabling a thinner device with a correspondingly low on-resistance.4 Additionally, its high thermal conductivity enhances the heat dissipation characteristics of high-temperature SiC devices. These exceptional physical and electronic properties make SiC an ideal material for high-power device fabrication.
Physical vapor transport (PVT) is the most studied and the only commercial method for growing n-type 4H-SiC crystals. Vertical SiC power devices require substrates with a low and uniform resistivity distribution to minimize on-resistance fluctuation within the wafer, particularly for 600–1200 V devices with extremely low drift layer resistance.5 Inhomogeneous resistivity distribution also affects the uniformity of homoepitaxial layer thickness6 or causes lattice mismatch-induced dislocations at the substrate and epilayer interface.7–9 Currently, 150 mm SiC substrates are the mainstream and 200 mm substrates are under rapid ramping-up in the semiconductor industry. As the crystal diameter increases from 150 mm to 200 mm and the crystal length requirement grows, radial and axial resistivity variations in SiC crystals become more pronounced. Therefore, improving the resistivity uniformity both in radial and axial directions is crucial. Reported studies mostly focused on radial resistivity uniformity,10–14 and few have considered axial resistivity uniformity during SiC crystal growth.
Nitrogen can be easily introduced into SiC crystals during PVT growth by controlling the nitrogen gas flow. Incorporated nitrogen atoms replace carbon lattice sites, and the nitrogen content determines the resistivity of the crystal. The typical resistivity of commercial n-type 4H-SiC substrates is in the range of 0.015–0.025 Ω cm, corresponding to a nitrogen doping concentration of 6 × 1018 cm−3–1.5 × 1019 cm−3.15 However, nitrogen concentration often exhibits an inhomogeneous distribution due to axial and radial temperature variations. Increasing the nitrogen doping concentration can improve resistivity, but excessive doping can lead to stacking faults (SFs) and other defects.16,17 An optimal doping concentration must balance resistivity uniformity and defect minimization. Nitrogen doping is influenced by various growth parameters, including seed orientation,18 temperature,19,20 and nitrogen partial pressure.21
The C/Si ratio is another important parameter affecting SiC crystal resistivity.22 It not only determines the crystallizing conditions (C/Si = 1) at the growth front, but also affects the crystalline stability and defect density as well.23 Most reported C/Si ratios are based solely on gas transport inside the crucible, neglecting internal gaseous escape through the porous crucible.24,2513C isotope labeling experiments have shown that the crucible etching reaction consumes the gas species, altering the C/Si ratio.26 The C/Si ratio affects nitrogen doping due to a site-competition mechanism.27 Both of them are related to growth temperature. Unfortunately, existing literature did not consider neither the crucible etching reaction nor crucible porosity.26 Due to varying study conditions, obtained C/Si ratio values differ among the studies. There is a lack of studies simultaneously considering variations in the growth front temperature, C/Si ratio and nitrogen incorporation during crystal growth as well as their effects on axial resistivity distribution.
In this article, a 4H-SiC crystal was grown by the PVT method to obtain the axial resistivity distribution. To investigate the impacting factors of axial resistivity, we performed numerical simulations for the growth rate, temperature, C/Si ratio and nitrogen partial pressure at the growth front of the SiC crystal grown by PVT, considering the porosity of the graphite crucible and etching reactions. Their variations with crystal length change were demonstrated. Nitrogen doping efficiency in the 4H-SiC crystal was obtained through measured and simulated concentrations. The dominant factor sensitive to crystal resistivity was analyzed experimentally and numerically.
2 Modeling and experimental procedures
2.1 Modeling procedure
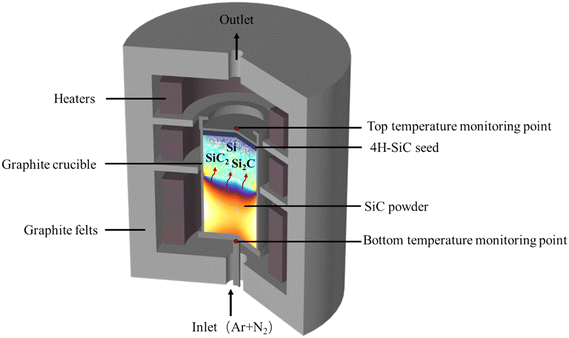
The growth system for the PVT method is complex and not measurable, and so the detailed growth process information and corresponding parameters are not available in the experiment. Numerical simulation is a valuable tool for understanding key growth parameters, such as temperature, C/Si ratio and nitrogen incorporation at the growth front during various stages of growth. Assuming the PVT growth system for the 4H-SiC bulk crystal is axisymmetric, Fig. 1 presents the schematic setup of crystal growth. A 2 mm thick 4H-SiC seed with a 4° off-axis with respect to the (11![[2 with combining macron]](https://www.rsc.org/images/entities/char_0032_0304.gif) 0) direction is glued and fixed at the bottom of a graphite lid. The graphite crucible is resistively heated using the multi-resistance heating method28 with graphite felts surrounded for thermal insulation. The crucible bottom is filled with SiC powder having a porosity of 0.5. A 2D axisymmetric multi-physics model, which coupled heat transfer, multi-component mass transport, gas flow and crucible etching reaction, is implemented in COMSOL Multiphysics software to investigate the evolution of the growth rate, temperature, C/Si ratio and nitrogen incorporation at the growth front during crystal growth. A portion of the crucible is treated as porous media to allow gas exchange across the crucible wall.
0) direction is glued and fixed at the bottom of a graphite lid. The graphite crucible is resistively heated using the multi-resistance heating method28 with graphite felts surrounded for thermal insulation. The crucible bottom is filled with SiC powder having a porosity of 0.5. A 2D axisymmetric multi-physics model, which coupled heat transfer, multi-component mass transport, gas flow and crucible etching reaction, is implemented in COMSOL Multiphysics software to investigate the evolution of the growth rate, temperature, C/Si ratio and nitrogen incorporation at the growth front during crystal growth. A portion of the crucible is treated as porous media to allow gas exchange across the crucible wall.
 |
| | Fig. 1 The sketch of 4H-SiC crystal growth by the PVT method. | |
2.2 Heat and mass transfer
It is assumed that a sublimation process occurs only in the thin region of powder near the source top. Three resistance heaters provide a heating source for the growth system through careful power control. The SiC raw material is heated, decomposing into three primary gas species, Si(g), SiC2(g) and Si2C(g), which are then transported to the seed surface, crystallized under diffusion and convection. Given that internal radiation within the crucible is greatly larger than the latent heat from SiC deposition,29 it is reasonable to disregard latent heat effects. The gas flow is assumed to be laminar and compressible. Therefore, the global heat transfer includes heat conduction in both solid and gas media, thermal radiation from solid surfaces in the gas domain, and heat convection in the gas phase. Heat conduction and convection are governed by the equation:where ρ denotes density, Cp and k are the thermal capacity and conductivity, u is the velocity of the fluid, ∇T represents the temperature gradient and Q is the heat source. For the porous SiC powder and graphite wall, they consist of solid and gas phases so that the equivalent thermal conductivity and heat capacity could be described by linear combination theory:30| | 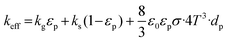 | (2) |
| | | (ρCp)eff = εp(ρCp)g + (1 − εp)(ρCp)s | (3) |
where kg, ks, (ρCp)g and (ρCp)s are the thermal conductivity and heat capacity of the gas and solid matrices, respectively, and εp is the porosity of the porous material. The third term on the right-hand side of eqn (2) represents the particle-to-particle radiation in SiC powder. ε0 is the emission coefficient of particle surfaces; σ = 5.67 × 10⁻⁸ W m K−1 is the Stefan–Boltzmann constant and dp = 500 μm is the average particle diameter of powder. All the radiation surfaces are set as gray-diffuse and opaque including the source powder and crystal, and the governing equation for solid radiation is:| | | −n·q = εσ(T4amb − T4b) | (4) |
where q is the radiative heat flux at the boundaries, n is the outside pointing normal of the surface, ε is the emissivity of the solid surface, and Tamb and Tb are the ambient temperature and boundary temperature, respectively. The ambient temperature outside of the crucible is considered to be 300 K.
The 4H-SiC crystal growth process, typically lasting over 100 hours with a growth rate ranging from tens to several hundred micrometers per hour, can be regarded as a steady-state process. It is assumed that no other chemical reactions occur among vapor species in the gas phase except for the heterogeneous reactions occurring at the solid–vapor interface:
| | | Si(g) + SiC2(g) = 2SiC(s) | (5) |
| | | Si2C(g) = SiC(s) + Si(g) | (6) |
and the etching reaction occurs at the graphite crucible (see section 2.3 for a detailed description). During the 4H-SiC crystal growth, the sublimation and deposition processes are assumed to occur under stoichiometric conditions. The partial pressure of SiC gas species near the growth front is maintained above the local thermal equilibrium vapor pressure to ensure the necessary supersaturation requirements for crystal growth. The thermodynamic pressure of the concentrated multi-component vapor above the 4H-SiC seed surface is connected to the total boundary flux species through the Hertz–Knudsen equation:
| | 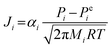 | (7) |
where
Ji represents the total molar flux of gas species
i deposited at the seed surface and
αi is the sticking coefficient. The temperature dependent equilibrium partial pressure
Pei is calculated from the thermodynamic data of Lilov
31 and
Pi is the partial pressure of species
i at temperature
T,
Mi is the molar mass of species
i, and
R is the universal gas constant. At the powder surface, a negative sign should be added to
eqn (7) to indicate species fluxes sublimated from the SiC powder surface.
In the PVT growth system, the gas phase consists of a mixture of high-concentration sublimated species (Si, SiC2, and Si2C) along with an inert gas argon, and additional nitrogen doping gas to adjust resistivity. Consequently, the diffusion coefficients of gas species are not constant but closely related to the chemical compositions of the gas phase. Therefore, mole or mass fractions should be treated as dependent variables to satisfy the condition that the total amount of species equals unity, rather than using traditional species concentrations. This approach is known as the Maxwell–Stefan diffusion model.23 The mass transport of species in the growth system is described by the Navier–Stokes equations simplified for low Mach number multicomponent flows. Since a part of the crucible wall is made of a porous medium (see Fig. 2), which allows the gas exchange across the crucible as seen in the SiC crystal growth experiment, the Darcian flow model is employed to describe the mass transport in porous media. Furthermore, a mixture-averaged diffusion model is used to calculate concentrated species transport in porous media. For complete formulation, one can refer to the work of Xu et al.32 It should be noted that mass transfer through the powder is not considered in the present work.
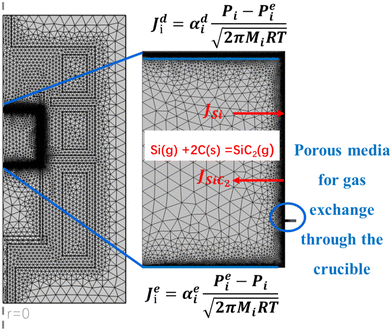 |
| | Fig. 2 2D axisymmetric model meshing and primary boundary conditions. | |
2.3 Crucible etching reaction
Experimental observations have revealed the exchange of carbon between gas species and the interior walls of the graphite crucible through 13C labeling and digital X-ray imaging during the growth process.26,33 The graphite crucible acts as an active carbon source for SiC crystal growth by forming SiC2 in accordance to the following equation:34| | | Si(g) + 2C(s) = SiC2(g) | (8) |
The crucible etching reaction influences the graphitization degree of the graphite crucible and, consequently, the crystal quality. When the crucible was repeatedly used for several runs, the graphite crystallite size increases due to its increasing graphitization degree. This leads to decreasing crucible electrical resistivity and increasing thermal conductivity. This significantly degrades the overall temperature field and axial temperature gradient within the crucible.35 Clearly, the graphite crucible etching reaction affects the vapor gas species and the C/Si ratio at the growth interface, which in turn impacts nitrogen incorporation for resistivity due to the C–N site competition mechanism.27 Therefore, the crucible etching reaction must be considered when accounting for the variations in the C/Si ratio and nitrogen incorporation during the crystal growth process.
As the sublimation temperature of silicon is lower than that of carbon-containing species, the growth cell of the 4H-SiC crystal is in a Si-rich environment. We assume that the deposition of SiC on the graphite wall is negligible, and excess Si atoms from the sublimation of the source do not incorporate into the graphite walls, but react with them through eqn (8). It was reported that graphite erosion is significant at 30–40 mm below the seed crystal, and the degree of erosion gradually decreases downward from the seed crystal to the powder direction.36 To simplify calculations, a flux boundary condition is used to represent the consumption of Si(g) and the formation of SiC2(g) on the graphite wall. The total weight of the graphite crucible was found to exhibit a loss around 200 g after the crystal growth experiment. Based on this, the maximum flux of Si(g) was set at 10−5 kg m−2 s−1. According to the etching reaction depicted in Fig. 2, the thickness of the etched graphite crucible is calculated to be 2.61 cm which aligns well with experimental observations.
2.4 Experimental procedure
An n-type 4H-SiC bulk single crystal with a diameter of 150 mm was grown along the C-face (000![[1 with combining macron]](https://www.rsc.org/images/entities/char_0031_0304.gif) ) using the PVT method in the temperature range of 2100–2300 °C and a pressure of 300 Pa. The growth atmosphere was a gas mixture of 95 vol% Ar + 5 vol% N2 gas, with a fixed gas flow rate of 100 SCCM. The total crystal growth time was around 155 hours. To monitor the real-time axial temperature gradient, two infrared temperature probes were positioned at the top of the crucible lid and bottom of the crucible, enabling PID to provide feedback control of the temperature field in the growth cell. To check the sensitivity of resistivity on temperature, an intentional rapid temperature decrease was performed for the top monitoring point in the last stage of crystal growth. The resistivity of these substrates was measured by the eddy-current method (SEMILAB, LEI-1510EA). Nitrogen concentration was determined by Raman (HORIBA LabRAM Odyssey) and secondary ion mass spectroscopy (SIMS, CAMECA 7f-Auto).
) using the PVT method in the temperature range of 2100–2300 °C and a pressure of 300 Pa. The growth atmosphere was a gas mixture of 95 vol% Ar + 5 vol% N2 gas, with a fixed gas flow rate of 100 SCCM. The total crystal growth time was around 155 hours. To monitor the real-time axial temperature gradient, two infrared temperature probes were positioned at the top of the crucible lid and bottom of the crucible, enabling PID to provide feedback control of the temperature field in the growth cell. To check the sensitivity of resistivity on temperature, an intentional rapid temperature decrease was performed for the top monitoring point in the last stage of crystal growth. The resistivity of these substrates was measured by the eddy-current method (SEMILAB, LEI-1510EA). Nitrogen concentration was determined by Raman (HORIBA LabRAM Odyssey) and secondary ion mass spectroscopy (SIMS, CAMECA 7f-Auto).
3 Results and discussion
3.1 Axial resistivity distribution
The grown crystal has a length of 48 mm, was cut perpendicular to the growth direction and processed to standard 150 mm 4H-SiC substrates. The average resistivity distribution of the grown crystal is shown in Fig. 3. It increases from 0.0182 Ω cm to 0.0248 Ω cm along the axial growth direction. The resistivity increases rapidly when the crystal length is shorter than 15 mm; afterward, it becomes smooth and eventually converges to 0.025 Ω cm. This suggests that in the middle and late stages of crystal growth, nitrogen atoms become increasingly difficult to incorporate into the crystal. The final data point for temperature sensitivity test results in a resistivity change of 0.4%. To investigate the factors sensitive to axial resistivity variations, the crystal growth rate, growth front temperature, C/Si ratio and axial nitrogen incorporation are analyzed step-by-step in the subsequent paragraphs.
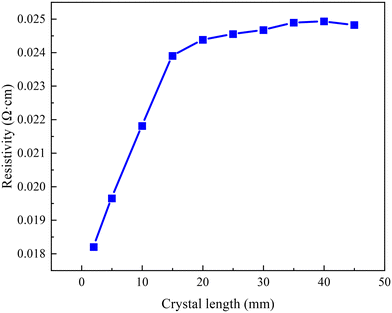 |
| | Fig. 3 Average resistivity distribution of the SiC substrates across crystal lengths ranging from 2 mm to 45 mm. | |
3.2 Growth rate
Crystal growth rate is calculated using the following formula:37| |  | (9) |
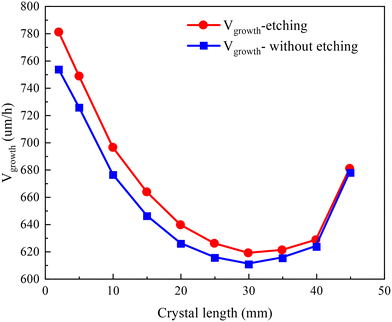
where ρSiC is the density of SiC and  is the total molar flux of SiC2 deposited at the seed surface. In Fig. 4, the crystal growth rate decreases as the crystal length increases from 0 to 30 mm. This is agreed with the observation of Ramm et al.38 Increased crystal length leads to lower axial temperature gradients, and thereby less SiC2 gas species reach the supersaturation conditions, decreasing the growth rate. For crystal length exceeding 30 mm, the growth rate shows a tiny increase due to a large temperature difference between the top and bottom monitoring points. Numerical calculation results indicated that the crystal growth rate would resume its declining trend if the temperature difference between these two points is maintained within 180 K. The large increase for the last data point at 45 mm is caused by the intentional temperature sensitivity test. It is obtained from eqn (9) that the crystal growth rate is determined by the molar flux of SiC2 which is closely related to the temperature through the Hertz–Knudsen boundary conditions (eqn (7)). The distribution profile of the growth rate is totally different from the profile of axial resistivity. No relevant evidence suggests that the growth rate is responsible for nitrogen incorporation. The experiments of Takahashi and Onoue also proved that the crystal growth rate has negligible influence on nitrogen incorporation.39,40
 |
| | Fig. 4 Comparison of growth rates with and without considering the crucible etching reaction across crystal lengths ranging from 2 mm to 45 mm. | |
The growth system of SiC is carbon deficient and the SiC2 produced by the crucible etching reaction (eqn (8)) supplies an additional carbon source to the gas phase, promoting SiC crystallization according to the preferred C/Si ratio of 1![[thin space (1/6-em)]](https://www.rsc.org/images/entities/char_2009.gif) :1. Therefore, the crystal growth rate under the crucible etching reaction is higher than that when such a reaction is not considered. A similar phenomenon was also observed in the study of Ariyawong et al. with a similar SiC crystal growth setup.41 Although the crucible corrosion reaction helps to increase the crystal growth rate, it damages the crucible and reduces the crucible lifetime.
:1. Therefore, the crystal growth rate under the crucible etching reaction is higher than that when such a reaction is not considered. A similar phenomenon was also observed in the study of Ariyawong et al. with a similar SiC crystal growth setup.41 Although the crucible corrosion reaction helps to increase the crystal growth rate, it damages the crucible and reduces the crucible lifetime.
3.3 Axial temperature distribution
The heating power of resistance heaters directly influences the temperature readings at the top and bottom monitoring points (refer to Fig. 1), thereby determining the feedback-controlled temperature gradients of the growth system. To ensure that the calculated temperature field closely matches the experimental conditions, the power settings of the three heaters are obtained by optimizing the temperature field in light of the experimental values of the two temperature monitoring points measured using an infrared pyrometer. During the experiment, the bottom temperature monitoring point is maintained at approximately 2500 K, while the top monitoring point is gradually reduced from 2373 K as the grown crystal length increases. These optimized power settings were then used for the mass transport calculations of gas species. In addition, previous studies have reported that the distribution of heating power also impacts the maximum values of stress and dislocation density.42–45
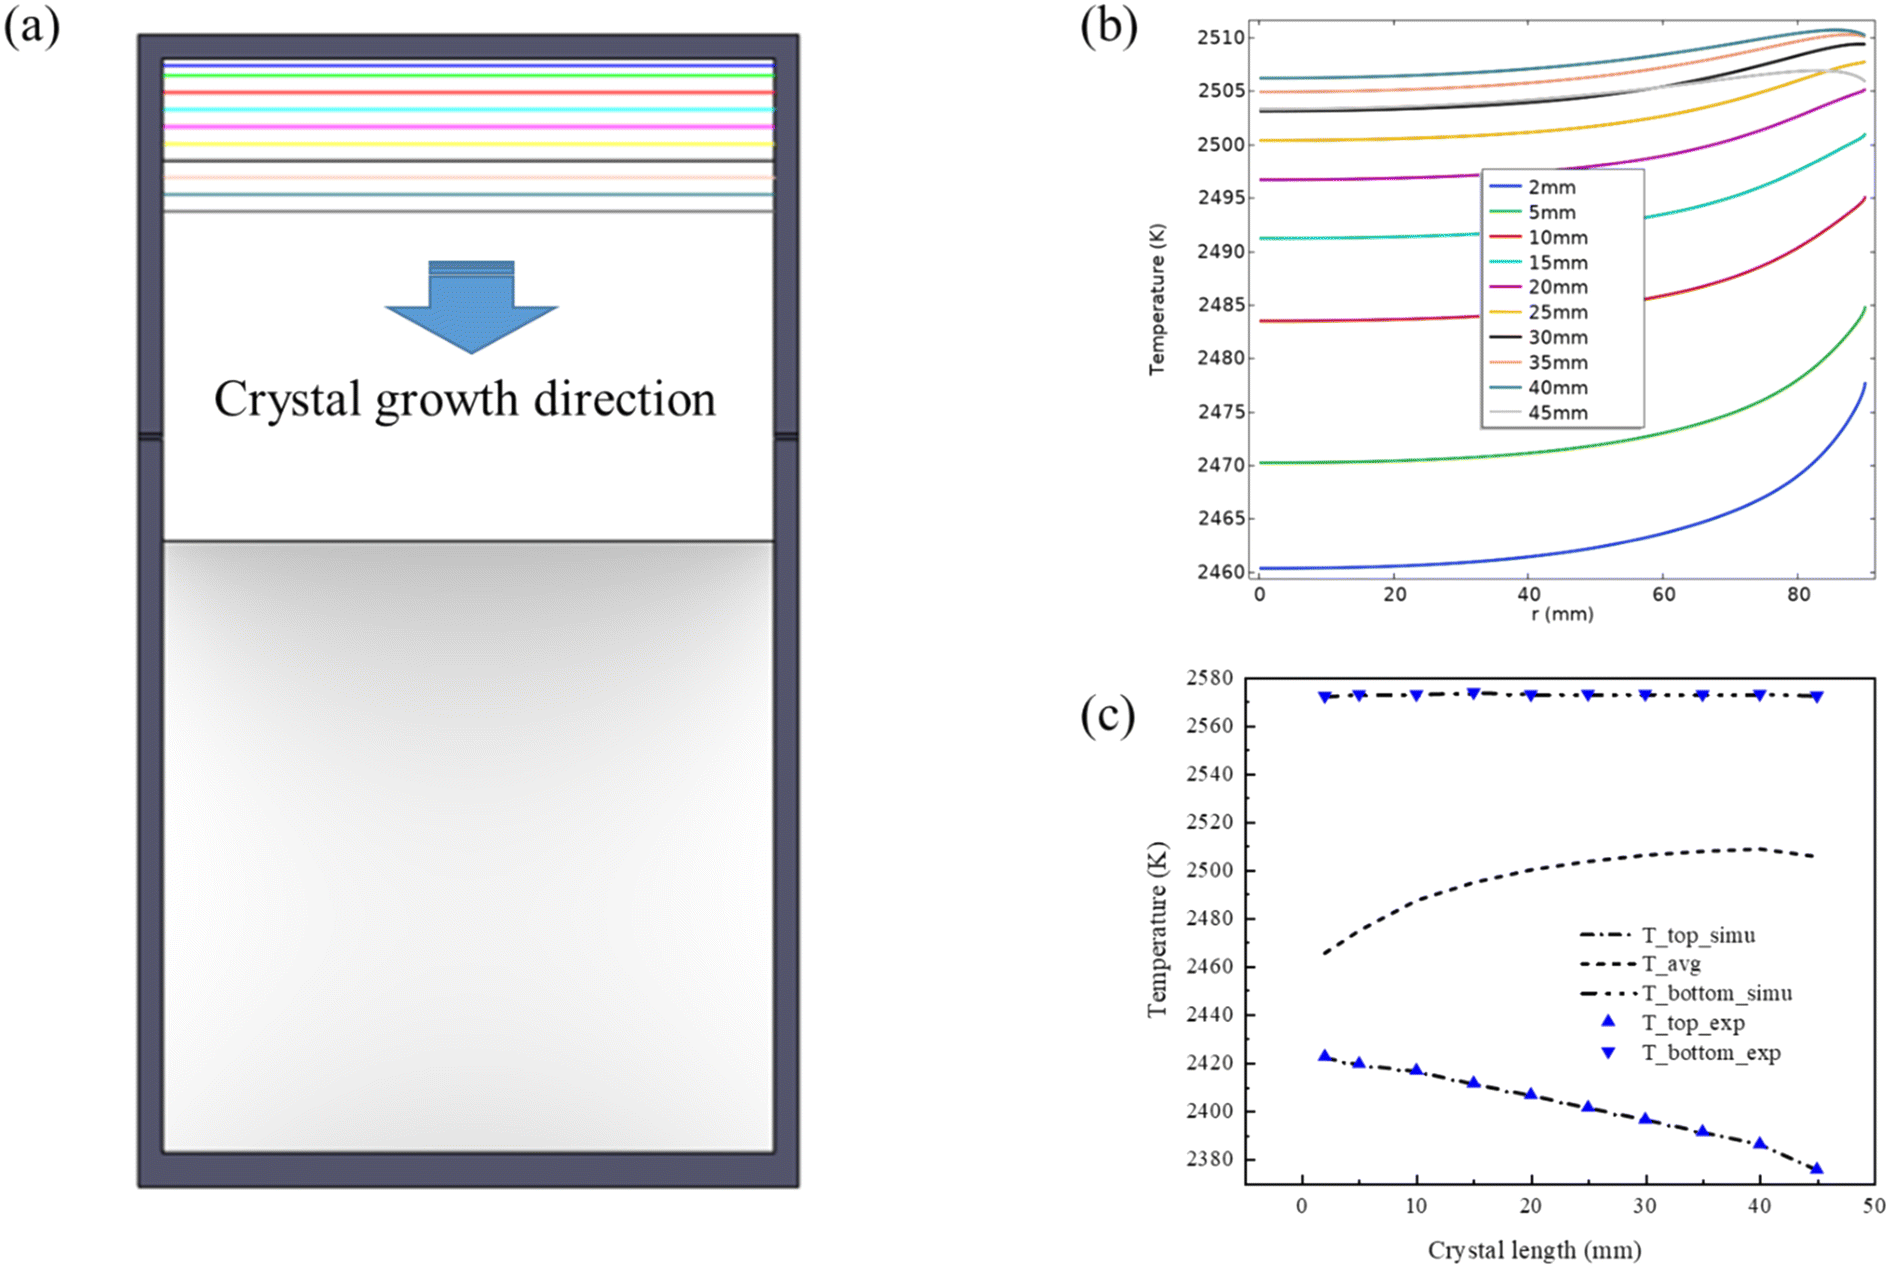
The axial and radial temperature gradients are crucial for the growth and diameter enlargement of SiC crystals.46,47 The global temperature distribution of the growth setup is illustrated in Fig. 5(a) and the detailed temperature contours inside the growth chamber are zoomed in Fig. 5(b). A positive axial temperature gradient is required to allow the sublimation of SiC from powder and the deposition of the SiC crystal at the seed. The temperature of the crystal center is lower than that of the edge due to the cooling effect of the upper hole for temperature monitoring. This contributes to a higher supersaturation of gas species at the crystal surface, ensuring outward growth of the crystal in the radial direction.29
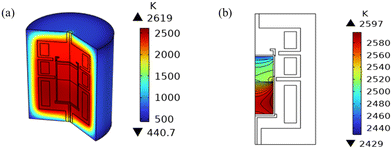 |
| | Fig. 5 (a) 3D global temperature distribution of the whole growth setup; (b) 2D temperature contours of the growth cell at 15 mm crystal length. | |
It is evident from Fig. 6(b) that the growth front temperature increases as the crystal length increases. This can be attributed to the inter-radiation interaction between the inner walls of the growth cell. Heat transfer in the growth chamber is predominantly radiation-based. Although the SiC crystal has a high thermal conductivity, the thermal radiation received by the growth interface from surrounding walls is much larger than the heat it generates. This result matches well with experimental findings as well as previous reports.48 The temperature curve from 40 mm to 45 mm does not follow an increasing trend but decreases due to an intentional rapid temperature decrease of the top monitoring point for sensitivity test. Fig. 6(c) compares the experimental and computed temperatures at the top of the crucible lid and the bottom of the crucible, showing excellent consistency. Additionally, the calculation results provide the average temperature at the growth front, which cannot be probed directly in the experiment. Likewise, this temperature increases with the crystal length. Notably, the average temperature at the growth front, situated at a crystal length of 45 mm, has decreased by 3 K compared to the previous increasing trend. This turning point aligns with the observed changes in the average resistivity. Hence, it can be inferred that crystal axial resistivity is extremely sensitive to temperature fluctuations.
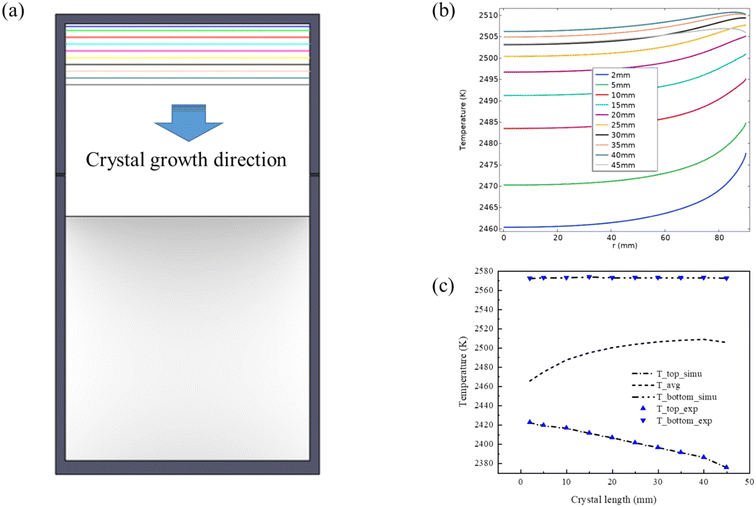 |
| | Fig. 6 (a) Schematic of crystal length changes during crystal growth; (b) growth front temperature variations for crystal length ranging from 2 mm to 45 mm; (c) comparison of experimental (blue triangles) and calculated temperatures (dash lines) at the top and bottom temperature monitoring points shown in Fig. 1. The dashed line in the middle represents the calculated average temperature at the growth front. | |
3.4 Axial C/Si ratio
During the dissociative sublimation of the powder source, the gas phase is enriched with silicon atoms, resulting in a C/Si ratio less than 1. As the crystallization conditions require C/Si = 1, the whole growth process of the typical PVT method is carbon limited. Therefore, a high C/Si ratio contributes to the growth of the 4H-SiC polytype. However, when the temperature is not high enough, fewer carbon atoms are sublimated, leading to a lower C/Si ratio which would promote the formation of 3C-SiC rather than 4H-SiC.49 Although Fig. 7 suggests that the C/Si ratio increases as the crystal length becomes larger, the ratio always stays around 0.8, which agrees well with the reported value of C/Si = 0.83.50 The increase of the C/Si ratio is within 3%, significantly lower than the 26% increase in axial resistivity in the experiment. This verifies previous reports that changes in the C/Si ratio rarely impact the nitrogen incorporation on the C-face but primarily affect the Si-face growth.51,52
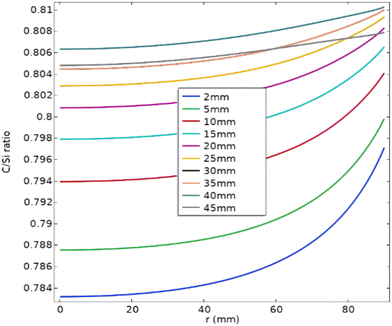 |
| | Fig. 7 Variations of the C/Si ratio at the growth front for the crystal length ranging from 2 mm to 45 mm. | |
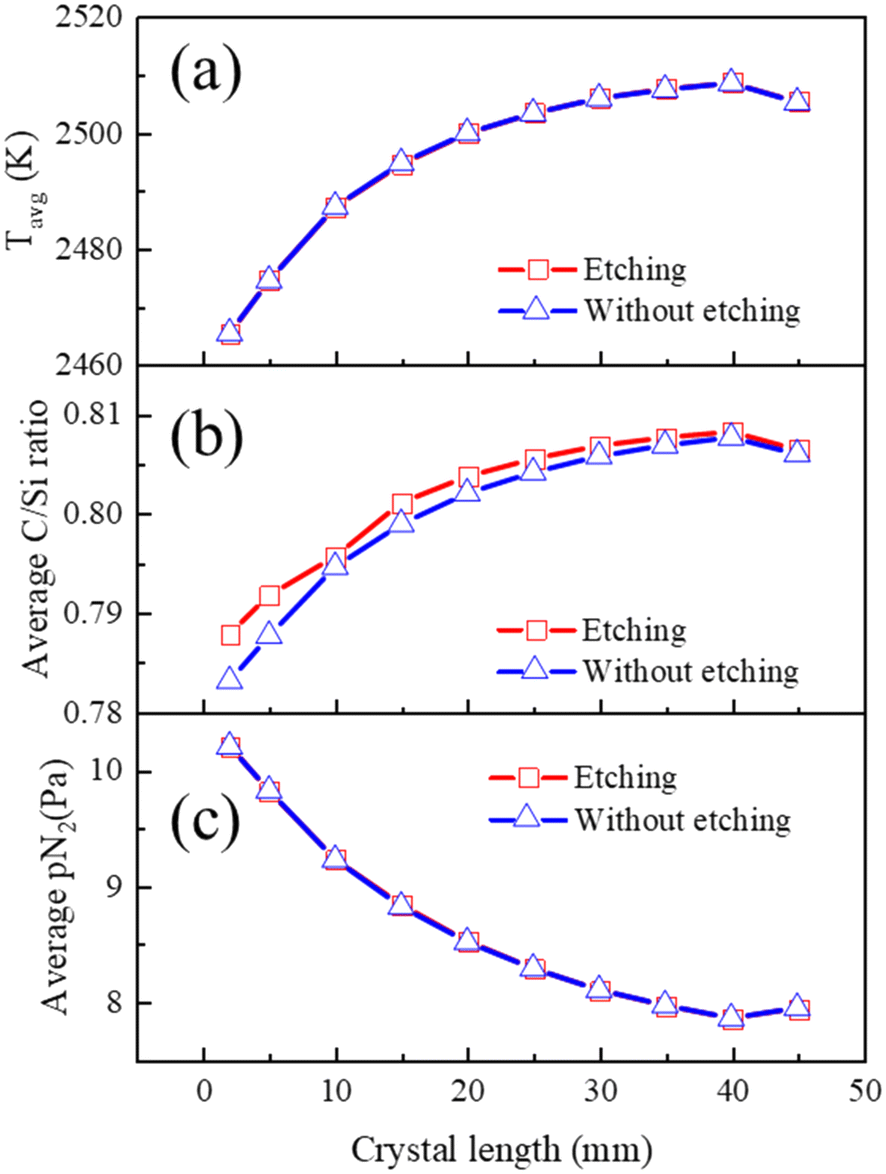
Through comparing the calculation results under “etching” and “without etching” conditions in Fig. 8, it is found that crucible etching has no influence on the average temperature and nitrogen partial pressure during the growth, while the C/Si ratio increases due to the decrease of Si atoms. The average C/Si ratio at the growth front in Fig. 8(b) exhibits a trend similar to the average temperature in Fig. 8(a). It is because the C/Si ratio is highly correlated with the thermal equilibrium temperature of deposition gas species. For the last data point, the temperature decreasing rate at the top monitoring point from 40 mm to 45 mm is 2 times faster than that of the previous stage (∼8 K h−1), resulting in a slight 0.2% decrease in the C/Si ratio and a corresponding 0.4% decrease in resistivity. Therefore, it could be concluded that resistivity is more sensitive to temperature changes than the C/Si ratio.
 |
| | Fig. 8 Comparison of the average temperature, average C/Si ratio and average nitrogen partial pressure at the growth front for the crystal length ranging from 2 mm to 45 mm: (a) average temperature; (b) average C/Si ratio; (c) average pN2. | |
It's worth noting that as the growth front temperature varies with crystal length, both the C/Si ratio and nitrogen incorporation are related to temperature; it is challenging to separately assess the influence of the C/Si ratio and nitrogen incorporation, making it difficult to determine the dominant factor.
3.5 Axial nitrogen incorporation
Fig. 9(a) presents the dependence of nitrogen partial pressure on crystal length. It is observed that the nitrogen partial pressure at the growth surface decreases as the crystal length increases from 2 mm to 40 mm. As illustrated in Fig. 6, the growth temperature rises with increasing crystal length. Higher growth temperature makes more C-containing and Si-containing gas species enriched below the growth surface. Consequently, a lower nitrogen partial pressure occurs as the crystal grows longer, leading to fewer nitrogen atoms being incorporated into the crystal. It needs to be noted that the graphitization of SiC raw materials also affects the C- and Si-containing gas species; to simplify the calculation, it is not considered in this article.
 |
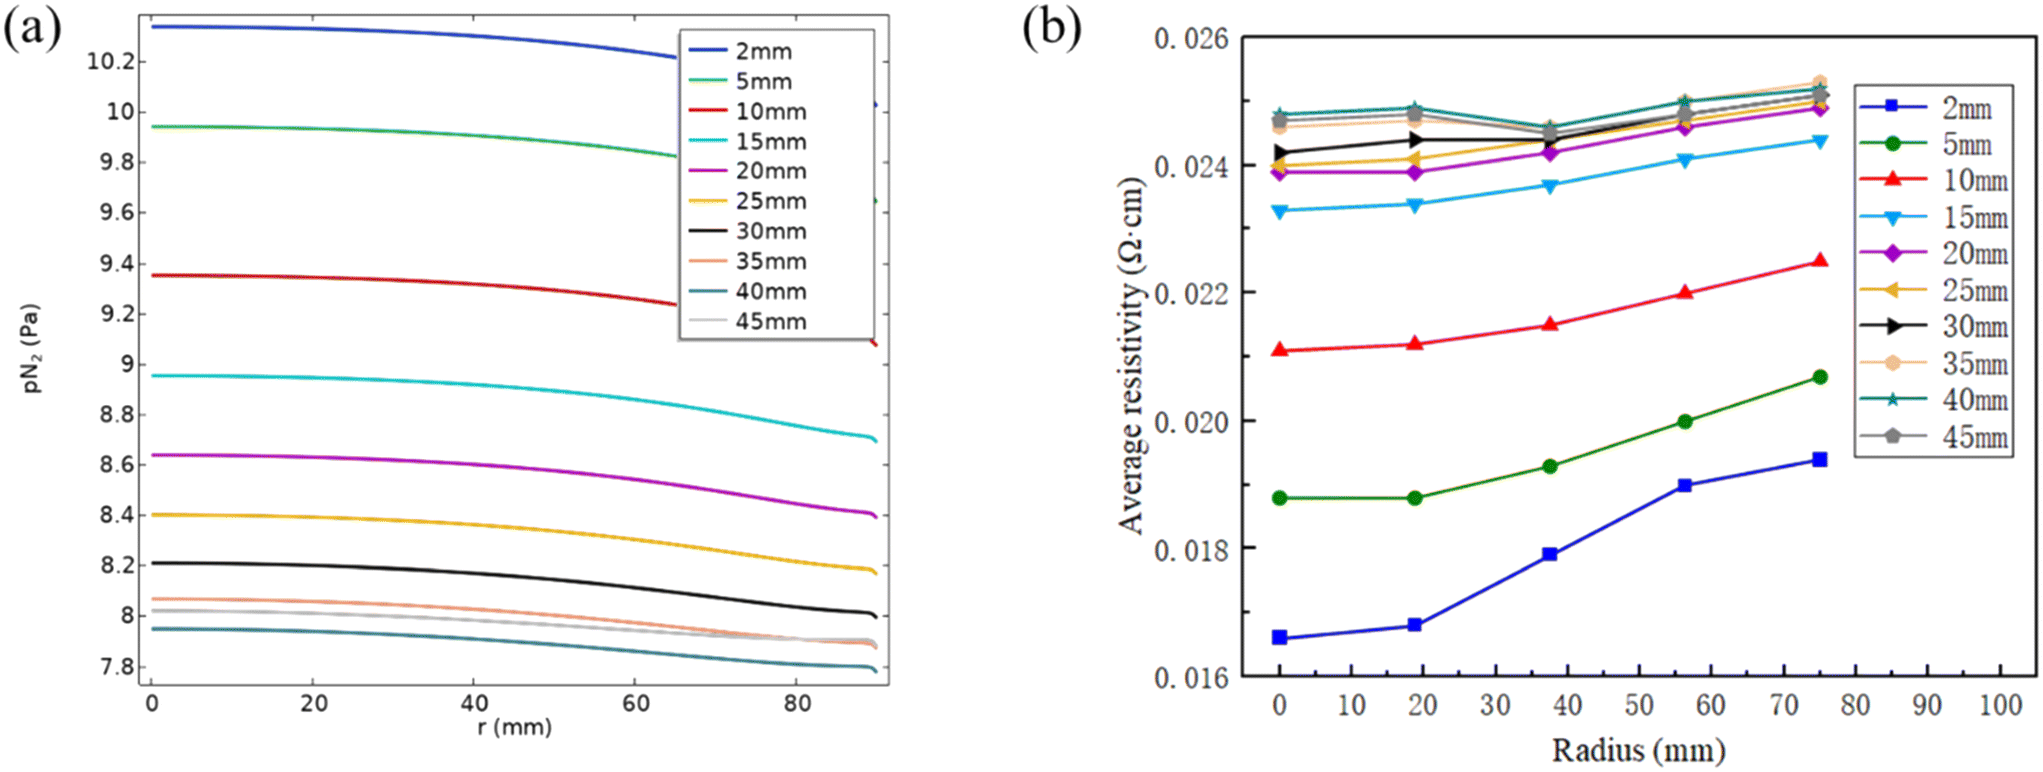
| | Fig. 9 (a) Nitrogen partial pressure dependence on the crystal length at the growth front; (b) average radial resistivity distribution at different crystal lengths. | |
Fig. 9(b) shows the radial resistivity distribution at different crystal lengths. The resistivity increases from the center to the periphery due to the high nitrogen partial pressure at the center and low partial pressure at the periphery as shown in Fig. 9(a). With the increase of crystal lengths, the in-plane resistivity increases which corresponds to the decreasing nitrogen partial pressure from 2 mm to 45 mm. The sudden decrease of resistivity at r = 37.5 mm for crystal lengths at 35–45 mm is caused by the extreme low resistivity at the facet.11
Fig. 10 presents the nitrogen concentrations of SiC substrates located at the top (#02), middle (#23) and bottom (#43, #48) of the boule examined by Raman spectroscopy and SIMS. The nitrogen concentrations in both techniques ranged from 1 × 1018 cm−3 to 8 × 1018 cm−3, with the data generally showing good agreement, and a similar decreasing trend. This trend correlates with the observed increase in crystal resistivity along the axial growth direction as depicted in Fig. 3.
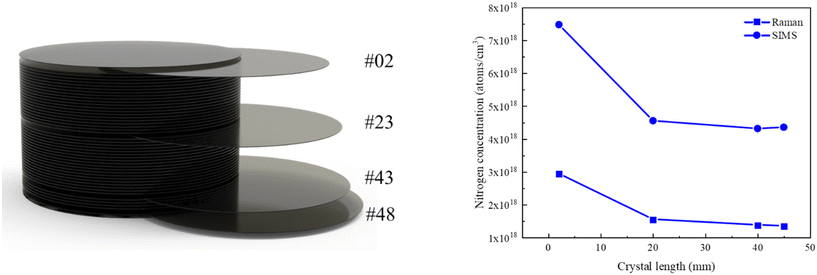 |
| | Fig. 10 Nitrogen concentration distribution versus crystal length; solid square symbols for Raman and solid circular symbols for SIMS. | |
It is noted that Raman measurements consistently yield lower nitrogen concentrations than SIMS due to different principles: Raman actually measures ionized carrier concentration, while SIMS measures the total nitrogen concentration. The comparison reveals that the Raman data accounts for roughly 30% of SIMS data, consistent with Hansen et al.'s report that solely 35–70% of incorporated nitrogen in the SiC crystal is electrically activated.22 By dividing the SIMS-measured nitrogen concentration by the total lattice density of the SiC crystal (9.63 × 1022 cm−3), it is calculated that 0.004–0.008% SiC lattice sites are substituted by incorporated nitrogen atoms. Numerical simulation results show that the N/(C + Si) ratio in the gas phase near the growth front is 4–7%. Therefore, like the segregation of crystal growth from the liquid phase, the doping efficiency of nitrogen from the gas phase to the grown SiC crystal is calculated to be 0.001, comparable to the reported atomic fractions of oxygen of 0.001 to 0.01 in growing AlN crystals.53
4 Conclusions
A 4H-SiC crystal was grown by the PVT method to investigate the axial resistivity distribution and a comprehensive multi-physical model was developed to study the affecting factors. The model coupled heat and mass transfer, gas exchange across the crucible, and the etching reaction of graphite inner walls. The study provided valuable insights into the behavior of the growth front temperature, C/Si ratio and nitrogen partial pressure as a function of crystal length. The results indicated that both the growth front temperature and C/Si ratio increase as the crystal length grows, whereas the nitrogen partial pressure decreases.
Experimental and simulation data revealed that crystal resistivity is more sensitive to temperature changes than to variations in the C/Si ratio. Raman and SIMS measurements suggested a decrease in nitrogen concentration with increasing crystal length, which is consistent with the observed rise in resistivity along the growth direction. For the first time, a nitrogen doping efficiency of 0.001 is reported for 4H-SiC crystal growth via the PVT method. Our calculations offered a reference for understanding the interplay among temperature, C/Si ratio, and nitrogen incorporation and improving resistivity uniformity in 4H-SiC crystals. Future research will focus on enhancing axial resistivity uniformity based on the findings from this study.
Data availability
The data that support the findings of this study are available at zenodo at https://www.zenodo.org/records/14855606.
Conflicts of interest
There are no conflicts to declare.
Acknowledgements
This work was supported by the “Pioneer” and “Leading Goose” R&D Program of Zhejiang Province (Grant No. 2022C01021, 2023C01010), the National Natural Science Foundation of China (Grant No. 52202189, 61721005), the Hangzhou Joint Funds of the Zhejiang Provincial Natural Science Foundation of China (LHZSD24E020001), the Leading Innovative and Entrepreneur Team Introduction Program of Hangzhou (Grant No. TD2022012), and the Qianjiang Distinguished Experts Program of Hangzhou.
References
- J. B. Casady and R. W. Johnson, Solid-State Electron., 1996, 39, 1409–1422 CrossRef.
- R. R. Siergiej, R. C. Clarke, S. Sriram, A. K. Agarwal, R. J. Bojko, A. W. Morse, V. Balakrishna, M. F. MacMillan, A. A. Burk Jr and C. D. Brandt, Mater. Sci. Eng., B, 1999, 61, 9–17 CrossRef.
- S. G. Müller, R. C. Glass, H. M. Hobgood, V. F. Tsvetkov, M. Brady, D. Henshall, J. R. Jenny, D. Malta and C. H. Carter Jr, J. Cryst. Growth, 2000, 211, 325–332 CrossRef.
-
M. Östling, R. Ghandi and C.-M. Zetterling, in 2011 IEEE 23rd International Symposium on Power Semiconductor Devices and ICs, IEEE, 2011, pp. 10–15 Search PubMed.
- T. Hashiguchi, T. Ota, S. Asano and N. Ohtani, Jpn. J. Appl. Phys., 2022, 61, 95501 Search PubMed.
- R. Anzalone, D. Raciti, M. Arena, C. Calabretta, N. Piluso and A. Severino, Solid State Phenom., 2024, 362, 41–45 Search PubMed.
- H. Jacobson, J. Birch, C. Hallin, A. Henry, R. Yakimova, T. Tuomi, E. Janzén and U. Lindefelt, Appl. Phys. Lett., 2003, 82, 3689–3691 CrossRef CAS.
- Y. Guang, L. Xiaoshuang, L. Jiajun, X. Lingbo, C. Can, P. Xiaodong, Y. Deren and W. Rong, J. Synth. Cryst., 2022, 51, 1673–1690 Search PubMed.
- G. Yang, H. Luo, J. Li, Q. Shao, Y. Wang, R. Zhu, X. Zhang, L. Song, Y. Zhang, L. Xu, C. Cui, X. Pi, D. Yang and R. Wang, J. Semicond., 2022, 43, 122801 CrossRef CAS.
- G. Hu, G. Zhong, X. Xiong, H. Li, H. Shao, L. Zhao, X. Li, X. Yang, X. Chen, X. Xie, Y. Peng, G. Yu, X. Hu and X. Xu, Vacuum, 2024, 222, 112961 CrossRef CAS.
-
A. Soukhojak and G. Chung, ICSCRM – Int. Conf. Silicon Carbide Relat. Mater., 2023, vol. 362, pp. 09/17–09/22 Search PubMed.
- H. Shao, X. Yang, D. Wang, X. Li, X. Chen, G. Hu, H. Li, X. Xiong, X. Xie, X. Hu and X. Xu, J. Electron. Mater., 2024, 53, 2429–2436 CrossRef CAS.
- X. Yang, C. Xiufang, X. Xuejian, P. Yan, Y. Guojian, H. Xiaobo, W. Yaohao and X. Xiangang, J. Synth. Cryst., 2022, 51, 1745 CAS.
- Q. Li, A. Y. Polyakov, M. Skowronski, E. K. Sanchez, M. J. Loboda, M. A. Fanton, T. Bogart and R. D. Gamble, J. Appl. Phys., 2005, 97, 113705 CrossRef.
- T. Kimoto, Prog. Cryst. Growth Charact. Mater., 2016, 62, 329–351 CrossRef CAS.
- N. Ohtani, M. Katsuno, M. Nakabayashi, T. Fujimoto, H. Tsuge, H. Yashiro, T. Aigo, H. Hirano, T. Hoshino and K. Tatsumi, J. Cryst. Growth, 2009, 311, 1475–1481 CrossRef CAS.
- B. Wang, T. Peng, J. Liang, G. Wang, W. Wang, H. Zhao and X. Chen, Appl. Phys. A: Mater. Sci. Process., 2014, 117, 1563–1569 CrossRef CAS.
- N. Ohtani, M. Katsuno, J. Takahashi, H. Yashiro and M. Kanaya, J. Appl. Phys., 1998, 83, 4487–4490 Search PubMed.
- D. J. Lichtenwalner, J. H. Park, S. Rogers, H. Dixit, A. Scholtze, S. Bubel and S. H. Ryu, Mater. Sci. Forum, 2023, 1089, 3–7 Search PubMed.
- H. Li, X. L. Chen, D. Q. Ni and X. Wu, J. Cryst. Growth, 2003, 258, 100–105 CrossRef CAS.
- N. Tsavdaris, P. Kwasnicki, K. Ariyawong, N. Valle, H. Peyre, E. Sarigiannidou, S. Juillaguet and D. Chaussende, Mater. Sci. Forum, 2015, 821–823, 60–63 Search PubMed.
- D. M. Hansen, G. Y. Chung and M. J. Loboda, Mater. Sci. Forum, 2006, 527–529, 59–62 CAS.
-
K. Ariyawong, Doctoral dissertation, University Grenoble Alpes, 2015 Search PubMed.
- M. S. Ramm, E. N. Mokhov, S. E. Demina, M. G. Ramm, A. D. Roenkov, Y. A. Vodakov, A. S. Segal, A. N. Vorob'ev, S. Y. Karpov, A. V. Kulik and Y. N. Makarov, Mater. Sci. Eng., B, 1999, 61–62, 107–112 CrossRef.
- T. S. Sudarshan and S. I. Maximenko, Microelectron. Eng., 2006, 83, 155–159 CrossRef CAS.
- Z. G. Herro, P. J. Wellmann, R. Püsche, M. Hundhausen, L. Ley, M. Maier, P. Masri and A. Winnacker, J. Cryst. Growth, 2003, 258, 261–267 CrossRef CAS.
-
D. J. Larkin, P. G. Neudeck, J. A. Powell and L. G. Matus, Institute of Physics Conf. Series 137: Silicon Carbide and Related Materials, Washington, DC, 1994, pp. 51–54 Search PubMed.
- B. Xu, X. Han, S. Xu, D. Yang and X. Pi, J. Cryst. Growth, 2023, 614, 127238 CrossRef CAS.
-
Q.-S. Chen, V. Prasad, H. Zhang and M. Dudley, in Crystal Growth Technology, Elsevier, 2003, pp. 233–269 Search PubMed.
-
R. Ma, Doctoral dissertation, State University of New York, 2003 Search PubMed.
- S. K. Lilov, Mater. Sci. Eng., B, 1993, 21, 65–69 CrossRef.
- B. Xu, X. Han, S. Xu, D. Yang and X. Pi, Cryst. Res. Technol., 2024, 59, 1–12 Search PubMed.
- P. J. Wellmann, Z. Herro, S. A. Sakwe, P. Masri, M. Bogdanov, S. Karpov, A. Kulik, M. Ramm and Y. Makarov, Mater. Sci. Forum, 2004, 457–460, 55–58 CAS.
- J. Liu, J. Gao, J. Cheng, J. Yang and G. Qiao, Diamond Relat. Mater., 2006, 15, 117–120 CrossRef CAS.
- X. Liu, E. W. Shi, L. X. Song and Z. Z. Chen, J. Cryst. Growth, 2008, 310, 4314–4318 CrossRef CAS.
- E. Y. Tupitsyn, A. Arulchakkaravarthi, R. V. Drachev and T. S. Sudarshan, J. Cryst. Growth, 2007, 299, 70–76 CrossRef CAS.
- Q. S. Chen, H. Zhang, R. H. Ma, V. Prasad, C. M. Balkas and N. K. Yushin, J. Cryst. Growth, 2001, 225, 299–306 CrossRef.
-
M. S. Ramm, A. V. Kulik, I. A. Zhmakin, S. Y. Karpov, O. V. Bord, S. E. Demina and Y. N. Makarov, in Materials Research Society Symposium – Proceedings, 2000, vol. 616, pp. 227–233 Search PubMed.
- J. Takahashi, N. Ohtani and M. Kanaya, Jpn. J. Appl. Phys., 1995, 34, 4694–4698 CrossRef.
- K. Onoue, T. Nishikawa, M. Katsuno, N. Ohtani, H. Yashiro and M. Kanaya, Jpn. J. Appl. Phys., Part 1, 1996, 35, 2240–2243 CrossRef.
- K. Ariyawong, N. Tsavdaris, J. M. Dedulle, E. Sarigiannidou, T. Ouisse and D. Chaussende, Mater. Sci. Forum, 2014, 778–780, 31–34 Search PubMed.
- S. Lu, H. Chen, W. Hang, R. Wang, J. Yuan, X. Pi, D. Yang and X. Han, CrystEngComm, 2023, 25, 3718–3725 RSC.
- S. Lu, B. Xu, L. Xuan, X. Pi, D. Yang and X. Han, CrystEngComm, 2024, 26, 6244–6254 RSC.
- B. Xu, S. Lu, H. Cui, X. Pi, D. Yang and X. Han, CrystEngComm, 2024, 26, 5550–5560 RSC.
- S. Lu, B. Xu, Y. Wang, H. Chen, W. Hang, R. Wang, J. Yuan, X. Pi, D. Yang and X. Han, CrystEngComm, 2024, 26, 2143–2154 RSC.
- N. Yang, B. Song, W. Wang and H. Li, CrystEngComm, 2022, 24, 3475–3480 RSC.
- P. Gao, J. Xin, X. Liu, Y. Zheng and E. Shi, CrystEngComm, 2019, 21, 6964–6968 RSC.
- R. Ma, Q.-S. Chen, H. Zhang, V. Prasad, C. M. Balkas and N. K. Yushin, J. Cryst. Growth, 2000, 211, 352–359 CrossRef.
- M. Anikin and R. Madar, Mater. Sci. Eng., B, 1997, 46, 278–286 CrossRef.
- Y. M. Tairov and V. F. Tsvetkov, Prog. Cryst. Growth Charact., 1983, 7, 111–162 CrossRef CAS.
- T. Kimoto, A. Itoh and H. Matsunami, Appl. Phys. Lett., 1995, 67, 2385 Search PubMed.
- D. J. Larkin, Phys. Status Solidi B, 1997, 202, 305–320 CrossRef CAS.
- S. Y. Karpov, A. V. Kulik, I. N. Przhevalskii, M. S. Ramm and Y. N. Makarov, Phys. Status Solidi C, 2003, 1992, 1989–1992 CrossRef.
Footnote |
| † Co-first authors: Lingling Xuan and Xinyu Xie contributed equally to this work. |
|
| This journal is © The Royal Society of Chemistry 2025 |
Click here to see how this site uses Cookies. View our privacy policy here. 
 Open Access Article
 This Open Access Article is licensed under a Creative Commons Attribution-Non Commercial 3.0 Unported Licence
 ab,
Xinyu
Xie†
ab,
Xinyu
Xie†


 is the total molar flux of SiC2 deposited at the seed surface. In Fig. 4, the crystal growth rate decreases as the crystal length increases from 0 to 30 mm. This is agreed with the observation of Ramm et al.38 Increased crystal length leads to lower axial temperature gradients, and thereby less SiC2 gas species reach the supersaturation conditions, decreasing the growth rate. For crystal length exceeding 30 mm, the growth rate shows a tiny increase due to a large temperature difference between the top and bottom monitoring points. Numerical calculation results indicated that the crystal growth rate would resume its declining trend if the temperature difference between these two points is maintained within 180 K. The large increase for the last data point at 45 mm is caused by the intentional temperature sensitivity test. It is obtained from eqn (9) that the crystal growth rate is determined by the molar flux of SiC2 which is closely related to the temperature through the Hertz–Knudsen boundary conditions (eqn (7)). The distribution profile of the growth rate is totally different from the profile of axial resistivity. No relevant evidence suggests that the growth rate is responsible for nitrogen incorporation. The experiments of Takahashi and Onoue also proved that the crystal growth rate has negligible influence on nitrogen incorporation.39,40