
 Open Access Article
 This Open Access Article is licensed under a
 Creative Commons Attribution 3.0 Unported Licence
Stabilisation of amorphous coordination polymer nanoparticles in a covalent organic framework†
Boonrasri
Seeleang
a,
Soracha
Kosasang
 *b,
Karnjana
Atthawilai
a,
Thanakorn
Tiyawarakul
a,
Thidarat
Imyen
c,
Kanokwan
Kongpatpanich
a and
Satoshi
Horike
*abc
*b,
Karnjana
Atthawilai
a,
Thanakorn
Tiyawarakul
a,
Thidarat
Imyen
c,
Kanokwan
Kongpatpanich
a and
Satoshi
Horike
*abc
aDepartment of Materials Science and Engineering, School of Molecular Science and Engineering, Vidyasirimedhi Institute of Science and Technology, Rayong 21210, Thailand
bDepartment of Chemistry, Graduate School of Science, Kyoto University, Kitashirakawa-Oiwakecho, Sakyo-ku, Kyoto 606-8502, Japan. E-mail: kosasang.soracha@nims.go.jp; horike.satoshi.3r@kyoto-u.ac.jp
cInstitute for Integrated Cell-Material Sciences, Institute for Advanced Study, Kyoto University, Yoshida-Honmachi, Sakyo-ku, Kyoto 606-8501, Japan
First published on 24th April 2025
Abstract
We present an approach to preparing amorphous coordination polymer nanoparticles ranging in size from 5 to 20 nm by embedding them in a COF matrix. Electron microscopy, X-ray absorption spectroscopy, and total scattering analysis confirm the structure of the amorphous coordination polymer. The high distribution of the nanoparticles facilitates high porosity and tunable emission in the hybrids.
Downsizing bulk amorphous materials to the nanometer scale demonstrates unique physicochemical properties.1 For instance, nanosized CuZr amorphous alloy exhibits an improved elastic limit and tensile strength compared to their bulk and micron-scale counterparts.2 Amorphous SiC nanofibers exhibit high tensile strength and self-healing properties due to strong interfacial interactions among abundant dangling bonds.3
Amorphous and glassy states in coordination polymers (CPs), including metal–organic frameworks (MOFs), exhibit distinct properties compared to their crystalline counterparts, such as ion/electron conductivity, optics, mechanics, and catalysis.4–9 On the other hand, the low gas accessibility, diffusion, and chemical stability of amorphous CPs limit their applications. Despite the increasing number of amorphous and glassy CPs, reports on the preparation of nanoparticles in their amorphous states remain rare.10,11 Typically, the amorphous state of CPs is initially synthesised in a crystalline form and then amorphised through methods such as melt-quenching, desolvation, mechanical milling, pressure, and radiation.12–19 Nevertheless, these methods are not applicable to synthesising amorphous CP nanoparticles, and other approaches are needed.
Amorphous nanoparticles tend to form aggregates to reduce surface energy, which is a barrier to fully using their characteristics. To avoid aggregation, wet chemical synthesis using highly surface porous supports is one of the strategies to stabilise amorphous nanoparticles. For example, amorphous Fe2O3 nanoparticles were dispersed into a porous styrene-divinylbenzene polymer matrix, preventing agglomeration and enhancing its photocatalytic activity.20 Amorphous SnO2 nanoparticles anchored in a hierarchically porous N-doped carbon matrix exhibit an improved lithium diffusion rate with enhanced structural stability through agglomeration suppression by the porous matrix.21 Stabilising amorphous CP nanoparticles on porous solids would offer a promising approach for catalyst and sensor design.
In this work, we develop a method for synthesising nanoparticles of one-dimensional (1D) coordination polymers (CPs) embedded in a covalent organic framework (COF) as a substrate. COFs stand out due to their high surface area and stability. They facilitate crystalline nanoparticle growth within their uniform pores or between layers, minimising particle aggregation.22–25 We utilised synchrotron X-ray absorption and scattering, thermal analysis, gas sorption, and fluorescence emission studies to characterise the structural and physical properties of the embedded amorphous nanoparticles. By adjusting the CP-to-COF ratio, we modulated the porosity and fluorescence emission of the hybrid materials.
We selected a 1D silver-based CP, Ag(CN(CH2)4CN)(CF3SO3) (hereafter AgAN), because of the presence of Ag+ with a high affinity for N donor ligands, a labile and dynamic coordination bond, and the solubility and stability of AgCF3SO3 in organic solvents.26 AgAN is difficult to stabilise in the amorphous phase even in the bulk state, because it prefers recrystallisation. It shows crystal melting at 138 °C, but the melt-quench process provides the crystal, not glass/amorphous. AgAN dissolves in some organic solvents and recrystallises upon evaporation. COF-42 made from 1,3,5-triformylbenzene and 2,5-diethoxy-terephthalohydrazide served as a matrix, as it is a chemically and thermally stable two-dimensional structure. It features a high surface area and has a pore size of 2.8 nm, facilitating a high loading capacity and confinement of nanoparticles.
AgAN and COF-42 were synthesised following previously reported methods.22,27,28 Powder X-ray diffraction (PXRD) and Fourier transform infrared spectroscopy (FT-IR) confirm the structure of both the samples (Fig. 1, and Fig. S1, S2, ESI†). AgAN dissolves in acetonitrile and recrystallises into its original crystal structure upon solvent evaporation (Fig. S1, ESI†). Dispersing COF-42 in the acetonitrile solution of AgAN following evaporation forms xAg@COF, where x represents the weight percentage of AgAN loading. The PXRD patterns of 50–60Ag@COFs (Fig. S3, ESI†) display the characteristic peaks of both COF-42 and bulk AgAN. All xAg@COFs exhibit shifts and lower PXRD peak intensities for the (100) and (200) planes of COF-42. The PXRD patterns of 10–40Ag@COFs show the absence of the bulk AgAN peak, suggesting an amorphous structure, denoted as aAgAN (Fig. 1B and Fig. S3, ESI†). We selected 40Ag@COF for characterising its structure.
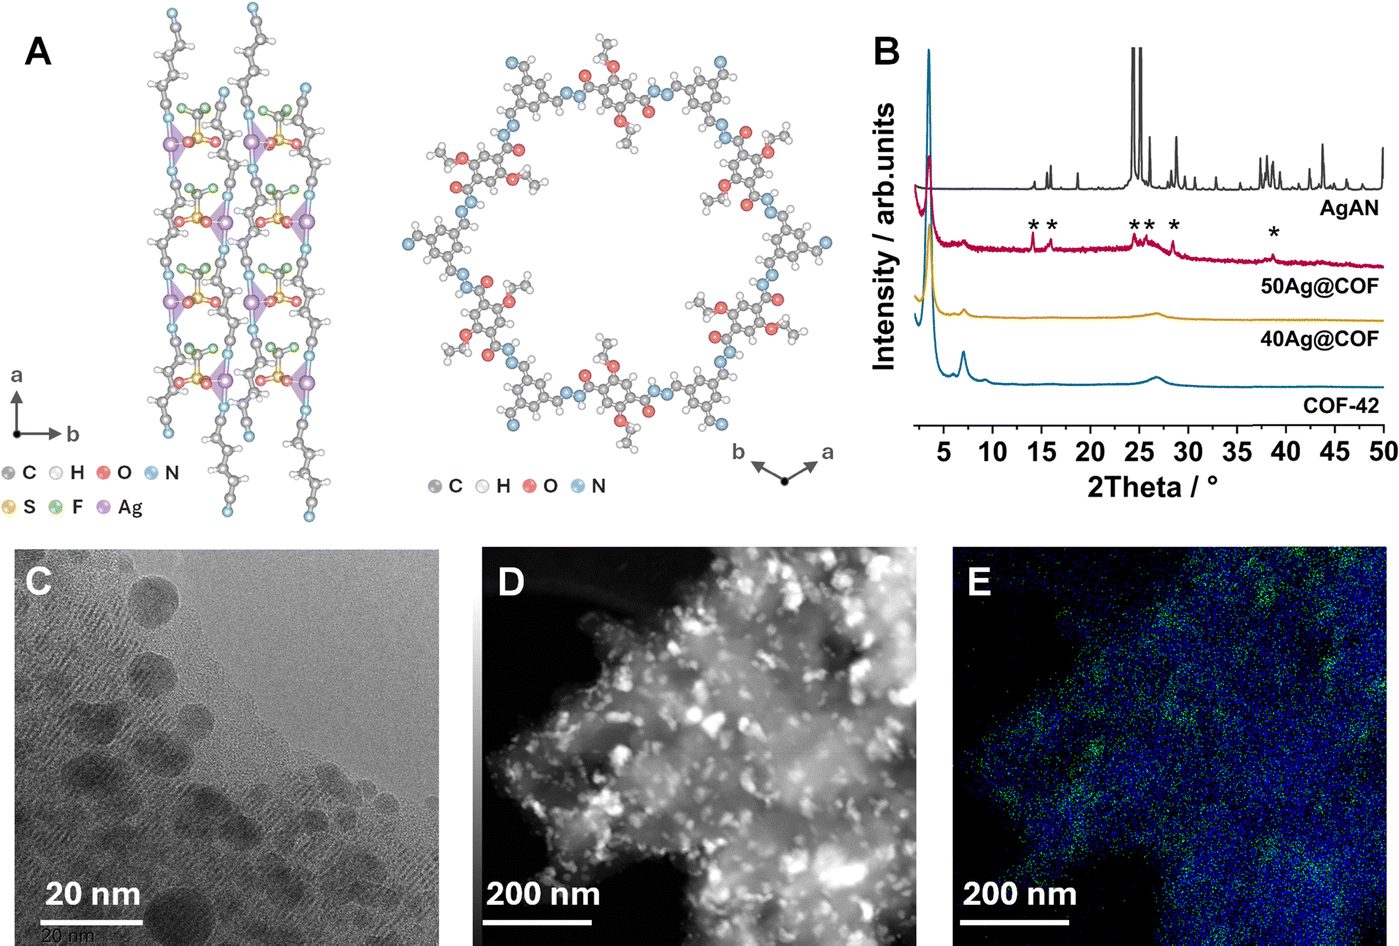 | ||
| Fig. 1 (A) Crystal structures of AgAN and COF-42. (B) PXRD patterns for COF-42, AgAN, 40Ag@COF, and 50Ag@COF. (C) HR-TEM, (D) STEM images, and (E) EDX analysis of C (blue) and Ag (green) atoms for the 40Ag@COF. | ||
Scanning electron microscopy (SEM) images of AgAN show a rod-like morphology with lengths ranging from about 50 to 150 μm, while COF-42 shows a porous, layered sheet morphology with a particle size of ∼20 μm (Fig S4A and B, ESI†). In contrast, the SEM images of 40Ag@COF do not exhibit a rod-shaped morphology (Fig. S4C, ESI†). The high resolution-transmission electron microscopy (HR-TEM) image of the 40Ag@COF shows particles, with a size of 5–20 nm, dispersed within the COF-42 matrix (Fig. 1C). The proposed single-step procedure to fabricate amorphous and uniformly nanosized particles of CPs is rarely reported (Table S1, ESI†). The lower PXRD peak intensity upon increasing AgAN loading is attributed to the smaller COF amounts in xAg@COFs. While the crystallinity and structure integrity of COF-42 are preserved, as evidenced by HR-TEM and FTIR, scanning transmission electron microscopy coupled with energy-dispersive X-ray spectroscopy (STEM-EDX) of the 40Ag@COF confirms the uniform dispersion of aAgAN nanoparticles on COF-42 (Fig. 1D and E).
We confirm the presence of adiponitrile within the 40Ag@COF using solid-state 13C magic-angle spinning nuclear magnetic resonance (MAS-NMR). The peaks at 16, 24, and 119 ppm correspond to adiponitrile (Fig. 2A). Peak assignments at 12, 14, 65, 115, 122, 126, 134, 146, 149, and 159 ppm correlate with the COF-42.29 Although quantitative analysis under MAS conditions requires caution and a sufficient relaxation delay, we integrated the peaks of OCH2 in COF-42 and CH2 in adiponitrile, which exhibit a 9![[thin space (1/6-em)]](https://www.rsc.org/images/entities/char_2009.gif) :2 ratio, indicating about 40% adiponitrile is present in the 40Ag@COF. Quantitative analysis using liquid-state 1H NMR also confirms that the amount of adiponitrile is 1 mmol g−1, accounting for 37 wt% of AgAN within the 40Ag@COF (Fig. S5 and Table S2, ESI†).
:2 ratio, indicating about 40% adiponitrile is present in the 40Ag@COF. Quantitative analysis using liquid-state 1H NMR also confirms that the amount of adiponitrile is 1 mmol g−1, accounting for 37 wt% of AgAN within the 40Ag@COF (Fig. S5 and Table S2, ESI†).
 | ||
| Fig. 2 (A) Solid-state 13C MAS NMR spectra of the 40Ag@COF. Local structure characterisation: (B) and (C) pair distribution functions (PDFs) for AgAN and the 30Ag@COF and (D) Fourier-transform EXAFS at the Ag K-edge of AgAN, the 30Ag@COF, and the 40Ag@COF. | ||
X-ray photoelectron spectroscopy (XPS) and X-ray absorption near-edge structure (XANES) reveal the chemical composition and oxidation state of Ag ions in the 40Ag@COF (Fig. S6–S12, ESI†). The narrow C 1s XPS spectrum of the 40Ag@COF shows a CF3 peak at 291.4 eV, confirming the presence of CF3SO3− (Fig. S7, ESI†). The narrow-scan Ag 3d XPS spectrum indicates that the oxidation state of the Ag ion is +1, consistent with the XANES results (Fig. S8 and S12, ESI†). No significant shift in the Ag 3d binding energy is observed between the aAgAN stabilised in COF-42 and AgAN bulk, while a slight shift in the binding energy of Ag+ from the AgCF3SO3 salt is observed (Fig. S9, ESI†). The atomic ratio of Ag:S:F is 1:1:3 for the 40Ag@COF, as derived from the XPS data (Fig S10, S11, and Table S3, ESI†). Inductively coupled plasma-optical emission spectrometry (ICP-OES) analysis indicates that the actual Ag+ content is 1.2 mmol g−1, corresponding to 46 wt% of AgAN within the 40Ag@COF (Table S4, ESI†). These results confirm that the aAgAN nanoparticles comprise Ag+, adiponitrile, and CF3SO3− in a 1:1:1 ratio, matching the composition ratio of AgAN found in the crystal structure.
We investigated the local structure of the 30Ag@COF by characterising the atomic pair correlation using synchrotron X-ray total scattering (Fig. 2B and C). The Fourier transformation and the Lorch modification of the Faber–Ziman total structure factor, S(Q), were used to obtain atomic pair information represented as pair distribution functions (PDFs, Fig. 2C and Fig. S13, ESI†).30 The short-range peaks below 10 Å of the 30Ag@COF are similar to those of AgAN. The range includes the closest Ag–N bonds (2.1 Å) along with Ag–C (4.7 Å) and Ag–O (4.9 Å) correlations with adiponitrile and CF3SO3− (Fig. 2C and Fig. S13, ESI†). These observations confirm the connectivity of Ag+ with the adiponitrile and CF3SO3−. A broad peak between 7.2 and 7.5 Å (labelled as Ag⋯Ag) suggests the presence of the closest intermolecular Ag⋯Ag correlations. At distances greater than 10 Å, we observe a broad peak of Ag⋯Ag beyond the nearest neighbour. The intramolecular Ag–Ag correlation (labelled as Ag–Ag in Fig. 2C) is highly distorted due to the flexible nature of the adiponitrile. Extended X-ray absorption fine structure (EXAFS) reveals the local structure of the 30Ag@COF and 40Ag@COF compared to AgAN (Fig. 2D). We observed a decrease in peak intensities for Ag–N, Ag–O, Ag–N–C, and Ag–O–S pairs compared to AgAN, suggesting distortion around the Ag+ node of aAgAN. Thermogravimetric analysis (TGA) indicates that the thermal stability of the 40Ag@COF reaches up to 299 °C, while COF-42 and AgAN decompose at 360 °C and 232 °C, respectively (Fig. S14, ESI†).
We conducted differential scanning calorimetry (DSC) to observe the phase transition behaviour. The DSC profile of AgAN reveals an onset melting temperature of 138 °C and a recrystallisation peak at 50 °C (Fig. S15, ESI†). In contrast, the 40Ag@COF displays no detectable endothermic or exothermic peaks (Fig. S16, ESI†). The latter suggests a stable amorphous phase of aAgAN without crystallisation. The 50–60Ag@COF samples display melting behaviour that correlated with the presence of bulk, crystalline AgAN observed in the PXRD (Fig. S3 and S16, ESI†). We demonstrated the feasibility of upscaling the synthesis by performing a 10-fold scale-up of the 40Ag@COF (denoted as up-40Ag@COF), which shows results consistent with the original-scale synthesis (Fig. S17–S21 and Table S2, ESI†).
Fig. 3A presents the N2 sorption isotherms for COF-42, the 30Ag@COF, the 40Ag@COF, and bulk AgAN at 77 K. The COF-42 exhibits a total N2 uptake of 595 cm3 g−1, with a Brunauer–Emmett–Teller (BET) surface area of 1498 m2 g−1 and a pore volume of 0.9 cm3 g−1. The N2 uptake for 40Ag@COF is 410 cm3 g−1(perCOFweight), with a BET surface area of 780 m2 g−1(COF) and a pore volume of 0.65 cm3 g−1(COF), while the bulk AgAN shows negligible gas uptake because of non-porosity. CO2 sorption isotherms at 195 K (Fig. S22, ESI†) show that the total uptake for COF-42 and the 40Ag@COF is 361 cm3 g−1 and 255 cm3 g−1(COF). These results confirm that the pores in the 40Ag@COF remain accessible in the presence of aAgAN nanoparticles.
 | ||
| Fig. 3 (A) N2 sorption isotherms at 77 K. (B) Fluorescence emission of COF-42, AgAN, and 10, 30, and 40Ag@COFs. Solid and open symbols denote adsorption and desorption, respectively. | ||
The UV-Vis absorption spectrum broadens in the range of 200–450 nm for 10–40Ag@COFs when compared to COF-42 (Fig. S23, ESI†). The optical band gaps, determined from Tauc plots, are 2.9 eV and 2.8 eV for COF-42 and the 40Ag@COF, respectively. The decrease in band gap energy is due to the electron transfer between the COF-42 framework and the aAgAN, which introduces additional electronic states within the band gap.31–33 The UV-Vis spectrum of AgAN shows a distinct peak at approximately 220–250 nm with minimal absorption in the visible region, which is attributed to ligand-centred (π–π) or metal-to-ligand charge transfer (MLCT) transitions. Upon excitation at 300 nm, we observed differences in emission profiles (Fig. 3B). COF-42 exhibits broad fluorescence emission centred at 452 nm, attributed to the excitation of its hydrazone linker. The 40Ag@COF shows fluorescence quenching, suggesting charge separation within COF-42, where the excited electrons are transferred to aAgAN after excitation.34,35 The 40Ag@COF shows a red shift in the emission peak of 15 nm, indicating interactions between aAgAN and the COF-42. This observation aligns with FT-IR data where the C![[double bond, length as m-dash]](https://www.rsc.org/images/entities/char_e001.gif) N peak splits and/or broadens compared to COF-42, due to increased electron delocalisation or coordination interactions (Fig. S24, ESI†). These results provide evidence of the stabilisation and charge transfer of aAgAN nanoparticles on COF-42. In contrast, AgAN does not exhibit fluorescence emission under 300 nm excitation.
N peak splits and/or broadens compared to COF-42, due to increased electron delocalisation or coordination interactions (Fig. S24, ESI†). These results provide evidence of the stabilisation and charge transfer of aAgAN nanoparticles on COF-42. In contrast, AgAN does not exhibit fluorescence emission under 300 nm excitation.
In conclusion, we present a method for embedding stable amorphous nanoparticles of a one-dimensional coordination polymer, AgAN, in a porous solid. Using a simple solution-impregnation method in the presence of COF-42, amorphous nanoparticles of AgAN were stabilised within the porous COF-42 structure. Solid-state NMR, XPS, XAS, and synchrotron X-ray total scattering confirmed the formula and structure of the embedded particles. The pores of the 40Ag@COF remain accessible, with a BET surface area of 780 m2 g−1(COF). Quenching of fluorescence in the 40Ag@COF indicates the charge transfer between COF-42 and aAgAN upon excitation. This work demonstrates the approach to stabilising amorphous nanoparticles of CPs and MOFs to fabricate hybrid materials, with potential for photo/thermal catalysis and optical sensing applications.
This work was supported by the Japan Society of the Promotion of Science (JSPS) for a Transformative Research Areas (A) “Supra Ceramics” (JP22H05147), Fund for the Promotion of Joint International Research (International Collaborative Research, JP24K0112) from the Ministry of Education, Culture, Sports, Science and Technology (MEXT), Japan, and Thailand Science Research and Innovation (TSRI) under the fiscal year 2025 funding program (FRB680014/0457). We thank Somlak Ittisanronnachai, Thassanant Atithep (Vidyasirimedhi Institute of Science and Technology), and Nao Horike (Kyoto University) for their experimental support. The synchrotron radiation experiments were performed at BL04B2 under the support of Dr Hiroki Yamada (Japan Synchrotron Radiation Research Institute) and BL14B2 in SPring-8 with the approval of RIKEN (2023B1721 and 2023B2001).
Data availability
The data that support this article have been included as part of the ESI.†Conflicts of interest
There are no conflicts to declare.Notes and references
- J. Kang, X. Yang, Q. Hu, Z. Cai, L.-M. Liu and L. Guo, Chem. Rev., 2023, 123, 8859 CrossRef CAS PubMed
.
- L. Tian, Y.-Q. Cheng, Z.-W. Shan, J. Li, C.-C. Wang, X.-D. Han, J. Sun and E. Ma, Nat. Commun., 2012, 3, 609 CrossRef PubMed
- J. Cui, Z. Zhang, H. Jiang, D. Liu, L. Zou, X. Guo, Y. Lu, I. P. Parkin and D. Guo, ACS Nano, 2019, 13, 7483 CrossRef CAS PubMed
- A. Qiao, H. Tao, M. P. Carson, S. W. Aldrich, L. M. Thirion, T. D. Bennett, J. C. Mauro and Y. Yue, Opt. Lett., 2019, 44, 1623 CrossRef CAS PubMed
- T. To, S. S. Sørensen, M. Stepniewska, A. Qiao, L. R. Jensen, M. Bauchy, Y. Yue and M. M. Smedskjaer, Nat. Commun., 2020, 11, 2593 CrossRef CAS PubMed
- J. Li, J. Wang, Q. Li, M. Zhang, J. Li, C. Sun, S. Yuan, X. Feng and B. Wang, Angew. Chem., Int. Ed., 2021, 60, 21304 CrossRef CAS PubMed
- N. Ma and S. Horike, Chem. Rev., 2022, 122, 4163 CrossRef CAS PubMed
- R. Lin, X. Li, A. Krajnc, Z. Li, M. Li, W. Wang, L. Zhuang, S. Smart, Z. Zhu, D. Appadoo, J. R. Harmer, Z. Wang, A. G. Buzanich, S. Beyer, L. Wang, G. Mali, T. D. Bennett, V. Chen and J. Hou, Angew. Chem., Int. Ed., 2022, 61, e202112880 CrossRef CAS PubMed
- S. Kosasang, N. Ma, S. Impeng, S. Bureekaew, Y. Namiki, M. Tsujimoto, T. Saothayanun, H. Yamada and S. Horike, J. Am. Chem. Soc., 2024, 146, 17793 CrossRef CAS PubMed
- C. Gobel, G. Horner, A. Greiner, H. Schmalz and B. Weber, Nanoscale Adv., 2020, 2, 4557 RSC
- W. Zhang, Y. Liu, H. S. Jeppesen and N. Pinna, Nat. Commun., 2024, 15, 5463 CrossRef CAS PubMed
- K. W. Chapman, G. J. Halder and P. J. Chupas, J. Am. Chem. Soc., 2009, 131, 17546 CrossRef CAS PubMed
- D. Umeyama, S. Horike, M. Inukai, T. Itakura and S. Kitagawa, J. Am. Chem. Soc., 2015, 137, 864 CrossRef CAS PubMed
- T. D. Bennett, Y. Yue, P. Li, A. Qiao, H. Tao, N. G. Greaves, T. Richards, G. I. Lampronti, S. A. T. Redfern, F. Blanc, O. K. Farha, J. T. Hupp, A. K. Cheetham and D. A. Keen, J. Am. Chem. Soc., 2016, 138, 3484 CrossRef CAS PubMed
- R. N. Widmer, G. I. Lampronti, N. Casati, S. Farsang, T. D. Bennett and S. A. T. Redfern, Phys. Chem. Chem. Phys., 2019, 21, 12389 RSC
- N. Ma, R. Ohtani, H. M. Le, S. S. Sørensen, R. Ishikawa, S. Kawata, S. Bureekaew, S. Kosasang, Y. Kawazoe, K. Ohara, M. M. Smedskjaer and S. Horike, Nat. Commun., 2022, 13, 4023 CrossRef CAS PubMed
- Y.-S. Wei, Z. Fan, C. Luo and S. Horike, Nat. Synth., 2024, 3, 214 CrossRef CAS
- M. Kim, H.-S. Lee, D.-H. Seo, S. J. Cho, E.-C. Jeon and H. R. Moon, Nat. Commun., 2024, 15, 1174 CrossRef CAS PubMed
- W. L. Xue, C. Das, J. B. Weiss and S. Henke, Angew. Chem., Int. Ed., 2024, 63, e202405307 CrossRef CAS PubMed
- M. Hojamberdiev, Z. C. Kadirova, S. S. Daminova, K. Yubuta, H. Razavi-Khosroshahi, K. T. Sharipov, M. Miyauchi, K. Teshima and M. Hasegawa, Appl. Surf. Sci., 2019, 466, 837 CrossRef CAS
- Y. Xin, S. Pan, X. Hu, C. Miao, S. Nie, H. Mou and W. Xiao, J. Colloid Interface Sci., 2023, 639, 133 CrossRef CAS PubMed
- F. J. Uribe-Romo, C. J. Doonan, H. Furukawa, K. Oisaki and O. M. Yaghi, J. Am. Chem. Soc., 2011, 133, 11478 CrossRef CAS PubMed
- K. Kamiya, R. Kamai, K. Hashimoto and S. Nakanishi, Nat. Commun., 2014, 5, 5040 CrossRef CAS PubMed
- L. Stegbauer, K. Schwinghammer and B. V. Lotsch, Chem. Sci., 2014, 5, 2789 RSC
- S. Lu, Y. Hu, S. Wan, R. McCaffrey, Y. Jin, H. Gu and W. Zhang, J. Am. Chem. Soc., 2017, 139, 17082 CrossRef CAS PubMed
- D. Venkataraman, S. Lee, J. S. Moore, P. Zhang, K. A. Hirsch, G. B. Gardner, A. C. Covey and C. L. Prentice, Chem. Mater., 1996, 8, 2030 CrossRef CAS
- L. Carlucci, G. Ciani, D. M. Proserpio and S. Rizzato, CrystEngComm, 2002, 4, 413 RSC
- C. Das, T. Ogawa and S. Horike, Chem. Commun., 2020, 56, 8980 RSC
- S.-Y. Ding, X.-H. Cui, J. Feng, G. Lu and W. Wang, Chem. Commun., 2017, 53, 11956 RSC
- S. Kohara, M. Itou, K. Suzuya, Y. Inamura, Y. Sakurai, Y. Ohishi and M. Takata, J. Phys.: Condens. Matter, 2007, 19, 506101 CrossRef
- N. Sinha and S. Pakhira, ACS Appl. Electron. Mater., 2021, 3, 720 CrossRef CAS
- T. Hosokawa, M. Tsuji, K. Tsuchida, K. Iwase, T. Harada, S. Nakanishi and K. Kamiya, J. Mater. Chem. A, 2021, 9, 11073–11080 RSC
- Z. Zhou, P. Li, X. Gao, J. Chen, K. Akhtar, E. M. Bakhsh, S. B. Khan, Y. Shen and M. Wang, J. Environ. Chem. Eng., 2022, 10, 106900 CrossRef CAS
- D. Sun, S. Jang, S. J. Yim, L. Ye and D. P. Kim, Adv. Funct. Mater., 2018, 28, 1707110 CrossRef
- T. Hosokawa, M. Tsuji, K. Tsuchida, K. Iwase, T. Harada, S. Nakanishi and K. Kamiya, J. Mater. Chem. A, 2021, 9, 11073 RSC
Footnote |
| † Electronic supplementary information (ESI) available. See DOI: https://doi.org/10.1039/d5cc01530h |
| This journal is © The Royal Society of Chemistry 2025 |