
 Open Access Article
 This Open Access Article is licensed under a Creative Commons Attribution-Non Commercial 3.0 Unported Licence
Self-targeted nanosystem for enhanced chemodynamic cancer therapy†
Kanwal
Asif
abc,
Md. Mahbubur
Rahman
 d,
Vincenzo
Canzonieri
ae,
Isabella
Caligiuri
a,
Flavio
Rizzolio
*ab and
Muhammad
Adeel
*abf
d,
Vincenzo
Canzonieri
ae,
Isabella
Caligiuri
a,
Flavio
Rizzolio
*ab and
Muhammad
Adeel
*abf
aPathology Unit, Centro di Riferimento Oncologico di Aviano (C.R.O.) IRCCS, 33081, Aviano, Italy. E-mail: m.adeel@imperial.ac.uk; Fax: +39-041 2348594; Tel: +39-041 2348910
bDepartment of Molecular Sciences and Nanosystems, Ca’ Foscari University of Venice, 30172, Venice, Italy. E-mail: flavio.rizzolio@unive.it; Fax: +39-041 2348594; Tel: +39-041 2348910
cCentre for Endocrinology, Charterhouse Square, Queen Mary University of London, London EC1M 6BQ, UK
dDepartment of Energy Materials Science & Engineering, Konkuk University, Chungju 27478, Republic of Korea
eDepartment of Medical, Surgical and Health Sciences, University of Trieste, 34149, Trieste, Italy
fDepartment of Bioengineering, Royal School of Mines, Imperial College London, London, SW7 2AZ, UK
First published on 18th March 2025
Abstract
Chemodynamic therapy (CDT) could have a significant potential for advancing cancer treatment via the utilization of Fenton and Fenton-like reactions, which produce toxic reactive species. Nonetheless, the efficacy of CDT is constrained by the limited availability of catalyst ions capable of decomposing pre-existing intracellular H2O2 and generating reactive oxygen species (ROS) necessary to achieve a therapeutic response. To address these limitations, a tailored strategy has been developed to enhance the efficacy of Fenton-like reactions to eradicate selectively cancer cells. This innovative approach involves the utilization of dual metal cations (Zn2+, Fe2+) within zinc nitroprusside (ZnNP) material. Remarkably, this method takes advantage of the acidic conditions prevalent in tumors, thus eliminating the need for external stimuli. Through these advancements, the tailored approach exhibits the potential to specifically target and eliminate cancer cells, overcoming the mentioned limitations. A simple mixing technique was utilized to synthesize ZnNP, which was structurally and morphologically characterized. Furthermore, extensive in vitro investigations were conducted to assess its anti-tumoral mechanism of action. ZnNP exhibits a remarkable capability to increase intracellular H2O2 within cells. This process leads to the generation of various reactive species, including hydroxyl (˙OH) and superoxide (O2˙−) radicals, and peroxynitrite (ONOO−), which act as apoptotic inducers specifically targeting cancer cells. Cellular uptake studies have shown that ZnNP enters the lysosomes, evades degradation, and takes advantage of their acidic pH environment to significantly increase the production of ROS. These findings are further supported by the activation of multiple oxidative genes. Furthermore, the biocompatibility of ZnNP has been demonstrated in ex vivo models using healthy liver cells. Notably, ZnNP exhibited therapeutic effectiveness in high-grade serous ovarian cancer (HGSOC) patient-derived tumor organoids (PDTO), further confirming its potential as a therapeutic agent. The present study highlights the therapeutic potential of ZnNP as a generator of multiple ROS via a Fenton-like reaction. This research offers a promising therapeutic approach for CDT application in combatting HGSOC, a highly aggressive and life-threatening cancer.
Introduction
CDT is considered one of the most effective therapeutic approaches to eradicate cancer cells with negligible side effects caused by Fenton/Fenton-like reactions.1 In general, this approach employs metal cations (such as Fe2+, Cu2+, Mn2+, and Ag+) to dissociate endogenous hydrogen peroxide (H2O2) and generate toxic radicals including hydroxyl (˙OH) and superoxide (O2˙−) radicals.2 This occurs because tumor cells exhibit higher levels of endogenous H2O2 due to their abnormal metabolic activity. As a result, this approach proves to be more potent in targeting tumor cells without causing significant toxic effects in non-tumoral cells,3 unlike traditional chemotherapeutics.4 Although endogenous H2O2 levels are generally higher in cancer cells, there is a need to integrate additional H2O2 functionality into the nanocatalytic system to enhance effectiveness.5–7 To achieve this goal, many studies have been reported to effectively treat various types of cancer. These reports demonstrate the successful utilization of CDT either individually or in conjunction with other therapeutic approaches such as chemodynamic, photodynamic, sonodynamic, and radiation therapies. The combined utilization of these modalities has shown promising results, leading to favourable clinical outcomes.8–11 Besides, a combination therapy of various inorganic materials has been used such as silver (Ag),12 iron (Fe),13 cobalt (Co),14 palladium (Pd)15 and copper (Cu)16 to achieve CDT. Ions like Fe2+, Mg2+, and Zn2+ exhibit diverse functions within the body. Apart from acting as intracellular messengers, they also contribute to the processes of tumor growth, invasion, and metastasis.17 Interestingly, even a slight increase in Zn-ion concentrations proves beneficial in countering the rise of ROS.18 To evade the antitumor activity, cancer cells potentially suppress the expression of zinc transported proteins. The elevation of Zn2+ levels simultaneously increases the ROS levels and causes damage to the cancer cells. For instance, recently, Li et al. prepared Zn-doped Cu nanoparticles that dissolve Zn2+ and Cu+ ions in the acidic tumor microenvironment to produce ROS species from endogenous H2O2via Fenton-like reactions.19 In another report, Yu et al. prepared ZnO2@Au@ZIF-67 nanoparticles to merge CDT with starvation therapy. This system overcomes the low level of endogenous H2O2 to achieve satisfactory CDT outcomes to generate more toxic ROS species.20 Bu et al., developed ZnO2@PEG NPs to rapidly release Zn ions and H2O2 facilitated by the mild acidity and low catalase activity. This subsequently initiates enhanced Fenton/Fenton-like reactions, utilizing the inherent Fe, to generate hydroxyl radicals. Additionally, the release of Zn ions contributes to an effective therapy.21 However, these systems require complicated synthesis procedures and only produce single ROS to achieve CDT; therefore, there is an utmost need to develop alternative systems that have double metal cations to initiate a Fenton reaction with the potential to produce other toxic compounds like peroxynitrite (ONOO−) as an apoptotic inducer.22ONOO− is an another type of nitrogen based reactive species (RNOS) that acts as an apoptotic inducer. ONOO− is predominantly produced at tumoral sites through the reaction between nitric oxide (NO) and the superoxide anion (O2˙−) and it exhibits a higher concentration at tumoral sites compared to non-tumoral cells.22 In comparison to other free radicals such as NO and ˙OH, these radicals exhibit even higher toxicity, capable of readily causing damage to DNA, proteins, and lipids.23,24 In addition, they possess the ability to destroy the compact extracellular matrices (ECM) found within solid tumors, which frequently impede the effective diffusion of antitumoral drugs.25 Usually, NO delivery system is required to produce ONOO− at tumoral sites. These NO delivery systems encounter similar challenges as conventional delivery systems (need complex synthesis procedures and unnecessary cargo).14,26 Nonetheless, there might exist an alternative system capable of generating ONOO− without relying on external stimulation or delivery-based mechanisms in conjunction with CDT-based systems. Recently, our group demonstrated an alternative system based on Fe2+ and Ag+ metals to enhance CDT efficacy without requiring external stimuli.27,28 However, the potential application of Zn-based materials to enhance CDT without external stimuli and sophisticated synthesis procedures remains unexplored.
In this study, we are proposing biocompatible zinc nitroprusside (ZnNP) as a CDT agent with dual Fenton initiator metal cations (Zn2+ and Fe2+) as well as a peroxynitrite generator. We have successfully synthesized ZnNP by using FDA-approved sodium nitroprusside as a precursor, achieving the desired mixture through a simple procedure in solution. The zinc nitroprusside compound has naturally occurring NO species in its structure with dual metal cations (Zn2+, Fe2+). This system aims to enhance CDT in combination with peroxynitrite-based therapeutic systems. It not only surpasses the existing limitation of complex synthesis procedures but also attains synergistic therapeutic effects simultaneously through multiple ROS species generation. ZnNP exhibits a mixed size distribution (below 500 nm can be seen in SEM and TEM images), which can enhance tissue distribution and biological barrier permeation, often beneficial for in vivo applications as we have already shown in similar materials.27–29 Different in vitro and ex vivo experiments confirmed the results, demonstrating the compatibility of ZnNP in non-tumoral cells while exhibiting significant toxicity towards tumoral cells. Moreover, ZnNP exhibited a higher capacity for decomposing endogenous H2O2. Additionally, ZnNP showed toxicity towards patient-derived tumor organoids (PDTO) while showing biocompatibility towards healthy liver organoids. Therefore, our study proposed a novel approach to enhance the therapeutic efficacy of CDT.
Experimental section
Materials and methods
Zinc(II) chloride (ZnCl2), sodium nitroprusside dihydrate (Na2[Fe(CN)5NO]·2H2O, SNP, ≥99%), and anhydrous methanol (99.8%) were acquired from Sigma-Aldrich, St Louis, MO, USA. A purifying Millipore Milli-Q Biocel A10 water system was used to prepare ultrapure water for the experiments. A2780, A2780cis, SK-OV-3, MCF-7 and ID8 (generously provided by Gustavo Baldassarre, CRO Aviano), MDA-MB-231 (Cell Biolabs, CA, USA), and MRC-5 (ATCC, Manassas, VA, USA) were used. LysoTracker Green DND-26, Hoechst 33342, and rhodamine B were obtained from ThermoFisher Scientific, Waltham, MA, USA. CellTiter-Glo® from Promega, Madison, WI, USA, and PE-Annexin V apoptosis detection kit from Becton-Dickinson, Franklin Lakes, NJ, USA were used. ROS-Glo™ H2O2 luminescence kit bought from Promega, Madison, WI, USA and FluorSave™ reagent (catalog no.: 345789; Millipore: Burlington, MA, USA) were used.Instrumentation
The structures of the ZnNP samples were analyzed using a field-emission scanning electron microscope (FE-SEM, Carl Zeiss Sigma VP, Jena, Germany) and transmission electron microscope (TEM, JEM-2100, JEOL, Tokyo, Japan). An energy-dispersive X-ray spectroscopy (EDS) analyzer (INCAx-sight7421, Oxford Instruments, UK) equipped with the FE-SEM instrument was used to determine the atomic percentage of the elements present in ZnNP. The crystal structure of ZnNP was analysed with an X-ray powder diffractometer (XRD, Philips, X'pert, Netherland) with Cu Kα radiation (λ = 1.5406 Å). A Fourier transform infrared (FTIR) spectrophotometer (MIDAC, M4000, Westfield, MA, USA) was employed to acquire chemical functional groups in ZnNP. The Raman shift was monitored using a Raman spectrophotometer (Horiba Scientific, Xplora Plus, France) operated at 532 nm. X-ray photoelectron spectroscopy (XPS, Thermo Scientific™ K-Alpha, ThermoFisher Scientific, Waltham, MA, USA) was employed to analyze the chemical composition, bonding characteristics and oxidation states of ZnNP. To acquire the optical absorption spectra of the samples, a UV-visible spectrophotometer (UV-VIS-31 Scan, ONDA, Modena, Italy) was employed. To evaluate IC50 values, a Tecan Infinite M1000 (Tecan, Mannedorf, Switzerland) luminescence measurement system was used. AnnexinV was assessed with a BD FACS CantoII instrument (BD Biosciences, San Jose, CA, USA). Fluorescence images were acquired on a Leica DM5500B with an X-Cite 120 PC Q lamp. The chemiluminescent signal was acquired with a chemiluminescent gel imaging system (ChemiDoc™ Touch Imaging System, Bio-Rad, Hercules, CA, USA) and analyzed using Image Lab Software (Bio-Rad).Synthesis of ZnNP
ZnNP was synthesized by mixing 0.2 M ZnCl2 solution (40 mL) with 0.2 M sodium nitroprusside (SNP) solution in methanol (40 mL). Then, the mixed solution was stirred overnight at 70 °C. Following the reaction's completion, the reaction mixture was allowed to cool at room temperature (RT). Afterwards, the precipitates of ZnNP were obtained by centrifuging the mixture at a speed of 12![[thin space (1/6-em)]](https://www.rsc.org/images/entities/char_2009.gif) 000 rpm for 30 minutes. Then they were washed with methanol and dried at 40 °C for 12 h in a vacuum oven. The chemical reaction for the synthesis of ZnNP can be explained by the following straightforward substitution reaction.
000 rpm for 30 minutes. Then they were washed with methanol and dried at 40 °C for 12 h in a vacuum oven. The chemical reaction for the synthesis of ZnNP can be explained by the following straightforward substitution reaction. | ZnCl2 + Na2[Fe(CN)5NO] → Zn[Fe(CN)5NO] + 2NaCl |
Cell culture
The ovarian cancer cell lines (A2780, A2780cis, SK-OV-3) were cultured in RPMI-1640 (Gibco, Waltham, MA, USA) supplemented with penicillin–streptomycin antibiotics (10000 U ml−1, Gibco, Waltham, MA, USA) and 10% fetal bovine serum (Gibco, Waltham, MA, USA). ID8 was cultured in Dulbecco's modified Eagle's medium (DMEM) with 4.5 g L−1 glucose (Gibco, Waltham, MA, USA) supplemented with penicillin–streptomycin antibiotics (10000 U ml−1, Gibco, Waltham, MA, USA), 4% fetal bovine serum (Gibco, Waltham, MA, USA), 1 mM sodium pyruvate (100 mM, Gibco, Waltham, MA, USA), 1 mM sodium bicarbonate (7.5%, Gibco, Waltham, MA, USA), 5 μg mL−1 insulin, 5 μg mL−1 transferrin and 5 ng mL−1 sodium selenite (100× ITS, Sigma-Aldrich St Louis, MO, USA). Breast cancer cell lines (MDA-MB-231 and MCF-7) were cultured in Dulbecco's modified Eagle's medium (DMEM) with 4.5 g L−1 glucose (Gibco, Waltham, MA, USA) supplemented with penicillin–streptomycin antibiotics (10000 U ml−1, Gibco, Waltham, MA, USA) 10% fetal bovine serum (Gibco, Waltham, MA, USA), and 1× MEM non-essential amino acid solution (100×, Gibco, Waltham, MA, USA). Non-tumoral lung fibroblast MRC-5 was cultured in minimum essential medium (MEM) (Gibco, Waltham, MA, USA) supplemented with penicillin–streptomycin antibiotics (10000 U ml−1, Gibco, Waltham, MA, USA) and 10% fetal bovine serum (Gibco, Waltham, MA, USA), 1 mM sodium pyruvate (100 mM, Gibco, Waltham, MA, USA), 1 mM sodium bicarbonate (7.5%, Gibco, Waltham, MA, USA) and 1× MEM non-essential amino acid solution (100×, Gibco, Waltham, MA, USA). Cells were cultured in a CO2 incubator set at 37 °C with 5% CO2 and were passaged every 2–3 days using 0.25% trypsin–EDTA with phenol red (Gibco, Waltham, MA, USA).
In vitro cytotoxicity assay
For cytotoxicity assay, ovarian cancer (A2780, A2780cis, ID8, and SK-OV-3) and breast cancer (MDA-MB-231 and MCF-7) cell lines were seeded in 96-well plates at a density of 1 × 10³ and MRC-5 8 × 10³ cells per well and treated with six different concentrations (0.001, 0.01, 0.1, 1, 10 and 100 μg) of zinc nitroprusside (ZnNP) and its precursors zinc chloride (ZnCl2) and sodium nitroprusside (SNP). Cell viability was assessed after 96 h using the CellTiter-Glo® assay system following the manufacturer's instructions (Promega, Madison, WI, USA). Luminescence was measured on a Tecan M1000 instrument. Experiments were conducted in triplicates and IC50 values were calculated from the non-linear regression method using GraphPad prism 8 software.Flow cytometry assay
A2780 cells were seeded at a density of 2 × 10⁵ in 6-well plates as recommended by the supplier for specified time points. For subsequent treatments, the cells were rinsed with PBS, then collected and labelled with a PE-Annexin V apoptosis detection kit from Becton-Dickinson, Franklin Lakes, NJ, USA. Following labelling, cells were incubated at RT for 15 min in the dark. Afterwards, samples were analyzed using a BD Canto II flow cytometer and BD FACS DIVA software.Intracellular localization
A2780 cells were cultured at a density of 2 × 10⁵ cells per mL in a 6-well plate with a glass coverslip for 24 h. Later, 30 μg ml−1 rhodamine B was used to label 25 μg ml−1 ZnNP to treat cells for 6 and 24 h. Following this, the cells were washed with PBS two times and incubated with 200 nM Lysotracker™Green DND-26 (ThermoFisher Scientific, Waltham, MA, USA) for lysosomes and 200 ng ml−1 Hoechst 33342 for nuclear staining, respectively. Later, 4% paraformaldehyde was utilized to fix cells for 20 minutes, followed by mounting the coverslip using Fluorsave mounting media (Merck Millipore, Burlington, MA, USA) for cellular imaging. The internalization of ZnNP was assessed using a fluorescence microscope with appropriate filters. Images were analysed using ImageJ and JacoP plugins. Correlation was calculated by using ImageJ by selecting cells randomly (i.e., 25 cells).H2O2 level quantification
For H2O2 level quantification, A2780 and ID8 cells were seeded in 96-well plates at a density of 1 × 10⁴ per well and incubated at 37 °C for 24 h. Subsequently, the cells were treated with 50 μg ml−1 ZnNP, ZnCl2, SNP and cisplatin (CisPt) (3 μg ml−1: 10 μM) at two different time points (24 and 48 h). Afterwards, the intracellular ROS H2O2 level was assessed by the ROS-Glo™ H2O2 luminescence assay (Promega, Madison, WI, USA) using a Tecan M1000 instrument following the manufacturer's guidelines.Intracellular peroxynitrite (ONOO−) detection
To determine peroxynitrite levels, A2780 and MRC-5 (4 × 10⁴) cells were plated in 96-well plates and treated with 50 μg ml−1 ZnNP and CisPt (3 μg ml−1: 10 μM) for 24 h. Afterwards, the cells were stained with a DAX-J2 PON Green Cell Meter fluorimetric peroxynitrite assay kit (AAT Bioquest, Sunnyvale, CA, USA) at 37 °C for 2 h in the dark, following the manufacturer's guidelines. After 2 h of staining, ONOO− levels were quantitatively assessed by measuring fluorescence intensity at an excitation/emission wavelength of 490/530 nm, respectively.Cytochrome c release test
A2780 and ID8 cells were cultured on coverslips at a density of 2 × 10⁵ cells per mL, after 24 h the cells were subjected to treatment with ZnNP (50 μg ml−1) and CisPt (3 μg ml−1: 10 μM) for 6, 24 and 48 h. After each time point, cells were fixed using 4% paraformaldehyde for 20 min at RT. Then, the cells were permeabilized using 0.3% Triton X-100/PBS and subsequently blocked with 8% BSA/PBS (1 h, RT). Next, a mouse monoclonal antibody cytochrome c (6H2·B4) antibody (1:100 dilution in 1% BSA/PBS used to stain cells, at 4 °C, overnight) acquired from Cell Signaling Technology (catalog no.: 12963; Danvers, MA, USA) was utilized, followed by secondary antibody staining (1:1000 dilution, Alexa Fluor® 488 dye) for 2 h at room temperature. To stain the nucleus, cells were stained with DAPI at a concentration of 1 mg mL−1 (diluted 1:10000 in PBS, RT, 1 min) and then rinsed with PBS three times. Subsequently, coverslips were mounted with FluorSave™ reagent (catalog no.: 345789; Millipore: Burlington, MA, USA) and images were obtained using a Leica DM5500B fluorescence microscope with an X-Cite 120 PC Q lamp and analysed using ImageJ software.
Western blot assay
A2780 and ID8 cell lines were harvested and lysed using the radioimmunoprecipitation (RIPA) buffer containing protease (Complete Cocktail, Roche, Basel, Switzerland) and phosphatase (sodium fluoride (5 mM) and sodium orthovanadate (2 mM)) inhibitors through vigorous sonication in an ice bath. The Bradford protein assay was employed to quantify the protein concentration. 20 μg proteins were subjected to SDS-PAGE and subsequently transferred onto a nitrocellulose membrane. Following the transfer, the membranes were blocked using 5% (wt/vol) non-fat milk for 20 min at RT. Subsequently, the membranes were washed with Tris-buffered saline with Tween-20 (TBST) and incubated with primary antibodies overnight. The primary antibodies used included: anti-HO-1 (catalog no.: 10701-1-AP, dilution 1:1000, ProteinTech Group, Planegg-Martinsried, Germany), Vinculin (catalog no.: sc7649, dilution 1:5000, Santa Cruz Biotechnology, Dallas, TX, USA), and then incubated with horseradish peroxidase-conjugated secondary antibodies (goat anti-rabbit immunoglobulin G, catalog no.: 31462, ThermoFisher Scientific, Waltham, MA, USA), (goat anti-mouse immunoglobulin G, catalog no.: 31432, ThermoFisher Scientific, Waltham, MA, USA), (mouse anti-goat immunoglobulin G, catalog no.: 31400, ThermoFisher Scientific, Waltham, MA, USA) at 1:10000 dilutions. The signals from the immunoblot were generated utilizing a Liteablot chemiluminescent substrate kit (catalog no.: EMP013001, Euroclone, Milan, Italy). The chemiluminescent signal was detected using a chemiluminescent gel imaging system (ChemiDoc™ Touch Imaging System, Bio-Rad, Hercules, CA, USA) and examined with Image Lab Software (Bio-Rad).
Organoid isolation and subculture
Mouse liver organoids were cultured from 8-week-old C57/BL6 using the protocol outlined by Stappenbeck et al.30,31 Organoids were produced from mouse liver post-mortem. All animal procedures were performed in accordance with the Guidelines for Care and Use of Laboratory Animals of “National Cancer Institute of Aviano” and approved by the Animal Ethics Committee of Italian Ministry of Health, 148/2016-PR. Briefly, liver tissues were digested with 2 mg ml−1 collagenase for 30 minutes, centrifuged at 1500 rpm for 5 minutes, and the resulting pellet was then resuspended in Cultrex growth factor-reduced basement membrane extract (BME), type 2 (R&D systems catalog no.: 3533-001-02, Milan, Italy) and cultured in 24 well plates. Following hydrogel solidification, 450 μl of organoid medium was added. Patient-derived tumour organoids (PDTO) were acquired from ovarian cancer patients. Tissues were processed and cultured according to the protocol outlined by Scattolin et al.32 For research purposes, informed consent for the biobank sample collection was obtained at Aviano's National Cancer Institute (CRO).Toxicity test on mouse liver organoids and PDTO
Organoids were seeded in a 96-well plate to assess the toxicity and treated with ZnNP, ZnCl2, and SNP ranging from 100 μg ml−1 to 0.034 μg ml−1 for 96 h. As a positive control, we used CisPt in concentrations from 30 μg ml−1 (100 μM) to 0.009 μg ml−1 (0.03 μM). After 96 h, organoid viability was assessed using the CellTiter-Glo® 3D luminescence assay (Promega, Madison, WI, USA) with a Tecan M1000 instrument (Tecan, Mannedorf, Switzerland).Histopathological analysis of HGSOC PDTO
For histopathological analysis, formalin-fixed paraffin-embedded sections of tumour organoids were used. After culture, organoids were collected and fixed in 10% phosphate-buffered formalin before being embedded in paraffin using the Micro NextGen Cell Blocking™ kit (cat no.: M20; AV Bioinnovation) according to the manufacturer's instructions. By using a Leica ST5020 multistainer, 5 μm sections were stained with hematoxylin and eosin (H&E) and 2 μm sections were cut for immunohistochemistry (IHC) staining. Antigen retrieval was performed using the heat induction protocol and UltraVision LP detection system HRP DAB kit (ThermoFisher Scientific, Waltham, MA, USA) was employed to conduct IHC. The following antibodies were used to characterize PDTO and parental tumours: PAX8 (catalog no.: 10336-1-AP, dilution 1:400, ProteinTech Group, Planegg-Martinsried, Germany), CA125 (catalog no.: sc-52095, dilution 1:100, Santa Cruz Biotechnology, Dallas, TX, USA) and WT1 (catalog no.: ab89901, dilution 1:300, Abcam, Cambridge, UK). Immunohistochemistry images were obtained using a light microscope with different magnifications.
Statistical analysis
The data presented here represent the average values from two independent experiments, each conducted in triplicate. Statistical analysis was performed using a two-tailed t-test with GraphPad Prism 8 software, and a p-value of <0.05 was considered significant.Results and discussion
Structural analysis
XRD was employed to confirm the successful synthesis of ZnNP and its crystal phase. It is well known that ZnNP can form a hexagonal trihydrate phase and an orthorhombic dihydrate phase with the space group of![[R with combining macron]](https://www.rsc.org/images/entities/i_char_0052_0304.gif) 3 and Pnma, respectively.33 The XRD pattern of our synthesized ZnNP well matched with the simulated XRD pattern of the orthorhombic (Pnma) dihydrate phase (Fig. 1a).34,35 The high-intensity major peaks of ZnNP located at 2θ = 17.0°, 17.50°, 19.57°, 23.80°, 32.20°, and 36.65° can be ascribed to the hkl reflections of the (002), (210), (211), (020), (321), and (421) planes, respectively, of the orthorhombic crystal system (Fig. 1b), in agreement with the literature.34,35 The sharp and intense XRD peaks and the non-appearance of the additional peak show the purity and high crystallinity of the as-synthesized ZnNP.
3 and Pnma, respectively.33 The XRD pattern of our synthesized ZnNP well matched with the simulated XRD pattern of the orthorhombic (Pnma) dihydrate phase (Fig. 1a).34,35 The high-intensity major peaks of ZnNP located at 2θ = 17.0°, 17.50°, 19.57°, 23.80°, 32.20°, and 36.65° can be ascribed to the hkl reflections of the (002), (210), (211), (020), (321), and (421) planes, respectively, of the orthorhombic crystal system (Fig. 1b), in agreement with the literature.34,35 The sharp and intense XRD peaks and the non-appearance of the additional peak show the purity and high crystallinity of the as-synthesized ZnNP.
 | ||
| Fig. 1 (a) XRD pattern of as-synthesized ZnNP together with the simulated XRD pattern. (b) The crystal structure of ZnNP. (c) Raman and (d) FTIR spectra of ZnNP. (e–i) High-resolution XPS spectra of Zn 2p, Fe 2p, O 1s, C 1s, and N 1s, respectively (the line and the shaded area indicate the experimental and fitted data, respectively). | ||
The crystallinity and the compositions of the ZnNP were analyzed further with Raman spectroscopic measurement, and the corresponding Raman spectrum is shown in Fig. 1c. The isolated Raman bands of the CN group appear in the range of 2000–2250 cm−1. In particular, the sharp and high-intensity band at 2205 cm−1 can be ascribed to the stretching vibration of the CN group, as similarly observed for ZnNP and other nitroprussides.35,36 The isolated Raman bands of NO and CN groups were observed between 200 and 700 cm−1. The peaks at 250, 495, and 656 cm−1 can be attributed to the Fe–C–N–Fe bands, whereas the peak at 656 cm−1 can also be assigned to the Fe-NO vibration band, consistent with the reported literature.35,36Fig. 1d displays the FTIR spectrum of ZnNP, which revealed the presence of strong NO and CN vibrations at 1960 cm−1 and 2185 cm−1, respectively. The further strong absorption band in the range of 3000–3200 cm−1 and at 1609 cm−1 can be assigned to the O–H stretching band and deformational scissor vibrations of water (H–O–H), respectively, originating from the crystalline water in ZnNP.35,36
XPS was used to analyze the chemical functional groups and oxidation states of elements in ZnNP. Fig. S1† shows the survey XPS spectra of ZnNP, which revealed the presence of peaks of all the elements (Zn 2p, Fe 2p, C 1s, N 1s, and O 1s) in ZnNP with their corresponding binding energies.36,37Fig. 1(e–i) shows the experimental and fitted high-resolution XPS spectra of Zn 2p, Fe 2p, O 1s, C 1s, and N 1s, respectively, in ZnNP. The deconvoluted core-level Zn 2p spectrum showed spin–orbital doublet peaks of Zn 2p3/2 and Zn 2p1/2 at 1021 and 1044 eV, respectively, without any additional peaks. The 23 eV binding energy separation between these peaks suggests the +2 oxidation state of Zn in ZnNP, consistent with the reported literature.37,38 The deconvoluted core-level Fe 2p spectrum showed spin–orbit doublet peaks of Fe 2p3/2 and Fe 2p1/2 with low and high spin. The high-intensity low spin Fe 2p3/2 and Fe 2p1/2 peaks were positioned at 710.10 and 723.0 eV, respectively, which originated from the Fe2+ species in ZnNP.36,39 The low-intensity high spin Fe 2p3/2 and Fe 2p1/2 peaks were located at 707.70 and 720.50 eV, respectively. The presence of these high spin peaks can be attributed to the partial degradation of ZnNP caused by the high-energy X-ray beam through XPS measurement, which possibly altered the Fe–CN bonds in ZnNP to Fe–NC.36,39 This partial degradation of ZnNP can be further validated by the appearance of a low-intensity satellite peak at 715.15 eV. The additional Fe 2p peak at 712.0 can be ascribed to the presence of [Fe(CN)5NO], well-matched with the observations for other nitroprusside samples.33 The deconvoluted O 1s spectra showed two peaks at 530.60 and 532.20 eV, which can be assigned to the NO and crystalline H2O peaks in ZnNP.36 A single CN peak at 284.90 eV was observed in the core-level C 1s spectrum, while the fitted N 1s spectrum exhibited CN and NO peaks at 397.60 and 400.50 eV, respectively. These binding energy values for O 1s, C 1s, and N 1s chemical species in ZnNP are well-matched with the reported binding energy values similar to other reported nitroprussides.33,36,39
Morphological analysis
Fig. 2a and b show the FE-SEM images of ZnNP with low and high magnification, respectively. The images revealed the formation of rhombohedral and rectangular shape ZnNP with varying size ranges. This morphology of ZnNP was further analysed by TEM measurements (Fig. 2c and d), which well matched with the FE-SEM images. Fig. 2e shows the EDS spectra of ZnNP, which showed the presence of characteristic Zn, Fe, C, N, and O elemental peaks with their corresponding weight (%) of 27.83, 25.25, 22.57, 20.27, and 4.07%, respectively. | ||
| Fig. 2 (a and b) FE-SEM images, (c and d) HR-TEM images, and (e) EDS spectra of ZnNP (inset table shows the elemental weight (%) and atomic (%)). | ||
In vitro antitumor efficacy of ZnNP
The antitumor efficacy of ZnNP was evaluated on various tumoral cell lines (A2780, A2780cis, ID8, SK-OV-3, MDA-MB-231 and MCF-7) and non-tumoral human fibroblast cells (MRC-5) following 96 h of treatment. The IC50 values of ZnNP against tumoral cell lines are in the range from 0.001 to 3.9 μg ml−1, which were lower compared to its precursor ZnCl2 (0.009–>200 μg ml−1). In comparison to CisPt on cancer cells, ZnNP has higher potency within the range of 0.5–4067 fold, while ZnNP toxicity on non-tumoral human fibroblast cells is 0.2-fold as shown in Fig. 3(a–f). This result suggests that ZnNP might release Zn2+ ions within the cells, which cause ROS species production such as H2O2 and induce toxicity. The plausible reaction mechanism for H2O2 production in the cellular environment induced by ZnNP is summarized in Table S1† and the complete IC50 data are presented in Table S2.† Our results demonstrate that ZnNP has antitumor activity against all cancer cell lines, although it exerts a negligible effect on non-tumoral cells. | ||
| Fig. 3 Evaluation of cytotoxicity. (a–f) IC50 values of ZnNP toward non-tumoral and tumoral cells. Values are expressed as μg ml−1. (g) Apoptosis analysis. A2780 cells were analyzed by FACS using Annexin V/7AAD double staining after 6, 24 and 48 h treatment of ZnNP (50 μg ml−1) and CisPt (3 μg ml−1; 10 μM) (Q3: viable cells, Q4: early apoptosis, Q2: late apoptosis, Q1: necrosis). Groups were considered statistically significant if p < 0.05 (*), p < 0.01 (**) and, non-significant (ns). Error bars indicate SD. | ||
Annexin V/7AAD assay was conducted to confirm the extent and mode of cell death caused by ZnNP, after the treatment with ZnNP, ZnCl2 (50 μg ml−1) and CisPt (3 μg ml−1; 10 μM) of A2780 cell line for 6, 24 and 48 h.
Our results indicate that ZnNP treatment induces apoptosis, with the extent increasing over time, as demonstrated in Fig. 3g. ZnNP induces 0.9% early and 1.9% late apoptosis after 6 h of treatment. After 24 h, apoptosis rates increase to 3.1% early and 65% late apoptosis. Furthermore, after 48 h, ZnNP leads to 9.7% early and 87% late apoptosis, which is higher compared to untreated and CisPt groups as depicted in Fig. 3g and Fig. S2b.† The apoptosis in precursor groups is shown in Fig. S2a and c.†
Intracellular uptake of ZnNP
To determine the intercellular uptake of ZnNP inside the lysosomes, we incubated A2780 cells with ZnNP for 6 and 24 h at 37 °C (rhodamine labelled, red), lysosomes were stained with LysotrackerTM Green DND-26 (green) and the nucleus was stained with Hoechst 33342 (blue). As shown in Fig. 4a, ZnNP internalized even after 6 h of treatment. Pearson's correlation coefficient (R) was used to evaluate the ZnNP internalization inside the lysosomes. Notably, the “R” value after 24 h was 0.7 in A2780. These results suggest that ZnNP is moderately localized in lysosomes and has the potential to be redistributed in the cytoplasm, thereby evading degradation caused by the acidic pH of lysosomes, which can induce ROS production.27,28 Therefore, we will proceed to assess the mechanism of cell death by examining oxidative stress by measuring ROS production. | ||
| Fig. 4 (a) Lysotracker analysis of ZnNP for investigating cellular internalization. Fluorescence microscopy images of a rhodamine-labeled 25 μg ml−1 ZnNP in the A2780 ovarian cancer cell line after 6 and 24 h. Negative control (only nuclei and lysosome staining, rhodamine) was used to set up the fluorescence intensity and avoid the background signal. Bar, 10 mm. (b–d) Relative H2O2 level measurement. (b) A2780, (c) ID8, and (d) MRC-5 cells incubated with ZnNP (50 μg ml−1) and CisPt (3 μg ml−1; 10 μM) for 6, 24 and 48 h. p < 0.05 (*), p < 0.01 (**) and, non-significant (ns). (e) A2780, relative ONOO− level measurement after 24 h treatment of 50 μg ml−1 ZnNP. Error bars represent the SEM. Data presented are from two independent experiments, each with three replicates. | ||
ZnNP induces ROS production
After the internalization study, we evaluated the ROS production induced by ZnNP. A2780, ID8 and MRC-5 were incubated for 24 and 48 h with ZnNP (50 μg ml−1) and CisPt (3 μg ml−1; 10 μM). As shown in Fig. 4b–d, H2O2 levels are higher in the ZnNP treated group in comparison to the control group.40–42 In A2780, H2O2 levels increased ∼7.2-fold after 24 h while decreased to ∼2.3-fold after 48 h of ZnNP treatment compared to the control probably due to the antioxidant activity43 and further intracellular ROS production (Fig. 4b), while in the ID8 cell line, ZnNP treatment caused ∼2.0-fold increase in ROS production after 24 and 48 h of treatment (Fig. 4c). Comparatively, in fibroblasts the H2O2 level is lower than cancerous cell lines which suggests the good biocompatibility of ZnNP. Altogether, these results suggest that ZnNP produces ROS species consistent with previous findings.27,28,41,42Among reactive oxygen species, ONOO− is an another type of RNS, which is generated following the interaction of NO with superoxide anions mainly in cancer cells.22 To produce ONOO−, a NO based therapeutic system is used to induce oxidative stress and cell death.44 Therefore, the DAX-J2 PON Green probe was utilized to assess the ONOO− levels in A2780 and MRC-5 cell lines after 24 h of ZnNP treatment and fluorescence intensity was quantified using a microplate reader. As demonstrated in Fig. 4e, after 24 h of exposure, a ∼1.4-fold increase in ONOO− levels was observed in A2780 cells compared to the control. In MRC-5 cells, ONOO− levels showed a ∼1.1-fold increase after exposure to ZnNP compared to the non-treated group.
Cytochrome c release after ZnNP treatment
Next, we assessed cytochrome c release following ROS production.45 A2780 and ID8 cell lines were incubated with ZnNP (50 μg ml−1) and CisPt (3 μg ml−1; 10 μM) for 6, 24, and 48 h. The results were then compared to those of untreated and CisPt treated cells, as shown in Fig. 5a and b. After 24 h of ZnNP treatment, there is a noticeable release of cyt c compared to both CisPt treated and untreated cells. These results indicate that following ROS generation, cytochrome c is released into the cytoplasm, which induces apoptosis and leads to cell death. Additionally, to explore the oxidative stress we carried out western blot analyses.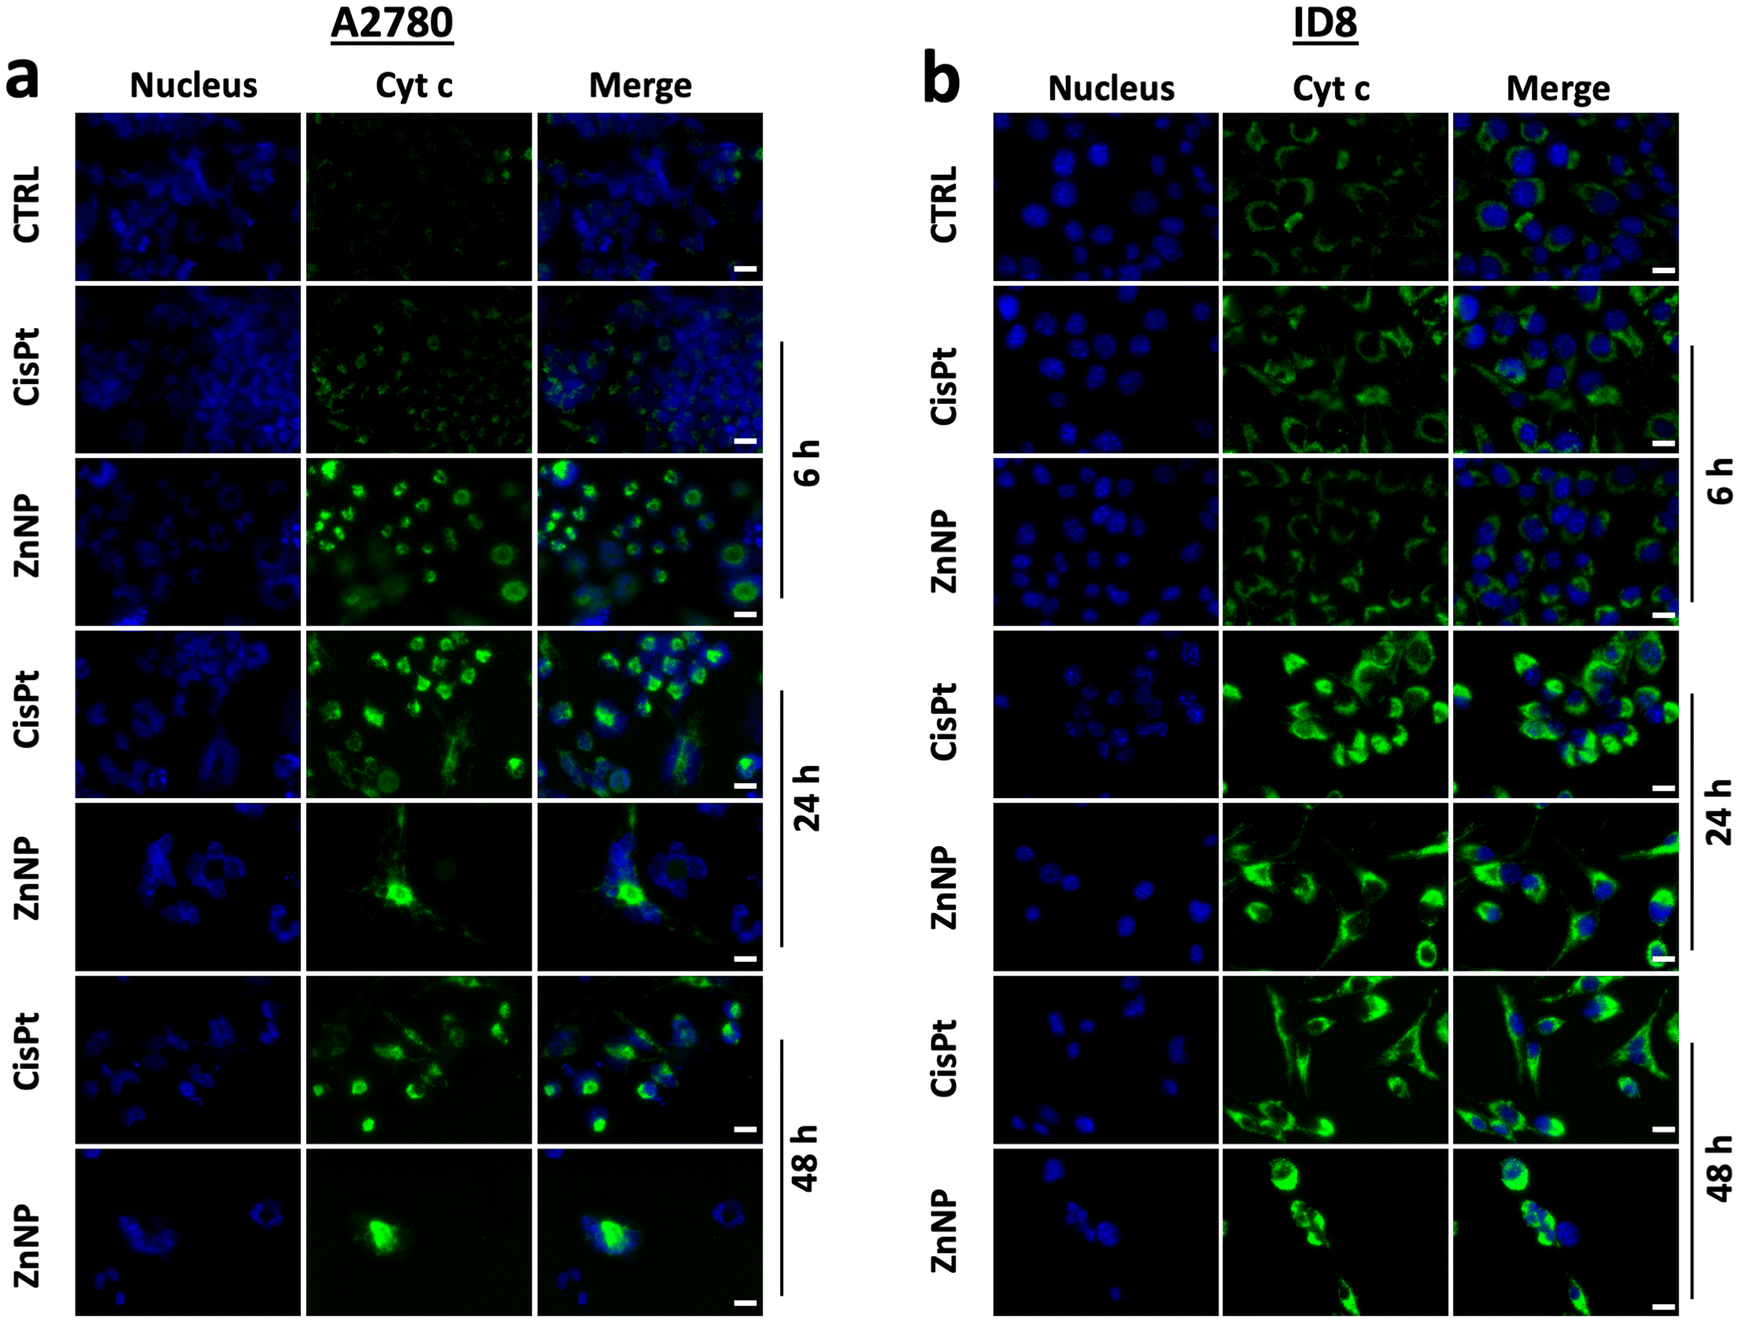 | ||
| Fig. 5 (a and b) Immunofluorescence analysis of cytochrome c release. (a) A2780 and (b) ID8 incubated with ZnNP (50 μg ml−1) and CisPt (3 μg ml−1; 10 μM) for 6, 24 and 48 h. | ||
Western blot analysis
To further investigate the oxidative stress induced by ZnNP, we employed western blot analyses to check the effect of ZnNP on different oxidative genes.46,47 In non-tumoral cells, HO-1 expression is suppressed by Keap1, which binds to NRF2 and thereby impairs its activation. In contrast, when ROS are generated within cells, NRF2 is released from Keap1 and it activates the antioxidant gene HO-1.48,49 In our results, the expression of HO-1 was significantly higher in cells after ZnNP treatment compared to untreated control cells (Fig. 6a, b and Fig. S3†). Our results are in agreement with a previous report, which demonstrated the activation of HO-1 after zinc nanoparticle treatment.46 Overall, higher expression of antioxidant proteins in cells after ZnNP treatment suggests the significant role of oxidative stress in apoptosis. | ||
| Fig. 6 (a and b) Western blot analysis of oxidative genes. (a) A2780 and (b) ID8 cells were incubated with ZnNP, ZnCl2, SNP (25 μg ml−1), and CisPt (3 μg ml−1; 10 μM) for 24 h. (c–f) Cytotoxicity of ZnNP, ZnCl2, SNP and CisPt on healthy liver and PDTOs obtained from HGSOC patients (Pat A–C). Error bars represent the standard error of the mean (SEM). Groups were considered statistically significant if p < 0.05 (*), p < 0.01 (**) or non-significant (ns). (g) Hematoxylin & eosin staining and immunohistochemistry (PAT A–C). CA-125 (cancer antigen 125), WT1 (Wilms’ tumor 1) and PAX8 (paired box gene 8) are markers of ovarian cancer (all images 40×, bar = 50 μm). | ||
ZnNP antitumor activity on patient derived tumor organoids
To investigate the biocompatibility of ZnNP, we utilized healthy liver organoids.27,28,30 The IC50 value of ZnNP (21.7 ± 3.5 μg ml−1) is higher compared to that of CisPt (4.1 ± 0.8 μg ml−1) (Fig. 6c and Table S3†). This indicates that ZnNP demonstrates superior biocompatibility when compared to its precursors and CisPt.Afterwards, we investigated the toxicity of ZnNP on HGSOC PDTO, the most prevalent type of ovarian cancer with an 5-year overall survival rate of less than 30%.50,51 Patient-derived tumor organoids serve as a valuable ex vivo tool for assessing the effectiveness of therapeutic drugs,32,52,53 as they closely mimic the patient's response in a clinical setting, compared to the xenografts.54 In order to mimic the treatment option, we generated organoids from HGSOC patients to evaluate the therapeutic efficacy of ZnNP. Organoids have demonstrated the potential to anticipate drug response in human patients diagnosed with ovarian cancer.54,55 The IC50 values are in the range between 0.6 and 9.8 μg ml−1 (Table S3†). Immunohistochemistry analysis was performed to examine the molecular similarity between organoids and the parental tumor. Immunopositivity was found for ovarian cancer markers including CA125 (cancer antigen 125), WT1 (Wilms tumor 1) and PAX8 (paired box gene 8) (Fig. 6g).
Conclusions
In summary, we developed a therapeutic nanosystem (ZnNP) that effectively generates ROS via the Fenton reaction, demonstrating significant potential for cancer therapy. Our findings confirm that ZnNP produces H2O2, leading to elevated hydroxyl radical levels within cancer cells, particularly in the acidic lysosomal environment, resulting in enhanced tumor cell eradication. FACS and cytochrome c release assays showed a time-dependent increase in apoptosis, while cell internalization studies indicated that ZnNP escapes lysosomal degradation and localizes in the cytoplasm. Notably, ZnNP exhibited minimal toxicity to healthy liver organoids while maintaining strong therapeutic efficacy against ovarian cancer organoids. These observations emphasize the potential of ZnNP for prospective therapeutic applications.Author contributions
K. A. and M. A. were involved in the conceptualization, experimental data and writing; M. d. M. R. and I. C. participated in the data analysis and review & editing; V. C. contributed to the biological samples, review & editing, and funding acquisition; F. R. participated in the data analysis and review & editing. All authors reviewed and approved the final manuscript.Data availability
The data supporting the findings of this study are available in the paper, ESI,† and can be obtained from the corresponding authors upon reasonable request. Data sources are provided in this paper.Conflicts of interest
The authors have no conflicts of interest to disclose.Acknowledgements
This research was funded by the Ministry of Health, Ricerca Corrente.References
- Z. Tang, Y. Liu, M. He and W. Bu, Angew. Chem., Int. Ed., 2019, 58, 946–956 CrossRef CAS PubMed.
- X. Wang, X. Zhong, Z. Liu and L. Cheng, Nano Today, 2020, 35, 100946 CrossRef CAS.
- Y. Kuang, K. Balakrishnan, V. Gandhi and X. Peng, J. Am. Chem. Soc., 2011, 133, 19278–19281 CrossRef CAS PubMed.
- M. Aghazadeh Tabrizi, P. G. Baraldi, S. Baraldi, E. Ruggiero, L. De Stefano, F. Rizzolio, L. Di Cesare Mannelli, C. Ghelardini, A. Chicca, M. Lapillo, J. Gertsch, C. Manera, M. Macchia, A. Martinelli, C. Granchi, F. Minutolo and T. Tuccinardi, J. Med. Chem., 2018, 61, 1340–1354 CrossRef CAS PubMed.
- L. Sen Lin, T. Huang, J. Song, X. Y. Ou, Z. Wang, H. Deng, R. Tian, Y. Liu, J. F. Wang, Y. Liu, G. Yu, Z. Zhou, S. Wang, G. Niu, H. H. Yang and X. Chen, J. Am. Chem. Soc., 2019, 141, 9937–9945 CrossRef PubMed.
- S. Gao, Y. Jin, K. Ge, Z. Li, H. Liu, X. Dai, Y. Zhang, S. Chen, X. Liang and J. Zhang, Adv. Sci., 2019, 6, 1902137 CrossRef CAS PubMed.
- P. Ma, H. Xiao, C. Yu, J. Liu, Z. Cheng, H. Song, X. Zhang, C. Li, J. Wang, Z. Gu and J. Lin, Nano Lett., 2017, 17, 928–937 CrossRef CAS PubMed.
- D. W. Zheng, Q. Lei, J. Y. Zhu, J. X. Fan, C. X. Li, C. Li, Z. Xu, S. X. Cheng and X. Z. Zhang, Nano Lett., 2017, 17, 284–291 CrossRef CAS PubMed.
- B. Ma, S. Wang, F. Liu, S. Zhang, J. Duan, Z. Li, Y. Kong, Y. Sang, H. Liu, W. Bu and L. Li, J. Am. Chem. Soc., 2019, 141, 849–857 CrossRef CAS PubMed.
- G. Chen, Y. Yang, Q. Xu, M. Ling, H. Lin, W. Ma, R. Sun, Y. Xu, X. Liu, N. Li, Z. Yu and M. Yu, Nano Lett., 2020, 20, 8141–8150 CrossRef CAS.
- Z. Shi, J. Tang, C. Lin, T. Chen, F. Zhang, Y. Huang, P. Luan, Z. Xin, Q. Li and L. Mei, Drug Delivery, 2022, 29, 624–636 CrossRef CAS PubMed.
- Y. Su, X. Zhang, G. Ren, Z. Zhang, Y. Liang, S. Wu and J. Shen, Chem. Eng. J., 2020, 400, 125949 CrossRef CAS.
- H. Zhang, Q. Chen, X. Zhang, X. Zhu, J. Chen, H. Zhang, L. Hou and Z. Zhang, ACS Appl. Mater. Interfaces, 2016, 8, 33484–33498 CrossRef CAS PubMed.
- M. Adeel, S. Parisi, M. Mauceri, K. Asif, M. Bartoletti, F. Puglisi, I. Caligiuri, M. M. Rahman, V. Canzonieri and F. Rizzolio, ACS Omega, 2021, 6, 28611–28619 CrossRef CAS PubMed.
- J. Wu, M. Wang, Y. Pan, Y. Pang, Y. Tang, C. Song, J. Zhu, X. Zhang and Q. Huang, RSC Adv., 2022, 12, 23786–23795 RSC.
- L. H. Fu, Y. Wan, C. Qi, J. He, C. Li, C. Yang, H. Xu, J. Lin and P. Huang, Adv. Mater., 2021, 33, 2006892 CrossRef CAS PubMed.
- Y. Liu, M. Zhang and W. Bu, View, 2020, 1, e18 CrossRef.
- S. Choi, X. Liu and Z. Pan, Acta Pharmacol. Sin., 2018, 39, 1120–1132 CrossRef CAS PubMed.
- Z. Z. Dong, C. Yang, Z. Wang, Z. Zhong, M. S. Wong and H. W. Li, Smart Mater. Med., 2023, 4, 286–293 CrossRef.
- M. Xu, Y. Liu, W. Luo, F. Tan, D. Dong, W. Li, L. G. Wang and Q. Yu, J. Colloid Interface Sci., 2023, 630, 804–816 CrossRef CAS PubMed.
- Z. Tang, S. Wu, P. Zhao, H. Wang, D. Ni, H. Li, X. Jiang, Y. Wu, Y. Meng, Z. Yao, W. Cai and W. Bu, Adv. Sci., 2022, 9, 2201232 CrossRef PubMed.
- S. Heigold, C. Sers, W. Bechtel, B. Ivanovas, R. Schäfer and G. Bauer, Carcinogenesis, 2002, 23, 929–941 CrossRef CAS PubMed.
- R. Radi, J. S. Beckman, K. M. Bush and B. A. Freeman, Arch. Biochem. Biophys., 1991, 288, 481–487 CrossRef CAS PubMed.
- Z. Du, X. Zhang, Z. Guo, J. Xie, X. Dong, S. Zhu, J. Du, Z. Gu and Y. Zhao, Adv. Mater., 2018, 30, 1804046 CrossRef PubMed.
- Y. Chen, Z. H. Li, P. Pan, R. Y. Zeng and X. Z. Zhang, ACS Nano, 2021, 15, 11514–11525 CrossRef CAS PubMed.
- M. Adeel, F. Duzagac, V. Canzonieri and F. Rizzolio, ACS Appl. Nano Mater., 2020, 3, 4962–4971 CrossRef CAS.
- K. Asif, M. Adeel, M. M. Rahman, I. Caligiuri, T. Perin, M. Cemazar, V. Canzonieri and F. Rizzolio, J. Mater. Chem. B, 2023, 11, 3124–3135 RSC.
- K. Asif, M. Adeel, M. M. Rahman, A. A. Sfriso, M. Bartoletti, V. Canzonieri, F. Rizzolio and I. Caligiuri, J. Adv. Res., 2024, 56, 43–56 CrossRef CAS PubMed.
- K. Asif, M. Adeel, M. Mahbubur Rahman, M. Bartoletti, S. K. Brezar, M. Cemazar, V. Canzonieri, F. Rizzolio and I. Caligiuri, Biomed. Pharmacother., 2024, 171, 116017 CrossRef CAS PubMed.
- S. Palazzolo, M. Hadla, C. R. Spena, I. Caligiuri, R. Rotondo, M. Adeel, V. Kumar, G. Corona, V. Canzonieri, G. Toffoli and F. Rizzolio, Cancers, 2019, 11, 1997 CrossRef CAS PubMed.
- H. Miyoshi and T. S. Stappenbeck, Nat. Protoc., 2013, 8, 2471–2482 CrossRef CAS PubMed.
- T. Scattolin, E. Bortolamiol, F. Visentin, S. Palazzolo, I. Caligiuri, T. Perin, V. Canzonieri, N. Demitri, F. Rizzolio and A. Togni, Chem. – Eur. J., 2020, 26, 11868–11876 CrossRef CAS PubMed.
- L. Reguera, Y. Avila and E. Reguera, Coord. Chem. Rev., 2021, 434, 213764 CrossRef CAS.
- E. Reguera, A. Dago, A. Gómez and J. F. Bertrán, Polyhedron, 1996, 15, 3139–3145 CrossRef CAS.
- A. Djebli, A. Boudjemaa, H. Bendjeffal, H. Mamine, T. Metidji, H. Bekakria and Y. Bouhedja, Inorg. Nano-Met. Chem., 2020, 50, 1115–1122 CrossRef CAS.
- M. Mahbubur Rahman, Materials, 2021, 14, 6563 CrossRef CAS PubMed.
- M. Claros, M. Setka, Y. P. Jimenez and S. Vallejos, Nanomaterials, 2020, 10, 471 CrossRef CAS PubMed.
- Q. Li, X. Ma, H. Liu, Z. Chen, H. Chen and S. Chu, ACS Appl. Mater. Interfaces, 2017, 9, 18836–18844 CrossRef CAS PubMed.
- A. Cano, J. Rodríguez-Hernández, A. Shchukarev and E. Reguera, J. Solid State Chem., 2019, 273, 1–10 CrossRef CAS.
- N. Padmavathy and R. Vijayaraghavan, Sci. Technol. Adv. Mater., 2008, 9, 35004–35011 CrossRef PubMed.
- C. Wang, X. Hu, Y. Gao and Y. Ji, BioMed Res. Int., 2015, 2015, 423287 Search PubMed.
- V. Sharma, D. Anderson and A. Dhawan, Apoptosis, 2012, 17, 852–870 CrossRef CAS PubMed.
- J. W. Rasmussen, E. Martinez, P. Louka and D. G. Wingett, Expert Opin. Drug Delivery, 2010, 7, 1063–1077 CrossRef CAS PubMed.
- Z. Luo, Q. Zhao, J. Liu, J. Liao, R. Peng, Y. Xi and Z. Diwu, Anal. Biochem., 2017, 520, 44–48 CrossRef CAS PubMed.
- A. Matapurkar and Y. Lazebnik, Cell Death Differ., 2006, 13, 2062–2067 CrossRef CAS PubMed.
- Z. Yan, W. Wang, Y. Wu, W. Wang, B. Li, N. Liang and W. Wu, Int. J. Nanomed., 2017, 12, 4433–4442 CrossRef CAS PubMed.
- M. Ahamed, M. J. Akhtar, M. Raja, I. Ahmad, M. K. J. Siddiqui, M. S. AlSalhi and S. A. Alrokayan, Nanomedicine, 2011, 7, 904–913 CrossRef CAS PubMed.
- L. Xiong, J. Xie, C. Song, J. Liu, J. Zheng, C. Liu, X. Zhang, P. Li and F. Wang, J. Evidence-Based Complementary Altern. Med., 2015, 2015, 187265 Search PubMed.
- C. Song, H. Heping, Y. Shen, S. Jin, D. Li, A. Zhang, X. Ren, K. Wang, L. Zhang, J. Wang and D. Shi, Chemosphere, 2020, 244, 125495 CrossRef CAS PubMed.
- D. D. Bowtell, S. Böhm, A. A. Ahmed, P. J. Aspuria, R. C. Bast, V. Beral, J. S. Berek, M. J. Birrer, S. Blagden, M. A. Bookman, J. D. Brenton, K. B. Chiappinelli, F. C. Martins, G. Coukos, R. Drapkin, R. Edmondson, C. Fotopoulou, H. Gabra, J. Galon, C. Gourley, V. Heong, D. G. Huntsman, M. Iwanicki, B. Y. Karlan, A. Kaye, E. Lengyel, D. A. Levine, K. H. Lu, I. A. McNeish, U. Menon, S. A. Narod, B. H. Nelson, K. P. Nephew, P. Pharoah, D. J. Powell, P. Ramos, I. L. Romero, C. L. Scott, A. K. Sood, E. A. Stronach and F. R. Balkwill, Nat. Rev. Cancer, 2015, 15, 668–679 CrossRef CAS PubMed.
- M. Govindarajan, C. Wohlmuth, M. Waas, M. Q. Bernardini and T. Kislinger, J. Hematol. Oncol., 2020, 13, 1–20 CrossRef PubMed.
- T. Scattolin, I. Pessotto, E. Cavarzerani, V. Canzonieri, L. Orian, N. Demitri, C. Schmidt, A. Casini, E. Bortolamiol, F. Visentin, F. Rizzolio and S. P. Nolan, Eur. J. Inorg. Chem., 2022, 2022, e202200103 CrossRef CAS.
- J. Kim, B. K. Koo and J. A. Knoblich, Nat. Rev. Mol. Cell Biol., 2020, 21, 571–584 CrossRef CAS PubMed.
- O. Kopper, C. J. de Witte, K. Lõhmussaar, J. E. Valle-Inclan, N. Hami, L. Kester, A. V. Balgobind, J. Korving, N. Proost, H. Begthel, L. M. van Wijk, S. A. Revilla, R. Theeuwsen, M. van de Ven, M. J. van Roosmalen, B. Ponsioen, V. W. H. Ho, B. G. Neel, T. Bosse, K. N. Gaarenstroom, H. Vrieling, M. P. G. Vreeswijk, P. J. van Diest, P. O. Witteveen, T. Jonges, J. L. Bos, A. van Oudenaarden, R. P. Zweemer, H. J. G. Snippert, W. P. Kloosterman and H. Clevers, Nat. Med., 2019, 25, 838–849 CrossRef CAS PubMed.
- S. J. Hill, B. Decker, E. A. Roberts, N. S. Horowitz, M. G. Muto, M. J. Worley, C. M. Feltmate, M. R. Nucci, E. M. Swisher, H. Nguyen, C. Yang, R. Morizane, B. S. Kochupurakkal, K. T. Do, P. A. Konstantinopoulos, J. F. Liu, J. V. Bonventre, U. A. Matulonis, G. I. Shapiro, R. S. Berkowitz, C. P. Crum and A. D. D'Andrea, Cancer Discovery, 2018, 8, 1404–1421 CrossRef CAS PubMed.
Footnote |
| † Electronic supplementary information (ESI) available. See DOI: https://doi.org/10.1039/d4bm01683a |
| This journal is © The Royal Society of Chemistry 2025 |