
Rapid on-chip nucleic acid extraction for point-of-care salivary diagnostics†
Siril
Arockiam
a,
Vi T.
Nguyen
b,
Mark
Knappenberger
a,
Clifford
Anderson
 b,
Michael
Hansen
b,
Vel
Murugan
a,
Jennifer Blain
Christen
*b and
Karen S.
Anderson
*a
b,
Michael
Hansen
b,
Vel
Murugan
a,
Jennifer Blain
Christen
*b and
Karen S.
Anderson
*a
aCenter for Personalized Diagnostics, Biodesign Institute, Arizona State University, Tempe, AZ 85287, USA, PO Box 876401. E-mail: Karen.Anderson.1@asu.edu; Tel: +1-480-965-6982
bCenter for Bioelectronics and Biosensors, Biodesign Institute, Arizona State University, Tempe, AZ 85287, USA, PO Box 876401. E-mail: Jennifer.blainchristen@asu.edu; Tel: +1-480-965-9859
First published on 8th May 2025
Abstract
Point-of-care technologies have become an essential tool in molecular diagnostics. Traditional laboratory-based nucleic acid extraction methods are laborious, costly, and hard to implement in point-of-care (POC) settings. POC nucleic acid extraction methods using silica membranes pose a significant technical challenge to simplify and efficiently extract RNA from biofluids such as saliva without degradation. Here, we have focused on addressing the POC nucleic acid (NA) extraction challenges by optimizing the RNase inactivation, viral lysis, NA binding conditions, and NA elution and adapting it to on-chip extraction. We have evaluated reducing agents, chaotropic salt (guanidine HCl), heat, proteinase K treatment, and elution buffer conditions. We have formulated POC-Pure, a cost-effective, efficient custom buffer-extraction method using silica to bind and release nucleic acids from salivary samples. To purify and concentrate NA, we have fabricated a microfluidic chip using xurographic and laser cutting techniques which incorporates a three-way valve actuator. We assessed the downstream application compatibility of the POC-Pure method using a POC-suitable loop-mediated isothermal amplification (LAMP). The simplified POC-Pure extraction method can purify and concentrate DNA and RNA with a lower limit of detection under 0.25 copies per μL and 0.5 copies per μL, respectively, using a 200 μL sample input. Thus, we have developed and demonstrated an on-chip nucleic acid extraction from saliva.
1 Introduction
Nucleic acid extraction from biofluids such as saliva, nasal swabs, urine, blood, and cervical fluid is the first step for molecular diagnostics from these samples. Sample preparation involving purification and concentration of nucleic acid is crucial for applications such as pathogen detection, gene expression analysis, cancer screening, sequencing, and genetic research.1,2 The COVID-19 pandemic has showcased the importance of nucleic acid amplification testing (NAAT) for diagnosing and preventing the transmission of infections. The recent pandemic highlighted the limitations of centralized testing laboratories due to delays associated with sample transport.3 To address this limitation, inexpensive and rapid point-of-care (POC) diagnostics using NAAT for infections such as SARS-CoV-2, respiratory syncytial virus (RSV), and influenza are needed to manage outbreaks by testing at the site of healthcare providers and mobile clinics.3–8Traditional nucleic acid (NA) extraction broadly falls into chemical, solid-phase, and mechanical methods. Extraction methods such as phenol-chloroform, paramagnetic beads, and silica matrices are sensitive but time-consuming, labor-intensive, and require sophisticated laboratory infrastructure and sample storage.9,10 These factors significantly impact the deployment of molecular diagnostics at the point of care, especially in low-resource settings. This emphasizes the need for a simpler, rapid, and instrument-free extraction method. Fully integrated sample-to-answer portable instruments such as GeneXpert® and Cobas are widely used but remain cost-limiting for widespread application, especially in low- and middle-income countries.3
Many respiratory pathogens have been detected in saliva.11,12 For example, RNA and DNA viruses such as SARS-CoV-2, RSV, influenza, Zika virus, human papillomavirus (HPV), herpes virus, human immunodeficiency virus, and Epstein–Barr virus can be diagnosed using saliva.13,14 Saliva is a non-invasive sample collection biofluid, making it ideal for self-collection to detect pathogens and use for sequencing.15–20 However, saliva presents unique challenges for DNA/RNA extraction in POC. It has variable viscosity, potential inhibitory substances, food particles, and inconsistent sample quality, necessitating a tailored approach for sample preparation. Direct NA extraction methods using heat, proteinase K, or detergents like Triton X-100 or Tween-20 can result in less sensitive and variable nucleic acid yields due to RNA degradation through high RNase activity in saliva compared to other biofluids.21–23 Methods using magnetic or silica beads often need a pre-centrifugation step to remove sputum or heavy particulates.24,25 Hence, a simple, robust, and integrable sample preparation method is needed to extract, stabilize, concentrate, and purify NA from different biofluids, specifically saliva, for POC systems.
Lab-on-a-chip extraction systems, with innovations like paper-based extraction,26,27 centrifugal devices using hand-powered mechanisms or fidget spinners,28,29 membrane filters,30,31 xurography,32 disk-based,33 and dielectrophoresis,34 provide portable, compact, and disposable sample preparation systems in POC. These microfluidic devices integrate complex laboratory processes into a compact, user-friendly format.35–37 However, translating these technologies into fully integrated POC NAAT diagnostics remains challenging due to issues such as intricate fabrication designs, reliance on metering systems, motorized pumps, multiple wash chambers requiring active actuators, complex sample dispensers, and prolonged sample preparation times. These limitations significantly hinder their scalability and practicality, particularly in resource-constrained settings. Furthermore, the need for sample pre-treatment and customized NA extraction methods for each type of biofluid underscores the lack of robustness in existing approaches. Isothermal amplification methods such as loop-mediated isothermal amplification (LAMP), recombinase polymerase amplification (RPA), and helicase-dependent amplification (HDA) are emerging as alternatives to PCR for POC diagnostics.38 Among these, the combination of simple, efficient nucleic acid extraction methods with LAMP represents a significant advancement.39–42 Thus, we have evaluated the extraction method compatibility with LAMP amplification assay.
Here, we developed a lab-on-a-chip adaptable custom extraction method, termed POC-Pure (Point-of-Care-Purification), to address the limitations of current extraction techniques in POC settings. This method minimizes the number of user steps, reduces extraction time, and decreases waste volume while maintaining DNA/RNA stability and yield, as well as concentrating nucleic acids (NAs) during the extraction process. POC-Pure is compatible with both qPCR and LAMP, producing similar target amplification times. Additionally, the method effectively removes carryover inhibitors from saliva, enhancing its suitability for downstream applications. These features are critical for integrating nucleic acid extraction with isothermal amplification into a single sample-to-answer platform.
The method utilizes a streamlined silica membrane-based extraction optimized with guanidine hydrochloride (GuHCl), enabling rapid and efficient NA binding while eliminating the need for additional pre-centrifugation or sputum-removal steps.43–45 Furthermore, we developed POC methods for RNase inactivation and RNA stabilization from saliva, ensuring high RNA yield for sensitive salivary diagnostics. POC-Pure demonstrated compatibility with both qPCR and LAMP, achieving target amplification times comparable to gold-standard commercial methods, even with challenging biofluids like saliva. The microfluidic chip features a minimalist channel design that eliminates the need for motorized pumps or multiple wash chambers, completing on-chip NA extraction in under 10 minutes. This simplified approach successfully isolated NAs from saliva and storage buffers, offering a scalable and cost-effective solution for POC diagnostics.
2 Results and discussion
Fig. 1a illustrates the schematic workflows of classic nucleic acid (NA) purification and (Fig. 1b) shows the POC-Pure extraction method which eliminates multiple wash steps. Fig. 1c demonstrates the centrifuge-free on-chip NA extraction workflow for rapid point-of-care testing. The microfluidic device can purify and concentrate NA from salivary samples on-chip for rapid molecular diagnostic applications.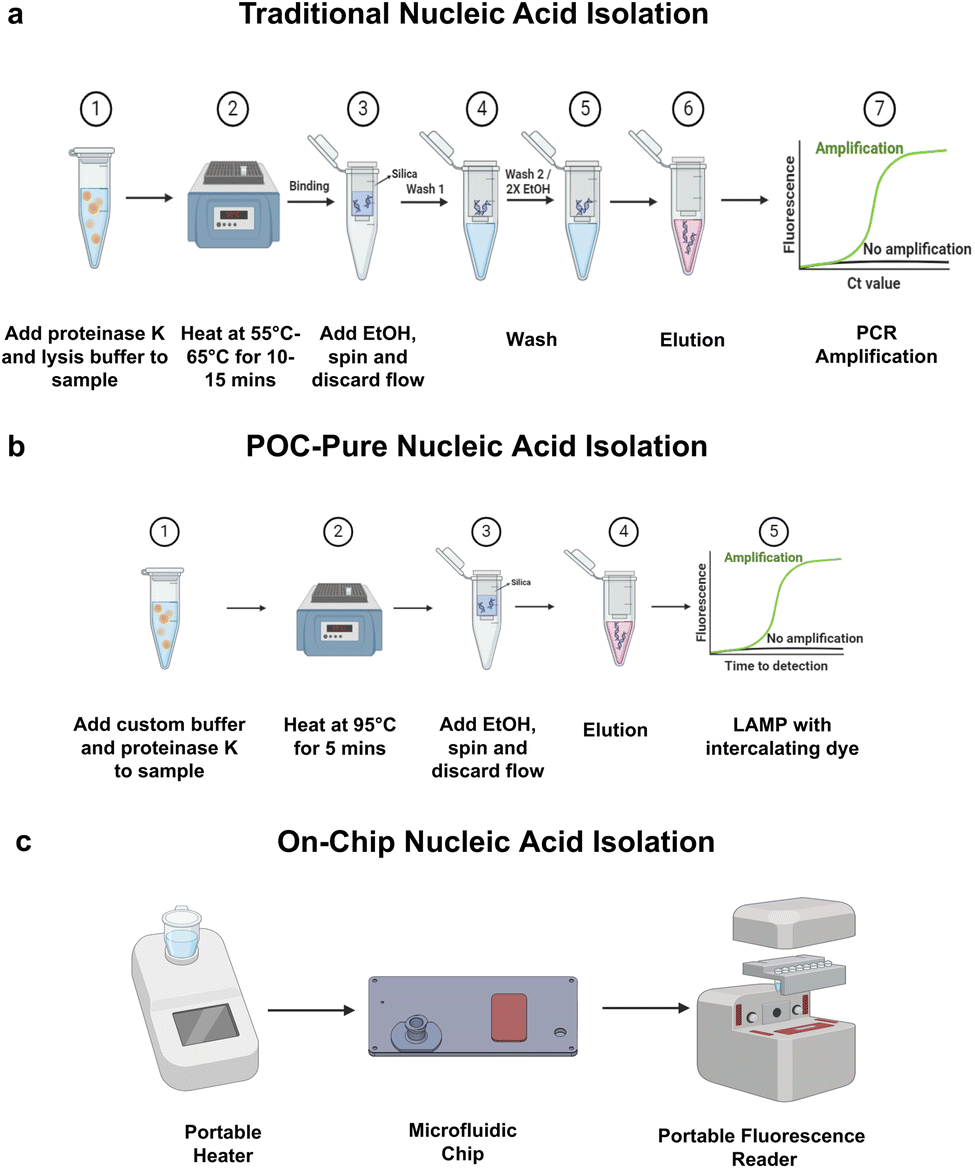 | ||
| Fig. 1 Schematic of traditional, POC-Pure (Point-of-care Purification) nucleic acid extraction and on-chip extraction methods. (a) Spin column-based DNA/RNA extraction with multiple wash steps is harder to implement POC. (b) Schematics of the simplified POC-Pure rapid DNA/RNA extraction method with no wash steps to adopt for on-chip nucleic acid extraction. (c) Potential POC nucleic acid extraction workflow using the centrifuge-free on-chip extraction. The nucleic acid can then be detected using loop-mediated isothermal amplification (LAMP), either by colorimetry or fluorescence detection. Colorimetric detection only requires a portable heater and microfluidic NA extraction chip. | ||
To develop a simple and easy-to-adapt sample preparation and nucleic acid extraction method for POC applications, compatible with qPCR and isothermal amplification (LAMP), we first developed a custom buffer for silica membrane-based extraction and optimized salivary sample treatment. To reduce sample processing time and wash steps while retaining similar nucleic acid extraction efficiency and enabling on-chip translation, we addressed the following for effective DNA and RNA binding: (I) development of a custom silica binding buffer for total nucleic acid (NA), (II) optimization of viral lysis and NA elution conditions, (III) RNase inactivation in salivary samples, (IV) comparison of the custom method with a commercial extraction method, and (V) demonstration of the custom rapid extraction method on a microfluidic chip.
2.1 Custom buffer for nucleic acid binding
Guanidine hydrochloride (GuHCl) and guanidine thiocyanate (GuSCN) are often used at high concentrations in commercial DNA/RNA extraction kits due to their strong denaturant and chaotropic properties.46,47 Guanidinium has high ion affinity, making it an excellent candidate to form a salt bridge between silicon dioxide (silica) and nucleic acid. The positively charged ions facilitate the interaction between the negatively charged silica and the negatively charged phosphate backbones of NA. This selective yet reversible binding nature of silica and guanidinium aids in removing unbound contaminants and proteins while concentrating nucleic acids. Guanidinium is favored over others such as sodium, cesium, and potassium due to its rapid binding, strong chaotropic effect, high ion affinity, and ability to disrupt electrostatic interactions. Between GuHCl and GuSCN, GuHCl was chosen for this study because trace amounts of GuHCl (<140 mM) can enhance the amplification efficiency of LAMP, making it an ideal candidate for a wash-free column-based extraction method.48,49![[thin space (1/6-em)]](https://www.rsc.org/images/entities/char_2009.gif) 000 copies of synthetic SARS-CoV-2 RNA templates into 200 μL of water, mixing them with 200 μL of buffer containing GuHCl, and then loading the mixture onto the silica membrane. After centrifugation, the bound nucleic acids were eluted with nuclease-free water (Fig. 2a). Extractions were performed without wash steps to assess the maximum tolerable carryover of GuHCl in the LAMP amplification reaction. The optimal GuHCl concentration was identified as the one yielding the shortest LAMP time-to-detection, indicating minimal inhibition and maximal NA yield. The time-to-detection was calculated as described in the methods. The quickest mean time-to-detection was observed with no GuHCl (0 M) at 17 minutes, and 2 M was the maximum tolerable concentration without inhibiting the LAMP reactions (58.3 minutes). Initially, 1× TE buffer gave better amplification without GuHCl, likely due to the EDTA facilitating nucleic acid binding at non-alkaline pH.
000 copies of synthetic SARS-CoV-2 RNA templates into 200 μL of water, mixing them with 200 μL of buffer containing GuHCl, and then loading the mixture onto the silica membrane. After centrifugation, the bound nucleic acids were eluted with nuclease-free water (Fig. 2a). Extractions were performed without wash steps to assess the maximum tolerable carryover of GuHCl in the LAMP amplification reaction. The optimal GuHCl concentration was identified as the one yielding the shortest LAMP time-to-detection, indicating minimal inhibition and maximal NA yield. The time-to-detection was calculated as described in the methods. The quickest mean time-to-detection was observed with no GuHCl (0 M) at 17 minutes, and 2 M was the maximum tolerable concentration without inhibiting the LAMP reactions (58.3 minutes). Initially, 1× TE buffer gave better amplification without GuHCl, likely due to the EDTA facilitating nucleic acid binding at non-alkaline pH.
 | ||
| Fig. 2 Custom buffer development for total nucleic acid (NA) binding to silica. (a) Titration of guanidine hydrochloride (GuHCl) from 0–10 M in 1× TE (Tris HCl–EDTA) buffer to find the optimum concentration for NA binding and LAMP PCR inhibition due to carryover buffer. For all extractions, 50000 (50k) synthetic SARS CoV-2 (omicron) synthetic template was spiked in 200 μL of water. (b) Carrier RNA (5.6 μg) was added to different GuHCl concentrations to enhance binding. (c) Ethanol was added in a 1:1 volume ratio to buffer with different GuHCl concentrations to enhance binding. (d) Titration of GuHCl from 0–10 M in 1× TE buffer with 5.6 μg carrier RNA and 1:1 volume ethanol (e) GuHCl (2 M) buffer was selected as optimum concentration and titrated with 0–200% v/v of 100% ethanol. (f) GuHCl (2 M) buffer and 1:1 (100%) ethanol were selected as the optimum for NA binding and titrated at pH 6–10. All the LAMP reactions were performed in triplicate for SARS-CoV-2 target and amplified for 60 minutes. The mean time to detection was plotted on all the graph with the y-axis error bars extending one standard deviation. ND = not detected any fluorescence signal at the end of 60 minutes of amplification. Asterisks (*) indicate significance levels: *(p < 0.05), **(p < 0.01), ***(p < 0.001), while “ns” denotes no significance (p > 0.05). Tukey's HSD test was performed to find the optimal conditions. | ||
In Fig. 2b, we investigated whether the addition of 5.6 μg carrier RNA in 200 μL of buffer containing GuHCl could enhance RNA binding to silica. Typically, carrier RNA is used to maximize the binding of short or fragmented NA, or used to reduce RNase activity in biofluids.50,51 The addition of carrier RNA did not significantly affect the time-to-detection compared to GuHCl alone in the binding buffer; for example, at 1 M GuHCl, with and without carrier RNA resulted in time-to-detection of 20.6 and 21.2 minutes, respectively.
:1 volume ratio to buffer for enhancing the nucleic acid binding. Ethanol is commonly used in nucleic acid extraction to remove excess salts and proteins.52 Additionally, it enhances the interaction between nucleic acids and salts, especially for short RNAs such as micro-RNAs, small interfering RNAs, and fragmented DNA/RNA by reducing the dielectric constant between charged molecules.53,54 Moreover, ethanol promotes precipitation by hydrophobic interaction due to its dehydration effect.53,54 Therefore, we evaluated the optimal nucleic acid binding by titrating GuHCl concentrations in the presence of ethanol (200 μL). The fastest mean time-to-detection was observed at 1 M and 2 M GuHCl, at 15.2 and 15.9 minutes, respectively, with minimal variation (p-value >0.05) in detection time while increasing the maximum tolerable concentration up to 4 M GuHCl (21.3 minutes). The time-to-detection between 0 M and 1 M had significant difference. Subsequently, GuHCl titration was performed with ethanol and carrier RNA combination (Fig. 2d). The results suggest that 2 M GuHCl concentration performed better, amplifying at 13.3 minutes. The p-value between the two lowest times-to-detection, i.e., 1 M and 2 M, is less than 0.001, suggesting 2 M GuHCl concentration is significantly better than the rest. Furthermore, unlike in Fig. 2b, the addition of carrier RNA along with ethanol to GuHCl has facilitated faster detection time. It is worth noting that for 2 M GuHCl, by adding ethanol, the final concentration of GuHCl in the sample and buffer matrix reduces to less than 2 M due to the increase in overall volume.
Additionally, we evaluated different volumes of ethanol (0–200% v/v of 100% ethanol) at 2 M GuHCl concentration to determine whether varying the ethanol-to-sample volume could enhance NA binding. As shown in Fig. 2e, the lowest amplification times were observed in the volume of 75% and 100% ethanol to the sample volume without significant statistical differences but had a significant difference between no ethanol and 100% ethanol. An ethanol volume equal to the sample volume (100%) was chosen for further evaluation, as this ratio, along with the buffer, achieves a straightforward 1:1:1 ratio that simplifies handling. Similar results were observed with different isopropanol volume ratios (Fig. S1†), even though it is generally assumed that less isopropanol than ethanol is required to precipitate or enhance DNA/RNA binding.
:1 volume per sample) and carrier RNA (5.6 μg) for all subsequent NA extractions unless otherwise specified.
2.2 Viral lysis and nucleic acid elution conditions optimization
000 heat-inactivated SARS-CoV-2 virus particles. All samples were treated with 200 μL of lysis agents and heated at 95 °C for 5 minutes. Subsequently following our custom extraction protocol. LAMP amplification for 60 minutes targeting SARS CoV-2 demonstrated the efficiency of our custom buffer in viral lysis, resulting in faster time to detection. Heating saliva at 95 °C or treatment with proteinase K showed a high variation between technical replicates in time-to-detection compared to other lysis conditions, likely due to RNA degradation in saliva after viral lysis due to RNases, high temperature and RNA hydrolysis. The custom buffer (2 M GuHCl in 1× TE) with proteinase K and 10 mM TCEP had better RNA stability or extraction efficiency than heat or proteinase K treatment alone due to its ability to inhibit RNases either by destabilizing disulfide bonds or by chelating RNase cofactors. Thus, the combination of custom buffer with proteinase K performed better than the rest, with a mean time-to-detection of 14.7 minutes.
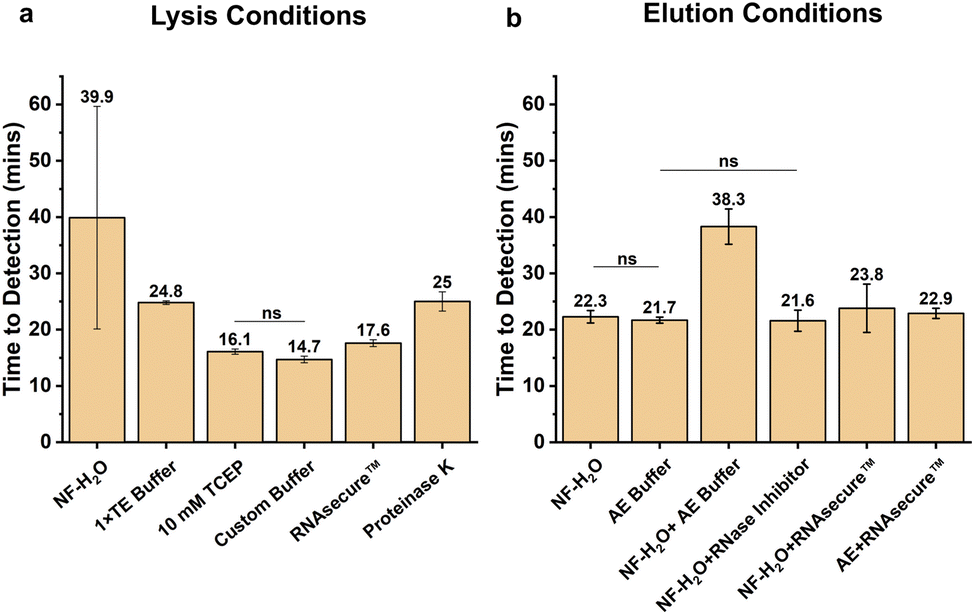 | ||
| Fig. 3 Viral lysis and nucleic acid elution conditions optimization. (a) A pooled negative saliva sample (200 μL) was spiked with 50000 heat-inactivated SARS CoV-2 (omicron) virus. All samples were treated with 200 μL of lysis agents and heated at 95 °C for 5 minutes. All the samples were extracted using the custom buffer and extraction protocol, and LAMP PCR was performed targeting ORF1a for 60 minutes. (b) Different elution buffer conditions were evaluated for LAMP inhibition, RNA retrieval, and degradation. All the LAMP reactions were performed in triplicate for the SARS CoV-2 target. The mean time to detection was plotted on all the graphs with the y-axis error bars extending one standard deviation. Asterisks (*) indicate significance levels: *(p < 0.05), **(p < 0.01), ***(p < 0.001), while “ns” denotes no significance (p > 0.05). Tukey's HSD test was performed to find the optimal conditions. | ||
2.3 RNase inactivation in salivary samples
Saliva poses many challenges, particularly high RNase activity to protect humans from pathogens but is detrimental in nucleic acid extraction and detection. So, we explored simple, fast yet cost-effective enzymatic and chemical nuclease inhibitors. RNases are resistant to heat and chemical denaturation due to the high degree of sulfide bonds stabilizing the tertiary structure of the proteins. Thus, reducing agents such as dithiothreitol (DTT) and tris(2-carboxyethyl)phosphine (TCEP) are effective choices to disrupt these disulfide bonds in RNase.58 While both can reduce disulfide bonds, DTT requires cold storage and is a reversible reducing agent while TCEP is non-reversible and stable at room temperature for a longer duration. Thus, TCEP is a better choice for the RNase inactivation.59 Additionally, TCEP and DTT can reduce the viscosity of saliva,25,60 which can facilitate the movement of biofluids through the silica matrix in POC devices without the need for high centrifugal force.Heat-treated samples were evaluated with different RNase inhibitors to identify the most effective condition using the RNaseAlert assay using 200 μL of different buffers and saliva (Fig. 4a). Proteinase K treatment alone and 100 mM TCEP showed high mean relative fluorescence units (RFU) of 285.5 and 538, respectively, indicating high RNase activity and RNA degradation. The combination of custom buffer with TCEP showed superior performance (7.9 RFU), followed by 1× TE buffer (12.8 RFU). EDTA can chelate metal ions (such as Mg2+, Ca2+, and Mn2+), which are essential cofactors for RNases and other nucleases, thus inhibiting a broad spectrum of nucleases. Murine-based RNase inhibitors are also good alternatives but are costly and require cold storage (data not shown). While commercial stabilizing reagents such as RNAlater or Qiazol effectively inactivate RNases, they introduce additional costs and require specialized storage conditions, limiting their suitability for point-of-care diagnostics. Similar to custom RNase inactivation protocols,61,62 our approach achieves efficient RNase inactivation without the need for costly preservatives, instead utilizing heat treatment and chemical reducing agents to stabilize RNA for downstream molecular analysis. This method ensures compatibility with decentralized testing environments while maintaining sufficient RNA integrity for reliable detection.
 | ||
| Fig. 4 RNase inactivation methods for salivary samples. (a) RNaseAlert assay was performed for different salivary treatment methods to determine the optimum nuclease inactivation method. Saliva (200 μL) was treated with 200 μL of different buffers and heat-inactivated at 95 °C for 5 minutes. Samples were then cooled, and the relative fluorescence unit (RFU) was measured after 30 minutes of incubation at 37 °C using RNaseAlert assay to find the RNase activity. All assays were performed in triplicate and mean RFU was plotted with one standard deviation as y-axis error bars. (b) Scatter + line plot for RNase activity observed from 0–30 min at 2 min intervals. The inset on the right shows the magnified version of RNase activity for conditions with low RFU. Of all the methods, custom buffer (CB) + 10 mM TCEP showed the lowest RNase activity and was chosen as an optimum RNase inactivation condition for salivary samples. | ||
Fig. 4b shows RNase activity measured in terms of RFU at 37 °C for 30 minutes at 2 minutes intervals using RNaseAlert assay.63 The inset (right) shows no significant change in RNase activity between 0 and 30 minutes for CB with 10 mM TCEP, similar to the negative control. Therefore, CB with TCEP at 10 mM was selected as an additive for RNase inactivation. In contrast, higher degradation observed at elevated TCEP concentrations (100 mM) is likely due to RNA degradation caused by altered buffer pH, generation of oxidative byproducts, or degradation of RNaseAlert probes, resulting in higher RFU values than the positive control, unlike at lower TCEP concentrations. Hereafter, the above-optimized custom extraction detailed in methods will be referred to as the POC-Pure (for Point-of-Care Purification).
2.4 Comparison of nucleic acid extraction efficiency
The optimized POC-Pure sample preparation and extraction method was evaluated for nucleic acid yield and efficiency using qPCR (Ct values) and LAMP (time-to-detection) by benchmarking it against commercial extraction methods. In a 200 μL sample, SARS-CoV-2 genome and viral particles were serially diluted from 100000 (100k) to 1 copy. As shown in Fig. 5a, the POC-Pure method successfully detected RNA but exhibited a higher Ct value compared to the commercial method (p-value ≈ 0.02), likely due to carryover contamination. The observed Ct shift from 25.1 to 29.1 corresponds to an approximate 16-fold decrease in detectable nucleic acid concentration, assuming optimal qPCR efficiency (2ΔCt). This shift is likely due to residual guanidine salt in the eluate, which can partially inhibit polymerase activity. Although dilution of the eluate could reduce this inhibitory effect, subsequent increase in reagent volume would markedly increase time and cost or reduce the effective template concentration. Notably, this shift in Ct values was not observed in the LAMP reaction. Alternatively, digital PCR (dPCR) offers absolute quantification and may be less affected by inhibitors, providing a robust alternative for nucleic acid quantification.64 These trade-offs should be considered based on specific point-of-care diagnostic requirements.
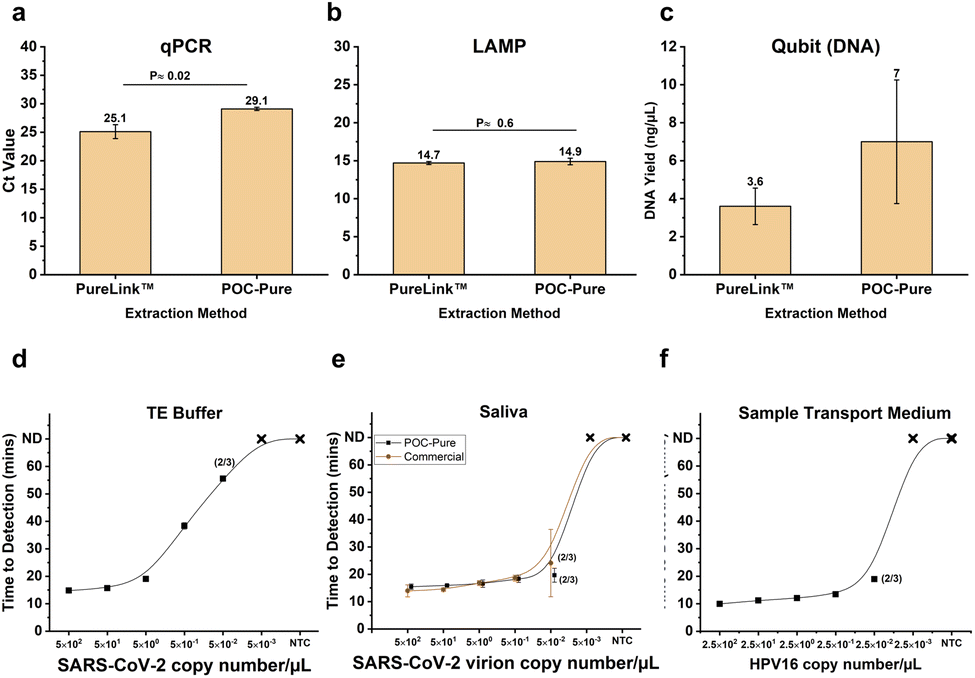 | ||
| Fig. 5 Comparison of nucleic acid extraction efficiency between commercial and POC-Pure methods. (a) For RNA, 50000 (50k) copies of heat-inactivated SARS-CoV-2 (omicron) viruses were spiked into 200 μL saliva samples and extracted using PureLink™ (ThermoFisher) and POC-Pure. TaqMan qPCR was performed for SARS-CoV-2 to compare extraction efficiency. (b) The same extracts were analyzed using LAMP PCR for SARS-CoV-2 (RNA) and HPV16 (DNA), and the time-to-detection was plotted. (c) Qubit analysis was performed to compare DNA yield between PureLink™ and POC-Pure. (d) The limit of detection (LOD) for SARS-CoV-2 RNA spiked in 200 μL 1× TE buffer using the POC-Pure method. (e) LOD for heat-inactivated SARS-CoV-2 (omicron) virus spiked in 200 μL saliva. (f) LOD for HPV16 DNA spiked in 200 μL sample transport medium (STM). All extractions and no-template controls (NTCs) were performed in triplicate. The mean time-to-detection was plotted, with y-axis error bars representing one standard deviation. Data points are annotated with numbers in parentheses to indicate amplified replicates. If not shown, all replicates were successfully amplified for that particular copy number. ND = Not detected at the end of the 60 minutes amplification. | ||
The same extracts were amplified with LAMP to assess inhibition and extraction efficiency. Fig. 5b shows that the PureLink and POC-Pure extraction methods had similar mean time-to-detection values of 14.7 and 14.6 minutes, respectively, with no significant difference (p-value ≈ 0.6). This suggests that the yield of SARS-CoV-2 RNA was comparable between the commercial and POC-Pure methods in terms of LAMP amplification efficiency.
Thus, the POC-Pure method demonstrated nucleic acid extraction performance similar to commercial methods without the need for wash steps. This is partly due to the LAMP-enhancing effects of residual GuHCl in the eluate. Qubit (ThermoFisher) analysis indicated that the POC-Pure method yielded higher DNA amounts (p-value ≈ 0.2), likely due to reduced shearing and lower DNA loss from minimized wash steps and centrifugation. Nanodrop (ThermoFisher) analysis (ESI Fig. S2†) indicated that the POC-Pure method yielded DNA and RNA with comparable purity and concentration to commercial extraction methods. The mean DNA yield for POC-Pure was 119.57 ± 6.84 ng μL−1 (mean ± S. D.), compared to 139.6 ± 13.52 ng μL−1 for the commercial PureLink method (p ≈ 0.107). Similarly, RNA yield for POC-Pure was 94.3 ± 7.85 ng μL−1, while PureLink yielded 97.0 ± 15.88 ng μL−1 (p ≈ 0.809), demonstrating no statistically significant difference in nucleic acid recovery.
The A260/A280 ratios (2.05–2.79 for DNA, 1.94–2.86 for RNA) suggest sufficient purity for amplification-based detection. However, the A260/A230 ratios were lower for POC-Pure (0.78–1.69) compared to PureLink (1.99–2.54), likely due to residual guanidine from the extraction process. Guanidine salts absorb at 230 nm and may interfere with downstream applications requiring high-purity nucleic acids, such as sequencing. Despite this, LAMP amplification remained effective, as it is generally more tolerant to inhibitors compared to PCR or sequencing workflows. These results highlight that while POC-Pure provides comparable nucleic acid yields, further optimization may be required to reduce guanidine carryover for broader downstream applications.
Although additional wash steps could improve nucleic acid purity (A260/A230), they would also increase processing time and complexity, reducing the feasibility of this method for point-of-care applications. The POC-Pure method was optimized for rapid nucleic acid extraction with minimal user intervention, prioritizing extraction speed and compatibility with isothermal amplification methods. For applications sensitive to residual buffer components, a modified elution buffer or an additional quick wash step could be implemented as an optional refinement to balance purity and efficiency.
After assessing extraction efficiency, we evaluated the lower limit of detection (LOD) of RNA and DNA in 1× TE buffer, saliva, and sample transport medium (STM). SARS-CoV-2 genome and viral particles were serially diluted from 100000 (100k) to 1 copy in 200 μL of sample, and time-to-detection was observed. The HPV16 synthetic genome was also serially diluted from 50000 (50k) to 0.5 copies in 200 μL of STM. As shown in Fig. 5d, genomic copies of SARS-CoV-2 RNA spiked in 1× TE buffer were detected in all three replicates down to 100 copies per 200 μL (or 0.5 copies per μL), with detection as low as 10 copies per 200 μL in some cases. In Fig. 5e, SARS-CoV-2 RNA was successfully extracted and detected from saliva in all three replicates down to 100 copies per 200 μL. Both the commercial extraction method (PureLink™) and POC-Pure demonstrated similar LODs, detecting as few as 10 copies, where two of three replicates were successfully amplified. Whole virions exhibited faster amplification times, likely due to the nucleocapsid protecting RNA integrity, enhancing yield and stability, and minimizing degradation compared to pre-isolated genomic RNA. For HPV DNA, all three replicates were detected down to 100 copies, and as low as 5 copies (0.025 per μL) were successfully amplified, as shown in Fig. 5f.
The ability to detect SARS-CoV-2 RNA and HPV DNA at low concentrations serves as an indirect measure of RNA and DNA extraction efficiency, demonstrating compatibility with downstream molecular assays. Both the POC-Pure and commercial methods successfully detected two out of three replicates down to 0.5 copies per μL in saliva, while no-template controls (NTCs) showed no amplification (n = 3), confirming the absence of false positives and ensuring 100% sensitivity and specificity, respectively. The consistency in the limit of detection (LOD) suggests complete (100%) concordance between the POC-Pure and commercial extraction methods in terms of sensitivity and specificity. Furthermore, the achieved LOD falls within the clinically significant viral load range (∼1000 copies per mL) for infections such as HPV,65 reinforcing the platform's diagnostic accuracy and clinical applicability for point-of-care settings. However, future studies with additional replicates and a larger set of clinical samples are necessary to have sufficient statistical power to further validate this method. Overall, the POC-Pure method demonstrates sufficient sensitivity to detect pathogens at clinically relevant levels.
2.5 On-chip extraction using customized rapid extraction
After evaluating the POC-Pure method, we transferred the method to the microfluidic chip shown in Fig. 6a. The chip was designed with a luer lock inlet port, silica matrix, valve system, waste reservoir, and elution reservoir. Syringes containing the sample or buffer are attached to the luer lock so that fluid flow is driven by hand plunging force. Fig. 6b shows a fully assembled microfluidic chip, made with layers of plastic and adhesive films cut using xurographic techniques.66–68 The valve actuator platform directs the flow of fluid between the waste and elution reservoir. | ||
| Fig. 6 On-chip extraction using a microfluidic chip. (a) Schematics of microfluidic chip fabricated in the lab for centrifuge-free total nucleic acid (NA) extraction. The embedded silica in the microfluidic channel is used to capture and purify NA. (b) Image of fully fabricated and functional microfluidic chip with sample syringe attached to the sample port mounted on a valve actuator base. The clip can be pushed to redirect the fluid flow between the waste and elution. (c) On-chip extraction of 50000 SARS-CoV-2 viruses spiked in 200 μL saliva and SARS-CoV-2 RNA detection using LAMP for 5 saliva samples. Three saliva samples were spiked with a SARS-CoV-2 template. Negative salivary samples did not show amplification for the SARS-CoV-2 target. (d) On-chip extraction of 5000 SiHa cells spiked in 200 μL STM and HPV16 DNA detection using LAMP for 3 different samples and no template control (NTC) did not amplify for HPV16E6 and ACTB targets. ND = not detected any fluorescence signal at the end of 60 minutes of amplification. | ||
For on-chip extraction, samples pre-treated with our custom buffer were processed through the microfluidic chip, where nucleic acids were extracted and subsequently analyzed using LAMP assays for specific targets such as SARS-CoV-2 RNA, and HPV 16 DNA. The β-actin (ACTB) was used as an extraction control.
As shown in Fig. 6c, 50000 copies of SARS-CoV-2, omicron virion were detected using LAMP assay and extraction on-chip was performed under 10 minutes per sample including the heat treatment step. The two negative saliva samples without spiked virus showed no amplification for SARS-CoV-2 RNA targets but successfully amplified for β-actin, indicating that the extraction worked on the microfluidic chip and was specific to the target gene. Additionally, 5000 SiHa cells were spiked into 200 μL STM and were successfully detected with minimal variation in time-to-detection between three samples. No template control (NTC) showed no amplification, suggesting no carryover or cross-contamination. The microfluidic chip is designed to extract both RNA and DNA, enabling the simultaneous detection of multiple analytes. For HPV detection, the system can support multiplexed analysis, since total nucleic acid can be extracted, divided, and individually tested. For on-chip nucleic acid detection, 4 targets can be detected simultaneously by incorporating multiple reaction well chambers on the microfluidic chip.69,70 Thus, the on-chip extraction can be integrated with nucleic acid detection to improve the versatility of the platform, making it adaptable for broader clinical applications in molecular diagnostics.
The custom extraction method developed here could be implemented on other silica-based matrices such as silica-coated paramagnetic beads, glass fiber, and silica gel polymers. This method is potentially suitable for DNA/RNA extraction from biosamples such as nasal swabs, skin or lesion swabs, urine, plasma, and blood. The microfluidic chip can be further modified to incorporate additional channels and wells to facilitate multiplexed pathogen or gene target detection within a single assay. Table 1 compares the nucleic acid extraction using the POC-Pure protocol with methods from the literature and commercial methods. As demonstrated in the table, the extraction method is versatile, capable of handling multiple biofluids such as saliva, STM and TE buffer while effectively concentrating nucleic acids to a sensitivity range of 0.5–5 copies per μL. This highlights its potential efficacy in integrated sample-to-answer detection systems, ensuring reliable and sensitive molecular diagnostics.
| Method | Sample type | Cell lysis | Nucleic acid conc. | Extraction time | LOD |
|---|---|---|---|---|---|
| This work | Saliva, STM, TE buffer | Chemical and thermal | Yes (silica) | ∼10 min | 0.5–5 copies per μL |
| Cartridge71 | PBS | Chemical and thermal | Yes (silica) | ∼35 min | 103 CFU |
| SalivaDirect17 | Saliva | Thermal and enzymatic | No | ∼10 min | 6–12 copies per μL |
| Oraldisk29 | Saliva | Mechanical and chemical | Yes (magnetic) | ∼40 min | — |
| Fidget spinner28 | Urine | — | Yes (nitrocellulose) | ∼10 min | — |
| PureLink72 | Saliva, nasal, buffers | Chemical and thermal | Yes (silica) | ∼40 min | 0.1–10 copies per μL |
| Paper based27 | Blood spot | Chemical | No | ∼10 min | 2.5 × 10³ μL−1 |
Preanalytic variations are a major challenge in point-of-care (POC) nucleic acid testing, as factors such as sample viscosity, contaminants, and enzymatic degradation can significantly impact extraction efficiency and downstream amplification performance. Unlike controlled laboratory settings where extensive processing steps can mitigate these issues, POC diagnostics require robust and streamlined workflows that address these challenges at the extraction stage. Our system integrates both physical and chemical strategies to ensure reliable nucleic acid recovery from saliva, a biofluid known for its high RNase activity and variable composition.
To overcome sample viscosity and improve flow dynamics within the microfluidic platform, we incorporated a physical silica-based filtration system that selectively binds nucleic acids while allowing unwanted debris and inhibitors to be efficiently removed. Additionally, the inclusion of TCEP effectively inactivates RNases, preventing RNA degradation, while also reducing viscosity by disrupting mucin and protein interactions in saliva. This dual approach enhances nucleic acid stability without requiring additional wash steps, making it highly compatible with rapid POC workflows. By addressing key preanalytic challenges, this approach facilitates seamless integration with downstream molecular assays, making it a viable solution for decentralized and resource-limited testing environments.
2.6 Volume and time reduction using custom rapid extraction
The POC-Pure method results in a significant reduction in the waste volume, as shown in Fig. 7a, with more than 50% decrease in waste volume for a 200 μL sample input. The overall extraction time for a single sample was reduced by about 60% (Fig. 7b), primarily due to less heating time and reduced steps. On-chip extraction was performed using the microfluidic chip in under 10 minutes with a total waste volume of ∼755 μL. Using the traditional extraction method on-chip would lead to 2–3 mL waste volume generation. The elution volume and concentration of the sample cannot be reduced below 50–80 μL with the current design because there is a minimum amount of elution buffer required to wet the entire silica membrane and to retrieve the maximum amount of NA. Thus, the microfluidic chip used in this study features a single-flow pathway and requires no external pumping or complex actuator systems, ensuring scalability and ease of use in resource-limited settings.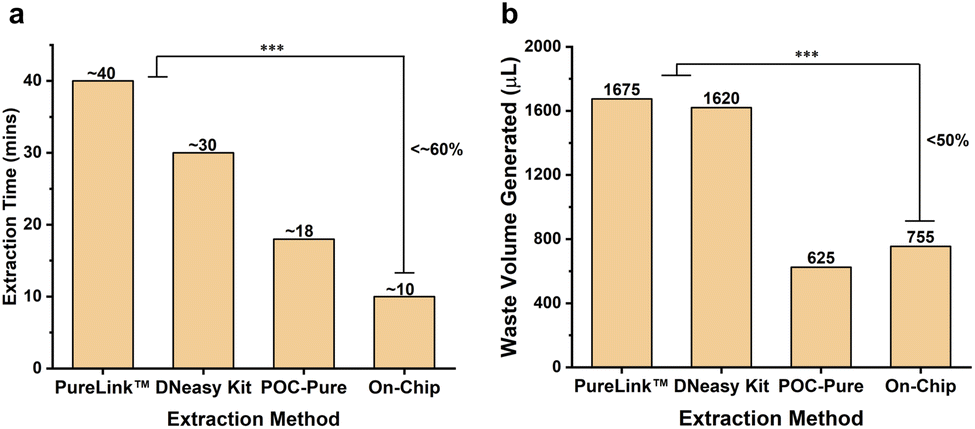 | ||
| Fig. 7 (a) Bar chart comparing the waste volume generated for 200 μL sample input for commercial, POC-Pure, and on-chip methods. POC-Pure method reduced more than 50% waste volume due to no wash steps while retaining similar efficacy. (b) Bar chart comparing overall extraction time for one sample at a time. On-chip extraction takes less than 10 minutes (<60%) compared to the commercial methods due to less heating time and reduced steps. | ||
3 Conclusion
We demonstrated robust and fast off-chip and on-chip nucleic acid extraction of SARS-COV-2 RNA from inactivated virions, and HPV-16 DNA from SiHa cells and amplified the extract in lab using LAMP assay. The POC-Pure extraction method had a detection limit of 100 copies or 0.5 copies per μL of SARS-COV-2 from 1× TE buffer and saliva. For HPV, the detection limits were 50 copies or 0.25 copies per μL of HPV 16 DNA in STM. The POC-Pure system has been fully migrated onto a microfluidic chip. This provides a robust, integrable sample preparation method to address the current challenges of POC molecular testing from biofluids for complete sample-to-answer on portable platforms. Lab-on-a-chip platforms like this can significantly aid in disease detection and public health responses at the point of care, especially in low- and middle-income countries. Future studies will focus on broadening the validation of this method with different biofluids and integrating it into a complete sample-to-answer system for wider clinical use.4 Materials and methods
4.1 Salivary samples
Saliva samples were collected following protocols approved by the Institutional Review Board (IRB) of Arizona State University (ASU). Unstimulated whole saliva samples were collected using a self-collection kit assembled by the ASU Biodesign Clinical Testing Laboratory (ABCTL) throughout the state of Arizona. To minimize variability, participants were instructed to refrain from eating for at least 30 minutes prior to collection. Participants provided unstimulated saliva samples using a straw and a micronic sample collection tube (Micronic, MP52410-Z20). The collected samples were securely sealed and transported in biohazard bags. To ensure biosafety, all samples were heat-treated at 65 °C for 15 minutes to inactivate viral particles before processing, ensuring safe handling during nucleic acid extraction. Collected samples were stored at −80 °C prior to use. All samples were thawed on ice and handled under RNase-free conditions.4.2 Cell lines and nucleic acid templates
The SiHa (HTB-35™) cell line and heat-inactivated SARS-CoV-2 omicron variant (VR-3347HK) were procured from the American Type Culture Collection (ATCC, Manassas, VA). SiHa cells were cultured following ATCC protocols using Dulbecco's Modified Eagle Medium (DMEM) supplemented with 10% fetal bovine serum (FBS) and antibiotics. Cells were harvested at 70–80% confluence and preserved in RNAlater® (Thermo Fisher Scientific, AM7020) at −80 °C until use.Quantitative genomic RNA of the SARS-CoV-2 omicron variant (VR-3378D) and quantitative synthetic human papillomavirus 16 (HPV16, VR-3240SD) templates were obtained from ATCC. Viral templates were aliquoted and diluted in nuclease-free water for experimental use.
4.3 Loop-mediated isothermal amplification (LAMP)
LAMP primers targeting the ORF1a gene of SARS-CoV-2, E6/E7 gene of HPV 16, and β-actin were designed using the New England Biolabs (NEB) primer design tool. Primers were checked for specificity, absence of primer-dimer formation, and amplification efficiency. Synthesized primers (Integrated DNA Technologies, Coralville, IA) were reconstituted in nuclease-free water to 100 μM stock concentrations. A 10× primer mix was prepared by combining 16 μL each of FIP and BIP primers, 2 μL each of F3 and B3 primers, and 4 μL each of LF and/or LB primers, bringing the total volume to 100 μL with nuclease-free water.LAMP reactions were set up in a dedicated PCR hood to prevent cross-contamination. Each 20 μL reaction contained 10 μL of 2× WarmStart LAMP Master Mix (NEB, E1700), 2 μL of 10× primer mix, 0.4 μL of SYTO-9 fluorescent dye (250 μM, Life Technologies, S34854), 0.1 μL of dUTP (NEB, N0459S), 0.4 μL of Antarctic Thermolabile UDG (NEB, M0372S), and 5 μL of template or nuclease-free water (negative control). β-Actin was used as a positive control.
Reactions were incubated at 65 °C for 60 minutes on a ViiA 7 Real-Time PCR System (Applied Biosystems) or an open qPCR machine (Chai, Santa Clara, CA), with real-time fluorescence data collected every 30 seconds. Post-amplification, tubes were not opened to prevent contamination.
Time-to-detection was defined as the time (in minutes) from the initiation of the LAMP reaction to the point at which the amplification or fluorescence signal crossed a predetermined fluorescence threshold. The threshold was set at 10 times the standard deviation of the baseline fluorescence, calculated from the first 5 minutes of the reaction where no amplification was observed.
4.4 Quantitative PCR (qPCR)
SARS-CoV-2-specific primer-probe mix (VIC dye) and RNase P (JUN dye) as a positive control were acquired from Thermo Fisher Scientific (Applied Biosystems, A51606). HPV 16-specific primers and probes were synthesized based on previously published sequences73 (Integrated DNA Technologies).Each 20 μL qPCR reaction comprised 10 μL of 2× TaqMan Fast Advanced Master Mix (Applied Biosystems, 4445566), 1 μL of 20× primer-probe mix (900 nM primers, 250 nM probe in 1× TE buffer), and 9 μL of template or nuclease-free water. Thermal cycling conditions were 50 °C for 2 minutes, 85 °C for 10 minutes, followed by 40 cycles of 95 °C for 15 seconds and 60 °C for 1 minute. Reactions were performed on a ViiA 7 Real-Time PCR System (Applied Biosystems).
4.5 Development of custom extraction protocol
000 copies) was spiked into 200 μL of nuclease-free water and mixed with 200 μL of each GuHCl solution.
The mixtures were loaded into Zymo IIC-XLR silica columns (Zymo Research, C1104-50) and centrifuged at 8000×g for 1 minute at room temperature. After discarding the flow-through, 50 μL of nuclease-free water was added to elute the RNA at 13300×g. Extracts (5 μL) were used in LAMP reactions to measure time-to-detection across different GuHCl concentrations.
The role of ethanol was explored by adding 200 μL of ethanol (200 proof) to the GuHCl solutions, followed by extraction and LAMP analysis. Combinations of ethanol and carrier RNA were also tested to identify optimal conditions that avoid inhibition.
A titration series of ethanol volumes (0%, 25%, 50%, 75%, and 100% of sample volume) was evaluated at 2 M GuHCl concentration to optimize nucleic acid binding.
4.6 Viral lysis, elution efficiency, and RNase inactivation
For the RNAsecure™ solution used in lysis evaluation, 800 μL of 25× RNAsecure™ reagent (Invitrogen, AM7005, Lithuania) was mixed with 9.2 mL of nuclease-free water to make a total volume of 10 mL. The proteinase K solution was prepared by adding 250 μL of proteinase K (Qiagen, 19131, Hilden, Germany) to 1750 μL of nuclease-free water.
000 copies of heat-inactivated SARS-CoV-2 (omicron variant) virus was combined with 200 μL of one of the following solutions: nuclease-free water; proteinase K solution; 1× TE buffer (Invitrogen, AM9858, Lithuania); a 10 mM TCEP solution made by mixing 20 μL of the TCEP solution from Section 4.6.1, in 180 μL nuclease-free water; a mixture of the custom buffer (CB) with 25 μL proteinase K; and the RNAsecure™ solution prepared earlier. Subsequently, 5.6 μL of carrier RNA (Applied Biosystems, 4382878, USA) was added to each mixture. Then the samples were thoroughly mixed by vortexing for 30 seconds and then heated at 95 °C for 5 minutes to lyse viral particles and inactivate enzymes. After cooling to room temperature, the samples were extracted using the steps in Section 4.5.2 as described previously and analyzed as outlined in Section 4.3.
000 copies of heat-inactivated SARS-CoV-2 (omicron variant) virus and 25 μL of proteinase K (Qiagen, 19131, Hilden, Germany). Following the above described extraction procedure, nucleic acids were eluted using 50 μL of different elution buffers. The buffers used were nuclease-free water; AE buffer (Qiagen, 19077, Hilden, Germany); a mixture of 45 μL nuclease-free water with 5 μL low TE buffer; a mixture of 45 μL nuclease-free water with 5 μL RNase inhibitor (Applied Biosystems, N8080119, Lithuania); a mixture of 45 μL nuclease-free water with 5 μL RNAsecure™; and a mixture of 45 μL Low TE buffer with 5 μL RNAsecure™. The extracted nucleic acids were immediately used in LAMP reactions as described in Section 4.3 to assess the impact of different elution buffers on amplification efficiency and RNA integrity.
After cooling, 45 μL of each heat-treated sample was mixed with 5 μL of 10× RNaseAlert substrate (Invitrogen, AM1964, Lithuania). For the positive control, 5 μL of RNase control from the kit was combined with 40 μL of nuclease-free water and 5 μL of RNaseAlert substrate. The negative control was prepared by mixing 45 μL of nuclease-free water with 5 μL of RNaseAlert substrate. All samples and controls were incubated at 37 °C for 30 minutes.
Relative fluorescence units (RFU), indicating RNase activity, were measured using a SpectraMax® M5 spectrophotometer (Molecular Devices, Sunnyvale, CA, USA) with excitation and emission wavelengths set at 490 nm and 520 nm, respectively, and the photomultiplier gain set to low. Additionally, to monitor RNase activity over time, RFU readings were collected every 2 minutes throughout the 30 minutes incubation period.
4.7 Custom extraction method (POC-Pure)
The optimized custom extraction method (POC-Pure) involved adding CB with 10 mM TCEP and 5 mM EDTA to the salivary sample in a 1:1 volume ratio (e.g., 200 μL sample + 200 μL CB with 10 mM TCEP and 5 mM EDTA). Then, 25 μL of proteinase K and 5.6 μg of carrier RNA were added to the mixture. The sample was vortexed for 30 seconds and heated at 95 °C for 5 minutes. Proteinase K was included in the sample preparation step to degrade proteins, facilitating cell lysis and nucleic acid release. However, since many RNases remain active after heat treatment, TCEP was incorporated for salivary samples to enhance RNase inactivation by reducing disulfide bonds in protein structures. The combined use of proteinase K and TCEP ensures effective sample preparation while preserving RNA integrity, critical for downstream amplification-based detection. After cooling to room temperature, ethanol was added in a 1:1 ratio to the sample volume (200 μL). The sample was loaded onto a silica column and centrifuged at 8000×g for 1 minute. Nucleic acids were eluted with 50 μL of nuclease-free water (for RNA) or AE buffer (for DNA) by centrifuging at 13300×g or maximum speed.
4.8 Nucleic acid extraction efficiency comparison
To compare the POC-Pure method with a commercial kit, 200 μL of pooled negative saliva samples spiked with 50000 copies of heat-inactivated SARS-CoV-2 were extracted using both the POC-Pure method and the PureLink™ Viral RNA/DNA Mini Kit (Invitrogen, 12280-050). Nucleic acids were eluted in 50 μL of nuclease-free water. Extracts (5 μL) were analyzed using qPCR and LAMP assays as described above.
DNA yield was quantified using the Qubit dsDNA HS Assay Kit (Invitrogen, Q33231) on a Qubit Flex fluorometer (Invitrogen, Q33327). Nanodrop One (ThermoFisher, ND-ONE-W) spectrophotometry was used to assess purity ratios (A260/280 and A260/230).
4.9 Limit of detection determination
For SARS-CoV-2, synthetic RNA and heat-inactivated virus were serially diluted to concentrations of 0, 1, 10, 100, 1000, 10000, and 100000 copies in 200 μL of 1× TE buffer and pooled negative saliva, respectively. Extractions were performed using the POC-Pure method, and LAMP assays were conducted to determine the lower limit of detection (LLOD).
For HPV16 DNA, synthetic HPV16 DNA templates were serially diluted to concentrations of 0, 1, 10, 100, 1000, and 10000 copies in 200 μL of specimen transport medium (STM). Extractions were performed using AE buffer, and LAMP assays were conducted to determine the LLOD. Each concentration was tested in triplicate to assess reproducibility and consistency.
4.10 Microfluidic chip fabrication
The microfluidic chip was fabricated using laser-cutting techniques. The middle layer consisted of 1.5 mm clear cast acrylic (McMaster-Carr) laser-cut with features for the inlet port, silica matrix (Zymo-Spin III column), valves, waste reservoir, and elution chamber. Adhesive films (Adhesives Research, 90445Q) were cut using a Cricut Explore cutting plotter to create fluidic channels leading to each feature.The adhesive layers were laminated on both sides of the acrylic, embedding the silica matrix between them. Polyester film (Melinex 454 PET, Tekra) was laminated on the outer surfaces to seal the channels and features. Silicone rubber (McMaster-Carr, 1460N11) was cut to cover the valves, and a luer lock attachment was 3D-printed (Formlabs Form 3) using clear resin and affixed over the inlet port.
4.11 On-chip extraction procedure
For on-chip nucleic acid extraction, 200 μL samples of negative saliva spiked with 50000 copies of heat-inactivated SARS-CoV-2 or STM spiked with 5000 SiHa cells were mixed with an equal volume of custom buffer (with 10 mM TCEP added only for saliva samples) along with 25 μL of proteinase K and heated at 95 °C for 5 minutes. After cooling, samples were loaded into 3 mL luer-lock syringes (Becton Dickinson, 309657) and connected to the chip's inlet port.
The valve was positioned to direct flow toward the waste reservoir. The sample was manually injected through the silica matrix into the waste reservoir. Subsequently, a 1 mL syringe (JD+01L, Nipro) containing 140 μL of nuclease-free water (for saliva samples) or 200 μL of AE buffer (for STM samples) was used to flush residual sample from the silica matrix into the waste.
For elution, a syringe containing 220 μL of nuclease-free water (RNA) or AE buffer (DNA) was connected, and the valve was adjusted to direct flow toward the elution port. Eluate was collected in 20 μL fractions up to a total volume of 100 μL. Extracts (5 μL) were used in LAMP assays targeting SARS-CoV-2, HPV 16, and β-actin.
4.12 Statistical analysis
All experiments were performed in triplicate unless otherwise stated. Data are presented as mean ± standard deviation (SD). Comparisons between two groups were performed using Welch's t-test, an adaptation of the Student's t-test designed for unequal variances, to determine statistical significance, including comparisons between the POC-Pure method and commercial extraction kits. Tukey's post-hoc test was applied following one-way ANOVA to identify optimal conditions for nucleic acid extraction and amplification. Linear regression analysis was employed using Origin software to evaluate the relationship between pH levels and nucleic acid binding efficiency, with the correlation coefficient (R2) indicating the strength of the association. Time-to-detection in LAMP assays and cycle threshold (Ct) values in qPCR assays were analyzed to compare the performance of different extraction methods and conditions. Statistical significance was determined by comparing the mean values obtained under different conditions. A p-value less than 0.05 was considered statistically significant.Abbreviations
| • AE | Aqueous Elution, Qiagen |
| • CB | Custom buffer |
| • COVID-19 | Coronavirus disease 2019 |
| • DNA | Deoxyribonucleic acid |
| • DTT | Dithiothreitol |
| • EDTA | Ethylenediaminetetraacetic acid |
| • GuHCl | Guanidine hydrochloride |
| • HDA | Helicase dependent amplification |
| • HPV | Human papillomavirus |
| • LAMP | Loop-mediated isothermal amplification |
| • LOD | Limit of detection |
| • NA | Nucleic acid |
| • PCR | Polymerase chain reaction |
| • POC | Point-of-Care |
| • qPCR | Quantitative polymerase chain reaction |
| • RNA | Ribonucleic acid |
| • RPA | Recombinase polymerase amplification |
| • RNase | Ribonuclease |
| • SARS-CoV-2 | Severe acute respiratory syndrome coronavirus 2 |
| • STM | Specimen transport medium |
| • TCEP | Tris(2-carboxyethyl)phosphine |
| • TE | Tris–EDTA |
Data availability
The authors confirm that the data supporting the findings of this study are available within the article and its ESI.†Author contributions
Conceptualization: SA, VTN, CA, JBC, KSA; methodology: SA, VTN, MK, MH, JBC, KSA; validation: SA, VTN, JBC, KSA; formal analysis: SA, VTN, MK, CA, MH; investigation: SA, VTN, MH, MK; resources: VM, JBC, KSA; data curation: SA, VTN, JBC, KSA; writing – original draft preparation: SA, JBC, KSA; writing – review & editing: SA, VTN, CA, JBC, KSA; visualization: SA, VTN, JBC, KSA; supervision: JBC, KSA; project administration: JBC, KSA; funding acquisition: JBC, KSA.Conflicts of interest
The authors declare that a patent application related to the work reported in this manuscript is pending. K. S. A. and J. B. C. are cofounders of FlexBiotech, a POC diagnostics company.Acknowledgements
This work was supported by NCI Affordable Care Technologies Grants UH3CA211415 and U01 CA281660, the Arizona Department of Health Services, and the Flinn Foundation.Notes and references
- S. C. Tan and B. C. Yiap, BioMed Res. Int., 2009, 2009, 574398 CrossRef PubMed.
- M. N. Emaus, M. Varona, D. R. Eitzmann, S.-A. Hsieh, V. R. Zeger and J. L. Anderson, TrAC, Trends Anal. Chem., 2020, 130, 115985 CrossRef CAS.
- M. L. Everitt, A. Tillery, M. G. David, N. Singh, A. Borison and I. M. White, Anal. Chim. Acta, 2021, 1146, 184–199 CrossRef CAS PubMed.
- A. Hosseini, R. Pandey, E. Osman, A. Victorious, F. Li, T. Didar and L. Soleymani, ACS Sens., 2020, 5, 3328–3345 CrossRef CAS PubMed.
- D. R. Peaper, C. A. Kerantzas and T. J. Durant, Clin. Biochem., 2023, 117, 94–101 CrossRef CAS PubMed.
- J. Y. Zhang, A. T. Bender, D. S. Boyle, P. K. Drain and J. D. Posner, Analyst, 2021, 146, 2449–2462 RSC.
- B. D. Kevadiya, J. Machhi, J. Herskovitz, M. D. Oleynikov, W. R. Blomberg, N. Bajwa, D. Soni, S. Das, M. Hasan and M. Patel, et al. , Nat. Mater., 2021, 20, 593–605 CrossRef CAS PubMed.
- T. W. Pittman, D. B. Decsi, C. Punyadeera and C. S. Henry, Theranostics, 2023, 13, 1091 CrossRef CAS PubMed.
- N. Ali, R. d. C. P. Rampazzo, A. D. T. Costa and M. A. Krieger, BioMed Res. Int., 2017, 2017, 9306564 Search PubMed.
- M. Zamani, A. L. Furst and C. M. Klapperich, Acc. Chem. Res., 2021, 54, 3772–3779 CrossRef CAS PubMed.
- K. To, C. Yip, C. Lai, C. Wong, D. Ho, P. Pang, A. Ng, K.-H. Leung, R. Poon and K.-H. Chan, et al. , Clin. Microbiol. Infect., 2019, 25, 372–378 CrossRef CAS PubMed.
- C. S. Laxton, C. Peno, A. M. Hahn, O. M. Allicock, S. Perniciaro and A. L. Wyllie, Lancet Microbe, 2023, 4, e837–e850 CrossRef CAS PubMed.
- M. Goh, C. Joy, A. N. Gillespie, Q. R. Soh, F. He and V. Sung, Pediatr. Res., 2024, 95, 508–531 CrossRef PubMed.
- A. A. Chen, T. Gheit, M. Stellin, V. Lupato, G. Spinato, R. Fuson, A. Menegaldo, S. Mckay-Chopin, E. Dal Cin and G. Tirelli, et al. , Oral Oncol., 2017, 75, 106–110 CrossRef CAS PubMed.
- T. W. Pittman, D. B. Decsi, C. Punyadeera and C. S. Henry, Theranostics, 2023, 13, 1091 CrossRef CAS PubMed.
- Y. Cui, H.-S. Kim, E. S. Cho, D. Han, J. A. Park, J. Y. Park, W. Nam, H. J. Kim, I.-H. Cha and Y. H. Cha, PLoS One, 2021, 16, e0256979 CrossRef CAS PubMed.
- C. B. Vogels, A. E. Watkins, C. A. Harden, D. E. Brackney, J. Shafer, J. Wang, C. Caraballo, C. C. Kalinich, I. M. Ott and J. R. Fauver, et al. , Med, 2021, 2, 263–280 CrossRef CAS PubMed.
- K. D. Tang, L. Menezes, K. Baeten, L. J. Walsh, B. C. Whitfield, M. D. Batstone, L. Kenny, I. H. Frazer, G. C. Scheper and C. Punyadeera, Biomolecules, 2020, 10, 223 CrossRef CAS PubMed.
- C. E. Weeramange, Z. Liu, G. Hartel, Y. Li, S. Vasani, J. Langton-Lockton, L. Kenny, L. Morris, I. Frazer and K. D. Tang, et al. , J. Mol. Diagn., 2021, 23, 1334–1342 CrossRef PubMed.
- K. D. Tang, S. Vasani, T. Taheri, L. J. Walsh, B. G. Hughes, L. Kenny and C. Punyadeera, Front. Oncol., 2020, 10, 408 CrossRef PubMed.
- A. Wozniak, A. Cerda, C. Ibarra-Henriquez, V. Sebastian, G. Armijo, L. Lamig, C. Miranda, M. Lagos, S. Solari and A. M. Guzmán, et al. , Sci. Rep., 2020, 10, 16608 CrossRef CAS PubMed.
- V. Genoud, M. Stortz, A. Waisman, B. G. Berardino, P. Verneri, V. Dansey, M. Salvatori, F. Remes Lenicov and V. Levi, PLoS One, 2021, 16, e0247792 CrossRef CAS PubMed.
- J. Qian, S. A. Boswell, C. Chidley, Z.-x. Lu, M. E. Pettit, B. L. Gaudio, J. M. Fajnzylber, R. T. Ingram, R. H. Ward and J. Z. Li, et al. , Nat. Commun., 2020, 11, 5920 CrossRef CAS PubMed.
- D. R. Solovchuk, I. H. Boyaci, U. Tamer, N. Sahiner and D. Çetin, Microchem. J., 2023, 189, 108479 CrossRef.
- B. A. Rabe and C. Cepko, Proc. Natl. Acad. Sci. U. S. A., 2020, 117, 24450–24458 CrossRef CAS PubMed.
- M. G. Mason and J. R. Botella, Nat. Protoc., 2020, 15, 3663–3677 CrossRef CAS PubMed.
- K. Malpartida-Cardenas, J. Baum, A. Cunnington, P. Georgiou and J. Rodriguez-Manzano, Analyst, 2023, 148, 3036–3044 RSC.
- I. Michael, D. Kim, O. Gulenko, S. Kumar, S. Kumar, J. Clara, D. Y. Ki, J. Park, H. Y. Jeong and T. S. Kim, et al. , Nat. Biomed. Eng., 2020, 4, 591–600 CrossRef CAS PubMed.
- D. Baumgartner, B. Johannsen, M. Specht, J. Lüddecke, M. Rombach, S. Hin, N. Paust, F. von Stetten, R. Zengerle and C. Herz, et al. , Biosensors, 2021, 11, 423 CrossRef PubMed.
- S. Mondal, N. Feirer, M. Brockman, M. A. Preston, S. J. Teter, D. Ma, S. A. Goueli, S. Moorji, B. Saul and J. J. Cali, Sci. Total Environ., 2021, 795, 148834 CrossRef CAS PubMed.
- B. S. Batule, Y. Seok and M.-G. Kim, Biosens. Bioelectron., 2020, 151, 111998 CrossRef CAS PubMed.
- M. Mahalanabis, J. Do, H. ALMuayad, J. Y. Zhang and C. M. Klapperich, Biomed. Microdevices, 2010, 12, 353–359 CrossRef CAS PubMed.
- S. Li, C. Wan, Y. Xiao, C. Liu, X. Zhao, Y. Zhang, H. Yuan, L. Wu, C. Qian and Y. Li, et al. , Lab Chip, 2024, 24, 3158–3168 RSC.
- S. Shijo, D. Tanaka, T. Sekiguchi, J.-i. Ishihara, H. Takahashi, M. Kobayashi and S. Shoji, Micromachines, 2023, 14, 706 CrossRef PubMed.
- M. L. Cunha, S. S. da Silva, M. C. Stracke, D. L. Zanette, M. N. Aoki and L. Blanes, Anal. Chem., 2021, 94, 41–58 CrossRef PubMed.
- Z. Li, X. Xu, D. Wang and X. Jiang, TrAC, Trends Anal. Chem., 2023, 158, 116871 CrossRef CAS PubMed.
- D. Obino, M. Vassalli, A. Franceschi, A. Alessandrini, P. Facci and F. Viti, Sensors, 2021, 21, 3058 CrossRef CAS PubMed.
- M. M. Islam and D. Koirala, Anal. Chim. Acta, 2022, 1209, 339338 CrossRef CAS PubMed.
- P. Rodriguez-Mateos, B. Ngamsom, C. Walter, C. E. Dyer, J. Gitaka, A. Iles and N. Pamme, Anal. Chim. Acta, 2021, 1177, 338758 CrossRef CAS PubMed.
- D. Das, C.-W. Lin and H.-S. Chuang, Biosensors, 2022, 12, 1068 CrossRef CAS PubMed.
- W. Witkowska McConnell, C. Davis, S. R. Sabir, A. Garrett, A. Bradley-Stewart, P. Jajesniak, J. Reboud, G. Xu, Z. Yang and R. Gunson, et al. , Nat. Commun., 2021, 12, 6994 CrossRef CAS PubMed.
- G. Papadakis, A. K. Pantazis, N. Fikas, S. Chatziioannidou, V. Tsiakalou, K. Michaelidou, V. Pogka, M. Megariti, M. Vardaki and K. Giarentis, et al. , Sci. Rep., 2022, 12, 3775 CrossRef CAS PubMed.
- S. M. Lee, H. K. Balakrishnan, E. H. Doeven, D. Yuan and R. M. Guijt, Biosensors, 2023, 13, 980 CrossRef CAS PubMed.
- T. Poeckh, S. Lopez, A. O. Fuller, M. J. Solomon and R. G. Larson, Anal. Biochem., 2008, 373, 253–262 CrossRef CAS PubMed.
- L. Weidner, S. Laner-Plamberger, D. Horner, C. Pistorius, J. Jurkin, M. Karbiener, E. Schistal, T. R. Kreil and C. Jungbauer, Diagnostics, 2022, 12, 1186 CrossRef CAS PubMed.
- P. Chomczynski and N. Sacchi, Nat. Protoc., 2006, 1, 581–585 CrossRef CAS PubMed.
- J. M. Chirgwin, A. E. Przybyla, R. J. MacDonald and W. J. Rutter, Biochemistry, 1979, 18, 5294–5299 CrossRef CAS PubMed.
- Y. Zhang, G. Ren, J. Buss, A. J. Barry, G. C. Patton and N. A. Tanner, Biotechniques, 2020, 69, 178–185 CrossRef CAS PubMed.
- G. Alhamid, H. Tombuloglu and E. Al-Suhaimi, Sci. Rep., 2023, 13, 5066 CrossRef CAS PubMed.
- K. J. Shaw, L. Thain, P. T. Docker, C. E. Dyer, J. Greenman, G. M. Greenway and S. J. Haswell, Anal. Chim. Acta, 2009, 652, 231–233 CrossRef CAS PubMed.
- D. Andreasen, J. U. Fog, W. Biggs, J. Salomon, I. K. Dahslveen, A. Baker and P. Mouritzen, Methods, 2010, 50, S6–S9 CrossRef CAS PubMed.
- N. Sun, C. Deng, Y. Liu, X. Zhao, Y. Tang, R. Liu, Q. Xia, W. Yan and G. Ge, J. Chromatogr. A, 2014, 1325, 31–39 CrossRef CAS PubMed.
- S. He, B. Cao, Y. Yi, S. Huang, X. Chen, S. Luo, X. Mou, T. Guo, Y. Wang and Y. Wang, et al. , Nano Sel., 2022, 3, 617–626 CrossRef CAS.
- Y. Li, S. Chen, N. Liu, L. Ma, T. Wang, R. N. Veedu, T. Li, F. Zhang, H. Zhou and X. Cheng, et al. , BioTechniques, 2020, 68, 191–199 CrossRef CAS PubMed.
- M. A. Brown, F. Vila, M. Sterrer, S. Thuürmer, B. Winter, M. Ammann, J. J. Rehr and J. A. van Bokhoven, J. Phys. Chem. Lett., 2012, 3, 1754–1759 CrossRef CAS PubMed.
- R. Bock, Methods Enzymol., 1967, 12, 224–228 CrossRef.
- A. Kuffel, A. Gray and N. N. Daeid, Int. J. Leg. Med., 2021, 135, 63–72 CrossRef PubMed.
- I. B. Santarino, S. C. B. Oliveira and A. M. Oliveira-Brett, Electrochem. Commun., 2012, 23, 114–117 CrossRef CAS.
- J. C. Han and G. Y. Han, Anal. Biochem., 1994, 220, 5–10 CrossRef CAS PubMed.
- A. J. Fischer, M. I. Pino-Argumedo, B. M. Hilkin, C. R. Shanrock, N. D. Gansemer, A. L. Chaly, K. Zarei, P. D. Allen, L. S. Ostedgaard and E. A. Hoffman, et al. , JCI Insight, 2019, 4, e124863 CrossRef PubMed.
- N. Ali, R. d. C. P. Rampazzo, A. D. T. Costa and M. A. Krieger, BioMed Res. Int., 2017, 2017, 9306564 Search PubMed.
- P. Pandit, J. Cooper-White and C. Punyadeera, Clin. Chem., 2013, 59, 1118–1122 CrossRef CAS PubMed.
- A. T. Bender, B. P. Sullivan, L. Lillis and J. D. Posner, J. Mol. Diagn., 2020, 22, 1030–1040 CrossRef CAS PubMed.
- M. Sidstedt, P. Rådström and J. Hedman, Anal. Bioanal. Chem., 2020, 412, 2009–2023 CrossRef CAS PubMed.
- P. J. Snijders, A. J. van den Brule and C. J. Meijer, J. Pathol., 2003, 201, 1–6 CrossRef PubMed.
- D. A. Bartholomeusz, R. W. Boutté and J. D. Andrade, J. Microelectromech. Syst., 2005, 14, 1364–1374 Search PubMed.
- S. Arockiam, Y. H. Cheng, P. M. Armenante and S. Basuray, Chem. Eng. Res. Des., 2021, 167, 303–317 CrossRef CAS.
- A. Neuville, L. Renaud, T. T. Luu, M. W. Minde, E. Jettestuen, J. L. Vinningland, A. Hiorth and D. K. Dysthe, Lab Chip, 2017, 17, 293–303 RSC.
- S. Arockiam, V. T. Nguyen, C. Anderson, M. Knappenberger, K. S. Anderson and J. B. Christen, Colorimetric On-Chip Detection of Human Papillomavirus for Point-Of-Care Settings, In 2024 IEEE Healthcare Innovations and Point of Care Technologies (HI-POCT), IEEE, 2024 Search PubMed.
- V. T. Nguyen, S. Arockiam, C. Anderson, M. Knappenberger, K. S. Anderson and J. B. Christen, Low-Cost Microfluidic Fluorescence-Based Assay for Screening Viral Diseases at the Point of Care, In 2024 IEEE Healthcare Innovations and Point of Care Technologies (HI-POCT), IEEE, 2024 Search PubMed.
- W. Han, J. Shin and J. H. Shin, et al. , Sens. Actuators, B, 2023, 375, 132948 CrossRef.
- A. Bordigoni, A. Motte, H. Tissot-Dupont, P. Colson and C. Desnues, Sci. Rep., 2021, 11, 4039 CrossRef CAS PubMed.
- S. Jeong, E. González-Grandío, N. Navarro, R. L. Pinals, F. Ledesma, D. Yang and M. P. Landry, ACS Nano, 2021, 15, 10309–10317 CrossRef CAS PubMed.
Footnote |
| † Electronic supplementary information (ESI) available. See DOI: https://doi.org/10.1039/d4ay02201g |
| This journal is © The Royal Society of Chemistry 2025 |