
 Open Access Article
 This Open Access Article is licensed under a
 Creative Commons Attribution 3.0 Unported Licence
Electroanalysis of meat discoloration: beef sarcoplasm extract with storage time
Silan
Bhandari
a,
Sachinthani A.
Devage
a,
Rishav
Kumar
b,
Ranjith
Ramanathan
*b and
Sadagopan
Krishnan
 *a
*a
aDepartment of Chemistry, Oklahoma State University, Stillwater, OK 74078, USA. E-mail: gopan.krishnan@okstate.edu
bDepartment of Animal and Food Sciences, Oklahoma State University, Stillwater, OK 74078, USA. E-mail: ranjith.ramanathan@okstate.edu
First published on 17th June 2025
Abstract
Electrochemical techniques offer a promising approach for monitoring redox-active biomolecules involved in meat discoloration. Building on our previous identification of characteristic redox peaks in beef extracts associated with myoglobin oxidation (S. B. Kasthuri Dias, S. Bhandari, S. A. Devage, J. A. Avery, R. Kumar, R. Ramanathan and S. Krishnan, J. Am Chem. Soc., 2024, 146, 30728–30732, DOI: 10.1021/jacs.4c09375), we present an extended investigation into electrochemical changes over longer meat storage times. Square wave voltammetry revealed frequency-dependent peak potential shifts over a period of 9 days, indicative of a quasi-reversible electron transfer process. Spiking experiments with purified myoglobin in the meat extract confirmed its predominant contribution to the observed voltammetric signals. After 9 days of storage, peak currents at −0.26 V (redox-active myoglobin heme center) and +0.38 V (overall oxidation of meat components) increased by 68.9% and 270.3%, respectively, compared to relative changes of 37.3% and 61.7% in a shorter-duration study. These electrochemical findings showed a strong correlation with spectrophotometrically determined metmyoglobin accumulation (r = 0.98, P < 0.001). The results provide insight into redox transformations during meat spoilage and contribute to the development of electrochemical tools for evaluating meat quality.
1. Introduction
As global meat consumption is projected to surge by 72% by 2030, maintaining food quality and developing advanced sensor technologies to predict quality loss have become critical priorities for the food industry.1 Our research on measuring meat color and freshness, therefore, holds significant potential for maximizing the benefits of producing animal proteins and has the power to revolutionize the meat industry.2 Meat discoloration affects its quality, and consumers select or deny meat products based on their appearance and surface color.3 Myoglobin, a key protein pigment in meat color, exists in three chemical states: deoxymyoglobin (which gives the meat a purplish-pink hue), oxymyoglobin (responsible for the bright red color of fresh meat), and metmyoglobin (which causes meat to turn brown as it oxidizes).4 This protein is crucial for understanding and detecting meat discoloration as its chemical states directly influence the color of the meat.5,6 The electrochemical method we developed is designed to detect these changes in myoglobin states (negative potential region) along with the overall meat oxidation signals (positive potential region), providing a rapid and accurate method for assessing meat color.3,7 The major biochemical processes in meat, such as protein and lipid oxidation, oxygen consumption, microbial growth, and metmyoglobin-reducing activity, affect the meat color.7,8 The best practice for safe meat consumption is to store meat products within the refrigeration temperature range.9,10 The quality of meat can be preserved at refrigerated temperatures between 0 and 4 °C.10Postmortem muscle color is affected by the storage temperature, length of storage, meat pH, packaging, light, and display time.11,12 During storage, meat undergoes proteolysis, which alters the concentration and distribution of proteins.13–15 This phenomenon causes meat discoloration.16 When the storage period increases, the metmyoglobin concentration grows steadily on the meat surface by diminishing the oxymyoglobin layer, and ultimately, surface discoloration occurs.3,11
The traditional subjective method of meat color evaluation by human panelists is a tedious process.3 This subjectivity can lead to inconsistencies in color assessment, making it difficult to ensure the quality and safety of meat products. The other traditional methods widely used for determining the composition and quality of meat components include high-performance liquid chromatography (HPLC), liquid chromatography–mass spectrometry (LC-MS), and gas chromatography–mass spectrometry (GC-MS).17–19 Though these methodologies offer valid and reliable analysis, they are expensive and time-consuming, demand high technical skills, and require routine maintenance. Hence, they are not widely available for the vast majority of researchers and end users, and in resource-limited settings.20,21 Fourier transform infrared (FTIR) spectroscopy measurements also yield spectra that are affected by scattering effects and instrumental noise.22,23 To get chemical information from complex meat FTIR spectra, various multivariate techniques such as partial least squares (PLS), support vector machine (SVM), K-nearest neighbor (KNN), and principal component analysis (PCA) are commonly used.22 The beef meat quality changes due to postmortem aging were also studied using nuclear magnetic resonance (NMR) spectroscopy-based profiling of meat using multivariate methods (PCA, OPLS models).24 However, the assignment of NMR and FTIR data signals is not simple, and data processing requires time and high-level technical expertise.22,24,25 The imaging techniques and spectrophotometry used for meat color detection are valuable and reliable. Still, they are cumbersome and costly, require extended sample preparation time, and depend on highly skilled individuals and longer processing times.22,25,26
The need for more objective, simple-to-maintain, and simple-to-use evaluation methods underscores the importance of our research and the potential impact of novel electrochemical tools on the meat science industry. The electrochemical device we developed, however, is not only simple and cost-effective but also highly accurate and selective for probing molecular targets in complex samples. Its label-free and rapid nature, with a rapid 10- to 20-second scan duration sufficient for measuring meat redox changes upon discoloration, ensures its practicality. These attributes make it promising for practical and handheld portable electrochemical devices for the food industry, particularly for point-of-use applications, where rapid and accurate analysis is crucial.27–29
In our recent report, we identified electrochemical signature peaks during meat discoloration using beef sarcoplasm (meat muscle) extract coated on polished high-purity graphite electrodes at 37 °C, monitored for 4 hours. These peaks, which represent the changes in myoglobin states and meat oxidation signals, are crucial for understanding and detecting meat discoloration.27 In the present study, we investigated the electrochemical characteristics of beef sarcoplasm discoloration during longer storage at 4 °C for over nine days in a refrigerator (see the schematic in Fig. 1 for the approach and experimental design) by coating the stored extract at different durations on pyrolytic graphite electrodes. We designed a voltammetric device that monitors both the current signal at specific potentials and shifts in peak potentials with storage time. The 9-day duration was chosen because consumer acceptability of retail beef products significantly decreases when the amount of metmyoglobin present on the surface exceeds 40%.3 Our findings provide valuable insights for developing practical and handheld electrochemical tools for meat color measurement, particularly for point-of-use applications. In our study, metmyoglobin accumulation was 38% on day 7, 50% on the 8th day, and 61% on the 9th day of storage, which also exhibited visual discoloration. Therefore, a 9-day study could be relevant for discoloration studies when using meat muscle extract. We thus probed the biomolecular changes taking place on the meat surface by using an electrochemical tool that responds to the relative levels of oxymyoglobin, which gives meat its cherry-red color, and metmyoglobin, which causes the meat to turn brown during discoloration.
 | ||
| Fig. 1 Schematic flow diagram showing the electrochemical and spectrophotometric measurements of beef sarcoplasm extract with storage time. The extracted beef sarcoplasm was stored at 4 °C in a laboratory refrigerator in a closed centrifuge tube from day 0 to day 9. The stored beef sarcoplasm was centrifuged, and 10 μL of the supernatant solution was applied to a pyrolytic graphite electrode and dried for square wave voltammetry analysis. The voltammogram signals measured on successive days correlated with the changes in metmyoglobin and oxymyoglobin, as metmyoglobin levels increased and oxymyoglobin decreased. | ||
Our study employed square wave voltammetry (SWV), a pulse voltammetric method recognized for its rapid response and enhanced sensitivity. It largely eliminates non-faradaic charging currents between the potential pulses before the detection time points at the end of the forward and reverse pulses, and the sum of the two currents is measured as the difference current. It provides an improved signal-to-noise ratio compared to traditional linear and cyclic potential-time-based electrochemical techniques, wherein non-faradaic charging currents co-exist with the analytical faradaic currents.30,31 Using the advantages of the SWV technique, we successfully observed both current increases at the identified peaks and a shift in peak potentials in the high oxidation potential region with increasing storage time of beef sarcoplasm extract. We also performed characterization of the pyrolytic graphite surface coated with beef sarcoplasm using FTIR spectroscopy and scanning electron microscopy (SEM). We conducted frequency-dependent experiments to study the response of the peak current and peak shift with respect to increasing frequency as a characteristic of a quasireversible process. Moreover, we performed a spiking experiment to electrochemically mark the contribution of myoglobin to discoloration in beef sarcoplasm. Furthermore, we conducted spectrophotometric measurements in parallel with electrochemical scans on the same samples to obtain a quantitative correlation with respect to oxy- and met-myoglobin levels and their changes. This comprehensive approach provides a reliable and robust method for assessing meat discoloration.
2. Experimental
2.1 Chemicals and apparatus
Mixed phosphate buffer (0.1 M, potassium phosphate monobasic and potassium phosphate dibasic), pyrolytic graphite disc electrodes, a laboratory refrigerator (Fisher Scientific, model FBV18CPSA), a potentiostat (model CHI 6017), silicon carbide (SiC-grit 320, Extec Corp., CT, USA), an Eppendorf 5424 centrifuge for sample centrifugation, and a pH meter for preparing buffer solutions (Fisher Scientific, Model: Ab 15 Plus) were used. For absorbance, a Cary 100 spectrophotometer version 10.0 was used.2.2 Extraction and storage of beef sarcoplasm
10 g of beef meat, visually without fat and connective tissues, was homogenized with 30 mL of pH 5.6 phosphate buffer for 30 seconds. The homogenized meat sample was collected and poured through a double-layered cheesecloth into a beaker. The filtrate was collected in 1.5 mL Eppendorf tubes for centrifugation at 14![[thin space (1/6-em)]](https://www.rsc.org/images/entities/char_2009.gif) 000 × g for 5 minutes. After centrifugation, the supernatant was collected and filtered again through double-layered cheesecloth, then collected in another beaker to obtain a clear beef sarcoplasm. The sarcoplasmic extract was stored at 4 °C in a laboratory refrigerator from day 0 to day 9. The beef extract was centrifuged at 4000 rpm for 4 minutes prior to each measurement. The control (day 0) measurement was performed without storage.
000 × g for 5 minutes. After centrifugation, the supernatant was collected and filtered again through double-layered cheesecloth, then collected in another beaker to obtain a clear beef sarcoplasm. The sarcoplasmic extract was stored at 4 °C in a laboratory refrigerator from day 0 to day 9. The beef extract was centrifuged at 4000 rpm for 4 minutes prior to each measurement. The control (day 0) measurement was performed without storage.
2.3 Fourier transform infrared (FTIR) spectroscopy
The FTIR spectra were obtained using a Nicolet™ iS50 FTIR spectrometer with a resolution of 4 cm−1. Sixty-four scans were collected and averaged to obtain a good signal-to-noise ratio. The beef sarcoplasm was coated on a polyethyleneimine (PEI)- adsorbed pyrolytic graphite disc and characterized on the surface of an ATR germanium crystal to measure the FTIR spectra, ranging from 600 to 4000 cm−1. Similarly, the FTIR spectra of the PEI-coated and polished graphite discs were also obtained.2.4 Scanning electron microscopy (SEM) characterization of the electrodes
The surface morphologies of bare, PEI-coated, and beef sarcoplasm-coated PEI-adsorbed pyrolytic graphite disks were characterized by scanning electron microscopy (SEM, Model: FEI Quanta 600FE). Low-magnification (500×) and high-magnification (2500×) images were acquired using an accelerating voltage of 5 kV and pressure of 0.35 Torr.2.5 Electrochemical measurements
For the electrochemical measurements, the square wave voltammetry technique was conducted on a standard three-electrode CH potentiostat. The three-electrode system consisted of a pyrolytic graphite disk electrode (geometric area 0.28 cm2) as the working electrode, an Ag/AgCl (1 M KCl) electrode as the reference electrode, and a Pt wire as the counter electrode. The pyrolytic graphite electrodes (n = 3) were first polished using SiC-grit paper (P320), sonicated for 30 seconds, washed with deionized water, and finally dried with ultrapure nitrogen gas. On the dry and clean electrodes, 10 μL of the beef sarcoplasm sample was dry-coated by leaving for 15–20 minutes to facilitate physisorption and coating on the graphite surface at room temperature (23 °C). Under similar conditions, 10 μL of purified beef myoglobin (n = 4, 1.3 mg mL−1, pH 5.6) was also used for coating a pyrolytic graphite surface. The extract-coated electrodes were measured using highly sensitive square wave voltammetry followed by spectrophotometric measurement of the same beef extract solution. Separate meat extract film electrodes made under identical conditions were used for scanning in the positive (0–1.2 V) and negative (0 V to −0.65 V) potential ranges to obtain the oxidation and reduction characteristics, respectively. The conditions used in the square wave voltammetry were a frequency of 15 Hz, a step height of 4 mV, and a pulse height of 25 mV.2.6 Storage and UV measurements of beef sarcoplasm
For UV measurements, two standard spectrophotometer cuvettes (1 cm × 1 cm × 4.5 cm) filled with centrifuged beef sarcoplasm extract supernatant solution (1 mL) or the blank solution (1 mL, pH 5.6 phosphate buffer) (double beam instrument) were used for measuring the absorbance of the samples. The absorbance of the sample was measured over a wavelength range of 400 nm to 700 nm. The absorbance peaks noted at 503 and 582 nm indicate a relative increase in metmyoglobin and a decrease in oxymyoglobin during the storage period (days 0 to 9), respectively. A picture of the beef sarcoplasm displaying discoloration was taken using a MIUI Global 12.5.6 version mobile phone.3. Results and discussion
3.1 FTIR spectral analysis
In Fig. 2, the ATR-FTIR spectra of beef sarcoplasm coated on a PEI-adsorbed pyrolytic graphite electrode reveal absorption bands at 1650 and 1540 cm−1, respectively, which correspond to amide I and II of protein amino groups.22,25 The 1650 cm−1 band is related to the vibration of the N–H bond and C![[double bond, length as m-dash]](https://www.rsc.org/images/entities/char_e001.gif) C (alkene) stretching vibration, whereas 1540 cm−1 is associated with N–H bending and C–H stretching vibrations. Moreover, the stretching vibrations of O–H and N–H bonds are represented by the absorption bands between 3200 and 3500 cm−1. The protein amino acids are linked with the N–H bonds. A wide variety of bands can be seen in the fingerprint region, which is between 1500 and 1000 cm−1. This wavenumber range encompasses a variety of vibrations, including C–O, C–C, and C–N single bond stretching, as well as C–H bending vibrations.22,25 The FTIR spectra of PEI-coated and polished graphite discs were also measured, and distinctive peaks at 1470 and 1580 cm−1 represent the symmetric and asymmetric N–H bending absorption bands, respectively.32,33
C (alkene) stretching vibration, whereas 1540 cm−1 is associated with N–H bending and C–H stretching vibrations. Moreover, the stretching vibrations of O–H and N–H bonds are represented by the absorption bands between 3200 and 3500 cm−1. The protein amino acids are linked with the N–H bonds. A wide variety of bands can be seen in the fingerprint region, which is between 1500 and 1000 cm−1. This wavenumber range encompasses a variety of vibrations, including C–O, C–C, and C–N single bond stretching, as well as C–H bending vibrations.22,25 The FTIR spectra of PEI-coated and polished graphite discs were also measured, and distinctive peaks at 1470 and 1580 cm−1 represent the symmetric and asymmetric N–H bending absorption bands, respectively.32,33
 | ||
| Fig. 2 FTIR spectra of (a) polished pyrolytic graphite disk, (b) PEI-coated pyrolytic graphite surface, and (c) beef sarcoplasm adsorbed onto the PEI-coated pyrolytic graphite disk surface. | ||
3.2 Microscopic characterization of the graphite surface coated with a beef sarcoplasmic film
The scanning electron micrographs of bare polished, PEI-adsorbed, and beef sarcoplasm-coated PEI-adsorbed pyrolytic graphite disk electrodes are shown in Fig. 3(A–F). The polished pyrolytic graphite disk shows an uneven surface morphology, showing layers of graphite sheets under high magnification conditions (2500×). The PEI-coated graphite disk exhibits slight uniformity on its surface due to the adsorption of the polymer. The surface morphology is even more uniform after the adsorption of a layer of beef sarcoplasm on the PEI-coated pyrolytic electrode disk. The black crystal-like features on the beef sarcoplasm adsorbed surface, as seen in Fig. 3(E and F), may be due to the crystals of phosphate buffer salt (as the beef sarcoplasm sample is prepared by dissolving it in a pH 5.6 mixed phosphate buffer solution). | ||
| Fig. 3 Low and high magnification of SEM images of a polished pyrolytic graphite disk (A, B), 10 μL (1 mg mL−1) of polyethyleneimine (PEI) adsorbed on the graphite disk (C, D), and 10 μL of beef sarcoplasm adsorbed on the PEI-coated graphite disks (E, F). | ||
3.3 Electrochemistry of meat storage redox signal changes
We used pyrolytic graphite electrodes for the adsorption of meat extract films and electrochemical measurements.34In this work, the biochemically reported protein and lipid oxidation processes, as well as the metmyoglobin-reducing activity, which play crucial roles in meat discoloration,12,35 were monitored electrochemically. During storage from day 0 to day 9, noticeable voltammetric peaks were observed at 0.38 ± 0.02 V and 0.93 ± 0.03 V vs. Ag/AgCl in the positive potential range (0–1.2 V) and at −0.26 ± 0.01 V vs. Ag/AgCl in the negative potential range (0.1 to −0.65 V) as shown in Fig. 4A and 5A, respectively. A signal response was also observed in the positive potential range at +0.78 V vs. Ag/AgCl, as shown in Fig. 4A.
 | ||
| Fig. 4 Square wave voltammograms of a beef sarcoplasm extract film (10 μL) coated on a pyrolytic working electrode at (A) +0.38 ± 0.02 V, +0.78 ± 0.02, and +0.93 ± 0.03 V vs. Ag/AgCl (average ± SD, n = 3). The purified beef myoglobin peak at 0.85 ± 0.02 shows its contribution in the positive potential region. The polished bare pyrolytic graphite electrode does not exhibit any peaks in the same potential region (dotted line voltammograms), confirming that the peaks originate from the meat extract film coated on the electrode surface. (B) Peak current (Ip) is shown for the observed voltammograms in the positive potential region (day 0 to day 9). The square wave voltammetric parameters were a frequency of 15 Hz, a step height of 4 mV, a pulse height of 25 mV, and a pH 5.6 buffer (at 37 °C). | ||
 | ||
| Fig. 5 Square wave voltammograms of a beef sarcoplasm extract film (10 μL) coated on a pyrolytic working electrode in pH 5.6 buffer at (A) −0.26 ± 0.01 V vs. Ag/AgCl (average ± SD, n = 3). The polished bare pyrolytic graphite electrode does not exhibit any peaks in the same potential regions, confirming that the peaks originate from the meat extract film coated on the electrode surface. (B) Peak current (Ip) is shown for the observed voltammograms in the negative potential region (day 0 to day 9). (C) The purified beef myoglobin film (10 μL) without storage was coated on the electrode surface and, exhibiting a peak potential of −0.22 ± 0.02 V vs. Ag/AgCl (n = 4) at the heme center. The square wave voltammetry parameters were a 15 Hz frequency, a 4 mV step height, and a 25 mV pulse height. | ||
These observed peaks at their respective redox potentials showed an increase in current over time, as shown in Fig. 4B (at 0.38 V vs. Ag/AgCl) and Fig. 5B (at −0.26 V vs. Ag/AgCl). Polished bare pyrolytic graphite electrodes with no coated meat extract under the same experimental conditions did not show any peaks (dotted-line voltammograms are shown for positive and negative regions, Fig. 4A and 5A). The peak signals originating from the sarcoplasmic film on the pyrolytic graphite surface, showing peak current response, confirmed that square wave voltammetry is highly sensitive to the beef sarcoplasm discoloration process. We observed a positive correlation (r = 0.97 and r = 0.94) between storage days (0–9 days) and the peak currents in the positive potential (at 0.38 V vs. Ag/AgCl) and negative potential regions (at −0.26 V vs. Ag/AgCl), respectively.
The positive potential peak signals measure the oxidative current from the biochemical processes of protein and lipid oxidation in meat during storage periods.35,36 The negative redox peak measures the metmyoglobin reduction current, showing the electrocatalytic activity in the presence of oxygen, typical of heme proteins.37,38 The electrochemical activity of purified beef myoglobin under the same experimental conditions in the negative potential range, as shown in Fig. 5C, confirmed the metmyoglobin reduction activity. The observed peak signal for purified beef myoglobin, at −0.22 ± 0.02 V vs. Ag/AgCl, validated that the negative voltammetric peaks recorded in beef sarcoplasm were due to metmyoglobin present in the complex beef sarcoplasmic extract. The discovered peak potential (−0.26 V ± 0.01 vs. Ag/AgCl) for beef sarcoplasm extract showed a slight shift from the peak potential of the purified beef myoglobin free of the extract components and an associated shift in potential in beef sarcoplasm.8,27,39
In addition to the peak current increase at the respective potentials discussed above, we also observed for the first time a significant peak potential (Ep) shift (87 ± 8 mV within 9 days) with increased storage time from day 0 to day 9 for the beef meat extract-coated electrodes from the initial +0.89 V to +0.97 V vs. Ag/AgCl, as depicted in Fig. 6A and B. For the lower positive potential peaks at +0.38 V and +0.78 V, the Ep shift was not as prominent as the +0.9 V-centered peak (Fig. 6B), suggesting slower oxidation at the highest positive potential value. The shifts in Ep with the number of storage days suggest an increasing extent of oxidation and a likely greater deterioration in quality at a longer meat storage time.40–42 This should be treated as a qualitative observation, as the meat extract is studied here and not the direct meat pieces.
 | ||
| Fig. 6 (A) Voltammograms showing the shift in peak potential (Ep) from +0.89 V to +0.97 V with storage days arising from the oxidizable biocomponents in the sarcoplasmic extract, such as proteins and lipids.40 (B) The noticeable Ep shifts (storage days 1, 2, 6, and 9) with respect to the day 0 fresh sample were compared among different redox peaks at +0.38 V, +0.78 V, and +0.93 V vs. Ag/AgCl, indicating a higher peak shift in the +0.93 ± 0.03 V region. | ||
3.4 Square-wave frequency-dependent study of beef sarcoplasm
A frequency-dependent study of beef extract using the square wave technique was conducted in both the positive and negative potential regions by using separate electrodes as shown in Fig. 7(A–D). The increase in peak current at 0.38 V, 0.78 V, 0.90 V, and −0.26 V vs. Ag/AgCl, respectively, with increasing frequency from 5 to 30 Hz is shown in Fig. 7(C). Peak shifts (between 5 and 30 Hz) at 0.38 V (ΔEp = 43 ± 11 mV) and more significantly at 0.78 V (ΔEp = 81 ± 9 mV) and 0.90 V (ΔEp = 80 ± 10 mV) were observed as shown in Fig. 7(D), indicating quasi-reversible electron transfer kinetics.43,44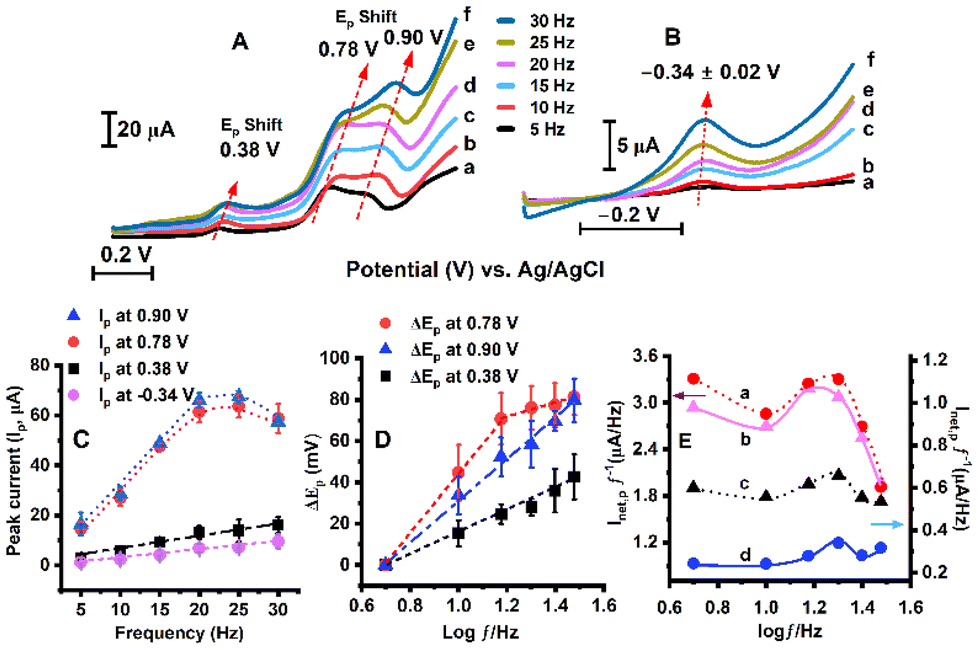 | ||
| Fig. 7 The dependence of sweep frequency (5–30 Hz labelled as a–f) on square wave voltammograms. (A) The voltammograms exhibit peak shifts and increased peak current responses at 0.38 V, 0.78 V, and 0.90 V peak potential regions with increasing frequency. (B) The square wave voltammograms in the negative potential region exhibit an increased signal response with increasing frequency in the −0.34 ± 0.02 V region. (C) The peak current (Ip) exhibits an increasing trend with increasing frequency at 0.90 V, 0.78 V, 0.38 V, and −0.34 V, respectively. (D) A plot of peak shift in positive potential regions at 0.90 V, 0.78 V, and 0.38 V with the logarithm of frequency (log10f) showing a prominent shift in the higher potential region, characteristics of quasi-reversible electrode processes.44–46 (E) A plot of frequency-normalized net peak current (Inet,p/f, at 0.90 V, 0.78 V, 0.38 V, and −0.34 V vs. Ag/AgCl represented as a, b, c, and d, respectively) with the logarithm of the frequency. (The square wave voltammetry was performed with argon purging in pH 5.6 buffer solution at 37 °C, and the parameters were 4 mV step height, 25 mV pulse height). | ||
In square wave voltammetry, the quasi-reversible maximum is used to obtain the highest signal response by synchronizing the frequency with the electron transfer rate. This indicates the existence of a redox process providing the strongest signal response with respect to the corresponding frequency maximum.47 At lower frequencies, the electrode redox system has sufficient time to reach equilibrium during each pulse, causing an increase in peak current (Ip). However, in higher frequency regions, the square wave measurement time is shorter than the electron transfer rate during the redox process. Therefore, during the current sampling by SWV, the system does not have enough time to attain equilibrium, resulting in a decrease in net peak current (Ip). This results in a parabolic response curve obtained from a plot of normalized net peak current (Inet,p/f) vs. logarithm of frequency (log f) as a characteristics of the quasi-reversible maximum.47–49
In Fig. 7(E), the relationship between the frequency-normalized net peak current (Inet,p/f) and the logarithm of frequency (log f) shows a parabolic function, which is characteristic of a “quasireversible maximum”.48,50,51 The standard heterogeneous electron transfer rate constant (ks) is calculated to estimate the kinetics of electron transfer between the electrode and the redox analyte. It is calculated using the frequency that appears at the maximum (fmax) in the parabolic curve from the given equation.48,50
| ks = ωmax·fmax |
The value of the critical kinetic parameter (ωmax) is dependent on the electron-transfer coefficient (α) and the amplitude.48,50 The standard rate constant (ks) was calculated from the given plot of Inet,p/f vs. log(f), using the critical frequency (fmax), as shown in Fig. 7(E).48,50,51 Based on the position of the quasi-reversible maximum, the standard rate constant (ks) for the beef sarcoplasm-coated redox electrode process is estimated to be ks = 23 ± 3 s−1 (for amplitude, Esw = 25 mV, and the electron transfer coefficient is assumed to be 0.1 < α < 0.9 ).48,51
3.5 Myoglobin spiking experiment
Furthermore, the spiking of myoglobin into beef extract shows concentration-dependent enhancements of peak currents at specific potentials in the beef sarcoplasm at positive potential (at 0.38 V, 0.78 V, and 0.90 V) and negative potential regions (at −0.26 V), respectively, as shown in Fig. 8A and B. The extent of the increase in peak currents at both potential regions is shown in Fig. 8C. The spiking of myoglobin and the recovery of the respective peaks of beef extract with increased peak current as compared with fresh, Mb-unspiked beef sarcoplasm prove the role of myoglobin in the beef extract from the corresponding increase in peak currents. | ||
| Fig. 8 Purified bovine myoglobin spiked beef sarcoplasm results: (a) fresh sarcoplasm with no spiked Mb but the innate extract available Mb, (b) 3 mg mL−1 Mb prepared in the extract (0.75 mg of solid bovine Mb was dissolved in 250 μL of the sarcoplasm extract). Similarly, (c) 8 mg mL−1 and (d) 16 mg mL−1 solutions were prepared in the extract. 10 μL of the prepared extract (pH 5.6 phosphate buffer) was coated on the surface of pyrolytic graphite electrodes. Square wave voltammetry was performed in (A) the positive potential region and (B) the negative potential region using separate electrodes for each region to avoid intermixing redox processes that may complicate the analysis or suppress peaks in either region. (C) The peak current change (ΔIp) plot of spiked beef extracts when compared with fresh beef sarcoplasm, with no spiked Mb other than its innate Mb presence. The square wave voltammetry parameters were a 15 Hz frequency, a 4 mV step height, and a 25 mV pulse height, with conditions of oxygen purging in a pH 5.6 buffer solution at 37 °C. | ||
3.6 Spectrophotometric measurements
In parallel with the electrochemical measurements, spectrophotometric measurements of the same samples were conducted on successive storage days as a validation experiment to quantify the relative amounts of oxymyoglobin and metmyoglobin (Fig. 9A and B). As seen in the picture in Fig. 9C, the detected redox peaks on sequential storage days suggest the browning of the beef sarcoplasmic extract. The accumulation of metmyoglobin content was strongly correlated with the intensification of peak currents over the storage days (r = 0.98, P < 0.001). In contrast, oxymyoglobin showed a significant negative relationship with peak current during the storage periods (r = −0.96 and p < 0.05) due to a decrease in the cherry-red color (Fig. 9B), as anticipated from the prior biochemical knowledge of meat discoloration. This illustrates that beef sarcoplasm is more susceptible to oxidation of myoglobin, lipids, and other proteins with an increase in the number of incubation days.52,53 | ||
| Fig. 9 (A) A plot of UV-visible absorbance vs. wavelength of centrifuged beef sarcoplasm extract supernatant solution showing wavelength positions of metmyoglobin accumulation (503 nm) and oxymyoglobin decay (544 and 582 nm) with storage time in days at 4 °C in the refrigerator. Protein sediments, formed during the discoloration, were removed, which otherwise hindered the absorbance due to incident light scattering and reflection interferences from the turbid samples. (B) Spectrophotometric measurements show an increase in metmyoglobin (503 nm) and a decrease in oxymyoglobin content with the storage period. Oxymyoglobin peaks were observed at 544 nm and 582 nm, and the wavelength of maximal absorption (582 nm) was chosen due to its greater changes for obtaining oxymyoglobin content.52 (C) Image of beef sarcoplasm showing discoloration with storage time. | ||
4. Conclusions
When fresh meat deviates from a vivid cherry-red hue, it is met with less customer approval, and it ends up being devalued or discarded.54 We demonstrate here an economical, reliable, and easy-to-use electrochemical device that provides fundamental insights into biochemical processes like oxygen consumption, protein and lipid oxidation, and metmyoglobin reduction, which affect the color of post-mortem meat. In our study, highly sensitive square wave voltammetry was employed to measure the characteristic current signal increase and positive potential shifts associated with meat storage over time.51,55 The peak current increases at the identified potentials, and the oxidation peak potential shifts with longer storage time in the most positive region, which aligns with the discoloration process. This electrochemical tool is novel and crucial for directly sensing meat discoloration and freshness, focusing on point-of-use devices to provide solutions for measuring meat color and quality. The presented work lays the foundation for the development of a handheld, portable electrochemical meat discoloration analysis system that directly monitors changes in redox peak indicators.Conflicts of interest
There are no conflicts to declare.Data availability
The article presents electrochemical square wave voltammetry and spectrophotometric data directly obtained from the instruments, which are then presented using Origin Software. All acquired raw data are available for reference at the authors’ laboratory at Oklahoma State University.Acknowledgements
This work was supported by the USDA National Institute of Food and Agriculture, AFRI project 2021-09358.References
- X. Duan, Z. Li, L. Wang, H. Lin and K. Wang, John Wiley and Sons Inc., 2023, vol. 22, pp. 430–450, DOI:10.1111/1541-4337.13074.
- J. Johnson, D. Atkin, K. Lee, M. Sell and S. Chandra, Meat Sci., 2019, 150, 40–46, DOI:10.1016/j.meatsci.2018.12.002.
- D. A. King, M. C. Hunt, S. Barbut, J. R. Claus, D. P. Cornforth, P. Joseph, Y. H. Brad Kim, G. Lindahl, R. A. Mancini, M. N. Nair, K. J. Merok, A. Milkowski, A. Mohan, F. Pohlman, R. Ramanathan, C. R. Raines, M. Seyfert, O. Sørheim, S. P. Suman and M. Weber, Meat Muscle Biol., 2023, 6, 1–81, DOI:10.22175/mmb.12473.
- S. P. Suman and P. Joseph, Annu. Rev. Food Sci. Technol., 2013, 4, 79–99, DOI:10.1146/annurev-food-030212-182623.
- J. Han, Y. Wang, Y. Wang, S. Hao, K. Zhang, J. Tian and Y. Jin, Food Mater. Res., 2024, 4, e011, DOI:10.48130/fmr-0024-0003.
- J. Ahn, I. U. Grün and A. Mustapha, Food Microbiol., 2007, 24, 7–14, DOI:10.1016/j.fm.2006.04.006.
- R. Ramanathan, M. C. Hunt, T. Price and G. G. Mafi, Adv. Food Nutr. Res., 2021, 95, 183–205, DOI:10.1016/bs.afnr.2020.08.002.
- Z. Wang, J. Tu, H. Zhou, A. Lu and B. Xu, Meat Sci., 2021, 172, 108359, DOI:10.1016/j.meatsci.2020.108359.
- S. J. James and J. B. James, Meat refrigeration, Elsevier, 2002, DOI:10.1533/9781855736535.2.231.
- J. Li, Q. Wang, R. Liang, Y. Mao, D. L. Hopkins, K. Li, X. Yang, X. Luo, L. Zhu and Y. Zhang, Meat Sci., 2024, 215, 109540, DOI:10.1016/j.meatsci.2024.109540.
- L. E. Jeremiah and L. L. Gibson, Food Res. Int., 2001, 34, 815–826, DOI:10.1016/S0963-9969(01)00104-1.
- R. A. Mancini and R. Ramanathan, Meat Sci., 2014, 98, 65–70, DOI:10.1016/j.meatsci.2014.04.007.
- P. Joseph, S. P. Suman, G. Rentfrow, S. Li and C. M. Beach, J. Agric. Food Chem., 2012, 60, 3196–3203, DOI:10.1021/jf204188v.
- M. N. Nair, S. P. Suman, M. K. Chatli, S. Li, P. Joseph, C. M. Beach and G. Rentfrow, Meat Sci., 2016, 113, 9–16, DOI:10.1016/j.meatsci.2015.11.003.
- W. Wu, X. G. Gao, Y. Dai, Y. Fu, X. M. Li and R. T. Dai, Food Res. Int., 2015, 72, 98–105, DOI:10.1016/j.foodres.2015.03.030.
- S. Song, H. Cheng, J. Park and G. D. Kim, Food Chem., 2024, 430, 137036, DOI:10.1016/j.foodchem.2023.137036.
- M. Kamankesh, A. Mollahosseini, A. Mohammadi and S. Seidi, Food Chem., 2020, 311, 125876, DOI:10.1016/j.foodchem.2019.125876.
- Y. Li, Y. Zhang, C. Kang, W. Zhao, S. Li and S. Wang, Food Chem., 2021, 342, 128240, DOI:10.1016/j.foodchem.2020.128240.
- A. J. Rascón, A. Azzouz and E. Ballesteros, Food Control, 2019, 101, 198–208, DOI:10.1016/j.foodcont.2019.02.037.
- K. M. Lee, T. J. Herrman and U. Yun, J. Cereal Sci., 2014, 59, 70–78, DOI:10.1016/j.jcs.2013.10.004.
- T. Yaseen, D. W. Sun and J. H. Cheng, Trends Food Sci. Technol., 2017, 62, 177–189, DOI:10.1016/j.tifs.2017.01.012.
- A. Dashti, Y. Weesepoel, J. Müller-Maatsch, H. Parastar, F. Kobarfard, B. Daraei and H. Yazdanpanah, Microchem. J., 2022, 181, 107735, DOI:10.1016/j.microc.2022.107735.
- H. Parastar, G. van Kollenburg, Y. Weesepoel, A. van den Doel, L. Buydens and J. Jansen, Food Control, 2020, 112, 107149, DOI:10.1016/j.foodcont.2020.107149.
- Y. Kodani, T. Miyakawa, T. Komatsu and M. Tanokura, Sci. Rep., 2017, 7, 1297, DOI:10.1038/s41598-017-01272-8.
- M. Lozano, P. Rodríguez-Ulibarri, J. C. Echeverría, M. Beruete, M. Sorolla and M. J. Beriain, Food Anal. Methods, 2017, 10, 3462–3470, DOI:10.1007/s12161-017-0879-1.
- Q. Shen, S. Wang, H. Wang, J. Liang, Q. Zhao, K. Cheng, M. Imran, J. Xue and Z. Mao, John Wiley and Sons Inc., 2024, 23, p. e13398. DOI:10.1111/1541-4337.13398.
- S. B. Kasthuri Dias, S. Bhandari, S. A. Devage, J. A. Avery, R. Kumar, R. Ramanathan and S. Krishnan, J. Am. Chem. Soc., 2024, 146, 30728–30732, DOI:10.1021/jacs.4c09375.
- P. Kokoskarova, T. Ruskovska, M. Brycht, S. Skrzypek and V. Mirčeski, Maced. J. Chem. Chem. Eng., 2024, 43, 4–59, DOI:10.20450/mjcce.2024.2859.
- S. Bhandari, S. A. Devage, R. Kumar, R. Ramanathan and S. Krishnan, ACS Meas. Sci. Au, 2025, 5, 287–293, DOI:10.1021/acsmeasuresciau.4c00095.
- V. Mirceski, S. Skrzypek and L. Stojanov, ChemTexts, 2018, 5, 287–293, DOI:10.1007/s40828-018-0073-0.
- A. J. Bard, L. R. Faulkner and H. S. White, Electrochemical Methods: Fundamentals and Applications, John Wiley & Sons, 3rd edn, 2022 Search PubMed.
- M. Kazazi, A. Afshar and M. Sajjadnejad, International Journal of ISSI, 2013, 10, 14–22 Search PubMed.
- H. B. Xing, H. M. Pan, Y. Fang, X. Y. Zhou, Q. Pan and D. Li, Oncol. Lett., 2014, 7, 487–492, DOI:10.3892/ol.2013.1717.
- C. Spallacci, M. Görlin, A. Kumar, L. D’Amario and M. H. Cheah, Sci. Rep., 2024, 14, 4258, DOI:10.1038/s41598-024-54654-0.
- W. Zhang, S. Xiao and D. U. Ahn, Crit. Rev. Food Sci. Nutr., 2013, 53, 1191–1201, DOI:10.1080/10408398.2011.577540.
- Y. Wang, R. Domínguez, J. M. Lorenzo and B. M. Bohrer, Foods, 2021, 10, 1982, DOI:10.3390/foods10091982.
- R. Nerimetla, S. Krishnan, S. Mazumder, S. Mohanty, G. G. Mafi, D. L. VanOverbeke and R. Ramanathan, Meat Muscle Biol., 2017, 1, 1–7, DOI:10.22175/mmb2016.10.0003.
- S. Krishnan, A. Abeykoon, J. B. Schenkman and J. F. Rusling, J. Am. Chem. Soc., 2009, 131, 16215–16224, DOI:10.1021/ja9065317.
- Y. M. Lvov, Z. Lu, J. B. Schenkman, X. Zu and J. F. Rusling, J. Am. Chem. Soc., 1998, 120, 4073–4080, DOI:10.1021/ja9737984.
- L. Fu, A. Wang, H. Zhang, Q. Zhou, F. Chen, W. Su, A. Yu, Z. Ji and Q. Liu, J. Electroanal. Chem., 2019, 855, 113622, DOI:10.1016/j.jelechem.2019.113622.
- D. H. Noh, S. H. Chung, S. J. Choi and S. J. Hur, Food Control, 2011, 22, 133–136, DOI:10.1016/j.foodcont.2010.06.007.
- C. J. Hung, H. P. Ho, C. C. Chang, M. R. Lee, C. A. Franje, S. I. Kuo, R. J. Lee and C. C. Chou, Food Chem., 2011, 126, 1417–1423, DOI:10.1016/j.foodchem.2010.11.123.
- F. Glaubitz, V. Mirceski and U. Schröder, J. Solid State Electrochem., 2024, 28, 3491–3500, DOI:10.1007/s10008-024-05921-7.
- V. Mirceski, L. Stojanov and B. Ogorevc, Electrochim. Acta, 2019, 327, 134997, DOI:10.1016/j.electacta.2019.134997.
- R. Gulaboski and V. Mirceski, J. Solid State Electrochem., 2024, 28, 1121–1130, DOI:10.1007/s10008-023-05520-y.
- C. Sandford, M. A. Edwards, K. J. Klunder, D. P. Hickey, M. Li, K. Barman, M. S. Sigman, H. S. White and S. D. Minteer, Chem. Sci., 2019, 10, 6404–6422, 10.1039/c9sc01545k.
- V. Mirčeski and M. Lovrič, Electroanalysis, 1999, 11, 984–989, DOI:10.1002/(SICI)1521-4109(199909)11:13<984::AID-ELAN984>3.0.CO;2-W.
- V. Mirceski, S. Komorsky-Lovric and M. Lovric, Square-wave Voltammetry: Theory and Application, Springer Science & Business Media, Berlin, 2007, 1–201 Search PubMed.
- S. W. Abeykoon and R. J. White, ACS Meas. Sci. Au, 2023, 3, 1–9, DOI:10.1021/acsmeasuresciau.2c00044.
- S. Komorsky-Lovrić and M. Lovrić, Electrochim. Acta, 1995, 40, 1781–1784, DOI:10.1016/0013-4686(95)00097-X.
- P. Kokoskarova, L. Stojanov, K. Najkov, N. Ristovska, T. Ruskovska, S. Skrzypek and V. Mirceski, Sci. Rep., 2023, 13, 8485, DOI:10.1038/s41598-023-34350-1.
- J. Tang, C. Faustman and T. A. Hoagland, J. Food Sci., 2004, 69, C717–C720, DOI:10.1111/j.1365-2621.2004.tb09922.x.
- R. Ramanathan, M. K. R. Konda, R. A. Mancini and C. Faustman, J. Food Sci., 2009, 74, C73–C77, DOI:10.1111/j.1750-3841.2008.01021.x.
- R. Ramanathan, M. C. Hunt, R. A. Mancini, M. N. Nair, M. L. Denzer, S. P. Suman and G. G. Mafi, Meat Muscle Biol., 2020, 4, 1–24, DOI:10.22175/mmb.9598.
- E. A. Andreev, D. E. Borisov and A. A. Karyakin, J. Electroanal. Chem., 2024, 957, 118134, DOI:10.1016/j.jelechem.2024.118134.
| This journal is © The Royal Society of Chemistry 2025 |