 Open Access Article
Sustainable fermentable sugar production using a glass fiber supported gallium–molybdenum photocatalyst towards bioethanol production: LCA analysis†
Rajat
Chakraborty
 *,
Sourav
Barman
and
Aritro
Sarkar
Chemical Engineering Department, Jadavpur University, Kolkata-700032, India. E-mail: rajat_chakraborty25@yahoo.com; rajat.chakraborty@jadavpuruniversity.in; Tel: +91 3324572689
First published on 16th August 2024
Abstract
For the first time, a cost-effective glass fiber (GF) support derived from waste printed circuit boards (W-PCBs) was utilized to synthesize a reusable GF-supported gallium–molybdenum photocatalyst (GaMo–GF) for generating fermentable sugar (FS) from delignified corncob (DCC) in a quartz halogen solar batch reactor (QHSR). Additionally, this paper presents a comparative detoxification investigation and subsequent fermentation of the resulting FS using Pichia stipitis. The optimum Ga4Mo-GF (with a gallium precursor loading of 4 wt%) photocatalyst exhibited impressive characteristics, including a high specific surface area (28.01 m2 g−1), high pore volume (0.04198 cc g−1) and lower band gap energy (2.3 eV), providing a maximum 78.35 mol% FS yield under mild reaction conditions (100 °C and 20 min) with mild energy consumption (12 kJ mL−1). The comparative hydrolysate detoxification study highlighted the superior efficacy of the Amberlite IRP69 cation resin, achieving maximum removal rates of 86% for furfural, 92% for formic acid, and 95% for levulinic acid compared to other methods. Furthermore, the hydrolysate detoxified using Amberlite IRP69 resulted in a higher bioethanol concentration (4.32 mmol mL−1) compared to NaOH neutralization (3.06 mmol mL−1), Ca(OH)2 over-liming (2.88 mmol mL−1), and ethyl acetate solvent extraction (3.73 mmol mL−1) when fermented with Pichia stipitis. Additionally, the overall environmental impact assessment indicated that utilizing the Amberlite IRP69 cation resin not only enhanced bioethanol yield but also reduced environmental impacts. Remarkably, the optimized Ga4Mo-GF catalyst demonstrated reusability for up to 7 cycles in the DCC hydrolysis process, showcasing its stability and the consequential reduction in environmental impacts throughout the corncob to bioethanol conversion process.
1. Introduction
The global prevalence of electronic equipment in various industries, coupled with swift technological advancements and intense business competition, results in a significant accumulation of electronic waste. Globally, an amount of 44.7 million metric tons of e-waste was created in 2019, which is expected to reach 74 million metric tons by the year 2030, according to the Global E-waste Monitor-2020.1 Discarded printed circuit boards (PCBs), the intrinsic components of electronic trash, account for around 3% of e-waste.2 Hazardous compounds in waste PCBs (W-PCBs), including heavy metals, carcinogenic brominated flame retardants, and polyvinyl chloride, pose a risk to the environment and humans.3,4 To date, the majority of W-PCBs have been disposed via burning and landfilling in India. Therefore, sustainable recycling of W-PCBs is required as accumulation of waste PCBs is not only a quantity problem, but also a serious environmental issue due to the presence of harmful chemicals that pose a threat to occupational, environmental, and human health.Extraction of precious metals from W-PCBs has been a widespread procedure due to the inherent financial and economic incentives. Very few research works have been reported on recycling of the non-metallic part (NMP) of W-PCBs, comprising 70% of W-PCBs, where the NMP has been used to produce pyrolytic oil,5 activated carbon,6 and adsorbents.7 Recently, a work done by our research group8 showed that the NMP can be utilized as a promising support to produce a bimetallic catalyst, which was later used for glucose synthesis from jute fiber through a hydrolytic pathway. Notably, glass fiber (GF) constitutes a substantial portion of the NMP, surpassing 50%, and can be effectively employed for producing a porous support that possess an exceptionally high specific surface area.9 Thus, in the present study, an effort has been made to synthesize gallium–molybdenum doped glass fiber supported (GaMo–GF) photocatalysts by utilizing W-PCB derived glass fiber (GF).
Utilization of abundant lignocellulosic biomass (LB) to produce bioethanol/biofuel not only is a promising solution for the current energy crisis, but also it helps to mitigate environmental pollution. Corn is amongst the most extensively grown cereal grains, with a 2019 output of 1137 million tons,10 which generates a large amount of waste corncob. Several studies have utilized corncob as feedstock for biofuel generation due to its high holocellulose (cellulose 32.6 wt% and hemicellulose 31.7 wt%) content.11 During synthesis of bioethanol from LB, one of the key-steps is synthesis of fermentable sugars through depolymerization of holocellulose. To depolymerize holocellulose, both enzymatic12 and acid hydrolysis13,14 procedures are routinely utilized. However, the enzymatic procedure is time-consuming and costly, and the homogeneous acid catalytic route also possesses several bottlenecks, viz., difficulty in product separation, highly corrosive, and waste stream generation. The utilization of heterogeneous catalysts offers a potential solution to the limitations observed in the hydrolysis process using enzymes or mineral acids. For instance, Chen et al., 201915 used a rice husk-based solid acid (RH-SO3H) to produce fermentable sugar from corncob and demonstrated that a maximum 486.53 mg g−1 yield of fermentable sugar could be achieved at 160 °C in 3 h. In another study, Wan et al., 201116 used sulfated zirconia to hydrolyze corncob hemicellulose and reported that a maximum of 33% (in grams) of soluble sugar can be achieved at 153 °C in 5.3 h. Nonetheless, no work has been reported on corncob hydrolysis to produce fermentable sugar utilizing a GaMo–GF photocatalyst.
For sustainable synthesis of bioethanol from the hydrolysate, it is important to choose a suitable microorganism capable of fermenting both pentose and hexose sugars to bioethanol in an economically feasible way. Although native strains of Saccharomyces cerevisiae and Zymomonas mobilis are typically employed as benchmark microorganisms in the bioethanol synthesis process,17 they are unable to ferment pentoses. Pichia stipitis has demonstrated considerable potential for industrial utilization among pentose sugar-fermenting yeasts due to its ability to efficiently ferment xylose,18 as well as a wide range of sugars, resulting in a high bioethanol yield.
In bioethanol production from lignocellulose, fermentation inhibition can be addressed by detoxifying the hydrolysate before fermentation. Among various detoxification methods, ion-exchange resin treatment proved to be one of the most effective methods. For instance, a study conducted by Villarreal et al., 200619 reported that an ion exchange resin is more efficient than activated charcoal and drastically enhances the fermentability of the hydrolysate. Similar results were obtained by Chandel et al., 200720 in the detoxification of the sugarcane bagasse hydrolysate employing an ion-exchange resin, where it was reported that an ion-exchange resin can significantly reduce phenolic components by 75.8% and furan components by 63.4%.
Over the decades, a significant amount of research has been conducted on bioethanol production from lignocellulosic biomass (LB) through enzymatic hydrolysis followed by fermentation.21 However, there is a scarcity of studies focusing on bioethanol production via hydrolysis of LB using chemical catalysts and subsequent fermentation. Recently, Selvakumar et al., 202222 used a binary liquid acid (H2SO4 and CH3COOH) to hydrolyse corncob and performed the fermentation process using Saccharomyces cerevisiae resulting in a maximum bioethanol concentration of 24.6 mg mL−1. In another work, Yücel et al., 201523 used H2SO4 to hydrolyse sugar beet pulp to produce a hemicellulose hydrolysate, which was then fermented by Pichia stipitis to produce bioethanol. Nonetheless, no work has been reported yet on bioethanol production through hydrolysis of LB using a solid acid catalyst to the best of our knowledge.
Over the last few decades, the increasing problem of environmental pollution has spurred researchers to revise existing chemical practices, seeking to establish more sustainable systems. In this context, life-cycle assessment (LCA) analysis emerges as a valuable tool for identifying efficient processing and energy systems in the process industries. Recently, several LCA studies on corncob based lignocellulosic biorefinery systems for bioethanol production have been reported.24,25 For instance, Banerjee et al., 202326 performed a comparative life cycle assessment study of biological and chemical lignocellulose pretreatment and downstream processing for conversion of lignocellulose to biofuel. However, based on the analysis of existing literature reviews, it is observed that conducting a comparative life-cycle assessment (LCA) analysis of various detoxification steps is necessary to determine the most environmentally sustainable and efficient approach.
Thus, the current research focuses on developing a cost-effective W-PCB derived glass fiber supported gallium–molybdenum (GaMo–GF) photo-catalyst for synthesis of fermentable sugar from corncob followed by production of bioethanol through fermentation using Pichia stipitis. First, the GaMo–GF catalyzed corncob hydrolysis process was optimized in a quartz halogen solar irradiation (QHS) assisted batch reactor (QHSR). Afterwards, the produced hydrolysate was detoxified and subsequently fermented in an Erlenmeyer flask at 30 °C under shaking conditions. Finally, a life-cycle assessment (LCA) analysis was carried out, which included evaluation of environmental consequences and sustainability of each process step.
2. Results and discussion
2.1. Hydrolysis of DCC under optimal conditions
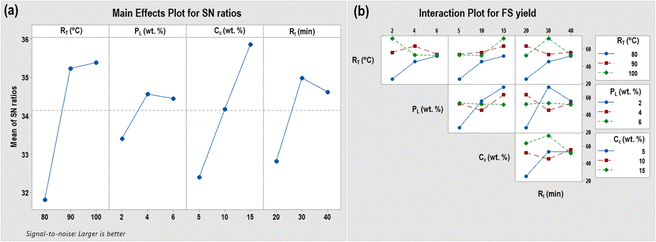
Table 1 displays the rankings of four process parameters, according to their delta (δ) acquired from the experimental designs and the L-9 TgOD projected values. The greater the value of δ, the higher the rank. It can be seen from the table that the reaction temperature (RT) plays the most significant role in the photo-hydrolysis of corn cob closely followed by the catalyst concentration (Cc). Furthermore, ANOVA analysis (Table S1, ESI†) for the photocatalytic corncob hydrolysis process confirmed that RT and Cc were statistically important process parameters at the 95% confidence level (p-value < 0.05). On the other hand, the highest SN values indicate the process factor's optimum level. Accordingly, from Table 1 it can be deduced that L+1 of RT (100 °C), L+1 of CC (15 wt%), L0 of PL (4 wt%) and L0 of Rt (30 min) were the optimum process values. Finally, under optimized process conditions, the DCC photo-hydrolysis run yielded a maximum of 78.35 mol% FS, which contained 51.65 mol% glucose and 26.7 mol% xylose.2.2. Interactive impacts of process factors on DCC hydrolysis
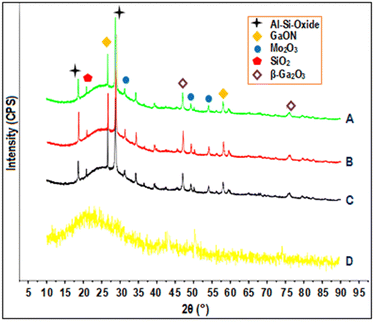
Fig. 1 depicts the effects of individual process factors (in terms of the SN ratio) and their parametric interactions on FS yield in the corncob hydrolysis process. Fig. 1(a) illustrates that as the temperature rises from 80 °C to 90 °C (keeping other factors constant), there is a notable increase in the SN ratio, indicating a greater yield of FS. However, as the temperature continues to increase beyond this point, the SN ratio remains relatively constant. This could be attributed to the onset of FS degradation at higher temperatures, thereby limiting further enhancement of the SN ratio. Similarly, for reaction time after 30 min the product be might further degraded, which reduces the SN ratio. Upon increasing the precursor loading (PL) from 2 wt% to 4 wt% the surface acidity and the photocatalytic effect increase, hence the SN ratio or FS yield increases. But, a further increase in PL has a negative impact on the FS yield. Above 4 wt%, the enlarged nanoparticle size blocked the GF support's pore, reducing the catalyst's total surface area dramatically (BET and XRD analyses). Notably, a comparative study was undertaken to assess the impact of utilizing an optimized Ga4Mo-GF photocatalyst versus a GaMo catalyst without the GF support on the DCC hydrolysis process, aiming to determine whether the GF support impeded or improved the process. Interestingly, the GaMo catalyst without the GF support exhibited a lower FS yield (55.4 mol%) in comparison to Ga4Mo–GF, possibly attributable to the presence of Brønsted acidic sites within the GF structure. Moreover, from Fig. 1(a), it was observed that the FS yield increases linearly with the catalyst concentration, indicating that the availability of more active sites for the reaction contributes to this phenomenon.From the interaction plot of catalyst concentration vs. temperature (Fig. 1(b)), it can be seen that while keeping all other parameters constant, with an increase in catalyst concentration at all temperatures the yield of FS increased. This exemplified how the created GaMo–GF catalyst significantly facilitated the DCC hydrolysis process. A similar pattern was seen for all reaction time levels. At the same time, the catalyst concentration vs. gallium precursor loading plot revealed that increasing the gallium loading at a low concentration increased the FS yield. In contrast, at higher catalyst concentration, the FS yield increases until the gallium loading is 4 wt%. Then it decreases due to the decrease in surface area and creation of bigger nanoparticles during catalyst preparation with increased precursor loading. Moreover, the temperature vs. time graph reveals that at high temperatures, the FS yield decreases as time increases because of the degradation of FS.
2.3. GaMo–GF catalyst characterization
 | (1) |
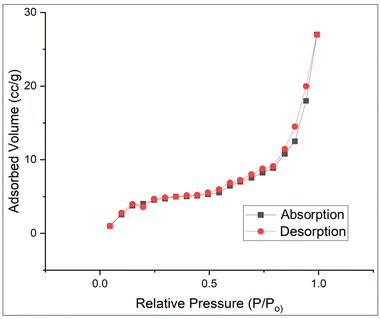
| Sample | Surface area (m2 g−1) | Total pore volume (cc g−1) | Pore diameter (nm) |
|---|---|---|---|
| GF support | 20.35 | 0.03 | 11.90 |
| Ga4Mo-GF | 28.01 | 0.04 | 13.59 |
2.4. Comparative analysis with pertinent prior research
A comparison of current research with previously published studies on FS synthesis employing a heterogeneous solid catalyst has been conducted and is presented in Table 3. It has been observed that production of fermentable sugars from cellulose or other biomasses mostly requires severe reaction conditions. Though use of microwave (MW) irradiation (1200 W)48,49 gives higher yield under less severe reaction conditions, the energy consumption is very high. On the other hand, in the present study, photocatalytic hydrolysis of DCC under quartz halogen radiation (200 W) has milder reaction conditions, comparatively higher FS yield (78.35 mol% and selectivity: 81.57%) and consumes a much less energy (12 kJ mL−1). Notably, the optimum catalyst provided a similar 40.70 mol% FS yield (selectivity: 74.32%) under conventional heating and mild optimum reaction conditions while still consuming less energy (24 kJ mL−1) compared to the previously reported study.48,49 Additionally, a cost analysis study revealed that the estimated cost of the W-PCB derived GF is significantly lower (INR 37.63 per kg) compared to the commercial silica-alumina cost (INR 475 per kg (www.indiamart.com)), which not only reduces the preparation cost of 1 kg of the Ga4Mo–GF photocatalyst but also enhnaces catalyst performance in terms of FS yield. Therefore, in the present study, the photocatalytic conversion process of corncob in the QHSR using the Ga4Mo–GF catalyst emerges as a potentially more sustainable approach compared to those reported in previous works.| Feedstock | Catalyst | Reaction conditions | Reactor | Yield (%) | Ref. |
|---|---|---|---|---|---|
| a Microwaves. b Visible light. | |||||
| Cellulose | BC–SO3H | 90 °C; 1 h | MWa heated batch reactor | 24.1 | 48 |
| Cellulose | [C4mim]Cl + HY | 100 °C; 0.25 h | MW heated batch reactor | 34.8 | 49 |
| Cellulose | [C4mim]Cl + HZSM | 100 °C; 0.167 h | MW heated batch reactor | 42.9 | |
| Cellulose | Au-HYT | 140 °C; 16 h | VISb enegized batch reactor | 58.7 | 50 |
| Corncob | CSA | 130 °C; 1 h | MW heated batch reactor | 34.6 | 51 |
| Cellulose | CP-SO3H | 120 °C; 10 h | Conventionally heated batch reactor | 91 | 52 |
| Cellulose | [BMIm]Cl + HY | 130 °C; 0.5 h | Conventionally heated batch reactor | 68.2 | 53 |
| DCC | GaMo–GF | 100 °C; 0.5 h (30 min) | QHSR | 78.35 | Present study |
2.5. Detoxification and fermentation of DCC hydrolysates
Detoxification results of the Taguchi derived optimal DCC hydrolysates using various detoxification approaches are shown in Table 4. From Table 4, it can be clearly observed that the minimum sugar loss was observed for the ethyl acetate solvent extraction detoxification process and the cation exchange detoxification process using the Amberlite IRP69 resin. Notably, the maximum removal of inhibitors, viz., furfural (86%), formic acid (92%), and levulinic acid (95%), can be achieved using the Amberlite IRP69 cation resin compared to other detoxification methods. Although the ion exchange detoxification process may have a higher initial cost due to the high price of the Amberlite IRP69 cation resin, its easy recyclability mitigates the significance of the price factor when choosing an appropriate detoxification method.| Detoxification method | Component concentration in hydrolysates (mmol mL−1) | Total sugar loss (mmol mL−1) | |||||
|---|---|---|---|---|---|---|---|
| Glucose | Xylose | Formic acid | Furfural | Levulinic acid | 5-HMF | ||
| None | 3.43 | 1.41 | 0.493 | 0.27 | 0.33 | 0.104 | 0 |
| Neutralization with NaOH (pH: 6.5–7.00) | 3.27 | 1.10 | 0.092 | 0.23 | 0.23 | 0.077 | 0.462 |
| Over-liming with Ca(OH)2 (pH: 10) | 3.12 | 0.95 | 0.192 | 0.138 | 0.0925 | 0.077 | 0.771 |
| Ethyl acetate extraction | 3.39 | 1.35 | 0.32 | 0.10 | 0.192 | 0.023 | 0.10 |
| Amberlite IRP69 resin | 3.39 | 1.34 | 0.0385 | 0.0385 | 0.0154 | 0 | 0.11 |
Fig. 11 demonstrates the correlation between total fermentable sugar (FS), glucose, and xylose consumption with bioethanol production during the fermentation process of the Amberlite IRP69 resin detoxified DCC hydrolysate. The findings indicated a substantial rise in bioethanol concentration from 0 to 80 hours, followed by deceleration of the Pichia stipitis NCIM 3499 strain approaching the stationary phase with limited available fermentable sugar being present in the substrate. The maximum bioethanol concentration of 4.32 mmol mL−1 was observed after completion of the fermentation period of 120 h. The fermentation process also yields some by-products, with xylitol being the primary one (1.21 mmol mL−1).54 Although acetic acid is also produced,55 its concentration remains relatively low (<0.1 mmol mL−1). Notably, xylitol has various applications in the pharmaceutical and food industries, and its demand is currently increasing. Therefore, integrated production of ethanol and xylitol could be a sustainable process from a techno-economic perspective.
 | ||
| Fig. 11 Changes in fermentable sugar (FS), glucose, xylose and bioethanol concentration with time in the Amberlite IRP69 resin detoxified hydrolysate fermentation process. | ||
The fermentation study was also conducted using other detoxified DCC hydrolysates under identical operating conditions. The results demonstrated that when using NaOH neutralized, Ca (OH)2 over-limed and ethyl acetate solvent extracted detoxified hydrolysates, maximum bioethanol concentrations of 3.06 mmol mL−1, 2.88 mmol mL−1, and 3.73 mmol mL−1 were achieved, respectively. The findings of this study showed that the Ga4Mo–GF photocatalytic hydrolysis in conjunction with the detoxification method using the Amberlite IRP69 resin was a promising option for successful DCC conversion into sugars and bioethanol.
While no prior research has addressed lignocellulosic biomass hydrolysis utilizing heterogeneous solid catalysts followed by fermentation for ethanol production, certain studies have explored lignocellulosic biomass hydrolysis with homogeneous catalysts followed by fermentation. For instance, Selvakumar et al., 202222 utilized a binary liquid acid (H2SO4 and CH3COOH) to hydrolyze corncob at 120 °C for 60 minutes, achieving a maximum bioethanol concentration of 24.6 mg mL−1 h−1 through fermentation employing Saccharomyces cerevisiae. The ethanol concentration obtained in their study was significantly lower compared to the present work (99.58 mg mL−1 h−1), and their approach involved the use of corrosive liquid acids during the hydrolysis process, which are challenging to separate and render the process energy-intensive. In another study, Yücel et al., 201523 utilized H2SO4 to hydrolyze sugar beet pulp, generating a hemicellulose hydrolysate and the hydrolysate was detoxified through methods involving activated charcoal obtained from sugar beet pulp and over-liming with CaO. The work also reported that the detoxified hydrolysate when fermented by Pichia stipitis yielded a maximum ethanol concentration ranging from 10.8 to 12.2 mg mL−1, which was lower compared to the ethanol obtained from the Amberlite IRP69 resin detoxified DCC hydrolysate in the present study. Notably, a fermentation experiment was also conducted on a non-detoxified hydrolysate and only 1.56 mmol mL−1 of ethanol concentration was observed after completion of the fermentation period of 120 h. Although the cost of the Amberlite IRP69 resin is high, it significantly increases ethanol yield (63.8% higher) from a detoxified hydrolysate compared to a non-detoxified hydrolysate. Consequently, the present investigation into DCC hydrolysis utilizing Ga4Mo–GF, subsequent detoxification with the Amberlite IRP69 resin, and fermentation employing Pichia stipitis, highlights its economic viability.
Although 1G bioethanol production is commercially established, 2G bioethanol processes are still immature and costly, due to the lack of robust technology, posing major challenges to commercial viability. Notably, 1G feedstocks like sugarcane juice compete with food production, whereas 2G feedstocks such as waste sugarcane residues, rice straw and corn stover are abundant and do not compete with food resources. Additionally, lignocellulosic biomass (LB) can produce up to 50% more ethanol when integrated with 1G refineries;56 thus, the integrated process for production of 1G and 2G bioethanol can significantly enhance global ethanol yields. For instance, a study on 2G bioethanol production conducted by Vikash et al., 201857 utilizing sugarcane and trash obtained from a sugar mill in India reported that the break-even selling price of bioethanol was $1.05 per L, which is higher than the current production cost of 1G bioethanol from sugarcane ($0.56 per L). On the other hand, another study conducted by Macrelli et al., 201258 reported that the minimum selling price of 2G bioethanol produced from sugarcane bagasse was $0.97 per L, whereas the overall production cost of 1G + 2G bioethanol would be about $0.40 per L with an output of 102 L per ton dry sugar cane. The study also reported that the enzymatic hydrolysis process has the highest impact on the overall cost of bioethanol.
Despite the current process involving multiple steps for SB to 2G bioethanol production, the use of low-cost, waste-derived recyclable solid acid catalysts (preparation cost < $1 per kg) instead of expensive commercial enzymes (cellulase, price: $50–55 per kg, www.echemi.com) in the saccharification steps significantly reduces overall operational costs. Additionally, the detoxification steps using the Amberlite IRP69 resin generate several value-added by-products, such as formic acid, levulinic acid, 5-HMF, and furfural. If these by-products are appropriately purified, they can contribute to making the overall process economically sustainable. The lignin generated during the SB pretreatment process can also be utilized to produce value-added chemicals. Furthermore, the co-production of value-added chemicals like xylitol during the fermentation of the hydrolysate, alongside ethanol, can further help to reduce the production cost of ethanol. A preliminary techno-economic cost analysis of the current bioethanol production process indicates that the production cost is $0.72 per L without factoring in value-added by-products. However, with the inclusion of by-products such as xylitol ($4–5 per kg, https://www.echemi.com), levulinic acid ($0.1 per kg, https://www.echemi.com), 5-HMF ($25 per kg, https://www.echemi.com), and furfural ($0.2–0.3 per kg, https://www.echemi.com), the cost drops to about $0.52 per L, which can be lower or comparable with the production cost of 1 G bioethanol from sugarcane.
2.6. Life-cycle impact assessment
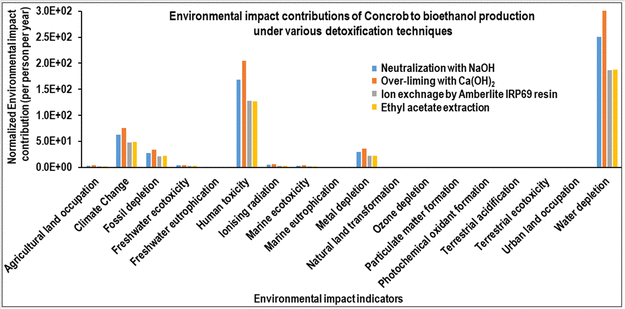
The results of the environmental impact assessment utilizing ReCiPe Midpoint (H) v1.11 are depicted in Fig. 12 and 13. Fig. 12 shows that the potential midpoint environmental impact indicators for the corncorb to bioethanol production process, comparing all four system borders, were climate change, fossil depletion, human toxicity, metal depletion, and water depletion. Moreover, in the detoxification process of DCC hydrolysates, both Amberlite IRP69 resin extraction and ethyl acetate extraction processes exhibit lower environmental impacts across all potential midpoint indicators compared to the other two detoxification techniques (Fig. 13). Remarkably, the bioethanol production from the Amberlite IRP69 resin-extracted DCC hydrolysate shows reduced environmental impacts across all categories, excluding the human toxicity indicator, in comparison to bioethanol production from the ethyl acetate-extracted DCC hydrolysate.Fig. 13 depicts the individual process contributions to the potential impact indicators of overall environmental impacts, highlighting that the GaMo–GF catalyst preparation and corncorb delignification processes were the primary contributors among all processes. Molybdenite and gallium mine operations for the preparation of molybdenum and gallium precursor salts (40–63%), trailed by coal-based electricity and NaOH utilization (36%) during W-PCB treatment, emerged as the major contributors to environmental impact indicators such as metal depletion (96.6%) and human toxicity (92.7%) for the GaMo–GF catalyst preparation process. On the contrary, concerning the corncob delignification process, notable factors contributing to impact indicators such as fossil depletion and climate change included the consumption of acetic acid (25.20–29.63%) and the electricity used during corncob grinding (2.42–3.65%).
Notably, a catalyst recycling study of the DCC hydrolysis process revealed that the prepared optimized catalyst Ga4Mo–GF could be utilized up to 7 cycles without compromising the FS yield. During this study, ICP-MS analysis was conducted after each hydrolysis cycle, which revealed that a marginal leaching of Ga (1.5 ppm) and Mo (2.14 ppm) metal elements occurred after the seventh cycle. A comparative life cycle impact assessment conducted on the DCC hydrolysis process utilizing both fresh and reused Ga4Mo-GF catalysts (Fig. 14) indicated that employing the reused catalyst could lead to significant reduction in major midpoint indicators, including climate change, fossil depletion, human toxicity, metal depletion, and water depletion, by 85%, 86%, 36.4%, 85.7%, and 49%, respectively, compared to the fresh catalyst.
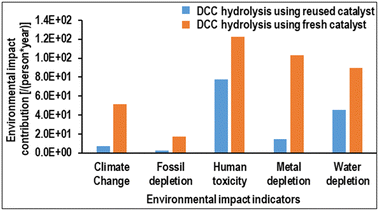 | ||
| Fig. 14 Comparative environmental impact assessment of the DCC hydrolysis process employing reused and fresh Ga4Mo–GF catalysts. | ||
3. Experimental procedure
3.1. Materials
W-PCBs were obtained for this study from a regional scrap store in Kolkata, West Bengal, India. Corn cob has been collected from local vendors in Kolkata, West Bengal, India. Transition metallic salts, viz., gallium(III) nitrate hydrate and bis(acetylacetonate) dioxo-molybdenum(VI), have been purchased from Sigma-Aldrich. H2O2 (30% w/w), acetone (>99%), acetic acid (CH3COOH, 99–100%), NaOH, Ca (OH)2, NH4OH solution (25% w/w), Amberlite IRP69 resin, and N,N-dimethylformamide (DMF) of analytical grade have been procured from Sigma-Aldrich. The Pichia stipitis NCIM 3499 strain was collected from the National Collection of Industrial Microorganism (NCIM), Pune, India.3.2. Catalyst preparation using a W-PCB derived glass fiber (GF) support
| Factors | Units | L−1 Level | L0 Level | L1 Level |
|---|---|---|---|---|
| Reaction temp. (RT) | °C | 80 | 90 | 100 |
| Ga precursor loading (PL) | wt% | 2 | 4 | 6 |
| Catalyst concentration (Cc) | wt% | 5 | 10 | 15 |
| Reaction time (Rt) | min | 20 | 30 | 40 |
3.3. Catalyst efficacy assessment in hydrolysis of delignified corncob (DCC)
Hydrolysis of DCC (details of delignification of corncob are given in the Section, S1 (ESI†)) was performed in a quartz–halogen solar batch reactor (QHSR, 200 W) employing the prepared catalysts to investigate the efficacy of the prepared photocatalysts. In an experimental run, 250 mg of delignified corn cob (DCC) was measured and added to 20 mL of distilled water in a single necked round bottom flask (50 mL) equipped with a centrally fitted stirrer. Subsequently, a specified quantity of prepared photo-catalysts was added to the aforementioned mixture (Table 5). The reaction mixture was stored under dark conditions at 25 °C for 20 minutes before the photocatalytic reaction to achieve adsorption equilibrium. Thereafter, radiation was applied and the mixture was rotated at 500 rpm. A PID controller was used to keep the temperature stable. | (2) |
| Experimental runs | R T (°C) | R t (min) | C c (wt%) | P L (wt%) | FS yield (mol%) |
|---|---|---|---|---|---|
| 1 | 80 | 20 | 5 | 2 | 25.12 |
| 2 | 80 | 30 | 10 | 4 | 45.16 |
| 3 | 80 | 40 | 15 | 6 | 51.93 |
| 4 | 90 | 20 | 10 | 6 | 56.24 |
| 5 | 90 | 30 | 15 | 2 | 63.39 |
| 6 | 90 | 40 | 5 | 4 | 53.91 |
| 7 | 100 | 20 | 15 | 4 | 72.47 |
| 8 | 100 | 30 | 5 | 6 | 53.31 |
| 9 | 100 | 40 | 10 | 2 | 52.43 |
3.4. Estimation of fermentable sugar
A Waters HPLC system with an RI detector (PerkinElmer 200 series) and a Waters carbohydrate column were used for the chromatographic separation of fermentable sugars. The furfural and acidic by product concentrations in the hydrolysate were analyzed using a UV detector and C18 column. A mobile phase of acetonitrile and water (60![[thin space (1/6-em)]](https://www.rsc.org/images/entities/char_2009.gif) :
:![[thin space (1/6-em)]](https://www.rsc.org/images/entities/char_2009.gif) 40, v/v) with a flow rate of 1 mL min−1 was used for both the detectors. The calibration plots of the corresponding standard constituents were used to calculate the concentrations of the hydrolysate constituents. At the completion of each analysis, the column was rinsed with the said mobile phase for more than 30 minutes. Finally, eqn (3) has been used to determine the yield of FS (YFS)
40, v/v) with a flow rate of 1 mL min−1 was used for both the detectors. The calibration plots of the corresponding standard constituents were used to calculate the concentrations of the hydrolysate constituents. At the completion of each analysis, the column was rinsed with the said mobile phase for more than 30 minutes. Finally, eqn (3) has been used to determine the yield of FS (YFS) | (3) |
3.5. Characterization of the synthesized catalyst
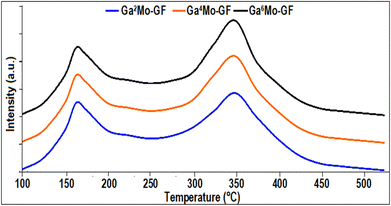
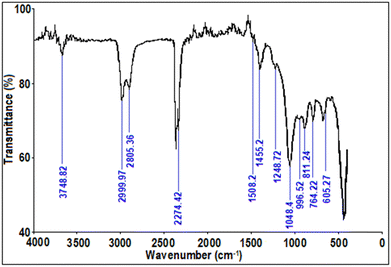
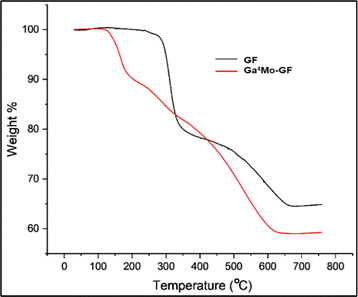
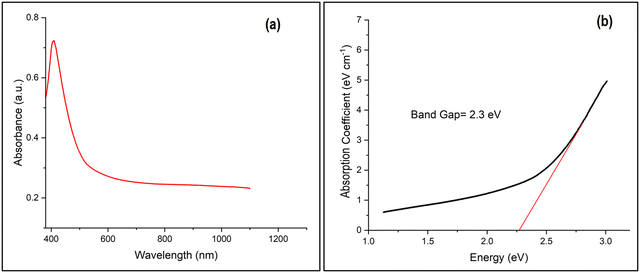
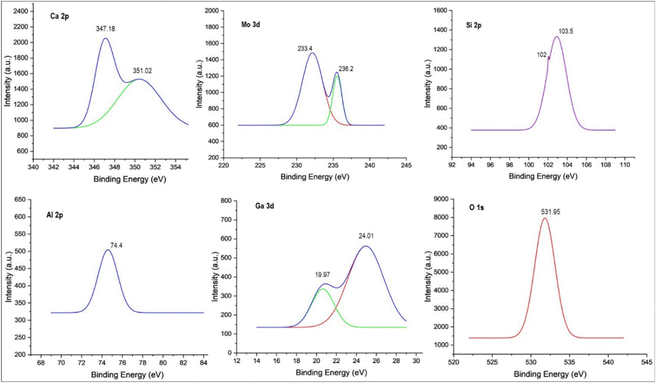
The properties of the prepared GaMo–GF photocatalysts and GF support were investigated employing various characterization techniques. First, TGA analysis was performed using a PerkinElmer, Pyris Diamond TG/DTA analyzer with N2 flow (1.2 L h−1) at a heating rate of 10.0 °C min−1 from 25 °C to 800 °C. The photocatalytic characteristics of the optimum GaMo–GF catalyst were investigated using a PerkinElmer LAMBDA 950 UV-vis-NIR spectrophotometer with a tungsten halogen lamp as the light source. X-ray diffraction (XRD) patterns of the GF support and the prepared catalysts were obtained on a Bruker D8 Advance diffractometer employing Cu Kα radiation with a wavelength of 1.5147 Å. The GaMo–GF's infrared spectra were also recorded using an FTIR-Shimadzu (Alpha) instrument in a wavelength range of 400 to 4000 cm−1. To determine the surface area as well as pore volume of the prepared catalysts, BET analysis was done using a NOVA touch 2LX. FESEM (JSM-6360 (JEOL Ltd.) at 15 kV and HRTEM were also used to investigate the surface morphology of the optimum GaMo–GF catalyst. Elemental analysis and mapping were performed on a Bruker XFlash® 6 detector series using EDAX analysis. X-ray photoelectron spectroscopy (XPS) of the optimum GaMo–GF was used to measure the binding energy as well as oxidation state of various elements contained in the catalyst specimen. The samples' acidity was determined by NH3-TPD analysis (Quanta Chrome Instruments, TPR win v2).3.6. Detoxification of the hydrolysate
After concentrating the hydrolysate through vacuum evaporation, the detoxification of the DCC hydrolysate was done employing various detoxification methods. Neutralization with NaOH (pH: 6.5–7.00), over-liming with Ca (OH)2 (pH: 10), solvent extraction, and the ion exchange method were employed to detoxify the optimally produced DCC hydrolysate. For solvent extraction, ethyl acetate was used as extracting solvent and for ion exchange and the Amberlite IRP69 resin (Ca2+) was used to extract the impurities present in the hydrolysates. Moreover, the ion exchange resin treatment was done in a chromatographic column (bed length: 25 cm; diameter: 10 mm) packed with the Amberlite IRP69 resin (Ca2+) of 25 g and a peristaltic pump was used to control the hydrolysate flow rate in the chromatographic column (∼0.5 mL min−1). The effluent was collected at constant intervals and analysed using HPLC.3.7. Inoculation of Pichia stipitis and fermentation of the detoxified hydrolysate
First, the collected Pichia stipitis NCIM 3499 strain was cultured on an agar plate with a synthetic growth medium containing 10 g L−1 yeast extract, 20 g L−1 peptone, 20 g L−1 xylose, and 20 g L−1 agar for 3 days at pH 5.0 ± 0.1 and temperature 30 °C. Afterwards, colonies from the plate were sub-cultured (Fig. 1S, ESI†) in a inoculum medium containing 10 g L−1 yeast extract, 0.5 g L−1 (NH4)2SO4, 1.065 g L−1 MgCl2·6H2O, 0.5 g L−1 KH2PO4 and 24 g L−1 xylose.61 Afterward, the cells were collected and resuspended in water and the resulting cell suspension was then utilized as the inoculum for the fermentation process.Finally, the fermentation process of detoxified DCC was carried out in an Erlenmeyer flask at 30 °C under shaking conditions (100 rpm). The fermentation medium is composed of 50 mL of detoxified DCC hydrolysates, 2 mL of inoculum, and 1 mL of nutrient solution as suggested by Agbogbo et al., 2006.62 During fermentation, samples were withdrawn at regular intervals of 4 h and centrifuged for 15 min at 4 °C. The cell free supernatant was used to determine the bioethanol and residual sugar concentrations.
3.8. Life-cycle assessment
The environmental impacts associated with each process steps were evaluated using OpenLCA 1.11.0 software. The whole process flow and system boundaries for LCA are depicted in a schematic in Fig. 15. The system has been divided into four boundaries. The 1st system boundary includes the extraction of GF from W-PCBs and the preparation of the GaMo–GF photocatalyst. The 2nd system boundary comprises the processing and delignification of the corncob, in which, life cycle inventory results are evaluated based on the manufacturing of 1 kg of DCC. The 3rd system boundary incorporates the photocatalytic hydrolysis process where the life cycle inventory results are evaluated based on the manufacturing of 1 kg of FS. Finally, the 4th system boundary incorporates the detoxification and fermentation step, where the life cycle inventory results are evaluated based on the manufacturing of 1 kg of bioethanol. The study findings have been up-scaled as per the functional units and provided as a database for the said life cycle inventory (LCI). LCI data derived from the process were tabulated in the supplementary document (Tables S4–S10, ESI†).After preparing the LCI database, the ReCiPe Midpoint (H) [v1.11] method was employed to assess the potential environmental impacts associated with each process. Furthermore, a comparative LCA analysis was also conducted to determine the most environment friendly DCC hydrolysate detoxification approach for the production of bioethanol.
4. Conclusion
A W-PCB derived cost-effective glass fiber (GF) supported gallium–molybdenum (GaMo–GF) photo-catalyst demonstrated remarkable efficacy in the conversion of fermentable sugars, leading to successful bioethanol production through fermentation with Pichia stipitis. Experimental findings demonstrated that the synthesized Ga4Mo–GF catalyst effectively hydrolyzed the delignified corncob (DCC) in a tungsten-halogen irradiated batch reactor, yielding a 78.35 mol% FS under mild optimized conditions: 100 °C and 30 min. The comparative hydrolysate detoxification study revealed that the maximum removal of inhibitors, such as furfural (86%), formic acid (92%), and levulinic acid (95%), could be achieved using the Amberlite IRP69 cation resin compared to other detoxification methods while contributing to less environmental impacts on environmental imapct indicators, such as climate change, fossil depletion, metal depletion, and water depletion. Additionally, the Amberlite IRP69 cation resin detoxified hydrolysate provided a higher bioethanol concentration (4.32 mmol mL−1) compared to the other detoxification methods such as NaOH neutralization (3.06 mmol mL−1), Ca (OH)2 over-liming (2.88 mmol m−1), and ethyl acetate solvent extraction (3.73 mmol mL−1) when fermented with Pichia stipitis. Moreover, the optimized Ga4Mo–GF catalyst exhibited reusability for up to 7 cycles in the DCC hydrolysis process, showcasing both its stability and the consequential reduction in environmental impacts throughout the corncob to bioethanol conversion process.Author contributions
Aritro Sarkar: data curation, formal analysis, investigation, methodology, writing – original draft; Sourav Barman: conceptualization, data curation, formal analysis, investigation. methodology, software, visualization, writing – original draft; and Rajat Chakraborty: conceptualization, funding acquisition, project administration, supervision, validation, writing – reviewing and editing.Data availability
Supporting data for the findings are available in the ESI† of this manuscript (YA-ART-04-2024-000226).Conflicts of interest
The authors have no conflicts of interest.Acknowledgements
The financial support of DHESTBT (ST/P/S&T/4G-2/2018) (Government of West Bengal, India) is gratefully acknowledged.References
- V. Forti, C. P. Baldé, R. Kuehr and G. Bel, United Nations University (UNU), International Telecommunication Union (ITU) & International Solid Waste Association (ISWA), Bonn/Geneva/Rotterdam, 2020, 120.
- Y. Shen, R. Zhao, J. Wang, X. Chen, X. Ge and M. Chen, Waste Manage., 2016, 49, 287–303 CrossRef CAS PubMed.
- A. Cesaro, A. Marra, V. Belgiorno and M. Guida, J. Cleaner Prod., 2017, 142, 2656–2662 CrossRef CAS.
- M. Oguchi, H. Sakanakura and A. Terazono, Sci. Total Environ, 2013, 463, 1124–1132 CrossRef.
- C. Quan, A. Li and N. Gao, J. Anal. Appl. Pyrolysis, 2010, 89, 102–106 CrossRef CAS.
- P. Zhou, J. Barford and G. McKay, Financial & Business Management (IFBM), 2013, 1, 126–135 Search PubMed.
- Y. Kan, Q. Yue, J. Kong, B. Gao and Q. Li, Chem. Eng. J., 2015, 260, 541–549 CrossRef CAS.
- S. Barman and R. Chakraborty, ACS Omega, 2018, 3, 18499–18509 CrossRef CAS.
- C. Guan, Y. Tao, S. Chen, J. Zhu and X. Gao, Environ. Sci. Pollut. Res., 2021, 28, 46281–46290 CrossRef CAS PubMed.
- O. Erenstein, M. Jaleta, K. Sonder, K. Mottaleb and B. M. Prasanna, Food Secur., 2022, 14, 1295–1319 CrossRef.
- Q. Qing, Q. Guo, P. Wang, H. Qian, X. Gao and Y. Zhang, Bioresour. Technol., 2018, 260, 150–156 CrossRef CAS PubMed.
- X. Gong, Q. Li, T. Li, C. Li, J. Huang, N. Zhou and X. Jia, Ind. Crops Prod., 2022, 176, 114317 CrossRef CAS.
- A. Nagarajan, B. Thulasinathan, P. Arivalagan, A. Alagarsamy, J. B. Muthuramalingam, S. D. Thangarasu and K. Thangavel, Bioresour. Technol., 2021, 340, 125677 CrossRef CAS PubMed.
- B. Qi, A. Vu, S. R. Wickramasinghe and X. Qian, Biomass Bioenergy, 2018, 117, 137–145 CrossRef CAS.
- N. Chen, G. Zhang, P. Zhang, X. Tao, Y. Wu, S. Wang and M. Nabi, Bioresour. Technol., 2019, 292, 121915 CrossRef CAS.
- L. Wan, Z. Gao, B. Wu, F. Cao, M. Jiang, P. Wei and H. Jia, Appl. Biochem. Biotechnol., 2021, 193, 205–217 CrossRef CAS.
- S. Banerjee, S. Mudliar, R. Sen, B. Giri, D. Satpute, T. Chakrabarti and R. A. Pandey, Biofuels, Bioprod. Biorefin., 2010, 4, 77–93 CrossRef CAS.
- J. C. Du Preez, M. Bosch and B. A. Prior, Appl. Microbiol. Biotechnol., 1986, 23, 228–233 CrossRef CAS.
- M. L. M. Villarreal, A. M. R. Prata, M. G. A. Felipe and J. A. E. Silva, Enzyme Microb. Technol., 2006, 40, 17–24 CrossRef CAS.
- A. K. Chandel, R. K. Kapoor, A. Singh and R. C. Kuhad, Bioresour. Technol., 2007, 98, 1947–1950 CrossRef CAS.
- M. Kashid and A. Ghosalkar, 3 Biotech, 2017, 7, 1–9 CrossRef.
- P. Selvakumar, A. A. Adane, T. Zelalem, B. M. Hunegnaw, V. Karthik, S. Kavitha, M. Jayakumar, N. Karmegam, M. Govarthanan and W. Kim, Fuel, 2022, 321, 124060 CrossRef CAS.
- H. G. Yücel and Z. Aksu, Fuel, 2015, 158, 793–799 CrossRef.
- F. Liu, X. Guo, Y. Wang and G. Chen, J. Cleaner Prod., 2021, 329, 129707 CrossRef CAS.
- G. Murali and Y. Shastri, Biofuels, 2022, 13, 237–247 CrossRef CAS.
- S. Banerjee, C. Pandit, M. P. Gundupalli, S. Pandit, N. Rai, D. Lahiri, K. K. Chaubey and S. J. Joshi, Environment, Development and Sustainability, 2023, pp. 1–32 Search PubMed.
- D. Sundeep, A. Gopala Krishna, R. V. Ravikumar, T. Vijaya Kumar, S. Daniel Ephraim and Y. L. Pavan, Int. Nano Lett., 2016, 6, 119–128 CrossRef CAS.
- N. Iqbal, I. Khan, Z. H. Yamani and A. Qurashi, Sci. Rep., 2016, 6, 32319 CrossRef CAS.
- J. Zhang, C. Xia, Q. Deng, W. Xu, H. Shi, F. Wu and J. Xu, J. Phys. Chem. Solids, 2006, 67, 1656–1659 CrossRef CAS.
- I. M. Joni, L. Nulhakim, M. Vanitha and C. Panatarani, Journal of Physics: Conference Series, IOP Publishing, 2018, vol. 1080, p. 012006 Search PubMed.
- O. Roy, S. Roy Choudhury and R. Chakraborty, Environ. Sci. Pollut. Res., 2023, 30, 25506–25522 CrossRef CAS PubMed.
- Y. Liang, J. Ouyang, H. Wang, W. Wang, P. Chui and K. Sun, Appl. Surf. Sci., 2012, 258, 3689–3694 CrossRef CAS.
- Z. Han, F. Zhou, Y. Liu, K. Qiao, H. Ma, L. Yu and G. Wu, J. Taiwan Inst. Chem. Eng., 2019, 103, 149–159 CrossRef CAS.
- C. Schramm, Spectrochim. Acta, Part A, 2020, 243, 118815 CrossRef CAS PubMed.
- M. A. Poiana, E. Alexa, M. F. Munteanu, R. Gligor, D. Moigradean and C. Mateescu, Open Chem., 2015, 13, 689–698 CAS.
- P. Y. Bruice, Org. Chem., 2011, 2620, A16–A17 Search PubMed.
- Y. Cheng, J. Chen, K. Yang, Y. Wang, Y. Yin, H. Liang and G. Du, J. Vac. Sci. Technol., B: Nanotechnol. Microelectron.: Mater., Process., Meas., Phenom., 2014, 32, 3 Search PubMed.
- A. Khojastehnezhad, F. Moeinpou and M. Vafaei, J. Mex. Chem. Soc., 2015, 59, 29–35 CAS.
- F. Barontini, K. Marsanich, L. Petarca and V. Cozzani, Ind. Eng. Chem. Res., 2005, 44, 4186–4199 CrossRef CAS.
- V. Berbenni, C. Milanese, G. Bruni and A. Marini, J. Therm. Anal. Calorim., 2005, 82, 401–407 CrossRef CAS.
- K. Zhou, S. Jiang, C. Bao, L. Song, B. Wang, G. Tang, Y. Hu and Z. Gui, RSC Adv., 2012, 2, 11695–11703 RSC.
- C. C. Hu and H. Teng, J. Phys. Chem. C, 2010, 114, 20100–20106 CrossRef CAS.
- L. S. Yoong, F. K. Chong and B. K. Dutta, Energy, 2009, 34, 1652–1661 CrossRef CAS.
- J. Zhao, A. Jayakumar and J. M. Lee, ACS Sustainable Chem. Eng., 2018, 6, 2976–2982 CrossRef CAS.
- B. Demri and D. Muster, J. Mater. Process. Technol., 1995, 55, 311–314 CrossRef.
- M. Tang, A. T. Nelson, E. S. Wood, S. A. Maloy and Y. B. Jiang, Scr. Mater., 2016, 120, 49–53 CrossRef CAS.
- J. Shah, P. Ratnasamy and M. L. Carreon, Catalysts, 2017, 7, 372 CrossRef.
- Y. Wu, Z. Fu, D. Yin, Q. Xu, F. Liu, C. Lu and L. Mao, Green Chem., 2010, 12, 696–700 RSC.
- Y. Jiang, X. Li, X. Wang, L. Meng, H. Wang, G. Peng, X. Wang and X. Mu, Green Chem., 2012, 14, 2162–2167 RSC.
- L. Wang, Z. Zhang, L. Zhang, S. Xue, W. O. Doherty, I. M. O'Hara and X. Ke, RSC Adv., 2015, 5, 85242 RSC.
- Z. Zhang and Z. Zhao, Carbohydr. Res., 2009, 344, 2069–2072 CrossRef CAS PubMed.
- L. Shuai and X. Pan, Energy Environ. Sci., 2012, 5, 6889–6894 RSC.
- H. Cai, C. Li, A. Wang, G. Xu and T. Zhang, Appl. Catal., B, 2012, 123, 333–338 CrossRef.
- J. P. Delgenès, R. Moletta and J. M. Navarro, Appl. Microbiol. Biotechnol., 1991, 35, 656–661 CrossRef.
- C. C. Okonkwo, M. M. Azam, T. C. Ezeji and N. Qureshi, Bioprocess Biosyst. Eng., 2016, 39, 1023–1032 CrossRef CAS PubMed.
- A. K. Chandel, J. Q. Albarelli, D. T. Santos, S. P. Chundawat, M. Puri and M. A. Meireles, Biofuels, Bioprod. Biorefin., 2019, 13, 994–1014 CrossRef CAS.
- P. V. Vikash, P. V. Mandade and Y. Shastri, Environ. Prog. Sustainable Energy, 2018, 37, 2165–2174 CrossRef CAS.
- S. Macrelli, J. Mogensen and G. Zacchi, Biotechnol. Biofuels, 2012, 5, 1–8 CrossRef PubMed.
- T. Moyo, B. H. Chirume and J. Petersen, Resour., Conserv. Recycl., 2020, 152, 104545 CrossRef.
- S. Barman and R. Chakraborty, AIChE J., 2019, 65, e16677 CrossRef.
- J. N. Nigam, J. Biotechnol., 2001, 87, 17–27 CrossRef CAS.
- F. K. Agbogbo, G. Coward-Kelly, M. Torry-Smith and K. S. Wenger, Process Biochem., 2006, 41, 2333–2336 CrossRef CAS.
Footnote |
| † Electronic supplementary information (ESI) available. See DOI: https://doi.org/10.1039/d4ya00226a |
| This journal is © The Royal Society of Chemistry 2024 |

