 Open Access Article
Creative Commons Attribution 3.0 Unported Licence
Modelling interfacial ionic transport in Li2VO2F cathodes during battery operation†
Jolla
Kullgren
 *a,
Jin Hyun
Chang
 b,
Simon
Loftager
b,
Shweta
Dhillon
a,
Tejs
Vegge
b,
Simon
Loftager
b,
Shweta
Dhillon
a,
Tejs
Vegge
 b and
Daniel
Brandell
 a
a
aDepartment of Chemistry − Ångström Laboratory, Uppsala University, Box 538, SE-751 21, Uppsala, Sweden. E-mail: jolla.kullgren@kemi.uu.se
bDepartment of Energy Conversion and Storage, Technical University of Denmark, DK-2800 Kgs, Lyngby, Denmark
First published on 30th July 2024
Abstract
Transition metal oxyflourides have gained considerable interest as potential high-capacity cathode materials for Li-ion batteries. So far, commercialization has been hindered by the poor cyclability and fast degradation of this class of materials. The degradation process is believed to start at the surface and progresses toward the bulk. In this context, a suitable cathode-electrolyte interphase (CEI) appears to be a crucial factor where the formation of LiF has been identified as a key component promoting interfacial stability. In the current work, we make use of a combined density functional theory (DFT) and kinetic Monte Carlo (kMC) approach. Using DFT, we determine relevant interfaces between Li2VO2F and LiF. Rejection-free kMC simulations with parameters based on DFT are then used to probe the kinetics in the charging and discharging process of the Li2VO2F phase. We find that the interface formed by joining Li2VO2F and LiF via their most stable surface terminations has a modest but positive effect on the charging rate, where the LiF phase acts as a funnel that facilitates the Li extraction from the bulk of the Li2VO2F phase. However, the same interface has a severe impeding effect on the discharging of partially delithiated structures, which is orders of magnitudes slower than in the charging process. We find that the key property controlling the kinetics in the discharging process is the difference in stability of Li vacancies in the Li2VO2F and LiF phases.
1. Introduction
The last years has seen a growing interest in transition metal oxyfluorides, not least the disordered rock-salt vanadium oxyfluoride (Li2VO2F), for utilization as Li-ion battery cathodes. This is due to their potential as high-capacity cathode materials, rendering them superior to their layered oxide counterparts for high energy-density battery applications.1 However, their low cyclability2 hinders the commercialization and wider adoption of this cathode technology.These high-capacity transition metal oxyfluorides operate according to an extraction mechanism of more than 1 Li+ per formula unit. While 2 Li+ could be reversibly deinserted in theory, this has been shown to destabilize the structure and lead to rapid capacity degradation. Chang et al.3 demonstrated the formation of peroxides and superoxides in the Li2VO2F bulk even when the charging potential is limited to a relatively low level of 4.1 V. Furthermore Källquist et al. have observed a continuous degradation process of Li2VO2F also at moderate levels of lithiation/delithiation, which starts in the surface layer of the active materials particles and then progresses onward towards the bulk.4 Strategies to mitigate such effects include doping of the active material with different elements (e.g. Li2V0.5M0.5O2F; M = Ti, Mn, Fe, Co)5,6 and surface coatings (e.g. AlF3),7 which have shown to be successful in enhancing cycling stability, at least in short to intermediate terms. As studies on electrolyte additives have shown,8 stabilization of the surface layer is profound if the long-term stability of these highly reactive cathode compounds is to be achieved. In this context, the problem of forming a suitable cathode electrolyte interphase (CEI) is a crucial factor.
It is interesting to note that the formation of LiF has generally been identified as a key component that promotes such interfacial stability, similar to what is often found for the anode side in Li-based battery chemistries. While LiF has intrinsically poor ionic conductivity (ca. 10−31 S cm−1),9 its chemical inertness seems to be key for the robustness and efficiency of battery interphases. It can also be speculated that the spontaneously formed LiF from electrolyte salt or solvent decomposition contains a high degree of defects, which in turn raises the ionic conductivity to more acceptable levels.
One aspect that has particularly been under scrutiny for the disordered rock-salt phases is the role of local order/disorder in these materials and its connection to Li transport via the formation of so-called zero-transition-metal pathways, a concept that was previously developed for transition metal oxides by the group of Gerbrand Ceder.10–12 In recent studies by Chang et al.,13,14 a Density Functional Theory (DFT) based approach has been applied to a range of disordered lithium rock-salt phases such as LixVO2F and LixCrO2F, showing that these materials at high lithiation levels adopt a layered configuration with alternating sheets of Li2F and VO2 which turns into a disordered structure upon delithiation. However, the crucial CEI layer and its structure-dynamic properties have so far been largely unexplored by computational tools despite its high relevance and importance in understanding and further exploration of better functioning oxyfluoride cathodes. Here, we investigate Li-ion transport in the Li2VO2F/LiF interfacial region using a kinetic Monte-Carlo (kMC) simulation approach based on DFT calculations to obtain the relevant energetics.
Several simplifications and approximations are necessary to make our simulations tractable. Therefore, we focus on conditions close to the full lithiation limit and use the layered Li2VO2F structure, which has been determined to be the ground-state structure in a theoretical study of Chang et al.15 As mentioned, there is an extensive discussion in the literature regarding the role of disordering and the impact of zero-transition-metal pathways on the Li kinetics in this type of system. However, the focus of the current contribution is on the role of the LiF interface, and thus, we limit our study to the ordered Li2VO2F and leave studies of interfaces between LiF and disordered Li2VO2F for later.
The aim of this study is to explore how LiF in the CEI layer controls the kinetics of the lithium intercalation reaction of the disordered rock-salt phases. One more key assumption in this context is that the diffusion resistance in the electrolyte is not rate-determining but that the rate is controlled by diffusivity through the CEI layer.
2. Methods
The computational approach employed here is based on two distinct steps. Firstly, DFT calculations are performed to extract the relevant energetics of the system, including energy barriers for ionic migration and the overall thermodynamics and relevant potentials. Secondly, these parameters are used in kMC simulations, where the overall transport process from LiF to Li2VO2F is simulated.2.1. Density functional theory simulation protocol
All the DFT calculations were performed using the Vienna ab initio simulation package (VASP) in its implementation with plane-wave functionals.16–19 The Perdew–Burke–Ernzerhof (PBE20,21) exchange–correlation functional augmented with a rotationally invariant Hubbard-U correction by Dudarev et al.22 with the U value of 3.25 eV was used to describe the strongly correlated 3d electrons of vanadium correctly. Li was described using 1 valence electron (2s1), oxygen by 6 valence electrons (2s22p4), Flourine by 7 valence electrons (2s22p5), and Vanadium by 11 valence electrons (3p43d64s1). All structure were optimized until the maximum force on any one atoms were below 0.01 eV Å−1. In addition, when cells shapes and volumes were optimized all components of the stress tensor were less than 0.01 kbar. The Brillouin zone was sampled using a k-spacing where the distance between neighbouring points were smaller than 0.056 Å−1. In all calculations, the plane wave energy cut-off was set to 600 eV.Surface energies for the low-index surfaces of each crystal (Li2VO2F and LiF) were calculated using periodically repeated slabs consisting of N formula units terminated perpendicular to the (100), (110) or (111) directions. The surface energy was obtained by subtracting the energy of N formula units of the bulk material (calculated at the same level of theory) and dividing the area of the slab by two (since two equivalent surfaces are exposed in the slab model). Accordingly, the following formula was used to calculate the surface energy:
In the optimization of pristine bulk structures and interfaces, both the cell shape and cell volume were optimized. In the calculation of surface energies and in calculation involving Li vacancies, the cell was kept fixed at the corresponding optimized bulk/interface values.
2.2. Kinetic Monte-Carlo simulations of Li-ion/vacancy mobility
The dynamic behaviour of Li ions at the interface was analysed with the rejection-free kMC method (also known as the residence-time algorithm, n-fold way or the Bortz–Kalos–Lebowitz algorithm) using an in-house code. This approach relies on being able to calculate the rates of all possible events in the system. One of these is then selected randomly based on their rates, and the time of the system is also moved forward by a number dt which is based on the cumulative rate of all events Q according to:| dt = ln(1/u)/Q, |
3. Results and discussion
Fig. 1 shows a schematic representation of the model used to describe the Li2VO2F system in contact with a Li-metal anode. A CEI composed entirely of LiF is put on top of the cathode layer, while Li metal is employed as a lithium reservoir and working anode. The absence of an electrolyte in the model signifies that it is assumed that the Li-ion transport from Li metal to the cathode is not limited by electrolyte resistance. Moreover, Li metal determines the Li chemical potential in the simulations.3.1. Stability and structure of the interface
In order to assess the stability and atomic structure of likely solid electrolyte interphases, we have calculated and compared the surface and interface energies for a number of structures. In the following, we will focus on the behaviour of the Li2VO2F in its most stable crystalline form, which is a face-centred cubic structure with alternating VO2 and Li2F layers, while we use the conventional rock salt structure for LiF. The similarity of the two crystal structures allows coherent interfaces to form. These coherent interfaces correspond to joining two slabs, one of Li2VO2F and one of LiF, both exposing the same surface termination, e.g. (100). As a prelude to constructing such interfaces, we first consider the surface energy, Esurf, of the various (low-index) surface terminations of Li2VO2F and LiF alone.The calculations are straightforward for the non-polar surfaces but require extra care for the polar counterparts. In these latter cases, it is necessary to perform polarity compensation. Here, we have considered F-terminated surfaces with half occupation of F at the surface. This is a common strategy in theoretical simulations of such, so-called, Tasker type III surfaces.23 In the case of Li2VO2F the layers in the structure are oriented parallel to surface. It should be noted that in the interface, the half-occupied F-layers correspond to a fully occupied layered shared by Li2VO2F and LiF, and F vacancies are therefore neither visible nor present at such an interface. Table 1 collects the surface energies for the low-index surfaces of Li2VO2F and LiF. The low-energy surface for both materials corresponds to the non-polar (100) termination.
| Termination | LiF surface energy | Li2VO2F surface energy | Interface energy |
|---|---|---|---|
| (100) | 0.054 | 0.039 | 0.016 |
| (110) | 0.105 | 0.170 | 0.087 |
| (111) | 0.138 | 0.236 | 0.003 |
Returning to the interfaces, three types will be considered in the following. The first interface is formed by joining the most stable (100) surfaces (interface A in the following). We use a surface cell of the interface that corresponds to a p(4 × 3) surface cell of LiF(100). The second interface is perpendicular to alternating planes of Li2F and VO2 in the Li2VO2F structure (interface B in the following) and is formed by joining the materials through their polar (111) surfaces. The surface cell in this case corresponds to a p(4 × 4) surface cell of LiF(111). These two models are shown in Fig. 2. In addition to these we also consider an interface made from the (110) surface which corresponds to a p(4 × 3) surface cell of LiF(110) (not shown). This interface model has 8 atomic of both Li2F and Li2VO2F, just like the (100)/(100) model in Fig. 2a. All interface energies are also collected in Table 1. Interestingly, we find that the most stable interface corresponds to the least stable surface terminations of Li2VO2F and LiF. This can be partly explained from the smaller (on average) strain at the interface B compared to interface A. We determined the strain by comparing the lattice parameters of the optimised interfaces to those of the pristine bulk crystals.
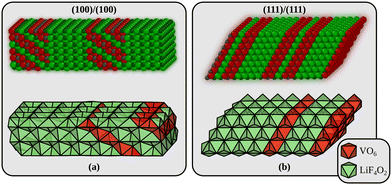 | ||
| Fig. 2 The two Li2VO2F/LiF interfaces used in the theoretical modelling. (a) Interface A is built by joining a Li2VO2F and a LiF slab exposing their low-energy surfaces. (b) Interface B is the most stable interface and corresponds to the least stable surface terminations of Li2VO2F and LiF (which join along a polar direction). Small gray spheres are V, large red spheres are O, large green spheres are F, and small dark green spheres are Li. The interface energies are given in Table 1. | ||
The strain along the two surface unit cell axes at interface A is +8.0/−1.2% and −3.8/−1.3% for LiF/Li2VO2F. The corresponding values for interface B are +5.5/+0.7% and +5.5/+0.7% (the unit cell axes are symmetrically equivalent at this interface).
Thus, depending on which of the energies – surface or interface – that are dictating the crystal growth, we will obtain particles with different morphology. While we have not attempted to address the issue of particle shape in our simulations, but will instead discuss the dynamic behaviour of both the above identified interfaces.
3.2. Li vacancy formation energies, migration barriers and kMC model
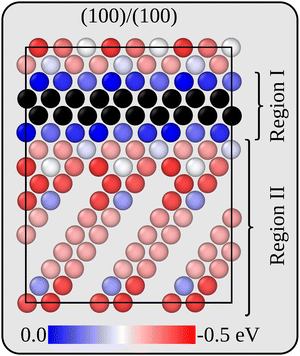
Before analysing the dynamics of Li and Li vacancies at the interfaces, it is necessary to estimate (relative) formation energies and migration barriers for Li vacancies. These energies constitute essential input to the kinetic Monte-Carlo method that is used in the dynamical simulations. It is also necessary to determine/estimate the mutual interaction energy of Li vacancies. The energy associated with removing Li ions from various positions in the two interface models has therefore been calculated at the DFT level. For the more stable interface B, Li vacancies inside the Li2VO2F region are 0.27 eV more stable than inside the LiF phase. The same general behaviour is also true for the less stable interface A, but here there are variations in the Li vacancy stability, and the same lateral position perpendicular to the interface may have slightly different energies. This behaviour is consistent with the symmetry of the two interfaces. While all Li positions in layers parallel to the interface are equivalent in interface B, they are not so in interface A. Fig. 3 provides a two-dimensional colour map displaying the relative stability of Li vacancies in the plane that contains the interface normal which is perpendicular to the VO2 and Li2F planes in the Li2VO2F structure.For simplicity and feasibility, a flattened version of the energy landscape is used in the kMC simulations, where Li vacancies at sites inside Li2VO2F and close to the interface (sites in region I in Fig. 3) are assigned to be 0.25 eV more stable than at the bulk LiF sites (sites in region II in Fig. 3). The calculated average value of type II sites is 0.28 eV lower than for type I sites.
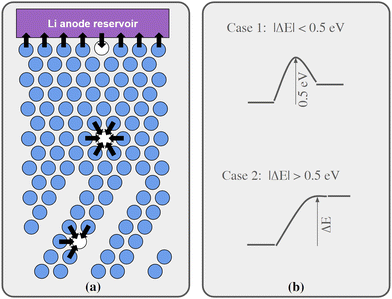
Regarding Li vacancy migration barriers, it can first be noted that the energy required for a Li vacancy to pass through the VO2 layer in bulk Li2VO2F is likely associated with a prohibitively large energy barrier. Given the very similar energies for Li vacancies on either side of the VO2 layer in interface B, we expect that the same also applies for this interface, i.e. when transferring Li from LiF to Li2VO2F or vice versa. Consequently, the VO2 layer can be expected to act as a pacifying layer that will severely impede ionic transport during charging/discharging. The situation at interface A is less obvious and requires further scrutiny. Therefore, targeted simulations were performed for this interface as presented below. Fig. 4a show a schematic representation of lattice model used in our kMC simulations of interface A.
We have calculated migrations barriers, using the climbing image nudged elastic band method24 for vacancy mediated diffusion of Li in (i) the middle of the LiF phase, (ii) the middle of the Li2VO2F phase, and (iii) in the interface between them. We used five images in these calculations. If the barrier height of these migration events in the direction towards the final states of higher energy is considered, they are all close to 0.5 eV, namely 0.50, 0.54, 0.50 eV for cases i, ii, and iii, respectively. Guided by these results, the barriers for migration steps were calculated by our kMC model according to the following protocol:
•If the energy of the final state was 0–0.5 eV higher than the initial state, the barrier was set to 0.5 eV.
•If the energy of the final state was more than 0.5 eV higher than the initial state, the barrier was set to be equal to the energy difference.
•If the final state was 0 to 0.5 eV lower in energy, the barrier was set to be 0.5 eV minus the energy difference.
•Finally, if the final state was more than 0.5 eV below the initial state, the barrier was set to 0 eV.
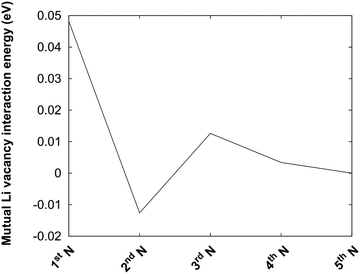
The protocol is also illustrated in Fig. 4b. Before the kMC model can be completed, a simplified energy model to rapidly estimate initial and final states needs to be derived. A key ingredient in such a model is the mutual interaction of Li vacancies. In order to estimate such interactions between Li vacancies, Li vacancy pairs at different separations in a 3 × 3 × 3 LiF supercell were considered. The energy profile is shown in Fig. 5. The energy required to bring two Li vacancies that are separated by a “large” distance (half space diagonal of the supercell) into close contact is about 0.05 eV. We also note that the energy variation beyond first neighbour separation is rather small, ∼0.01 eV. These results indicate that the mutual interactions are short-ranged and that LiF is effective in screening the Coulomb repulsion between vacancies. The energies are also small in comparison to the energy profile at the interface.
3.3. Kinetic Monte-Carlo simulations of charging and discharging – the effect of LiF layer thickness
Using the kMC protocol developed, the charging and discharging processes of Li2VO2F could be simulated for various numbers of LiF layers, corresponding to varying degrees of interphase layer formation.We put the potential at the Li-metal anode 0.25 V higher than the energy of an isolated vacancy in the LiF phase, i.e. corresponding to a value of +0.25 eV in Fig. 3. Given that the energy to introduce a Li vacancy in LiF computed with respect to Li metal using our computation setup is 3.55 eV, this would correspond to a voltage of 3.80 (3.55 + 0.25) V.
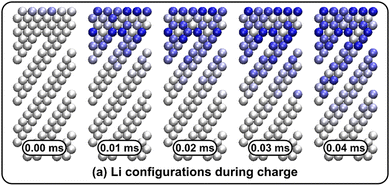
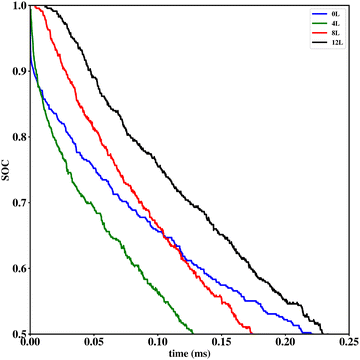
Li vacancy profiles in the form of two-dimensional color maps and their evolution with time are analysed in snapshots sampled every 0.01 ms along the trajectory; see Fig. 6 for an example. The results display some alternation in Li content between adjacent layers along the interface normal, where a lithium-rich layer is (often) followed by a Li-poor layer. This is most notable close to the contact as well as at the interface between LiF and Li2VO2F. This behaviour is likely a consequence of the mutual interaction between Li vacancies and the fast depletion of Li in the first layer. A similar behaviour has been observed in kinetic Monte-Carlo simulations of LiFePO4.25 The charging behaviour was quantified by monitoring the Li fraction in the system as a function of time. Fig. 7 compares the charging behaviour for interface A with different numbers of LiF layers. Initially, the charging is slower the more LiF layers there are, i.e. at more extensive CEI layer formation. However, the slope in the state-of-charge (SOC) profile that appears at longer time scales is similar in all systems with LiF present. This suggests that the difference originates from the initial Li depletion, which is very fast when only 4 layers of LiF is present, as compared to 8 or 12 layers. Interestingly, comparing the results for the systems with LiF to a system without any LiF interface (i.e., an interface A with zero layers of LiF), it can be observed that the slope at longer time is smaller in the absence of an interface. Thus, the LiF phase acts as a funnel that facilitates charging of the bulk material, while presumably also protecting the surface of the Li2VO2F material from further decomposition reactions. While this might appear as an ideal behaviour of a coating formed on an electrode surface, we will see below that such a positive effect of this CEI is unfortunately not the case during the battery discharging process; i.e. the lithiation of the oxyfluoride.
![[thin space (1/6-em)]](https://www.rsc.org/images/entities/char_2009.gif) 000 steps.
000 steps.
To make an estimate of the discharge rate, we instead resort to a mean-field model. The model is presented schematically in Fig. 8. In this model, the Li2VO2F phase is treated as a single entity in contact with the first LiF layer. The subsequent LiF layers are connected in a chain with the outermost layer connected to the contact. All entities (the LiF layers and the bulk Li2VO2F) are described in terms of a fractional occupancy of Li-vacancies, Pi. With this definition, the SOC of Li2VO2F becomes equal to (1 − P0). The rate constants, Qij, describing the transfer of Li-vacancies from a layer (or entity) to another, are given by:
The variation of ΔEvac is estimated as a function of fractional occupancy, P0, of Li-vacancies in the bulk Li2VO2F phase using the regular Monte-Carlo simulations presented in the opening of this subsection. Using fractions of 0, 0.125, 0.25, 0,375 and 0.5, ΔEvac values of, −0.25, −0.24, −0.23, −0.20 and −0.14 eV, respectively, are obtained. Note that it is assumed that the fraction of Li-vacancies in the LiF layers is small enough, so that we can neglect vacancy–vacancy interactions in our simplified model. A negative ΔEvac obtained means that the Li-vacancy is more stable in the bulk Li2VO2F phase. Thereby, all ingredients to set up our mean-field model exists. If the initial values for Pi are known, the time evolution Pi(t) can be determined from a set of coupled differential equations where the time derivatives Pi′(t) are related to the rate constants and the fractional occupancy of Li-vacancies at adjacent layers denoted by subscript numbers (1, 2, 3). For example, P2′(t) is given by:
| P2′(t) = P1(t)Q12 − P2(t)Q21 − P2(t)Q23 + P3(t)Q32 |
| P0′(t) = −P0(t)Q01 + αP1(t)Q10; P1′(t) = −P0(t)Q01 + α−1P2(t)Q21 |
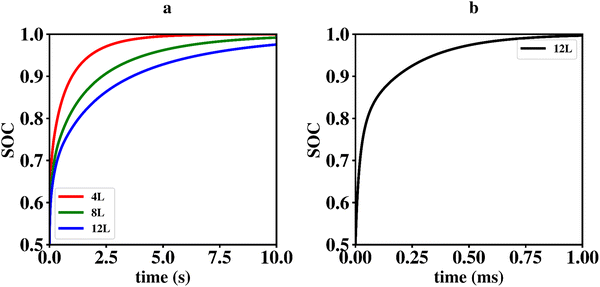
Since ΔEvac – and consequently Q10 and Q01 – depend on P0 in a non-trivial way, it is difficult to solve this problem analytically. We therefore constructed a simple code in the computer language octave to solve the differential equations numerically. The model makes use of a linear interpolation to determine ΔEvac for arbitrary values of P0 in the range from 0–0.5. The initial values for the fractional occupancy of Li-vacancies, Pi(0), are all set to zero apart from P0(0) which is set to 0.5. Using an α of 0.08 which match the situation in the kMC simulations presented above results in the graphs shown in Fig. 9a. From these graphs, it is apparent that the time-scales for charging and discharging of the Li2VO2F phase in the presence of a CEI formed by LiF differ by orders of magnitudes. The importance of ΔEvac in determining the discharge rate can be highlighted by comparing the results of our mean-field model to a simulation using a constant ΔEvac set to zero, as shown in Fig. 9b. The discharging behaviour for the latter model is orders of magnitudes faster and comparable to time-scales in the charging behaviour from the kMC modelling of Section 2.3.1.
4. Conclusions
Dynamic atomic-scale models of the ionic transport between the SEI or CEI layers, and the active electrode material in Li-ion batteries, are scarce in literature. Here, we have shown the possibility of using a combined approach of density functional theory (DFT) calculations and kinetic Monte-Carlo (kMC) simulations. First, DFT has been used to determine relevant interfaces between Li2VO2F and LiF. Rejection-free kinetic Monte-Carlo simulations (kMC) were then used to probe the kinetics of the charging and discharging process of the Li2VO2F phase. It is then seen that the interface formed by joining Li2VO2F and LiF via their most stable surface terminations has a modest but positive effect on the charging rate, where the LiF phase acts as a funnel that facilitates the Li extraction from the bulk of the Li2VO2F phase. However, the same interface has a severe impeding effect on the discharging of partially delithiated structures, which is orders of magnitudes slower than in the charging process.Using a mean-field model to describe the discharging process, it is found that the key property controlling the kinetics in the discharging process is the difference in stability of Li vacancies in the Li2VO2F and LiF phases. This suggests that the Li vacancy formation energy difference could be used as an effective descriptor for estimating the expected impact on Li kinetics in the formation of a CEI layer.
Given that a number of approximations and simplifications have been used to make the simulations feasible as well as easily interpretable we do not expect that the data presented here is expected to reproduce quantitatively what could be measured experimentally. However, we are confident that our simulations should provide qualitative agreement.
Data availability
The data supporting this article have been included as part of the ESI.†Conflicts of interest
There are no conflicts to declare.Acknowledgements
This research was funded by the “LiRichFCC” (“A new class of powerful materials for electrochemical energy storage: lithium-rich oxyfluorides with cubic dense packing”), FET-Open call of the European Union Horizon 2020 program under the contract No. 711792. JK, SD and DB also acknowledge support from STandUP for Energy and eSSENCE. We also acknowledge the Swedish National Infrastructure for Computing (SNIC) for providing the computer resources used in this project.References
- R. Chen, E. Maawad, M. Knapp, S. Ren, P. Beran, R. Witter and R. Hempelmann, Lithiation-Driven Structural Transition of VO2F into Disordered Rock-Salt LixVO2F, RSC Adv., 2016, 6(69), 65112–65118, 10.1039/C6RA14276A.
- S. Ren, R. Chen, E. Maawad, O. Dolotko, A. A. Guda, V. Shapovalov, D. Wang, H. Hahn and M. Fichtner, Improved Voltage and Cycling for Li+ Intercalation in High-Capacity Disordered Oxyfluoride Cathodes, Adv. Sci., 2015, 2(10), 1500128, DOI:10.1002/advs.201500128.
- Y. Wu, X. Liu, L. Wang, X. Feng, D. Ren, Y. Li, X. Rui, Y. Wang, X. Han, G.-L. Xu, H. Wang, L. Lu, X. He, K. Amine and M. Ouyang, Development of cathode-electrolyte-interphase for safer lithium batteries. Energy Storage, Materials, 2021, 37, 77–86 Search PubMed.
- I. Källquist, A. J. Naylor, C. Baur, J. Chable, J. Kullgren, M. Fichtner, K. Edström, D. Brandell and M. Hahlin, Degradation Mechanisms in Li2VO2F Li-Rich Disordered Rock-Salt Cathodes, Chem. Mater., 2019, 31(16), 6084–6096, DOI:10.1021/acs.chemmater.9b00829.
- M. A. Cambaz, B. P. Vinayan, H. Euchner, S. A. Pervez, H. Geßwein, T. Braun, A. Gross and M. Fichtner, Design and Tuning of the Electrochemical Properties of Vanadium-Based Cation-Disordered Rock-Salt Oxide Positive Electrode Material for Lithium-Ion Batteries, ACS Appl. Mater. Interfaces, 2019, 11(43), 39848–39858, DOI:10.1021/acsami.9b12566.
- C. Baur, I. Källquist, J. Chable, J. H. Chang, R. E. Johnsen, F. Ruiz-Zepeda, J.-M. A. Mba, A. J. Naylor, J. M. Garcia-Lastra, T. Vegge, F. Klein, A. R. Schür, P. Norby, K. Edström, M. Hahlin and M. Fichtner, Improved Cycling Stability in High-Capacity Li-Rich Vanadium Containing Disordered Rock Salt Oxyfluoride Cathodes, J. Mater. Chem. A, 2019, 7(37), 21244–21253, 10.1039/C9TA06291B.
- A. J. Naylor, I. Källquist, D. Peralta, J.-F. Martin, A. Boulineau, J.-F. Colin, C. Baur, J. Chable, M. Fichtner, K. Edström, M. Hahlin and D. Brandell, Stabilization of Li-Rich Disordered Rocksalt Oxyfluoride Cathodes by Particle Surface Modification, ACS Appl. Energy Mater., 2020, 3(6), 5937–5948, DOI:10.1021/acsaem.0c00839.
- I. Källquist, J.-F. Martin, A. J. Naylor, C. Baur, M. Fichtner, J.-F. Colin, D. Brandell, K. Edström and M. Hahlin, Influence of Electrolyte Additives on the Degradation of Li2VO2F Li-Rich Cathodes, J. Phys. Chem. C, 2020, 124(24), 12956–12967, DOI:10.1021/acs.jpcc.0c02840.
- Q. Zhang, J. Pan, P. Lu, Z. Liu, M. W. Verbrugge, B. W. Sheldon, Y.-T. Cheng, Y. Qi and X. Xiao, Synergetic Effects of Inorganic Components in Solid Electrolyte Interphase on High Cycle Efficiency of Lithium Ion Batteries, Nano Lett., 2016, 16(3), 2011–2016, DOI:10.1021/acs.nanolett.5b05283.
- A. Urban, I. Matts, A. Abdellahi and G. Ceder, Computational Design and Preparation of Cation-Disordered Oxides for High-Energy-Density Li-Ion Batteries, Adv. Energy Mater., 2016, 6(15), 1600488, DOI:10.1002/aenm.201600488.
- J. Lee, A. Urban, X. Li, D. Su, G. Hautier and G. Ceder, Unlocking the Potential of Cation-Disordered Oxides for Rechargeable Lithium Batteries, Science, 2014, 343(6170), 519–522, DOI:10.1126/science.1246432.
- A. Urban, J. Lee and G. Ceder, The Configurational Space of Rocksalt-Type Oxides for High-Capacity Lithium Battery Electrodes, Adv. Energy Mater., 2014, 4(13), 1400478, DOI:10.1002/aenm.201400478.
- J. H. Chang, C. Baur, J.-M. A. Mba, D. Arčon, G. Mali, D. Alwast, R. J. Behm, M. Fichtner, T. Vegge and J. M. G. Lastra, Superoxide Formation in Li2VO2F Cathode Material – a Combined Computational and Experimental Investigation of Anionic Redox Activity, J. Mater. Chem. A, 2020, 8(32), 16551–16559, 10.1039/D0TA06119K.
- J. H. Chang, D. Kleiven, M. Melander, J. Akola, J. M. G. Lastra and T. VeggeCLEASE: A Versatile and User-Friendly Implementation of Cluster Expansion Method, arXiv, 2018, preprint, arXiv181012816 Cond-Mat Search PubMed.
- J. Hyun Chang, C. Baur, J.-M. A. Mba, D. Arčon, G. Mali, D. Alwast, R. Jürgen Behm, M. Fichtner, T. Vegge and J. M. G. Lastra, Superoxide Formation in Li2VO2F Cathode Material – a Combined Computational and Experimental Investigation of Anionic Redox Activity, J. Mater. Chem. A, 2020, 8(32), 16551–16559, 10.1039/D0TA06119K.
- G. Kresse and J. Furthmüller, Efficient Iterative Schemes for Ab Initio Total-Energy Calculations Using a Plane-Wave Basis Set, Phys. Rev. B: Condens. Matter Mater. Phys., 1996, 54(16), 11169–11186, DOI:10.1103/PhysRevB.54.11169.
- G. Kresse and J. Furthmüller, Efficiency of Ab-Initio Total Energy Calculations for Metals and Semiconductors Using a Plane-Wave Basis Set, Comput. Mater. Sci., 1996, 6(1), 15–50, DOI:10.1016/0927-0256(96)00008-0.
- G. Kresse and J. Hafner, Ab Initio Molecular-Dynamics Simulation of the Liquid-Metal–Amorphous-Semiconductor Transition in Germanium, Phys. Rev. B: Condens. Matter Mater. Phys., 1994, 49(20), 14251–14269, DOI:10.1103/PhysRevB.49.14251.
- G. Kresse and J. Hafner, Ab Initio Molecular Dynamics for Liquid Metals, Phys. Rev. B: Condens. Matter Mater. Phys., 1993, 47(1), 558–561, DOI:10.1103/PhysRevB.47.558.
- J. P. Perdew, K. Burke and M. Ernzerhof, Generalized Gradient Approximation Made Simple [Phys. Rev. Lett.77, 3865 (1996)], Phys. Rev. Lett., 1997, 78(7), 1396, DOI:10.1103/PhysRevLett.78.1396.
- J. P. Perdew, K. Burke and M. Ernzerhof, Generalized Gradient Approximation Made Simple, Phys. Rev. Lett., 1996, 77(18), 3865–3868, DOI:10.1103/PhysRevLett.77.3865.
- S. L. Dudarev, G. A. Botton, S. Y. Savrasov, C. J. Humphreys and A. P. Sutton, Electron-Energy-Loss Spectra and the Structural Stability of Nickel Oxide: An LSDA + U Study, Phys. Rev. B: Condens. Matter Mater. Phys., 1998, 57(3), 1505–1509, DOI:10.1103/PhysRevB.57.1505.
- C. Noguera, Polar Oxide Surfaces, J. Phys.: Condens. Matter, 2000, 12(31), R367–R410, DOI:10.1088/0953-8984/12/31/201.
- G. Henkelman, B. P. Uberuaga and H. Jónsson, A Climbing Image Nudged Elastic Band Method for Finding Saddle Points and Minimum Energy Paths, J. Chem. Phys., 2000, 113(22), 9901–9904, DOI:10.1063/1.1329672.
- P. Xiao and G. Henkelman, Kinetic Monte Carlo Study of Li Intercalation in LiFePO4, ACS Nano, 2018, 12(1), 844–851, DOI:10.1021/acsnano.7b08278.
Footnote |
| † Electronic supplementary information (ESI) available. See DOI: https://doi.org/10.1039/d4ya00163j |
| This journal is © The Royal Society of Chemistry 2024 |


