
 Open Access Article
 This Open Access Article is licensed under a Creative Commons Attribution-Non Commercial 3.0 Unported Licence
Photo-thermal conversion ability of PEG and H2O-based microfluids of sodium lignosulfonate and its carbonized form†
Fatemeh
Seifikar
a,
Saeid
Azizian
 *a and
Babak
Jaleh
b
*a and
Babak
Jaleh
b
aDepartment of Physical Chemistry, Faculty of Chemistry, Bu-Ali Sina University, Hamedan, Iran. E-mail: sazizian@basu.ac.ir; Fax: +98 813 8380709; Tel: +98 813 8282807
bDepartment of Physics, Faculty of Science, Bu-Ali Sina University, Hamedan, Iran
First published on 10th June 2024
Abstract
In the present work, colloidal systems of sodium lignosulfonate (lignin) and its carbonized form (C-lignin) in H2O and polyethylene glycol (PEG) were synthesized and used for solar-thermal conversion. PEG and H2O play the role of a dispersant of the suspended particles as the base fluids and an environment for transferring heat. Based on the results, PEG performs better as the base fluid than water. All the synthesized microfluids (MFs) were stable at an optimum concentration of 0.2 g/60 ml. The comparative studies show that the C-lignin/PEG has the best light-to-heat conversion efficiency. The C-lignin/PEG was used at high light intensities and for several heating/cooling cycles without losing its performance in heat generation. All the calculated thermo-physical parameters indicated that C-lignin/PEG is more eligible than lignin/PEG in photo-thermal conversion. The prepared C-lignin/PEG has several advantages: green, inexpensive and simplicity of the preparation procedure, not using a dispersant, high photo-thermal durability and heat-generation efficiency, and excellent ability to generate heat from sunlight.
1. Introduction
Sunlight energy is one of the renewable sectors that has grabbed remarkable interest mainly because of the continuous decrease in costs associated with manufacturing technologies. Mainly, two basic kinds of solar energy systems can be found: (1) the systems based on directly converting the incident sunlight into electricity (solar-photovoltaic), (2) the systems reliant on harvesting solar radiation to produce thermal energy as a green alternative renewable source (solar-thermal).1 The mechanism of the light-to-heat conversion is via the photo-excitation process and then thermal energy (heat) generation by the materials.2Harvesting of solar energy is possible by utilizing several technologies like solar cells, concentrators, and solar thermal collectors to generate electricity and heat for the purpose of solar-powered desalination,3–5 heating/cooling systems,6 and electricity production.7
Nanofluids (NFs) and microfluids (MFs) that were used as heat transfer fluids are not a simple mixture of solid–liquid; in fact, they are complex colloidal systems obtained by dispersion of nanoparticles and microparticles in suitable base fluids. Compared to the corresponding base fluids, NFs and MFs show an increased convective heat-transfer coefficient as well as thermal conductivity. These outstanding properties make NFs and MFs potential candidates to be used in different fields, including heating/cooling systems, petrochemicals, pulp, textiles, food,8 water desalination,3,4 and photo-thermal conversion.9–11 As the suspensions are inherently and thermodynamically unstable, NFs and MFs usually suffer from agglomeration as well as aggregation of the suspended particles, leading to a deficiency in their thermo-physical properties.8 Also, long-time preparation or needing high temperatures,12 dispersion instability,13 producing by-products during the synthesis steps,14 using several chemicals,15etc., have always been vital issues for the practical application of NFs. Developing NFs or MFs with well-dispersed stability, especially at high pressure or temperature, is a challenging topic. The interaction between neighboring particles causes agglomeration due to the van der Waals interactions.2 Moreover, the difference between the density of particles and their base fluid makes the particles precipitate due to the gravitational force. This aggregation and sedimentation of the particles may remarkably decrease the heat transfer efficiency of the NFs and MFs. To produce NFs (MFs) with good colloidal stability, the addition of surfactants and particle coating methods have been developed. These NF (MF) production methods are categorized into two groups: (1) one-step and (2) two-step preparation techniques. In the one-step synthesis method, particles are prepared and dispersed in the conventional base fluids at the same time. This method decreases the agglomeration or sedimentation of the particles. The drawback of this method is that it cannot be applied to synthesize NFs (MFs) at a large scale. The second technique is the two-step preparation method which is more straightforward and cost-effective. In this synthesis technique, a dry powder of particles is first prepared and then dispersed in the base fluid by stirring, high-shear mixing, ultrasonication, homogenizing, and ball milling. The lack of dispersion stability is the main drawback of this method.
The base fluids used for the fabrication of NFs and MFs are water or organic fluids (oil, ethylene glycol, glycerol), or a mixed solution of aqueous-organic fluids (ethylene glycol/water, glycerol/water).16 MFs are capable of being used as antifreeze in engineering, in electronics as a coolant for microelectronic devices, in the power industry, in the oil industry to enhance oil production, and for the preparation of new medicines, varnishes, lubricants, cosmetics, paints,16etc.
PEG and its derivatives are classified as an environmentally sustainable alternative with a lot of advantages including being nonvolatile, high vapor density, non-toxicity, being highly stable in acids and bases, thermal stability, and high structure flexibility.17–19 Moreover, biodegradability and low inflammability of PEG and its derivatives make them be used as an environmentally sustainable alternative in various industrial and biological applications.17
In a recent development, i.e., a NP-based direct absorbing solar collector (DASC), NPs were employed for direct photo-thermal energy conversion. In the DASC, NPs directly absorb sunlight energy within the fluid volume. This efficient strategy has several advantages, such as enhancement of the total area of sunlight absorption and improvement of the effective radiative properties of the fluid.20 Different particles were used in converting light-to-heat, including graphene,21 plasmonic NPs (Pt,9 Ag,11 Au/TiN,22etc.), carbon dots,10 Fe3O4,20 Si,20 certain metal string complex particles,16etc.
Sodium lignosulfonate (lignin) is one of the most abundant organic compounds in the world and also is a by-product of the paper-making industries. The benefits of lignin are its low cost, good water dispersibility as a green and renewable resource, biodegradability, and nontoxicity.23
In the present work, by dispersing lignin and carbonized lignin (C-lignin) MPs in water and polyethylene glycol 200 (PEG) (for the first time), four microfluids: lignin/H2O, C-lignin/H2O, lignin/PEG, and C-lignin/PEG were prepared and their properties in light-to-heat conversion were investigated. All the components of the prepared microfluids are environmentally friendly. All the results, including their thermo-physical parameters, indicated that PEG is a better medium compared to water for dispersed lignin and C-lignin MPs in the generation of heat from light and the stable C-lignin/PEG has the best performance in photo-thermal conversion applications. The flowchart of the present work is shown in Fig. S1 (ESI†).
2. Experimental section
2.1. Chemicals and devices
Sodium lignosulfonate was received from Jooya Shimi company. Polyethylene glycol 200 (PEG) and deionized water (H2O) were used as the base fluids. The morphology of the lignin and C-lignin particles was obtained by field emission-scanning electron microscopy (FE-SEM) (TESCAN Vega3). Fourier transform infrared analysis (FT-IR) was used to investigate the functional groups of the lignin and C-lignin, and their absorption spectra in PEG were recorded using a PG-Instrument LTD model-T80 UV-Visible spectrophotometer, while X-ray diffraction analysis (XRD) (diffractometer D8-Siemens) was applied to find the crystalline structure of the powder samples. Energy dispersive X-ray analysis (EDX) (TESCAN Vega3) was used to gain an insight into the kind and percentage of the constituent elements of the lignin and C-lignin.2.2. Experimental photo-thermal conversion set-up
A glass-made cylinder covered with a thick layer of epoxy resin was used as a solar collector (inner diameter = 3.6 cm, outer diameter = 4.6 cm, and height = 5.4 cm). To minimize heat dissipation, the solar collector is surrounded by a layer of sponge. The MF was irradiated by a sunlight simulator (ss-103). An infrared thermal imaging camera (Hti HT-18) and three temperature sensors (DS18B20) were respectively used to record the surface temperature and variation temperature (at different heights from the surface of the fluids: H1 = 0.2, H2 = 0.9, and H3 = 1.9 cm) of the prepared carbonaceous fluids. By a TES-1333 Model solar power meter, the incident light radiation intensity was measured. During irradiation of MF by the solar simulator and consequently heat generation, the temperature changes of the sample (that was recorded using a data acquisition system (DAQ) as well as a computer) were plotted as a function of time.2.3. MF fabrication method
Lignin/H2O MF was obtained by adding 0.2 g of sodium lignosulfonate in 60 ml of deionized water and then sonicating the mixture in an ultrasonic bath (BSA-SK2-4.OL) for 30 min (Fig. S2a, ESI†). Also, to prepare lignin/PEG MF, 1 ml of deionized water was added to 0.2 g of sodium lignosulfonate and the obtained mixture was added to 60 ml of PEG. Then, it was heated for 30 min to evaporate the water so that the obtained MF became completely non-aqueous (Fig. S2b, ESI†). The reason for adding 1 ml of water to sodium lignosulfonate is to increase the initial dispersion of this substance in polyethylene glycol because this sample disperses quickly in water.To prepare C-lignin, 1 g sodium lignosulfonate was heated on a heater for 15 min at ∼267 °C, where the color of sodium lignosulfonate changed from brown to black. This color change indicates the carbonization of sodium lignosulfonate (Fig. S3a, ESI†). C-lignin/PEG was prepared using the same method as lignin/PEG (Fig. S3b, ESI†). First, 0.2 g of carbonized lignin was added to 1 ml of water so that the carbonized lignin particles were quickly dispersed in the water. Then, the obtained suspension was added to 60 ml of PEG and then heated for 30 min until 1 ml of added water was completely removed from the suspension. Finally, after 30 min, the C-lignin/PEG was prepared. To prepare C-lignin/H2O, 0.2 g carbonized lignin was added to 60 ml of deionized water and the obtained mixture was sonicated in an ultrasonic bath for 30 min (Fig. S3c, ESI†).
3. Results and discussion
Fig. 1a and b respectively show the FE-SEM images of lignin and C-lignin. According to the FE-SEM images, both samples have microparticles decorated with nanostructures and do not have a specific morphology. Lignin carbonization causes water to leave the sample, resulting in an increase in the roughness of the lignin, which can be seen in Fig. 1b.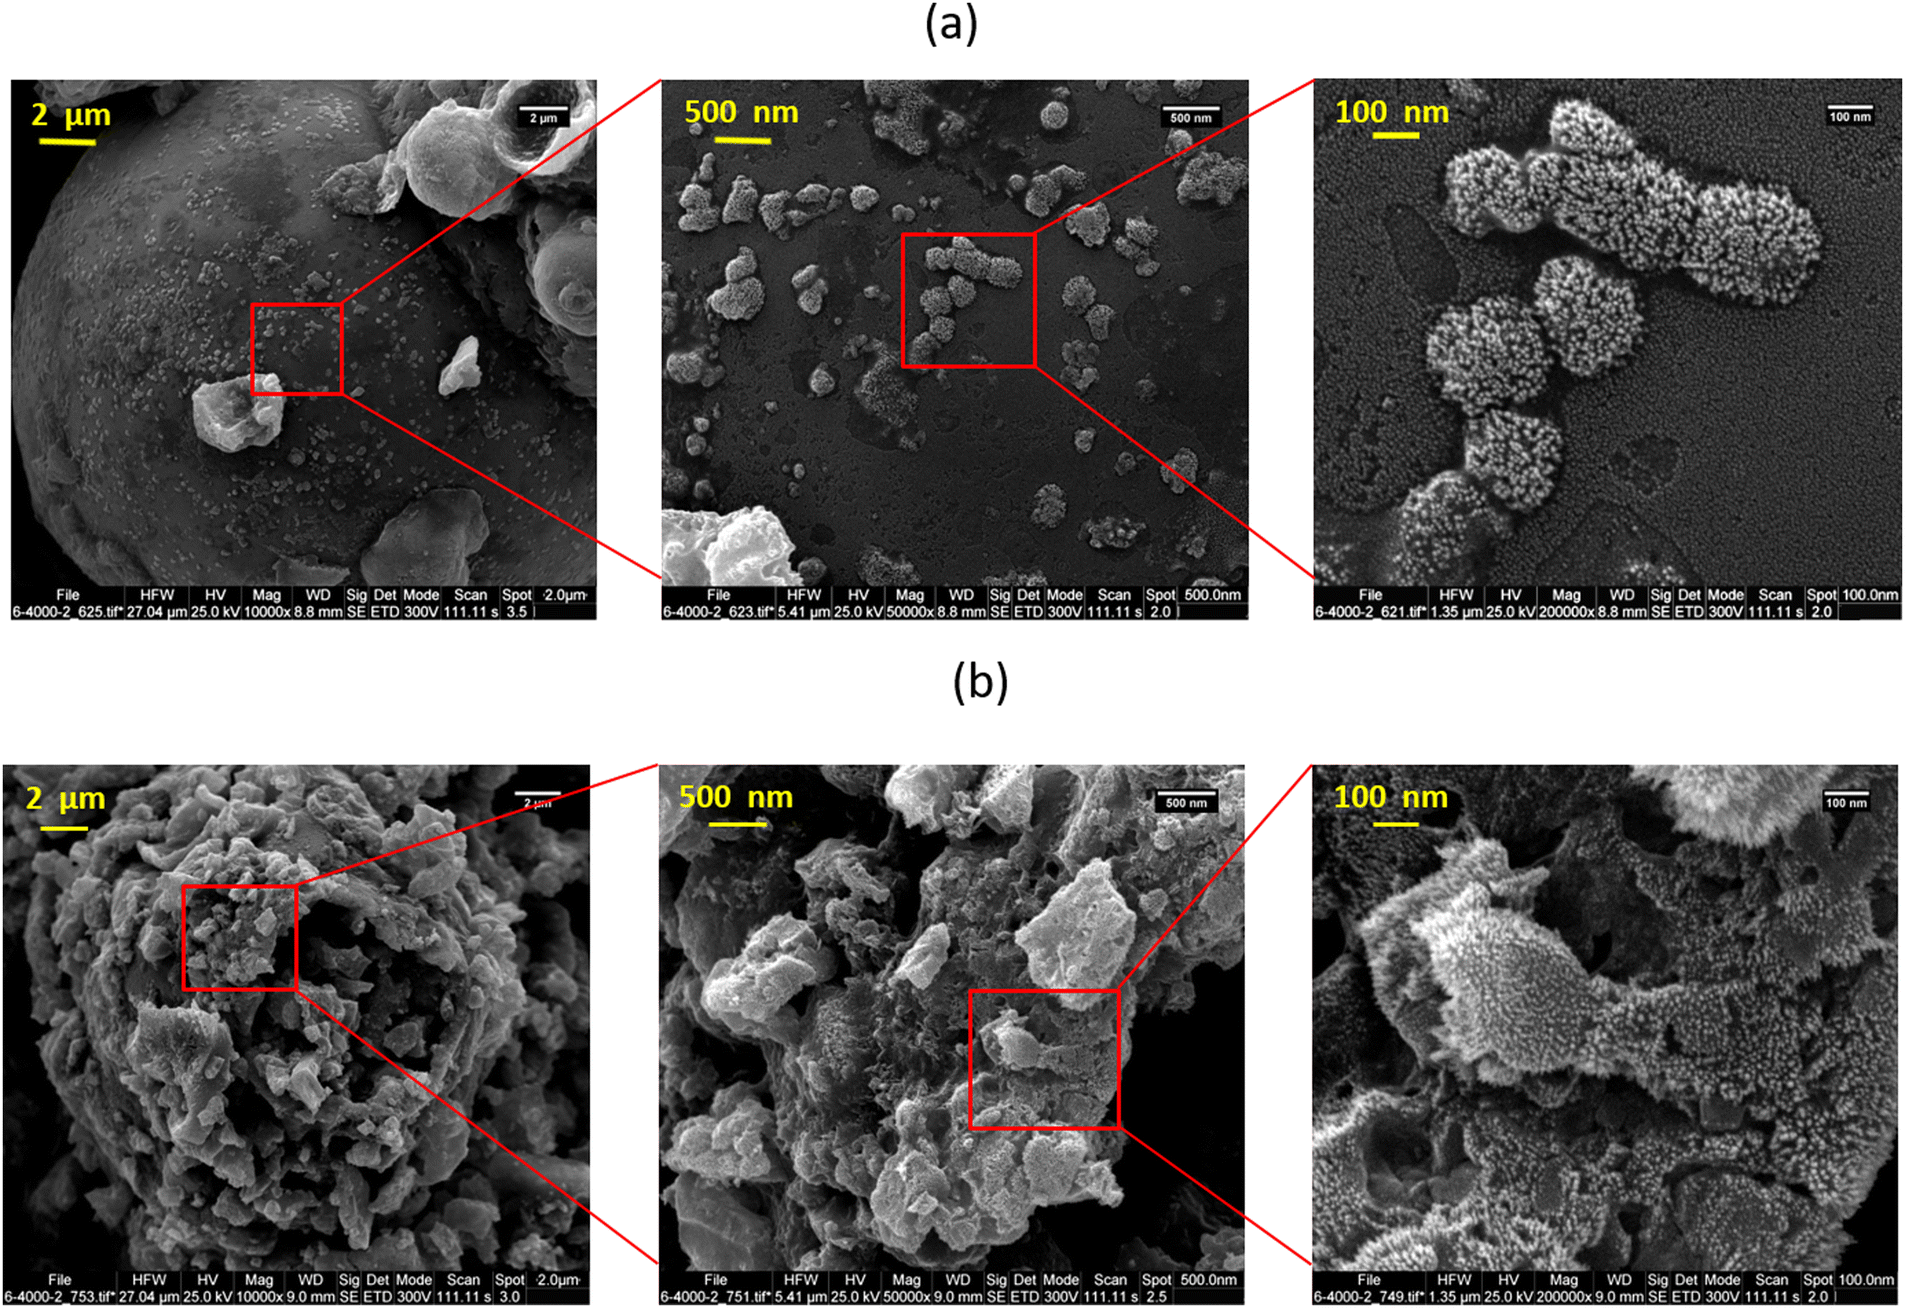 | ||
| Fig. 1 FE-SEM images of (a) lignin and (b) C-lignin with different magnifications. | ||
The results of the elemental analysis of the mentioned samples show that both samples contain Na, Cl, S, O, C, Mg, Ca, and N; and both samples consist of Na, C, S, O, and Cl (Fig. S4a and b for lignin and C-lignin, respectively, ESI†). In addition, the carbonization of lignin increases the percentage of carbon in C-lignin, which can be clearly confirmed by the obtained results of elemental analysis.
From the images of the elemental map, we can also see that the distribution of all elements throughout both samples is uniform (Fig. S5a and b, ESI†).
Fig. S6a (ESI†) presents the FT-IR spectrum of lignin and its carbonized form. The broad peak at 3397 cm−1 is ascribed to the stretching vibrations of the O–H group in carboxylic acids. The peak that appeared at 2964 cm−1 is related to stretching vibrations of C–H groups with carbon sp3 hybridization related to alkanes. The sharp peak at 1603 cm−1 and the medium peak at 1416 cm−1 are respectively ascribed to the stretching vibrations of C![[double bond, length as m-dash]](https://www.rsc.org/images/entities/char_e001.gif) O and C–O bonds in carboxylic acids. The sharp peak appearing at 1119 cm−1 is related to the out-of-plane bending vibrations of the C–H bond in alkenes. As can be seen from the similarity of the FT-IR spectra of both samples, the carbonization of lignin does not cause any dramatic change in its functional groups.24
O and C–O bonds in carboxylic acids. The sharp peak appearing at 1119 cm−1 is related to the out-of-plane bending vibrations of the C–H bond in alkenes. As can be seen from the similarity of the FT-IR spectra of both samples, the carbonization of lignin does not cause any dramatic change in its functional groups.24
To investigate the crystal structure of sodium lignosulfonate and its carbonized form, their XRD spectra were prepared (Fig. S6b, ESI†). From the appearance of similar peaks in both spectra, it can be concluded that the carbonization of lignin does not affect its crystal structure. Also, the appeared peaks at 2θ = 23°, 26°, 28°, 32°, and 33° are the main characteristic peaks of sodium lignosulfonate.25
Fig. S6c (ESI†) shows the UV-visible absorption spectra of lignin/PEG and C-lignin/PEG. Similarly, a sharp peak appeared around 235 nm indicating that both samples have the highest absorption in the UV region.
Dynamic light scattering (DLS) analysis was used with a Malvern Instruments Ltd, Zetasizer Ver. 7.11 to measure the solvodynamic particle size distribution of the C-lignin/PEG (Fig. S7a, ESI†), demonstrating that most of the microparticles have about 732 nm solvodynamic diameter. This large solvodynamic diameter shows that the microparticles of C-lignin are strongly surrounded by long chain PEG polymer, revealing high stability of the prepared MF.
The light path in both samples (the Tyndall effect) proves that colloidal systems having fine-sized particles (microfluids) are formed (Fig. S7b, ESI†). The dark color of the lignin/PEG and C-lignin/PEG is because of the introduction of lignin and carbonized lignin particles in PEG and the generation of stable MFs.
Fig. S8 (ESI†) shows the changes in the relative mass of the synthesized MFs and their base fluid during 60 min irradiation, where Δm and m0 are respectively mass changes and the initial mass of the sample. The lack of significant change in the relative mass of the samples is the reason for their high stability at high temperatures during converting light into heat.
The ability of the prepared water-based carbonaceous MFs in light-to-heat conversion was investigated (Fig. 2 and Fig. S9, ESI†). For this purpose, the temperature increase (ΔT) of the aqueous MFs was recorded under 60 min irradiation of the solar simulator (light intensity = 1 sun). For both synthesized MFs, the temperature rapidly rises at first, remarkably at the near-to-surface of the MFs (H1). Then, the rate of the temperature increment becomes slower until it meets the equilibrium point. The temperature increase of these samples has a similar trend and they have only about 3 °C temperature differences. For both MFs, the temperature increase at different depths shows this trend: surface > H1 > H2 > H3, which shows that the near-to-surface of the MFs absorbs the most incident light.
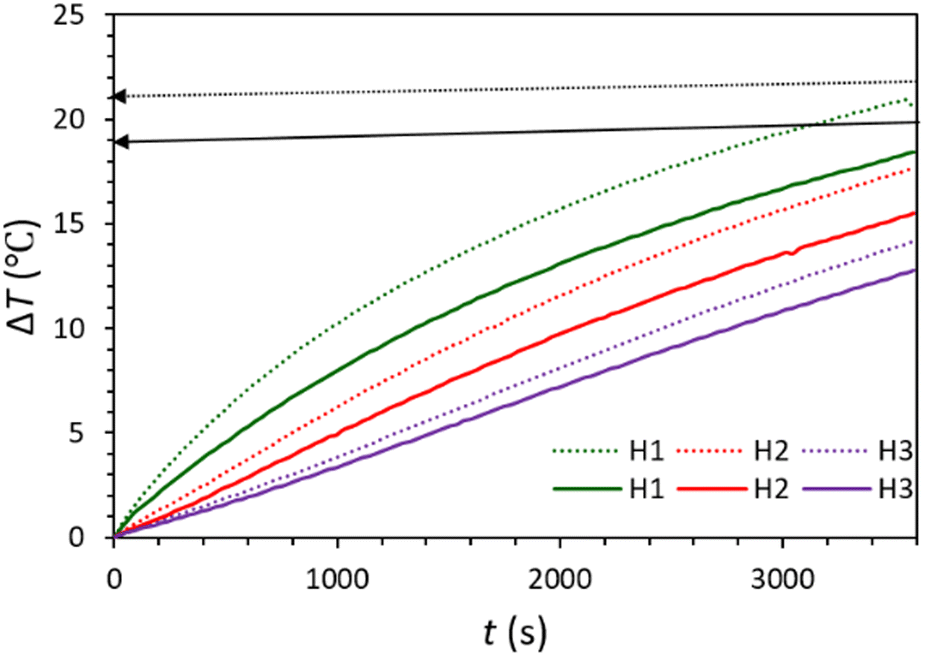 | ||
| Fig. 2 Temperature rise during photo-thermal conversion of lignin/H2O (solid diagrams) and C-lignin/H2O (dotted diagrams) fluids. | ||
Lignin/PEG and C-lignin/PEG MFs were investigated in terms of photo-thermal conversion capability. So, the mentioned MFs were prepared with different concentrations and were exposed to the light of a solar simulator with the intensity of 1 sun for 60 min (Fig. 3 and 4). The results indicated that the C-lignin/PEG MF has better light-to-heat conversion performance compared to lignin/PEG (Fig. 3 and 4). The reason for this is that the carbonization of lignin increases the percentage of carbon and, as a result, the color of the micro-particles becomes darker, and consequently, it absorbs more light. In addition, the carbonization of lignin increases the surface roughness, which increases the contact surface of particles with the surrounding medium. Therefore, the heat transfer of MF increases. Another point inferred from Fig. 3 and 4 shows that with the increase in the concentration of particles in both samples, a slight increase in temperature is observed. It should be noted that the increase in the concentration of particles causes the agglomeration and precipitation of particles. Therefore, the optimum concentration for the samples was chosen as 0.2 g/60 ml. Another point worth mentioning is that both samples have the highest light absorption and heat generation in the layers close to the surface of the MF because of the dark color of the mentioned samples (low transmittance). In particular, C-lignin/PEG has very low light transmittance.
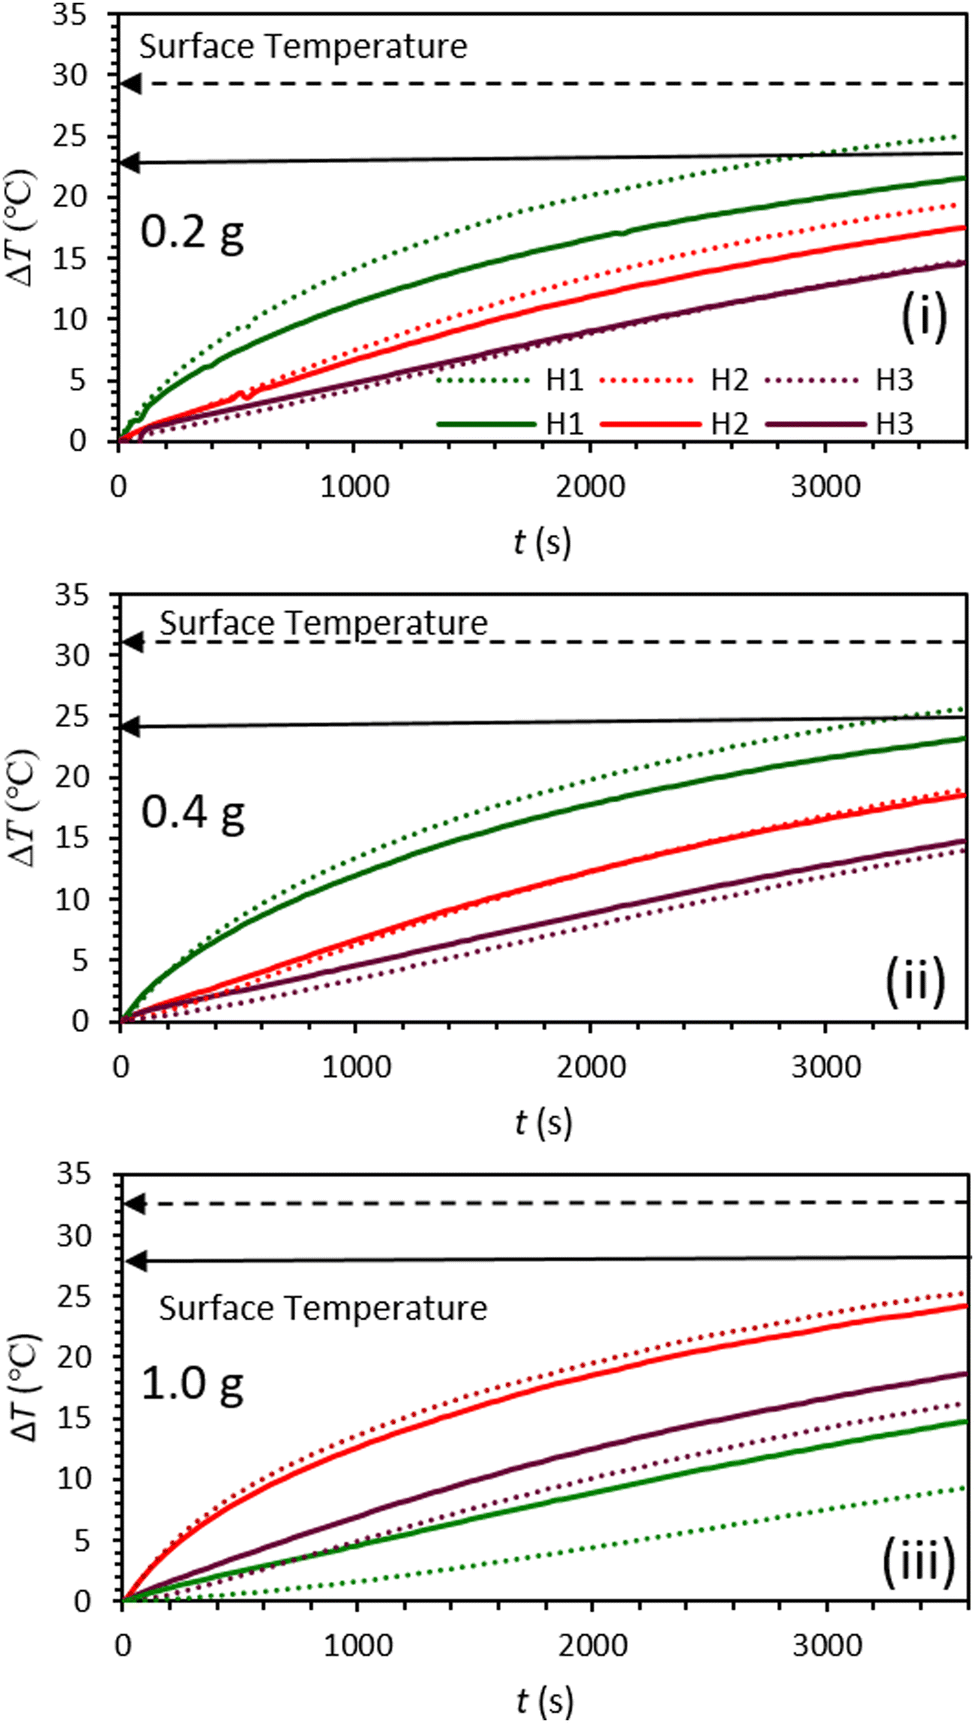 | ||
| Fig. 3 Graphs of temperature rise vs. time for lignin/PEG (solid lines) and C-lignin/PEG (dotted lines) microfluids with different concentrations (i–iii). | ||
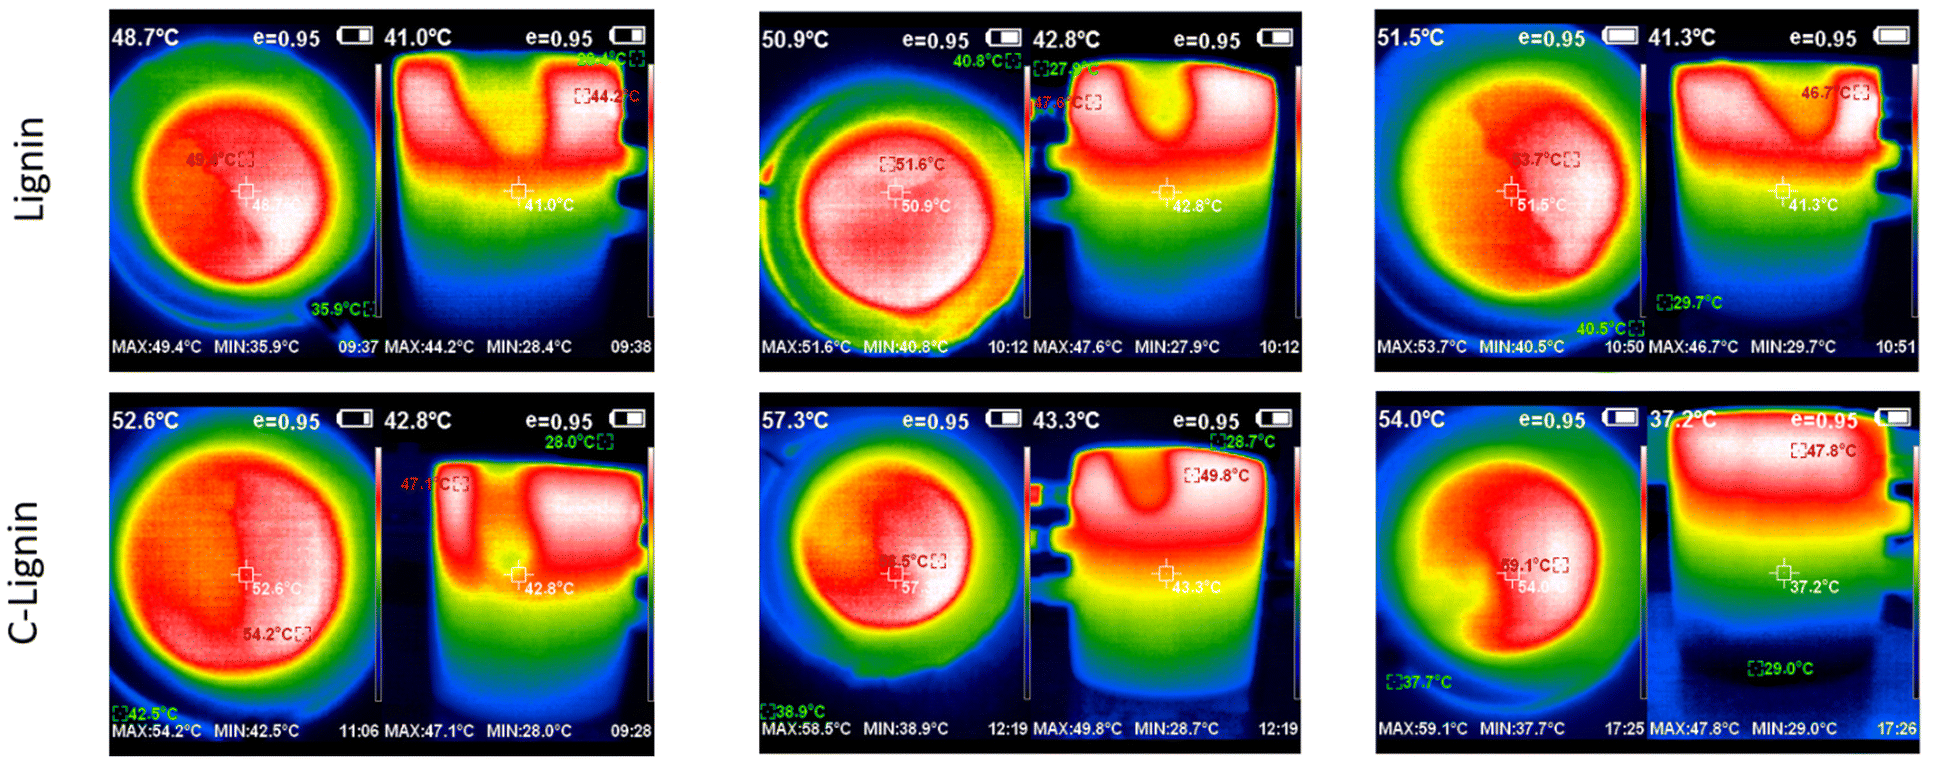 | ||
| Fig. 4 The corresponding thermographs for lignin/PEG and C-lignin/PEG microfluids with different concentrations. | ||
All the results from the photo-thermal conversion experiments indicated that lignin/H2O and C-lignin/H2O MFs showed poor photo-thermal conversion performance compared to lignin/PEG and C-lignin/PEG. Therefore, C-lignin/PEG MF was chosen as the selected sample due to its better photo-thermal conversion performance.
Fig. 5 shows the ability of C-lignin/PEG MF to convert light-to-heat under various illumination intensities. According to the obtained results, with the increase of radiation intensity, more heat is produced by the sample because more photons per unit of time reach the surface of the sample, and consequently, the probability of light absorption increases. For depth H1 under 100 min radiation with the intensity of 3 sun, the temperature rise of the sample is more than ΔT = 52 °C, which indicates the high ability of the C-lignin/PEG in terms of heat generation from incident light.
 | ||
| Fig. 5 Graphs of temperature rise vs. time for C-lignin/PEG with a concentration of 0.2 g/60 ml at different light intensities (i–iii). | ||
Fig. 6 shows the performance of C-lignin/PEG MF in converting light-to-heat after undergoing several consecutive heating/cooling cycles during 60 min of irradiation under 1 sun. The results indicate that the MF highly keeps its stability after six heating/cooling cycles. As a result, C-lignin/PEG MF is capable of being used as an efficient working fluid for heat generation by absorbing light.
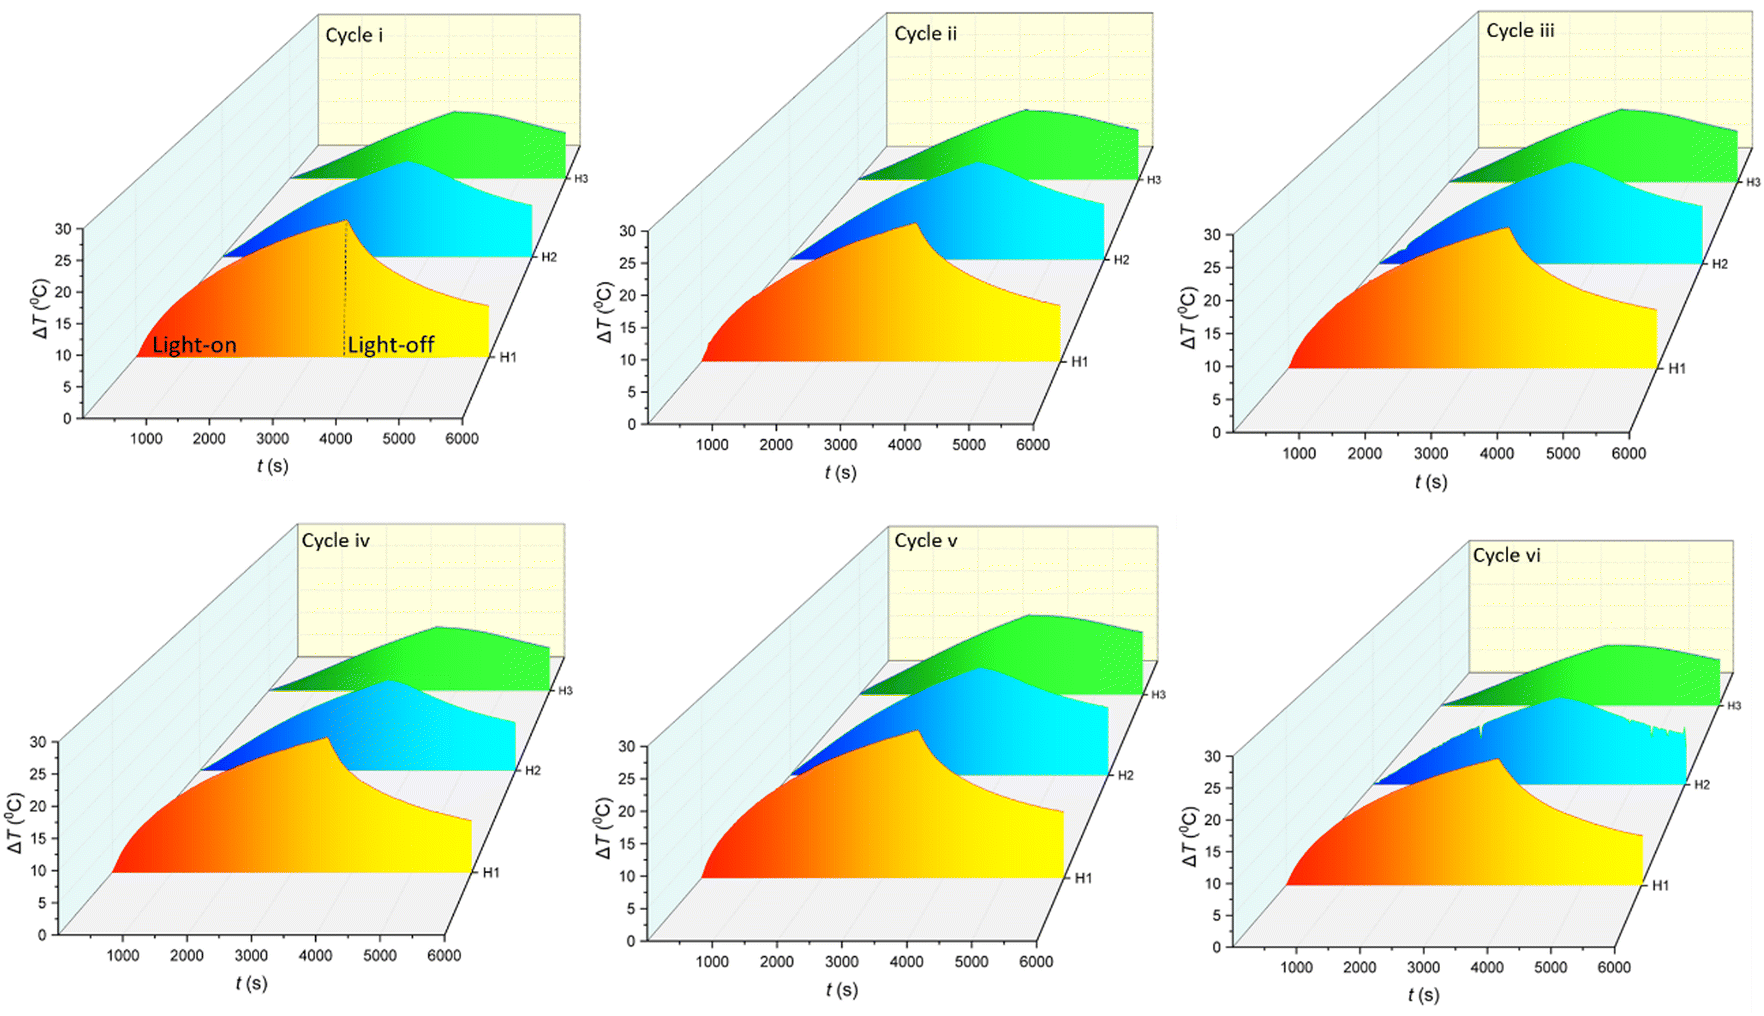 | ||
| Fig. 6 Alternative heating/cooling cycles of C-lignin/PEG MF. | ||
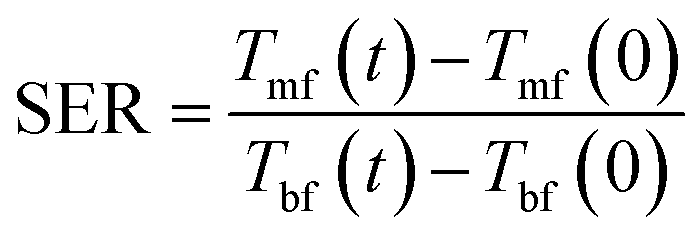
To investigate the effect of lignin micro-particles and its carbonized form (dispersed in the PEG) on the amount of energy absorbed by the working fluid, the ratio of stored energy (SER) for the samples was calculated from eqn (1):26
 | (1) |
According to Fig. 7, the height-dependent SER values of both samples reach their maximum value at about 15 min of irradiation and then remain constant. The SER value at H1 is higher than at other heights (because the near-to-surface of the MF absorbs most of the light). The value of SER for C-lignin/PEG MF at H1 height is approximately 1.4. This means that the ability of C-lignin/PEG MF in energy storage is 1.4 times more than that of PEG, while at the height H1, the SER value for lignin/PEG is close to 1.0 which indicates the better performance of C-lignin/PEG MF in energy storage.
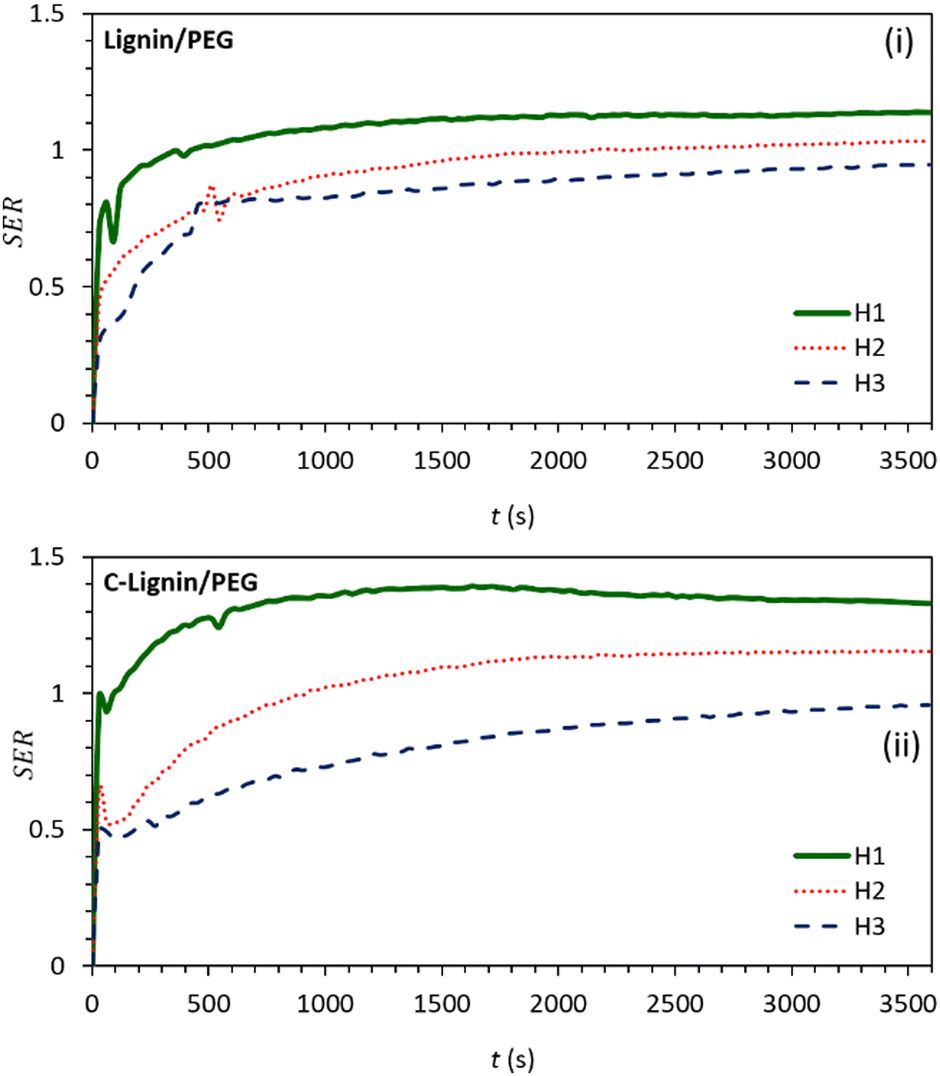 | ||
| Fig. 7 Graphs of stored energy ratio for (i) lignin/PEG and (ii) C-lignin/PEG MFs at different heights from the surface. | ||
Eqn (2) was used to calculate the total energy absorbed by MFs:27
| Etotal = wC(Tmax − Tmin) | (2) |
Fig. S10 (ESI†) shows the calculated Etotal graph for the prepared MFs at depths H1, H2, H3, and bulk. According to the obtained results, the Etotal values of C-lignin/PEG MF are much higher than lignin/PEG, which matches the calculated SER values. Therefore, the near-to-surface of MFs have the most photo-thermal conversion capability.
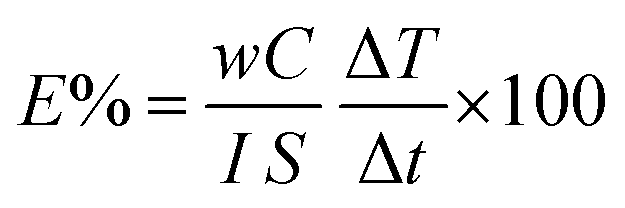
Photo-thermal conversion efficiency (E%) for the synthesized MFs was calculated from eqn (3):28
 | (3) |
Fig. 8 shows the E% for lignin/PEG and C-lignin/PEG MFs at different depths. Clearly, the photo-thermal conversion efficiency at H1 is more than H2 and H3, which is in agreement with the obtained results from the previous sections because the maximum amount of the generated heat is at the near-to-surface of the MFs. The E% for C-lignin/PEG has higher values than lignin/PEG. Therefore, C-lignin/PEG is the best sample for converting light into heat.
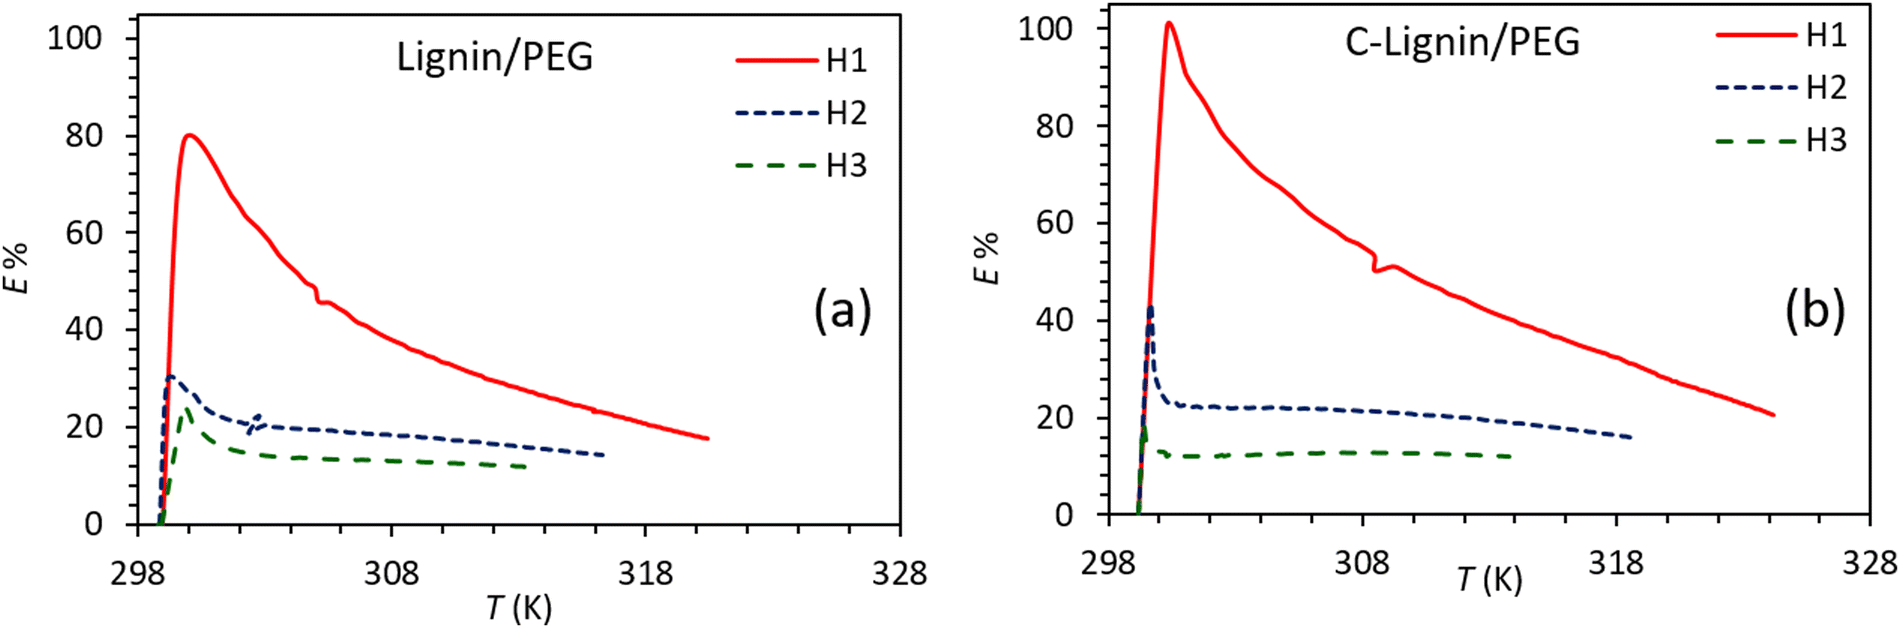 | ||
| Fig. 8 Photo-thermal conversion efficiency for (a) lignin/PEG and (b) C-lignin/PEG MFs. | ||
By fitting the experimental data with eqn (4) and (5),29 the rate constants of absorbing energy (A (°C s−1)) and heat dissipation (B (s−1)) were extracted and included in Table S1 (ESI†).
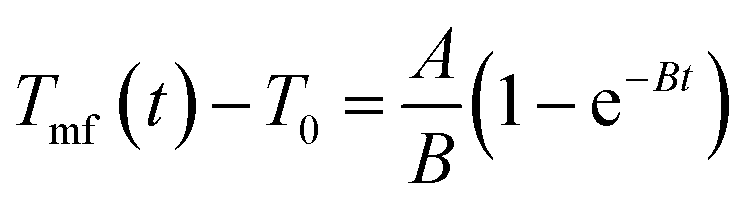 | (4) |
| Tmf(t) − T0 = (Tmf(0) − T0)e−Bt | (5) |
The results indicate that the loss and absorption of energy are the fastest in the layers close to the surface.
The ability of C-lignin/PEG to convert sunlight into heat was investigated. For this purpose, on a sunny day (24/07/2022) (with light intensity 0.97–0.98 sun, ambient temperature 30–31 °C), the sample was illuminated under sunlight. After that, temperature changes at different time intervals were recorded (Fig. 9). According to Fig. 9, the sample showed remarkable sunlight-thermal conversion performance so that after 1 hour, its surface temperature increased to 66 °C (ΔT ≅ 35 °C), which compared to the radiation of the sunlight simulator at 1 sun (Fig. 5(i)) shows greater temperature rise and the sample is significantly more qualified to convert sunlight into heat. The higher temperature increase by Sun irradiation is because of the wider electromagnetic radiation spectrum of sunlight (UV, visible, and IR)30, while the radiation of the sunlight simulator mainly corresponds to the visible region of solar light and does not cover the entire wavelength range of the solar light.
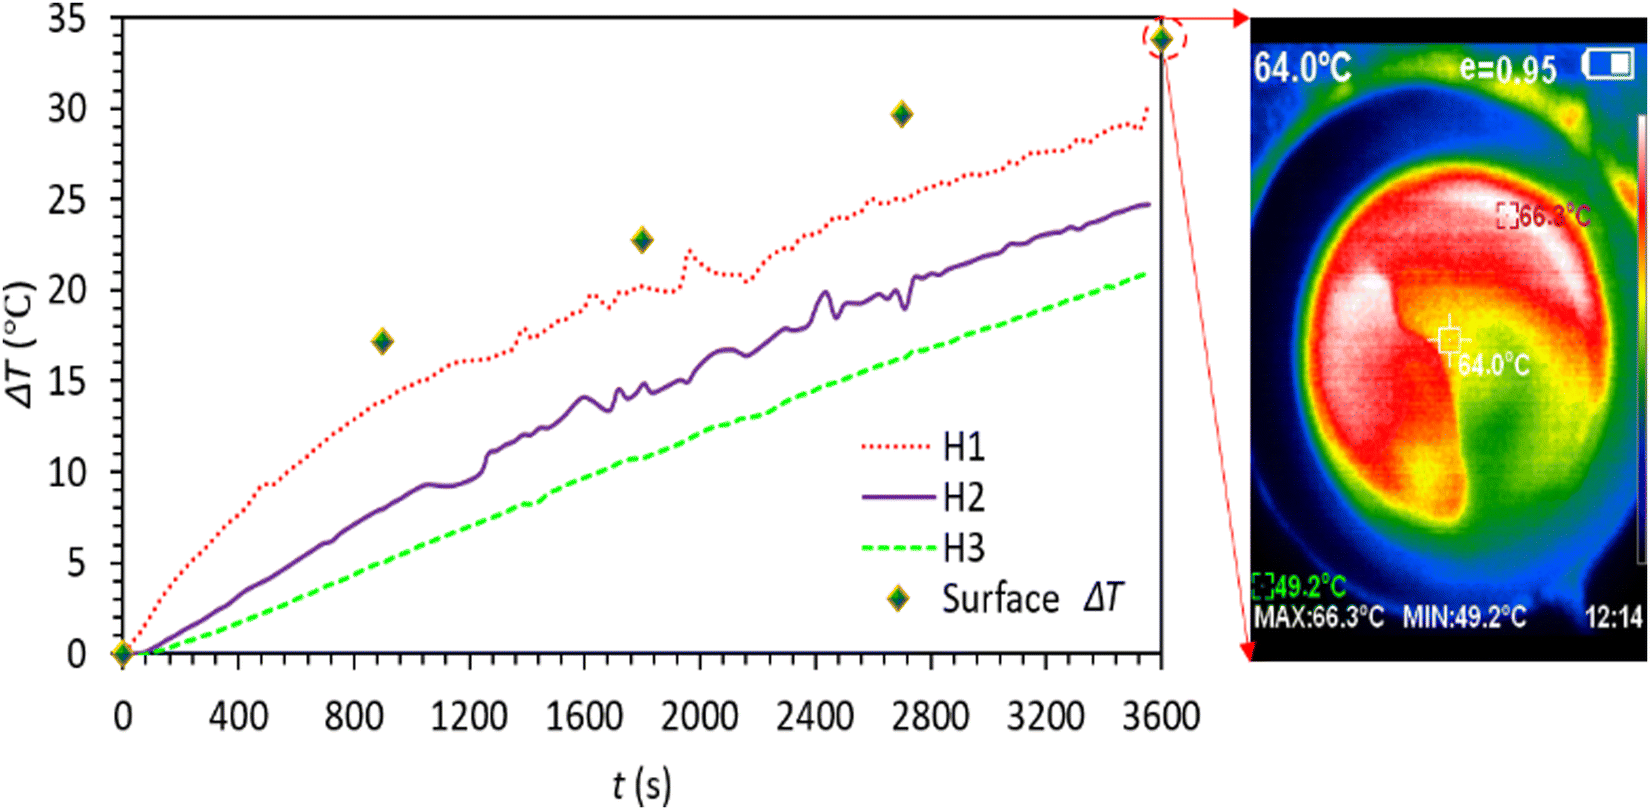 | ||
| Fig. 9 Time-dependent temperature profile of C-lignin/PEG MF under sunlight irradiation (ambient temperature: 30–31 °C). | ||
The main advantages of the prepared MFs in the present work are simplicity and fast preparation method, environmental friendliness, low cost, broad availability of the precursors, super stability without using any stabilizer, additives, surfactants, chemicals, salts, etc., and efficient utilization of a by-product (lignin) for sunlight energy harvesting as well as high photo-thermal conversion efficiency. Table 1 presents a brief comparison between some properties of the prepared MFs and other nanofluids. It should be noted that the mechanism of photo-thermal conversion by the carbonaceous materials is mainly based on electron excitation from π orbitals to π* orbitals via photon irradiation. Then by relaxation of the excited electrons to the ground state via vibration–electron coupling, the excess energy is released in the form of heat. Also, by conjugation of π orbitals the band gap decreases and the electron transition becomes easier.30
| Nanofluids | Preparation method | Preparation time | Stabilizer | Preparation cost | Ref. |
|---|---|---|---|---|---|
| Graphene oxide/water | Ultra-sonication | Fast | No | Medium | 31 |
| Nitrogen-doped carbon nanotubes decorated with gold–palladium | Chemical vapor deposition, polyethylene imine reduction method, sonication | Slow | No | High | 32 |
| β-Cyclodextrin modified carbon nanotubes | Ultra-sonication | Slow | Yes | High | 33 |
| Graphene oxide stabilized carbon nanotube-water | Modified Hummers' method, freeze-drying method, ultra-sonication | Slow | No | High | 34 |
| Multiwalled carbon nanotubes/ethylene glycol | Chemical vapor deposition, ultra-sonication | Slow | Yes | High | 35 |
| Modified graphene/ionic liquid | Centrifugation, vacuum condition, stirring | Slow | No | High | 8 |
| CQD/PEG | Microwave irradiation | Fast | No | Low | 10 |
| C-lignin/PEG, lignin/PEG | Sonication | Fast | No | Low | Present work |
Conclusions
In this work, environmentally friendly microfluids of lignin and C-lignin by mixing with PEG and water were simply synthesized and used for efficient conversion of light into heat. Fig. S1 (ESI†) briefly shows the research flowchart of this work. The results obtained from this work are:• According to the results obtained from FE-SEM analysis, the synthesized samples contain MPs decorated with nanostructures.
• Based on the results of the elemental analysis and also the elemental map, the distribution of all the constituent elements of both samples is uniform.
• Carbonization of lignin causes an increase in roughness, as well as an increase in the percentage of carbon and darkening of the color of the MF. For this reason, C-lignin/PEG absorbs more light and eventually converts it into heat.
• Carbonization does not change the crystallinity and the functional groups of the lignin.
• Lignin and C-lignin have poor performance in generating heat from light in water.
• The prepared C-lignin/PEG MFs do not require any additives (surfactants, harmful chemicals, salt, etc.) to stabilize and are naturally stable (even after 6 consecutive heating/cooling cycles).
• C-lignin/PEG MF showed a better ability to convert light into heat compared to lignin/H2O, C-lignin/H2O, and lignin/PEG and was considered as the selected sample. Actually, carbonaceous microparticles of C-lignin act as photon acceptors as well as local heaters towards converting incident light-into-heat. Therefore, micro-convection around the suspended microparticles is generated, causing more convective heat transfer.
• All the obtained thermo-physical parameters showed that the most suitable part of the MFs for photo-thermal conversion applications is the near-to-surface layers.
• The photo-thermal conversion efficiency of C-lignin/PEG is 100% and for lignin/PEG is approximately 80%.
• C-lignin/PEG has a very good performance in converting sunlight into heat, and in general, it is a suitable candidate for practical applications of photo-thermal conversion.
The preparation of magnetic C-lignin/PEG and lignin/PEG and the study of their photo-thermal properties in the presence and absence of an external magnetic field is suggested for future studies. Moreover, using concentrators like parabolic mirrors would be an efficient strategy to reach high temperatures during lower irradiation time.
Author contributions
Fatemeh Seifikar: data curation, formal analysis, investigation, methodology, validation, writing – original draft. Saeid Azizian: writing, review and editing, supervision, project administration, funding acquisition, conceptualization, visualization. Babak Jaleh: writing, review and editing, visualization, validation, supervision, conceptualization.Conflicts of interest
There are no conflicts to declare.Acknowledgements
The authors acknowledge the financial support (grant number 99-242) of Bu-Ali Sina University and Iran Science Elites Federation.Notes and references
- J. Walshe, G. Amarandei, H. Ahmed, S. McCormack and J. Doran, Sol. Energy Mater. Sol. Cells, 2019, 201, 110085 CrossRef CAS.
- T. Boldoo, J. Ham, E. Kim and H. Cho, Energies, 2020, 1, 5748 CrossRef.
- M. Khajevand, S. Azizian and R. Boukherroub, ACS Appl. Mater. Interfaces, 2021, 13, 31680–31690 CrossRef CAS PubMed.
- M. Khajevand, S. Azizian and B. Jaleh, Sep. Purif. Technol., 2022, 284, 120278 CrossRef CAS.
- M. Zhang, M. N. A. S. Ivan, Y. Sun, Z. Li, S. Saha, S. Ahmed, H. Liu, Y. Wang, Y. H. Tsang and W.-Y. Wo, J. Mater. Chem. A, 2024, 12, 905 Search PubMed.
- B. S. Almutairi, M. Alomar, N. Arshad, A. A. Hendi, M. S. Irshad and I. Ahmed, Energy Technol., 2024, 12, 2301026 CrossRef CAS.
- A. Armghan, J. Logeshwaran, S. Raja, K. Aliqab, M. Alsharari and S. K. Patel, Heliyon, 2024, 10, e26371 CrossRef CAS PubMed.
- J. Liu, C. Xu, L. Chen, X. Fang and Z. Zhang, Sol. Energy Mater. Sol. Cells, 2017, 170, 219–232 CrossRef CAS.
- F. Seifikar, S. Azizian, M. Eslamipanah and B. Jaleh, Sol. Energy Mater. Sol. Cells, 2022, 238, 111581 CrossRef CAS.
- F. Seifikar and S. Azizian, Energy Convers. Manage., 2021, 228, 113675 CrossRef CAS.
- F. Seifikar, S. Azizian, M. Eslamipanah and B. Jaleh, Sol. Energy, 2022, 246, 74–88 CrossRef CAS.
- L. He, H. Wang, H. Zhu, Y. Gu, X. Li and X. Mao, Appl. Sci., 2018, 8, 2613 CrossRef CAS.
- H. Kim, J. Ham and H. Cho, Case Stud. Therm. Eng., 2022, 35, 102151 CrossRef.
- W. Lingling, Z. Guihua, Y. Wei, Z. Dahai, Z. Yingchun, Z. Liye and X. Huaqing, J. Thermal Sci. Eng. Appl., 2018, 10, 011015 CrossRef.
- X. Liu, X. Wang, J. Huang, G. Cheng and Y. He, Appl. Energy, 2018, 220, 302–312 CrossRef CAS.
- B. A. Suleimanov, H. F. Abbasov, F. F. Valiyev, R. H. Ismayilov and S. M. J. Peng, Heat Transfer, 2018, 141, 1 Search PubMed.
- C. Verma and C. M. Hussain, Environmentally Sustainable Corrosion Inhibitors, Elsevier, 2022, pp. 321–333 Search PubMed.
- J. Soni, N. Sahiba, A. Sethiya and A. Agarwal, J. Mol. Liq., 2020, 315, 113766 CrossRef CAS.
- A. Hasaninejad and M. Beyrati, RSC Adv., 2018, 8, 1934–1939 RSC.
- H. Zhang, H. J. Chen, X. Du, G. Lin and D. Wen, J. Nanosci. Nanotechnol., 2015, 15, 4 Search PubMed.
- N. Wang, G. Xu, S. Li and X. Zhang, Energy Procedia, 2017, 105, 194–199 CrossRef.
- L. Wang, G. Zhu, M. Wang, W. Yu, J. Zen, X. Yu, H. Xie and Q. Li, Sol. Energy, 2019, 184, 240–248 CrossRef CAS.
- Y. Liu, W. Nie, Y. Mu, H. Zhang, H. Wang, H. Jin and Z. Liu, RSC Adv., 2018, 8, 11498 RSC.
- D. L. Pavia, G. M. Lampman and G. S. Kariz, Introduction to Spectroscopy, Saunders golden, 2nd edn, 1996 Search PubMed.
- X. Ji, M. Guo, L. Zhu, W. Du and H. Wang, Materials, 2020, 13, 5697 CrossRef CAS PubMed.
- C. L. L. Beicker, M. Amjad, E. P. B. Filho and D. Wen, Sol. Energy Mater. Sol. Cells, 2018, 188, 51–65 CrossRef CAS.
- A. Joseph, S. Sreekumar, C. S. S. Kumar and S. Thomas, J. Mol. Liq., 2019, 296, 111986 CrossRef CAS.
- C. Campos, D. Vasco, C. Angulo, P. A. Burdiles, J. Cardemil and H. Palza, Energy Convers. Manage., 2019, 181, 247–257 CrossRef CAS.
- H. Breitenborn, J. Dong, R. Piccoli, A. Bruhacs, L. V. Besteiro, A. Skripka, Z. M. Wang, A. O. Govorov, L. Razzari, F. Vetrone, R. Naccache and R. Morandotti, APL Photonics, 2019, 4, 126106 CrossRef.
- X. Cui, Q. Ruan, X. Zhuo, X. Xia, J. Hu, R. Fu, Y. Li, J. Wang and H. Xu, Chem. Rev., 2023, 123, 6891 CrossRef CAS PubMed.
- L. Chen, C. Xu, J. Liu, X. Fang and Z. Zhang, Sol. Energy, 2017, 148, 17–24 CrossRef CAS.
- L. Wang, G. Zhu, L. Shen, W. Yu, D. Zhu, Y. Zhang, L. Zhang and H. Xie, Therm. Sci., 2018, 22, 701–708 CrossRef.
- X. Li, W. Chen and C. Zou, Sol. Energy Mater. Sol. Cells, 2020, 204, 110240 CrossRef CAS.
- X. Wang, D. Liu, X. Liu and Y. He, IOP Conf. Ser.: Mater. Sci. Eng., 2019, 556, 012037 CAS.
- N. T. Tam, P. V. Trinh, N. N. Anh, N. T. Hong, P. N. Hong, P. N. Minh and B. H. Thang, J. Nanomater., 2018, 2018, 2750168 Search PubMed.
Footnote |
| † Electronic supplementary information (ESI) available. See DOI: https://doi.org/10.1039/d4ya00153b |
| This journal is © The Royal Society of Chemistry 2024 |