
 Open Access Article
 This Open Access Article is licensed under a
 Creative Commons Attribution 3.0 Unported Licence
Mechanisms underlying the acid leaching process for LiNi0.6Co0.2Mn0.2O2 with and without H2O2†
Kazuhiko
Mukai
 *,
Yasuhiro
Takatani
and
Takamasa
Nonaka
*,
Yasuhiro
Takatani
and
Takamasa
Nonaka
Toyota Central Research & Development Laboratories Incorporated, Yokomichi 41-1, Nagakute, Aichi 480-1192, Japan. E-mail: e1089@mosk.tytlabs.co.jp; Tel: +81-561-71-7698
First published on 11th April 2024
Abstract
Digesting lithium insertion materials in acid solutions is succeeded by into today's discovery and developments of lithium-ion batteries (LIBs), and has recently received significant attention as a leaching process for recycling spent LIBs. To explore more effective and eco-friendly leaching conditions, we elucidated the reaction mechanisms underlying the dissolution of LiNi0.6Co0.2Mn0.2O2 (NCM622) into an HNO3 solution with or without H2O2. Without H2O2, delithiated NCM622 powder remained even after 24 h, whereas, with H2O2, NCM622 completely dissolved into the solution within 3 h. X-Ray diffraction patterns, transmission electron microscopy, and X-ray Raman spectroscopy all indicated that the residual NCM622 powder maintained the initial Li composition during the entire leaching process with H2O2. However, soft X-ray absorption spectroscopy, which provides information on the electronic and oxidation states of a surface, revealed the presence of a delithiated NCM622 phase. Hence, successive oxidation and dissolution reactions on the surface occur during the leaching process with H2O2, enabling the rapid and complete dissolution of NCM622. The results of leaching with an eco-friendly organic acid are also presented, along with comparative leaching experiments with other positive electrode materials. These insights into the dissolution of lithium insertion materials in acid solutions could pave the way to more effective and eco-friendly acid leaching and solvent extraction processes.
1 Introduction
State-of-the-art technology and knowledge are not always established only on brand-new information. Confucius, an ancient Chinese thinker, preached the importance of attempting to discover new things by scrutinizing the past.1 Lithium-ion batteries (LIBs), which are essential for the information and communication devices that our society relies on, have reached a stage of maturation; thus, re-examining existing knowledge is required to further develop LIBs.2Conventional LIBs are based on a reversible electrochemical reaction, wherein Li+ ions move back and forth between positive and negative electrodes. This is called a topotactic reaction, which originated from a discovery by Goodenough and coworkers in 1980. They found that Li+ ions could be extracted from LiCoO2 with a layered structure in a nonaqueous electrolyte through the following reaction:3,4
| LiCoO2 → Li+ + e− + CoO2. | (1) |
Then, in 1981, Hunter proposed applying LiMn2O4 with a spinel structure to LIBs by examining a residual compound after digesting LiMn2O4 in several acid solutions such as HNO3 and H2SO4.5 Specifically, this chemical reaction is represented by
| 2LiMn2O4 + 4H+ → 2Li+(l) + 3λ-MnO2(s) + Mn2+(l) + 2H2O, | (2) |
| 2Mn3+ → Mn4+(s) + Mn2+(l). | (3) |
Substituting LiCoO2 into eqn (2), the electrochemical reaction in eqn (1) becomes
| 2LiCoO2 + 4H+ → 2Li+(l) + CoO2(s) + Co2+(l) + 2H2O. | (4) |
Eqn (2) and (4) correspond to the electrochemical oxidation reactions in LIB, although the interface of the LiCoO2 particles should be continuously renewed to proceed the chemical oxidation reaction. Particularly for layered LiNiO2, an insertion of H+ ions as well as the chemical oxidation reaction occur due to a partial structural change in oxygen packing sequence; i.e., from a cubic-closed packing to a hexagonal-closed packing.6–8 Details of differences between the electrochemical and chemical oxidation reactions have remained a subject of debate.
As the demand for LIBs has expanded rapidly, sustainable and green recycling technologies for spent LIBs are increasingly required to make efficient use of limited metal sources.9,10 Such technologies inevitably involve pyrometallurgy, which consists of acid leaching (digestion) and solvent extraction processes.11–13 Acid leaching agents include HNO3, H2SO4, HCl, and several organic acids,11–13 which are almost the same as those in Hunter's original experiments.5 A typical acid leaching reaction for LiCoO2 can be described by13
| 2LiCoO2 + 6H+ + H2O2 → 2Li+(l) + 2Co2+(l) + 4H2O + O2, | (5) |
We thus revisited this overlooked issue with LIBs by employing modern analysis methods such as high-angle annular dark field scanning transmission electron microscopy (HAADF-STEM), X-ray Raman spectroscopy (XRS), and soft X-ray absorption spectroscopy (XAS). XRS utilizes the inelastic scattering of hard X-rays, providing information equivalent to that of soft XAS under the dipole approximation.14–16 Because hard X-rays penetrate deeper, XRS conveys information on X-ray absorption edges in the bulk material, whereas soft XAS provides surface information (within ∼50 nm). We selected LiNi0.6Co0.2Mn0.2O2 (NCM622) as a model because of its increasing popularity as a positive electrode material for high-energy-density LIBs.17–21 Then, we examined the particle morphologies, crystal structures, electronic states, and electrochemical properties of NCM622 during the HNO3 leaching process with and without H2O2 and compared the reaction schemes between the two conditions. An in-depth understanding of the dissolution of NCM622 into an HNO3 solution could unveil the appropriate conditions for effective and eco-friendly acid leaching and solvent extraction processes. Consequently, we revealed the consecutive reactions of oxidation and dissolution on the surface of NCM622 with H2O2.
2 Experimental
2.1 Characterization
NCM622 powder was purchased from Hosen Corp. and characterized by synchrotron radiation X-ray diffraction (XRD), electrochemical charge and discharge tests, inductively coupled plasma atomic emission spectroscopy (ICP-AES; ICPS-8100, Shimadzu), scanning electron microscopy (SEM; SU3500, Hitachi High-Technologies), and transmission electron microscopy (TEM; JEM-2100F, JEOL). Approximately 2 mg of NCM622 was packed into a borosilicate glass capillary with a diameter of 0.3 mm (W. Müller Glas Technik) and exposed to X-rays for 10 min. Its XRD pattern was recorded at the BL5S2 beamline at Aichi Synchrotron Radiation Center (Aichi SR) using a two-dimensional (2D) detector (PILATUS 100 K, Dectris). The X-ray wavelength (λ) was determined to be 0.8000(2) Å using a silicon standard (NIST 640d). The Rietveld analysis was conducted using RIETAN-FP software,22 and the crystal structure was drawn schematically using VESTA software.23The TEM specimens were prepared using a dual-beam focused ion beam scanning microscope (Helios, FEI) with Ga ions at accelerating voltages from 2 to 40 kV. High-resolution TEM images were obtained at 200 kV using an objective lens with Cs = 0.5 mm. Energy dispersive X-ray spectroscopy (EDS) was conducted to clarify elemental distributions in the TEM specimens. HAADF-STEM images were recorded with a convergence semi-angle of 29 mrad and a collection angle of 75–200 mrad.
LiNi0.88Co0.09Al0.03O2 (NCA) and LiCoO2 (LCO) powders were also purchased from Hosen Corp. and NiO, Co3O4, and MnO2 powders were provided by FUJIFILM Wako Pure Chemical.
2.2 Electrochemical measurements
Electrochemical reactivity was examined in a Li cell using an electrolyte consisting of 1 M LiPF6 dissolved in a mixture of ethylene carbonate (EC) and diethylene carbonate (DEC) (EC/DEC = 1/1 by volume, Kishida Chemical). Different working electrodes were prepared by two methods, i.e., a wet process using polyvinylidene fluoride (PVdF; KF#1120, Kureha) and a dry process using polytetrafluoroethylene (PTFE; Sigma-Aldrich). For the wet-processed NCM622, NCA, and LCO electrodes, a black slurry containing one of these three active materials along with acetylene black (AB; HS-100, Denka), PVdF, and N-methyl-2-pyrrolidone (Nacalai Tesque) was cast onto an Al foil (thickness = 20 μm), dried under vacuum at 120 °C for 12 h, and finally cut into a disc with a diameter of 16 mm. The weight ratio of active material/AB/PVdF was 88/6/6. For the dry-processed NCM622, N_24, N + H_0.5, and N + H_1 electrodes, 75 wt% active material (∼10 mg), 20 wt% AB, and 5 wt% PTFE were pressed onto an Al mesh current collector (diameter = 10 mm). The N_24, N + H_0.5, and N + H_1 samples are described in the next section. Lithium cells were fabricated in an Ar-filled glovebox (DBO-2BLKP, Miwa Mfg) by pressing a Li metal sheet onto a stainless steel plate (diameter = 19 mm), which was utilized as a counter electrode. Two sheets of a polypropylene membrane with a thickness of 25 μm (TonenGeneral Sekiyu) were used as the separator. Charge and discharge tests were performed at a current of 0.3 mA (≃0.15 mA cm−2) for the wet-processed electrodes and 0.1 mA (≃0.13 mA cm−2) for the dry-processed ones. The voltage range was 3.0–4.4 V, and the environmental temperature of the cells was 25 °C.2.3 HNO3 leaching with or without H2O2
One gram of the NCM622 powder was immersed in 50 ml of a 1 M HNO3 solution (FUJIFILM Wako Pure Chemical), and then stirred for 0.25, 0.5, 0.75, 1, 1.5, 2, 3, 4, 8, or 24 h at room temperature (RT; ∼22 °C). These samples are hereafter labelled “N” for nitric acid and suffixes indicating their leaching time in hours, i.e., N_0.25, N_0.5, etc. (Table 1). We employed HNO3 as a leaching acid by considering its strong oxidizing power compared to those for H2SO4 and HCl. In addition, 1 g of the NCM622 powder was immersed in a 1 M HNO3 solution including H2O2 of 1 ml (purity ∼30 wt%, FUJIFILM Wako Pure Chemical), and then stirred for 0.25, 0.5, 0.63, 0.75, 1, 1.5, 1.75, 2, 3, 4, 8, or 24 h at RT. These samples are hereafter labeled “N + H” indicating immersion in both nitric acid (N) and hydrogen peroxide (H) with similar suffixes indicating their stirring time in hours, i.e., N + H_0.25, N + H_0.5, etc. (Table 1).| Sample no. | Sample notation | H2O2 | Leaching time/h | w/% | Li/Ni/Co/Mn ratioa | Lattice parameters/Å | Analyses |
|---|---|---|---|---|---|---|---|
| a Li/Ni/Co/Mn ratios in the liquid (l) phase are provided for N_1, N_4, N_24, and N + H_1. | |||||||
| 1 | Pristine | — | — | 100 | 1.02/0.60/0.20/0.20 | a h = 2.8677(1) | XRD, SEM, TEM |
| c h = 14.219(1) | XAS, XRS | ||||||
| 2 | N_0.25 | w/o | 0.25 | 94 | 0.95/0.60/0.20/0.20 | a h = 2.8658(1) | XRD |
| c h = 14.229(1) | |||||||
| 3 | N_0.5 | w/o | 0.5 | 93 | 0.93/0.60/0.20/0.20 | a h = 2.8646(1) | XRD |
| c h = 14.229(1) | |||||||
| 4 | N_0.75 | w/o | 0.75 | 92 | 0.92/0.60/0.20/0.20 | a h = 2.8639(1) | XRD |
| c h = 14.236(1) | |||||||
| 5 | N_1 | w/o | 1 | 89 | 0.81/0.60/0.19/0.20 | a h = 2.8629(1) | XRD, SEM |
| 2.15/0.60/0.20/0.19(l) | c h = 14.249(1) | ||||||
| 6 | N_1.5 | w/o | 1.5 | 86 | 0.85/0.60/0.20/0.20 | a h = 2.8582(1) | XRD |
| c h = 14.269(1) | |||||||
| 7 | N_2 | w/o | 2 | 86 | 0.85/0.60/0.20/0.20 | a h = 2.8571(1) | XRD |
| c h = 14.270(1) | |||||||
| 8 | N_3 | w/o | 3 | 79 | 0.77/0.60/0.20/0.20 | a h = 2.8499(1) | XRD |
| c h = 14.287(1) | |||||||
| 9 | N_4 | w/o | 4 | 79 | 0.48/0.60/0.19/0.20 | a h = 2.8495(1) | XRD |
| 2.07/0.60/0.20/0.19(l) | c h = 14.290(1) | ||||||
| 10 | N_8 | w/o | 8 | 61 | 0.46/0.60/0.20/0.20 | a h = 2.8213(1) | XRD, SEM |
| c h = 14.482(1) | |||||||
| 11 | N_24 | w/o | 24 | 57 | 0.26/0.60/0.19/0.20 | a h = 2.8180(1) | XRD, SEM, TEM |
| 2.14/0.60/0.20/0.19(l) | c h = 14.453(1) | XAS, XRS | |||||
| 12 | N + H_0.25 | w/ | 0.25 | 74 | a h = 2.8678(1) | XRD | |
| c h = 14.219(1) | |||||||
| 13 | N + H_0.5 | w/ | 0.5 | 61 | a h = 2.8678(1) | XRD, SEM | |
| c h = 14.219(1) | |||||||
| 14 | N + H_0.63 | w/ | 0.63 | 48 | a h = 2.8676(1) | XRD | |
| c h = 14.219(1) | |||||||
| 15 | N + H_0.75 | w/ | 0.75 | 30 | a h = 2.8676(1) | XRD | |
| c h = 14.219(1) | |||||||
| 16 | N + H_1 | w/ | 1 | 21 | 0.97/0.60/0.20/0.20 | a h = 2.8679(1) | XRD, SEM, TEM |
| 1.04/0.60/0.20/0.20(l) | c h = 14.219(1) | XAS, XRS | |||||
| 17 | N + H_1.5 | w/ | 1.5 | 2 | |||
| 18 | N + H_1.75 | w/ | 1.75 | 1 | |||
| 19 | N + H_2 | w/ | 2 | 2 | a h = 2.8679(1) | XRD, SEM | |
| c h = 14.219(1) | |||||||
| 20 | N + H_3 | w/ | 3 | 0 | |||
| 21 | N + H_4 | w/ | 4 | 0 | |||
| 22 | N + H_8 | w/ | 8 | 0 | |||
| 23 | N + H_24 | w/ | 24 | 0 | |||
After the treatment, each sample was filtered and dried at 40 °C for 24 h, except for the completely dissolved samples. For the residual powders, the Li/Ni/Co/Mn ratios were determined by ICP-AES analyses, and their crystal structure was examined by synchrotron XRD measurements at the BL5S2 beamline at Aichi SR. The experimental procedure for the XRD measurements was the same as that for the pristine NCM622 sample. Only for N_1, N_4, N_24, and N + H_1 samples, the Li/Ni/Co/Mn ratios in the liquid phase were determined by ICP-AES. TEM analyses were conducted on the N_24 and N + H_1 samples.
For comparison with NCM622, 1 g each of NCA, LCO, NiO, Co3O4, and MnO2 powders were separately immersed in 50 ml of a 1 M HNO3 solution at RT for 24 h with or without H2O2. Moreover, 1 g each of NCM622, NCA, or LCO was separately immersed in 50 ml of 1 M citric acid (C6H8O7, FUJIFILM Wako Pure Chemical) with H2O2 for 24 h at RT.
2.4 Soft XAS
Soft XAS was performed on pristine NCM622, N_24, N + H_1, and electrochemically delithiated NCM622 at the BL1N2 beamline at Aichi SR. This beamline covers K-edge measurements from B to Si, L-edge measurements for 3d transition metals, and M-edge measurements for lanthanoids.24 For the pristine NCM622, N_24, and N + H_1 samples, a composite sheet (3 mm × 3 mm) consisting of 95 wt% of each sample and 5 wt% PVdF was attached onto an XAS sample holder using carbon tape. The electrochemically delithiated NCM622 samples were prepared by charging at a current of 0.3 mA. The Li composition in NCM622, namely x in LixNi0.6Co0.2Mn0.2O2, was 0.92, 0.82, or 0.72. X-Ray absorption near-edge structure (XANES) spectra for the Ni L-edge, Co L-edge, Mn L-edge, and O K-edge were recorded in total-electron-yield mode and were normalized using the Au 4f spectrum.2.5 XRS
To characterize the pristine NCM622, N_24, and N + H_1 samples, XRS was conducted at the Toyota beamline (BL33XU) at SPring-8. Approximately 0.1 g of each sample was pressed into a pellet with a diameter of 10 mm and a thickness of ∼0.5 mm, which was then placed on Kapton tape (thickness = 25 μm, Dupont). Each sample was exposed to hard X-rays for at least for 14 h by tilting the sample to the incident X-rays (angle = 5°). Fig. S1 (ESI†) shows photographs of the experimental setup at the beamline. The experimental setup and procedures for XRS measurements have been described elsewhere.14,153 Results and discussion
3.1 Characterization of pristine NCM622
Before moving on to the results of HNO3 leaching, we briefly describe the characteristics of the present NCM622. As shown in Fig. 1a, the XRD pattern of pristine NCM622 can be assigned to a regular layered structure with the R![[3 with combining macron]](https://www.rsc.org/images/entities/char_0033_0304.gif) m space group, in which Li+ ions occupy the octahedral 3b site and Ni/Co/Mn ions occupy the octahedral 3a site in a cubic close-packed O2− array. Table 2 summarizes the structural parameters, such as the atomic positions and lattice parameters of the ah- and ch-axes. Fig. 1b shows the charge and discharge curves of the NCM622/Li cell operated at a current of 0.3 mA. The rechargeable capacity (Qrecha) of ∼190 mA h g−1 is obtained in the range of 3.0–4.4 V, where the theoretical capacity is calculated to be 276.5 mA h g−1 by assuming a one-electron transfer. The structural and electrochemical properties of pristine NCM622 are similar to those previously reported for NCM622.17,18
m space group, in which Li+ ions occupy the octahedral 3b site and Ni/Co/Mn ions occupy the octahedral 3a site in a cubic close-packed O2− array. Table 2 summarizes the structural parameters, such as the atomic positions and lattice parameters of the ah- and ch-axes. Fig. 1b shows the charge and discharge curves of the NCM622/Li cell operated at a current of 0.3 mA. The rechargeable capacity (Qrecha) of ∼190 mA h g−1 is obtained in the range of 3.0–4.4 V, where the theoretical capacity is calculated to be 276.5 mA h g−1 by assuming a one-electron transfer. The structural and electrochemical properties of pristine NCM622 are similar to those previously reported for NCM622.17,18
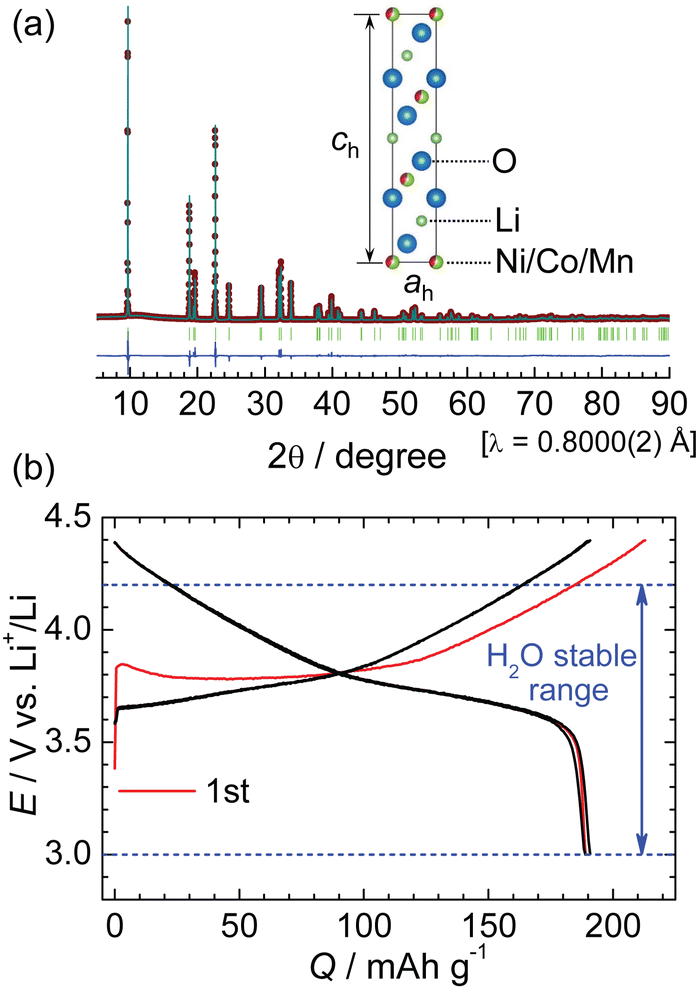 | ||
| Fig. 1 (a) Rietveld analysis of the XRD pattern for the pristine NCM622 sample and (b) charge and discharge curves of the NCM622/Li cell operated at a current of 0.3 mA (≃ 0.15 mA cm−2) in the range of 3.0–4.4 V. The layered structure of NCM622 is shown schematically in the inset of (a). Red lines in (b) indicate the charge and discharge curves for the first cycle, and blue dashed lines indicate the stable voltage range for the aqueous solution vs. Li+/Li electrode, i.e., 3.0–4.2 V. | ||
| Sample | Phase | Atom | Wyckoff position | g | x | y | z | B iso (Å2) |
|---|---|---|---|---|---|---|---|---|
| Pristine | NCM622 | Li | 3b | 1.0 | 0 | 0 | 0.5 | 1.0 |
| Ni | 3a | 0.6 | 0 | 0 | 0 | 0.2(1) | ||
| Co | 3a | 0.2 | 0 | 0 | 0 | 0.2(1) | ||
| Mn | 3a | 0.2 | 0 | 0 | 0 | 0.2(1) | ||
| O | 6c | 1.0 | 0 | 0 | 0.258(1) | 0.5(1) | ||
| Space group: Rm, ah = 2.8677(1) Å, and ch = 14.219(1) Å |
||||||||
| R wp = 5.44% and S = 1.18. | ||||||||
| N_24 | NCM622 | Li | 3b | 0.26 | 0 | 0 | 0.5 | 1.0 |
| (96.8 wt%) | Ni | 3a | 0.6 | 0 | 0 | 0 | 0.4(1) | |
| Co | 3a | 0.19 | 0 | 0 | 0 | 0.4(1) | ||
| Mn | 3a | 0.2 | 0 | 0 | 0 | 0.4(1) | ||
| O | 6c | 1.0 | 0 | 0 | 0.258(1) | 0.2(1) | ||
| γ-NiOOH | Ni | 3a | 1 | 0 | 0 | 0 | 0.4(1) | |
| (3.2 wt%) | O | 6c | 1 | 0 | 0 | 0.393(4) | 0.2(1) | |
| Space group: Rm, ah = 2.8180(1) Å, and ch = 14.453(1) Å for NCM622 |
||||||||
| Space group: Rm, ah = 2.8211(4) Å, and ch = 20.873(4) Å for γ-NiOOH |
||||||||
| R wp = 3.68% and S = 0.52. | ||||||||
| N + H_1 | NCM622 | Li | 3b | 0.97 | 0 | 0 | 0.5 | 1.0 |
| Ni | 3a | 0.6 | 0 | 0 | 0 | 0.3(1) | ||
| Co | 3a | 0.2 | 0 | 0 | 0 | 0.3(1) | ||
| Mn | 3a | 0.2 | 0 | 0 | 0 | 0.3(1) | ||
| O | 6c | 1.0 | 0 | 0 | 0.259(1) | 0.5(1) | ||
| Space group: Rm, ah = 2.8679(1) Å, and ch = 14.219(1) Å |
||||||||
| R wp = 8.15% and S = 1.23. | ||||||||
3.2 w and particle morphology
Fig. 2a and b show the weight fraction (w) after HNO3 leaching without and with H2O2, respectively. Without H2O2, w decreases almost linearly from 100% at 0 h to 61% at 8 h and then levels off at ∼60% for the rest of the 24 h experiment. The blue line in Fig. 2a represents the theoretical w (= 47%) based on the disproportionation reaction for NCM622:5–8| 2LiMO2 + 4H+ → 2Li+(l) + MO2(s) + M2+(l) + 2H2O, | (6) |
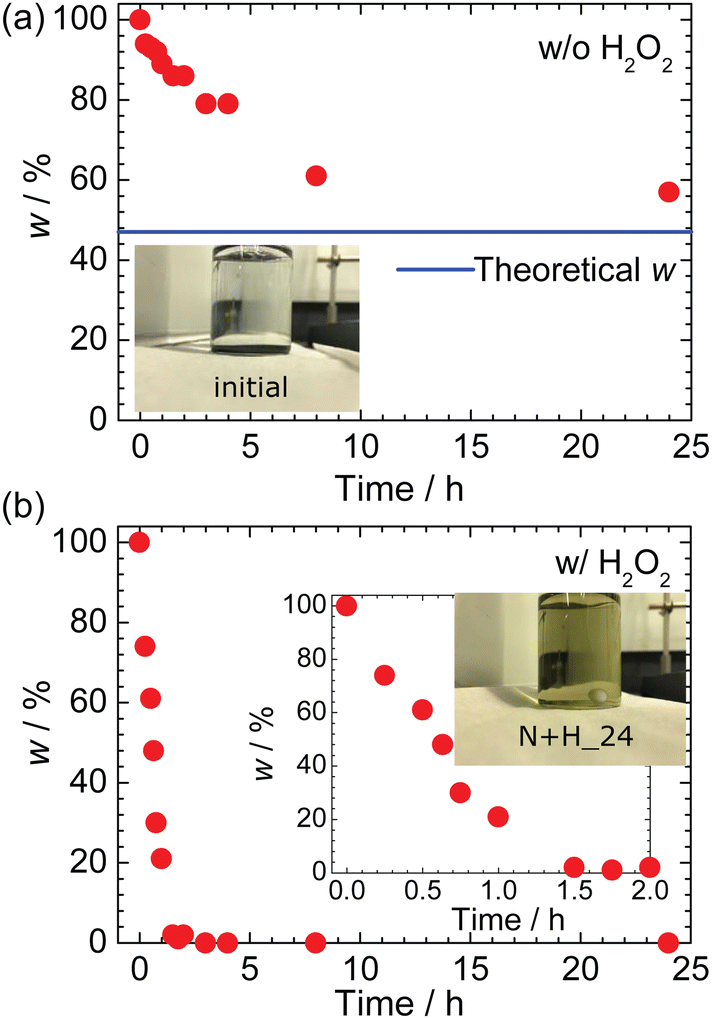 | ||
| Fig. 2 Weight fraction w as a function of the HNO3 leaching time (a) without H2O2 and (b) with H2O2. Under both conditions, the solutions are initially colorless and transparent [inset of (a)]. The blue line in (a) represents the theoretical w (= 47%) based on eqn (6). The insets in (b) show an enlargement of the time dependence of w and a photograph of N + H_24. | ||
As shown in Fig. 2b, the w value with H2O2 rapidly decreases to ∼0% within 1.5 h, implying that the NCM622 powder completely dissolved into the aqueous solution, as evidenced by the yellow appearance of N + H_24 in the inset. Thus, the presence of H2O2 in the acid solution drastically changes the leaching process for NCM622. In addition, the Li/Ni/Co/Mn ratio of the liquid (l) phase differs between the two processes; namely, as listed in Table 1, twice as much Li was leached without H2O2.
We next investigated the particle morphology and size for the residual NCM622 powders after HNO3 leaching with or without H2O2. Fig. 3a–d show SEM images of the pristine NCM622, N_1, N_8, and N_24 samples leached without H2O2, and Fig. 3e–h show the corresponding enlarged SEM images. The pristine NCM622 powders form spherical secondary particles (diameter = 10–30 μm) consisting of non-uniform primary particles with sizes of 1–3 μm. The spherical secondary particles seem to be increasingly broken as the leaching proceeded, whereas the primary particles seem to have maintained their original particle morphology and size.
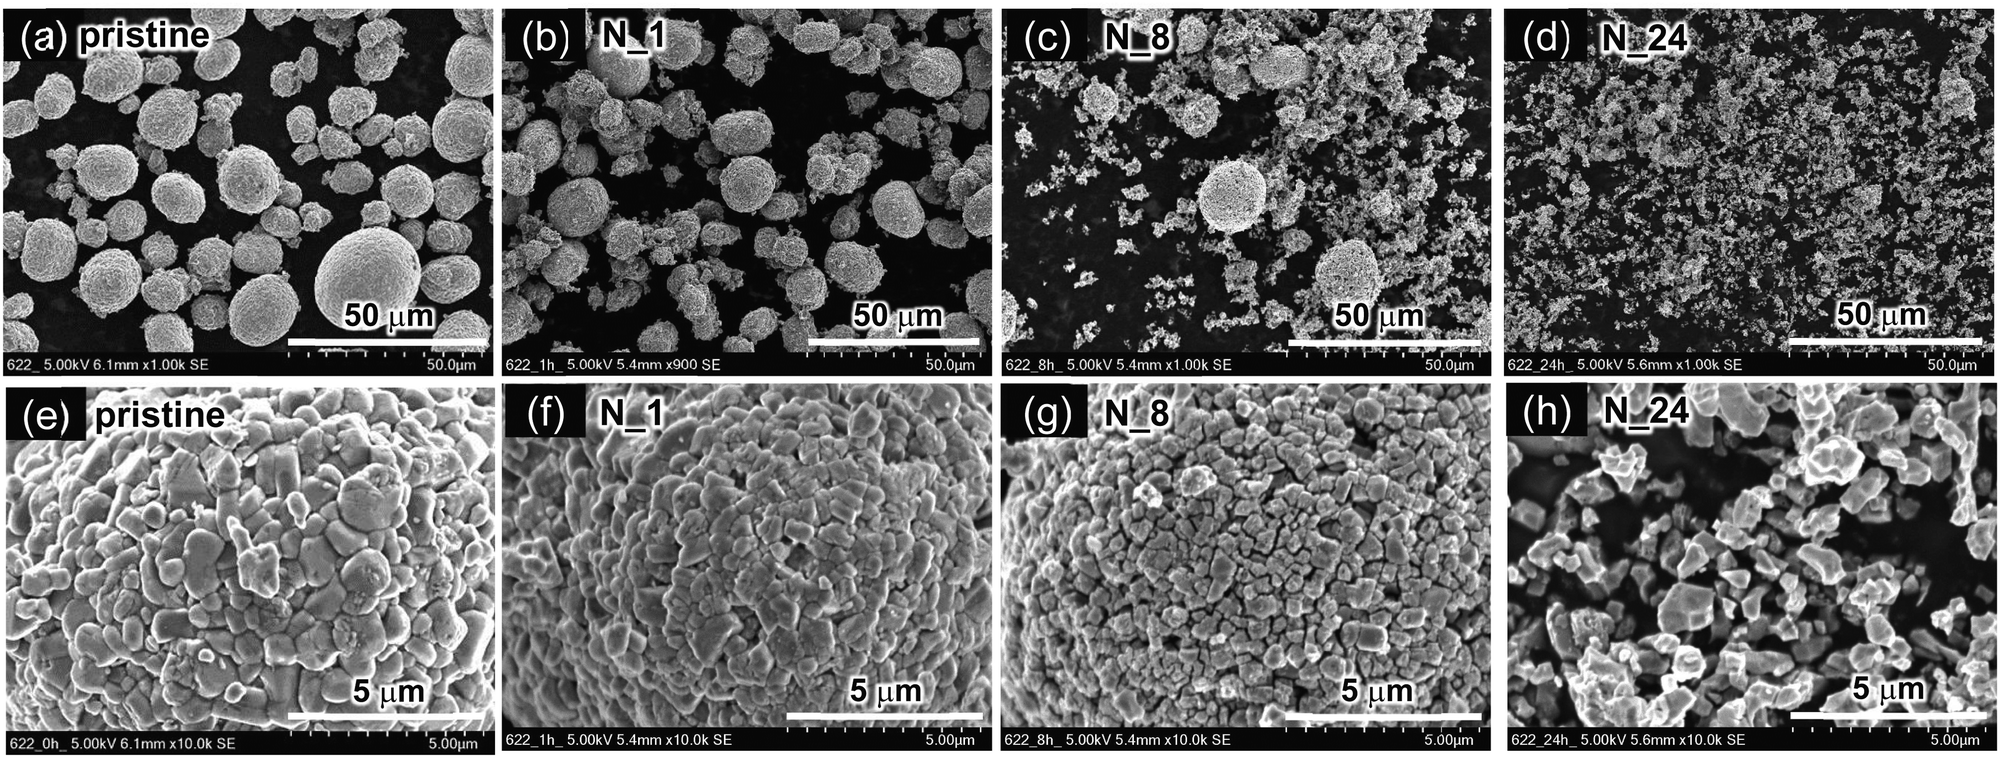 | ||
| Fig. 3 SEM images of residual NCM622 powders after HNO3 leaching without H2O2: (a) pristine NCM622, (b) N_1, (c) N_8, and (d) N_24. (e)–(h) Corresponding enlarged SEM images of (a)–(d). | ||
Fig. 4a–d show SEM images of the pristine NCM622, N + H_0.5, N + H_1, and N + H_24 samples (with H2O2), with corresponding enlargements in Fig. 4e–h. Note that the SEM images in Fig. 4a and e are identical to those of Fig. 3a and e. As in the case without H2O2, the spherical secondary particles broke as leaching proceeded, but they did so much more rapidly than those leached without H2O2. Furthermore, some primary particles exhibit a flake-like morphology and a smaller particle size (∼1 μm).
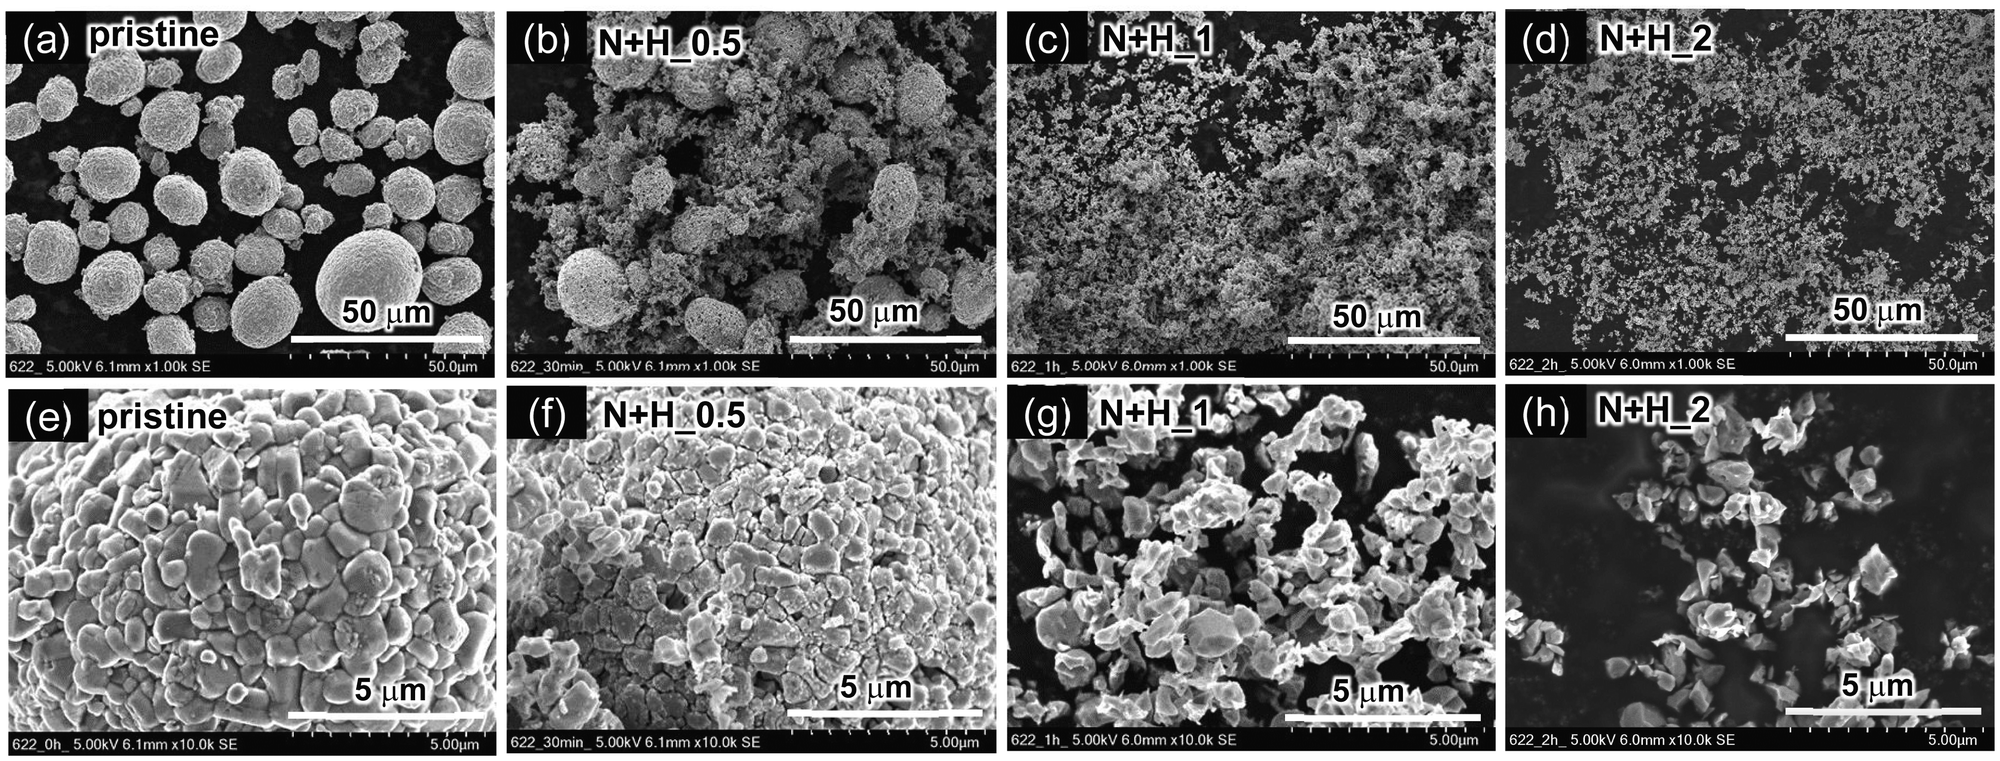 | ||
| Fig. 4 SEM images of residual NCM622 powders after HNO3 leaching with H2O2: (a) pristine NCM622, (b) N + H_0.5, (c) N + H_1, and (d) N + H_2. (e)–(h) Corresponding enlarged SEM images of (a)–(d). Note that (a) and (e) are identical to Fig. 3a and e. | ||
3.3 Crystal structure for residual powders
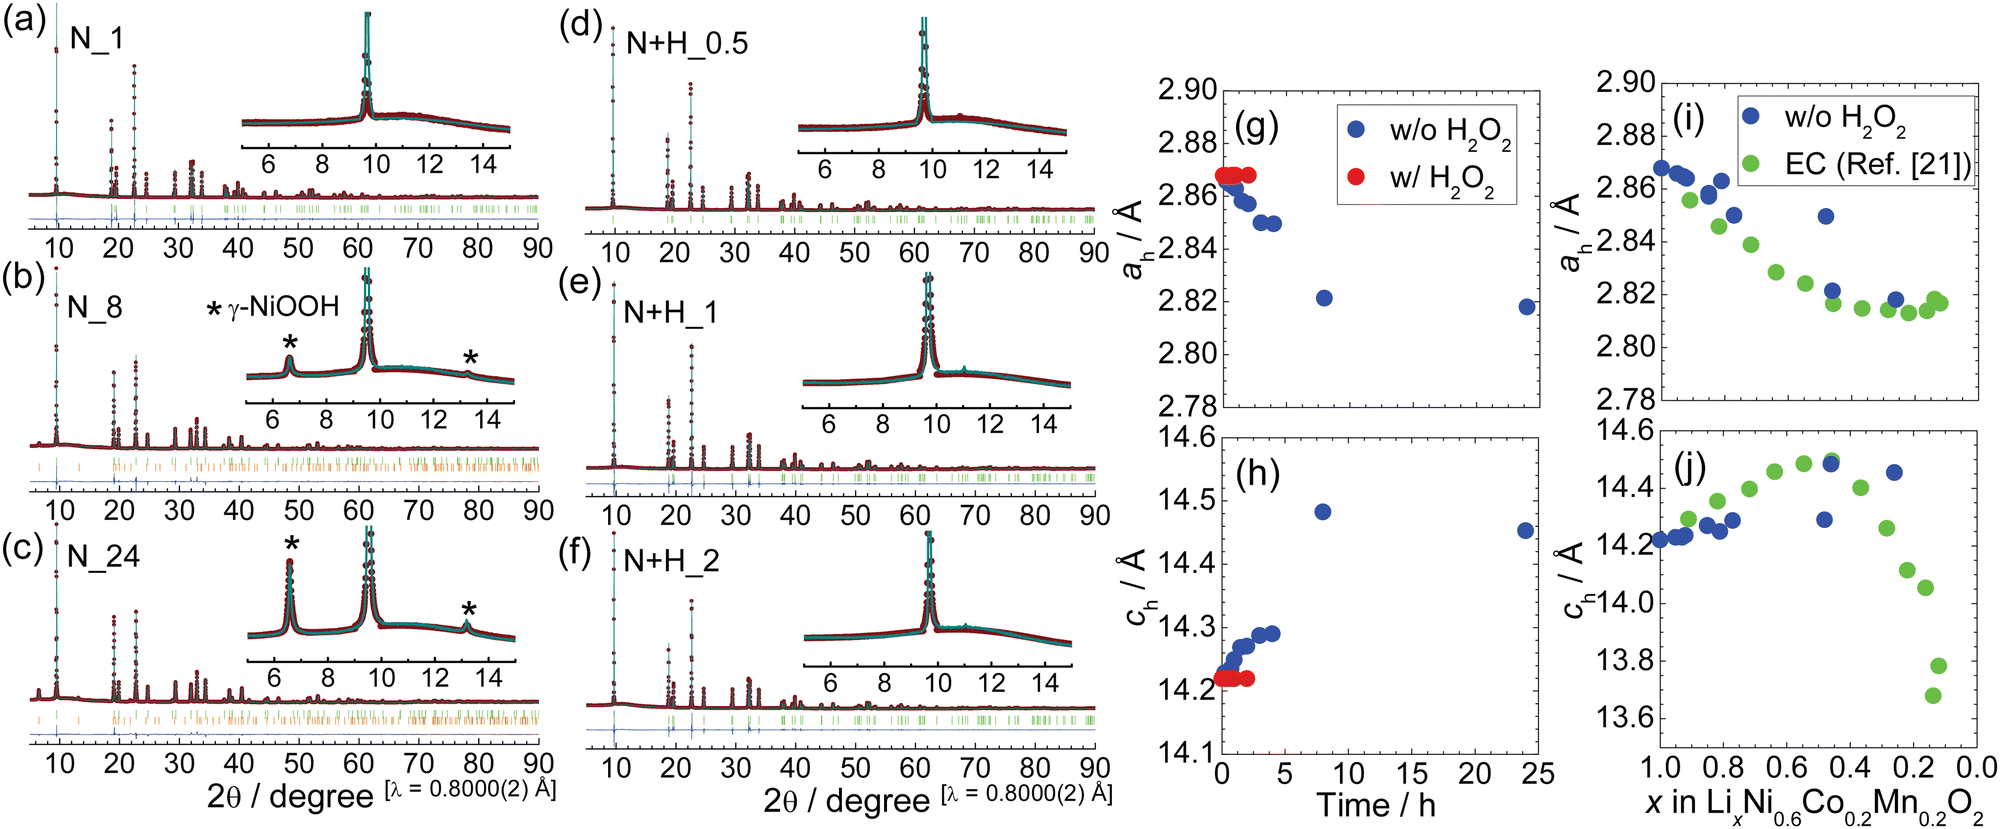 | ||
| Fig. 5 Rietveld analysis results after HNO3 leaching with or without H2O2: (a) N_1, (b) N_8, (c) N_24, (d) N + H_0.5, (e) N + H_1, and (f) N + H_2. The diffraction peaks indicated by * can be assigned to γ-NiOOH. (g) ah and (h) ch as a function of leaching time. Comparison between (i) ah and (j) ch values after HNO3 leaching without H2O2 and those after electrochemical (EC) delithiation taken from our previous report.18 | ||
The XRD pattern of N_1 can be indexed as a single phase of the layered structure with the Rm space group, as for pristine NCM622. Their lattice parameters were calculated to be ah = 2.8629(1) Å and ch = 14.249(1) Å, which differ slightly from the initial values (Table 1). The single-phase layered structure with Rm was maintained for the first 4 h of leaching (Fig. S2 and S3, ESI†), although the ah and ch values varied with the leaching time (Table 1). However, the XRD patterns of N_8 and N_24 can be assigned to a mixture of the aforementioned layered structure and γ-NiOOH with the Rm space group; the γ-NiOOH phase has been reported in Ni–MH batteries25 and electrocatalysts for the oxygen evolution reaction.26 The ch value of γ-NiOOH is more than 20 Å, indicating that it can accommodate H3O+ and/or water molecules between the MO2 layers. The weight fractions of γ-NiOOH in N_8 and N_24 were determined to be 1.3 and 3.2%, respectively (Table 2 and Table S2, ESI†).
Fig. 5d–f shows selected Rietveld analysis results after leaching with H2O2, i.e., N + H_0.5, N + H_1, and N + H_2, and Fig. S4 (ESI†) shows those of N + H_0.25, N + H_0.63, and N + H_0.75. The XRD patterns of all the samples are similar to those of pristine NCM622. For instance, the XRD pattern of N + H_1 is assigned to a single-phase layered structure with the Rm space group and ah = 2.8679(1) Å and ch = 14.219(1) Å (Table 2). Table S3 (ESI†) lists the structural parameters of the other samples.
To clarify the differences in ah and ch with and without H2O2, their leaching time dependences are illustrated in Fig. 5g and h. The ah value without H2O2 decreased from 2.8677(1) Å at 0 h to ∼2.82 Å at 8 h, while the ch value increased from 14.219(1) Å to ∼14.5 Å at the same time points. The decrease (increase) in ah (ch) resembles the change in ah (ch) upon the charge reaction.18 As listed in Table 1, the ICP-AES analysis confirmed that the Li composition decreased as leaching proceeded. By contrast, the ah and ch values with H2O2 were almost constant, regardless of the leaching time, suggesting that Li+ ions are not effectively extracted from the NCM622 lattice. Indeed, the Li composition of N + H_1 was found to be 0.97 according to ICP-AES (Table 1).
Fig. 5(i) and (j) compare the ah and ch values as a function of x in LixNi0.6Co0.2Mn0.2O2 between the chemical (without H2O2) and electrochemical oxidation18 reactions. The two trends are similar, but the ah and ch values without H2O2 are more scattered, particularly at x ≤ 0.5, meaning an inhomogeneous Li composition in the particles. The origin of these differences is the dissolution reaction in the chemical oxidation process, as understood by eqn (6). The crystal structure also differs between chemically and electrochemically reacted samples of LiNiO2.6,7
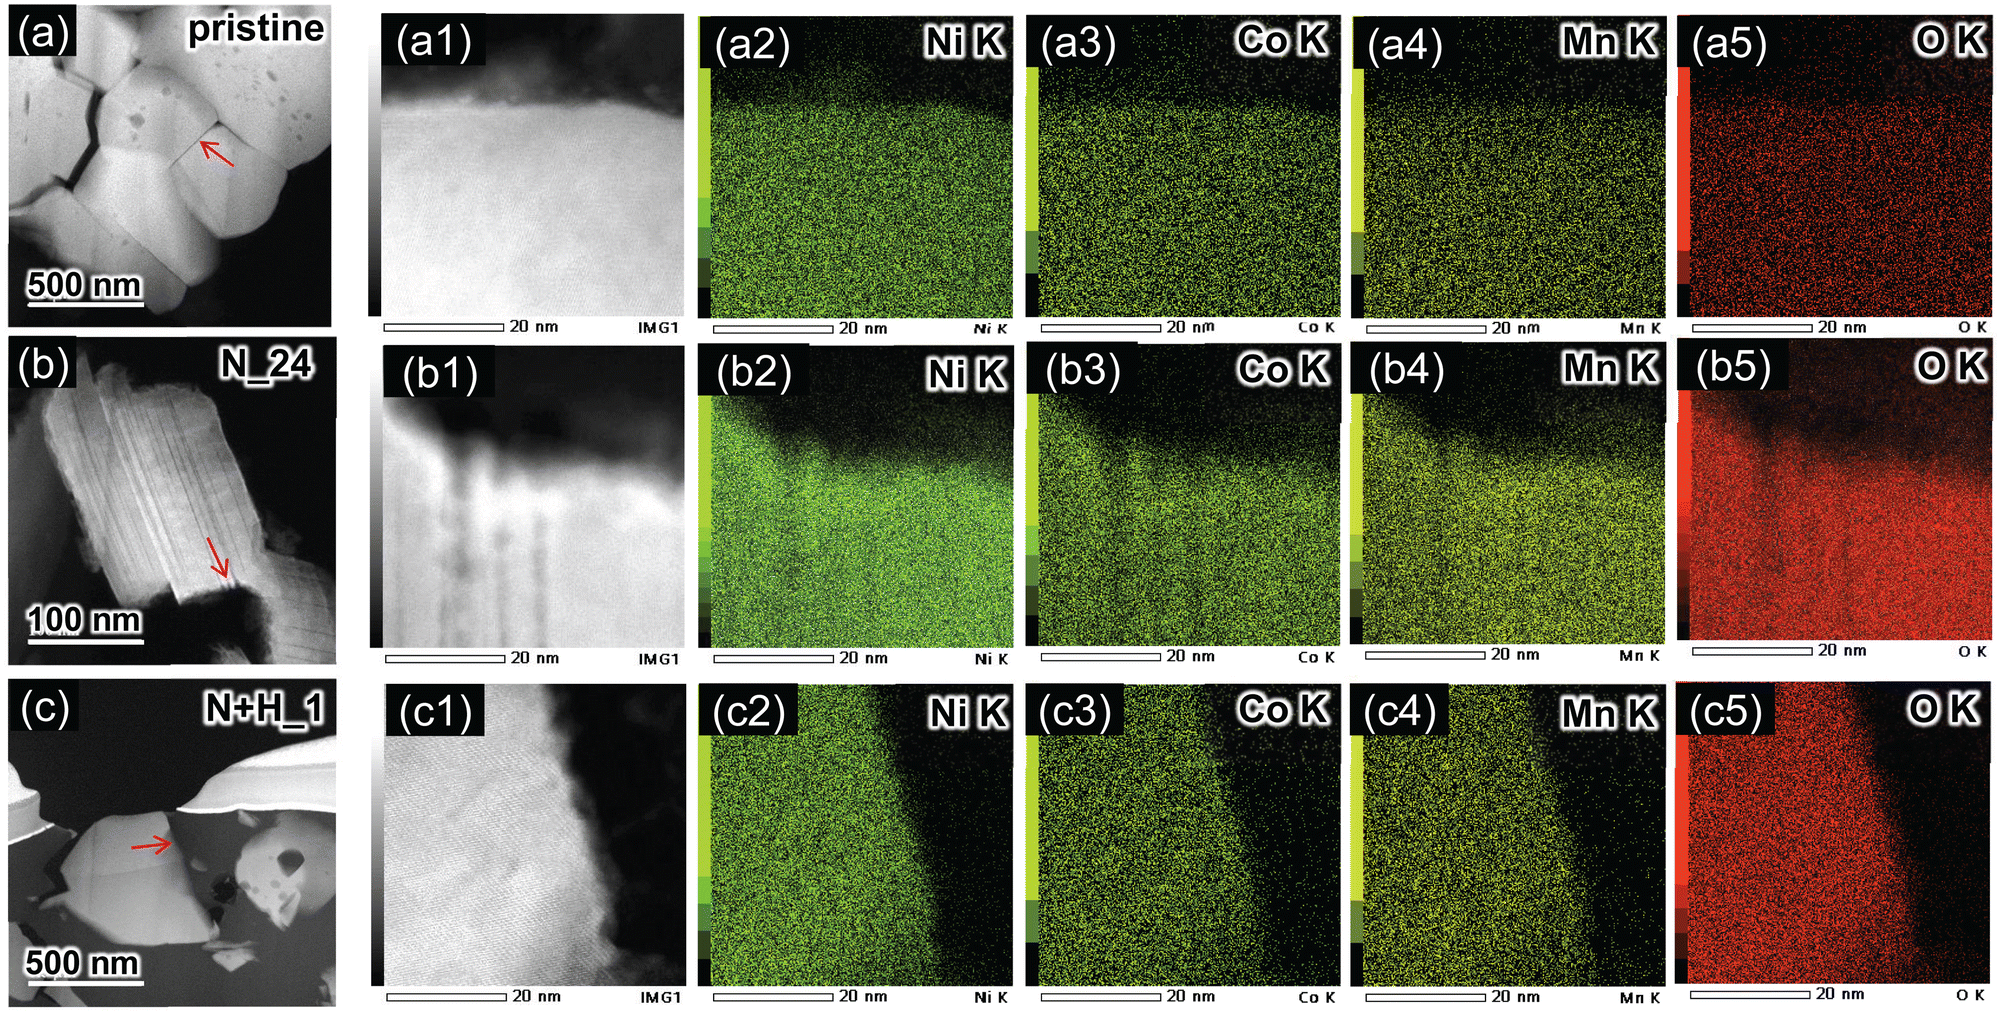 | ||
| Fig. 6 HAADF-STEM images and EDS mappings of (a) pristine NCM622, (b) N_24, and (c) N + H_1. (a1)–(c1) Enlarged HAADF-STEM images and (a2)–(c5) EDS mappings of Ni, Co, Mn, and O corresponding to (a)–(c). | ||
To elucidate the microstructure of N_24, two-dimensional fast Fourier transform (FFT) patterns were examined in various regions. Fig. 7a and b show the TEM and corresponding HAADF-STEM images of N_24 to illustrate the striped layers. As shown in Fig. 7c, the enlarged FFT pattern obtained from the total (T) region of Fig. 7a consists of diffraction spots indicated by blue and green circles and streaks along the [001] direction. This FFT pattern is viewed from the [100] or [110] direction. The diffraction spots indicated by blue and green circles come from regions R1 and R3 in Fig. 7a, respectively (Fig. 7d and f). Surprisingly, the diffraction patterns from R1 and R3 are rotated by 60° with respect to each other, according to the assignments of blue and green diffraction spots. For instance, the two blue circles in R1 are assigned to 012 and 01![[1 with combining macron]](https://www.rsc.org/images/entities/char_0031_0304.gif) . As shown in Fig. 7e, streaks rather than distinct spots are observed from R3, suggesting a low-crystallinity in this region. The original FFT patterns for T, R1, R2, and R3 are shown in Fig. S5a–d (ESI†). Based on the TEM analyses, N_24 is composed of several phases, although the XRD analysis indicated a single phase with a layered structure (except for γ-NiOOH).
. As shown in Fig. 7e, streaks rather than distinct spots are observed from R3, suggesting a low-crystallinity in this region. The original FFT patterns for T, R1, R2, and R3 are shown in Fig. S5a–d (ESI†). Based on the TEM analyses, N_24 is composed of several phases, although the XRD analysis indicated a single phase with a layered structure (except for γ-NiOOH).
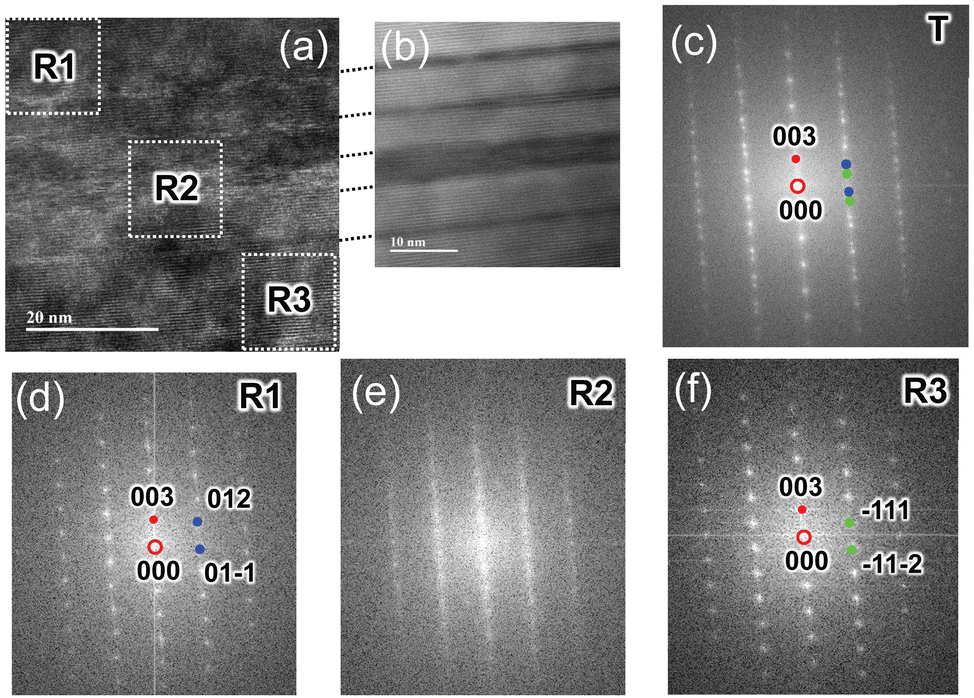 | ||
| Fig. 7 (a) TEM and (b) corresponding enlarged HAADF-STEM images of N_24. Enlarged FFT patterns obtained in the [100] or [110] direction from (c) the total area in (a) and from the regions in (a) labeled (d) R1, (e) R2, and (f) R3. | ||
3.4 Electronic structure for residual powders
Fig. 8a–d show the XANES spectra of pristine NCM622, N_24, and N + H_1 for the O K-edge, Ni L-edge, Co L-edge, and Mn L-edge, and Fig. S6a–d (ESI†) shows the corresponding enlarged XANES spectra. The O K-edge spectrum of pristine NCM622 indicates at least four peaks at 529.7, 533.8, 539.1, and 541.9 eV. The first two are regarded as a pre-edge of the O K-edge spectrum, which has been understood as hybridization between the 3d orbital of a transition metal and the O 2p orbital.27–29 The latter two peaks are attributed to hybridization between 4s and p orbitals of a transition metal and the O 2p orbital.27–29 Meanwhile, in the O K-edge XANES spectrum of N_24, the pre-edge peak at ∼530 eV is enlarged, while the pre-edge peak at ∼534 eV has disappeared or appears rounded and has shifted to a lower photon energy. Moreover, the peak at ∼540 eV is weakened in this spectrum. However, the O K-edge XANES spectrum of N + H_1 seems to have features of both pristine NCM622 and N_24 in terms of the enlarged pre-edge peak at ∼530 eV and the weakened peak at ∼540 eV. This indicates that the surface of N + H_1 is partially delithiated, although XRD measurements showed that its ah and ch values were very similar to those of pristine NCM622. Nonetheless, the XANES spectra for the Ni L-edge, Co L-edge, and Mn L-edge also support this conclusion (Fig. 8b–d). For instance, the Ni L-edge XANES spectra show four peaks at ∼852.3, 854.4, 869.3, and 870.6 eV, two of which are shifted to higher photon energies for N_24 and N + H_1. Additionally, as shown in Fig. S6c (ESI†), the peak at ∼780 eV in the Co L-edge XANES spectrum shifts to higher photon energies in the order of N_24 and N + H_1, suggesting higher oxidation states than those of the initial pristine NCM622 material. Note that the L-edge XANES peaks for Ni, Co, and Mn more directly reflect electronic structures near the Fermi level than their corresponding K-edge XANES peaks.30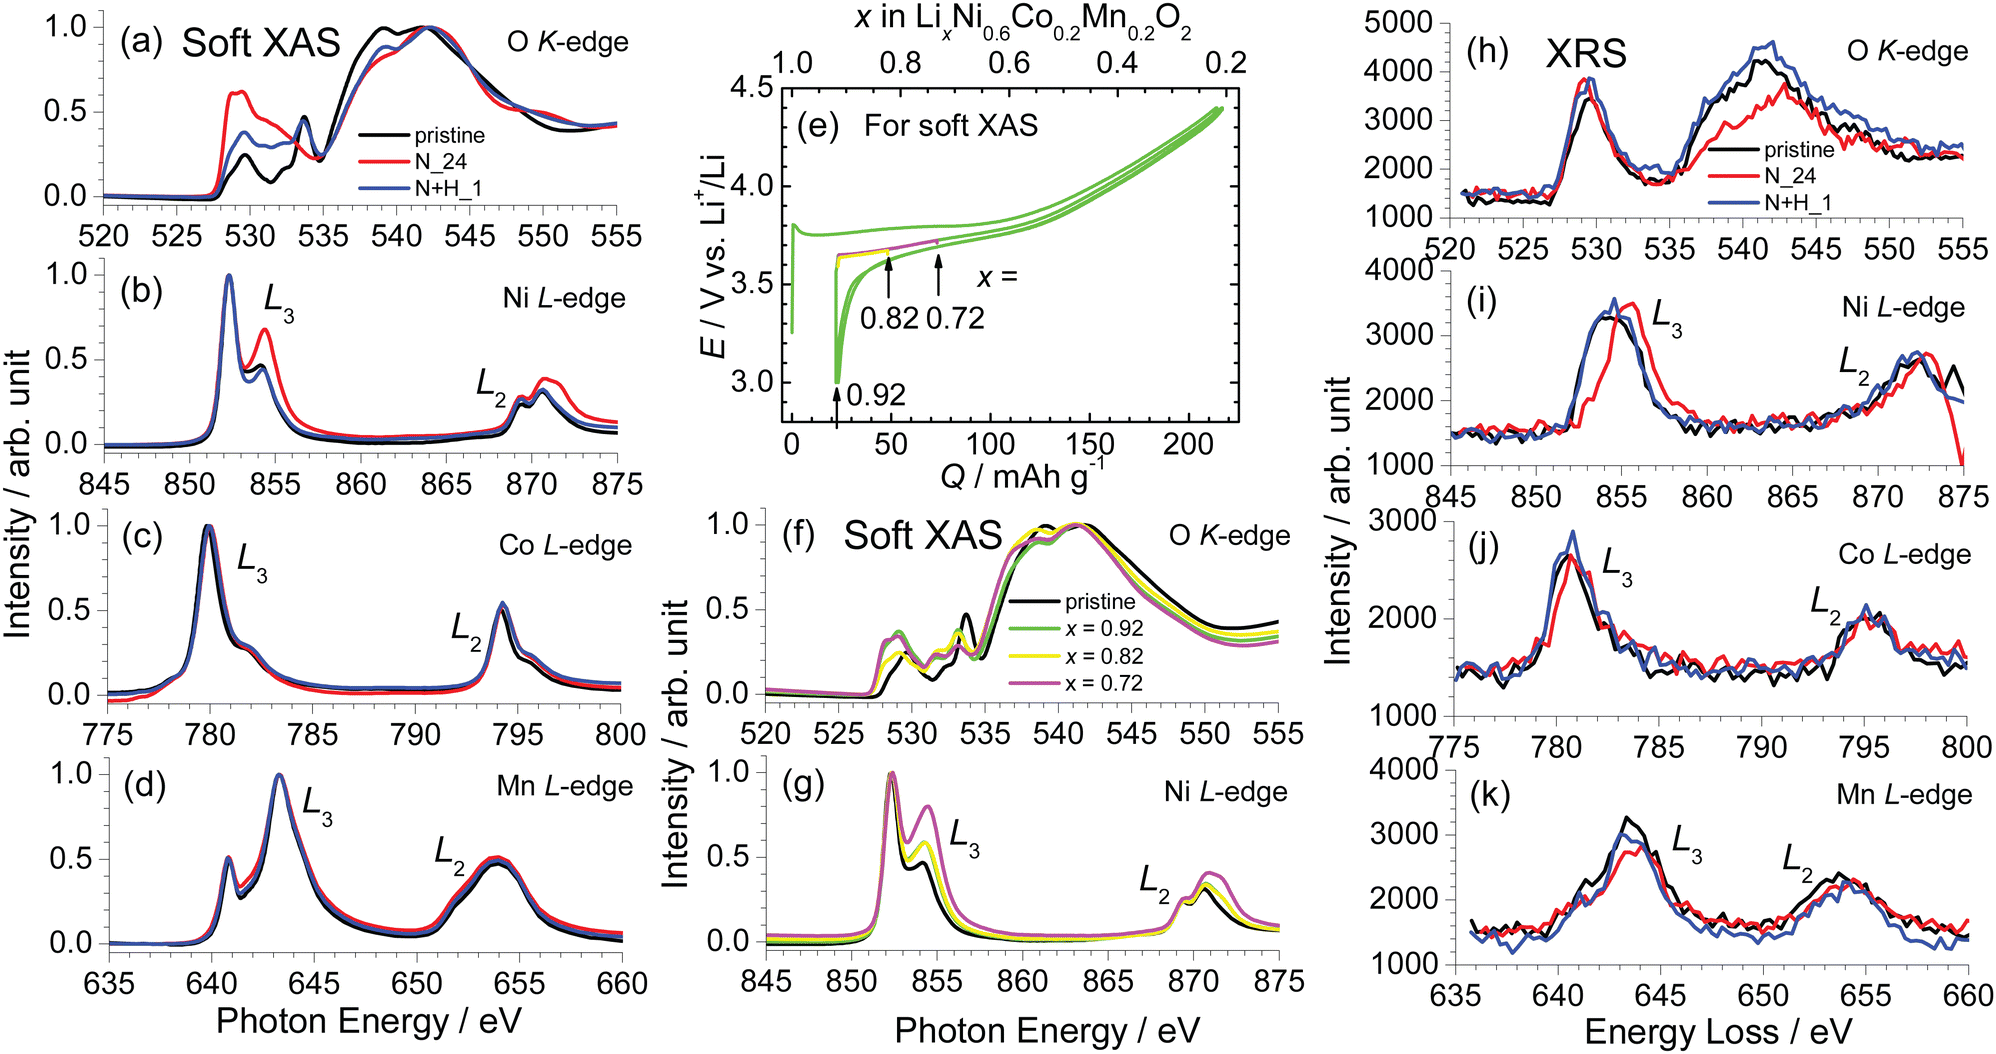 | ||
| Fig. 8 XANES spectra of pristine NCM622, N_24, and N + H_1: (a) O K-edge, (b) Ni L-edge, (c) Co L-edge, and (d) Mn L-edge. (e) Charge and discharge curves of the NCM622/Li cells for preparing electrochemically delithiated NCM622 samples for soft XAS. The x value in LixNi0.6Co0.2Mn0.2O2 was calculated to be 0.92, 0.82, or 0.72 by assuming 100% Coulombic efficiency. XANES spectra of the electrochemically delithiated NCM622 samples with x = 0.92, 0.82, and 0.72: (f) O K-edge and (g) Ni L-edge. XRS results for pristine NCM622, N_24, and N + H_1: (h) O K-edge, (i) Ni L-edge, (j) Co L-edge, and (k) Mn L-edge. | ||
Soft XAS was also performed on electrochemically delithiated NCM622 samples. Fig. 8e shows the charge and discharge curves of three independent NCM622/Li cells, confirming homogeneous and reproducible electrochemical reactions. The x values in LixNi0.6Co0.2Mn0.2O2 were calculated to be 0.92, 0.82, and 0.72 by assuming 100% Coulombic efficiency. Fig. 8f and g show the O K-edge and Ni L-edge XANES spectra of the x = 0.92, 0.82, and 0.72 samples. However, the O K-edge XANES spectra of the electrochemically delithiated samples diverging from those of N_24 and N + H_1, indicating that electrochemical delithiation essentially differs from chemical delithiation. However, the shift to higher photon energies in the Ni L-edge XANES spectra is similar to the results of chemical delithiation, supporting the existence of a small amount of delithiated phase on the surface of N + H_1.
In contrast to soft XAS, XRS is related to the electronic structures of the bulk (i.e., the whole sample). Fig. 8h–k shows the XRS results corresponding to O K-edge, Ni L-edge, Co L-edge, and Mn L-edge XANES spectra, respectively, for pristine NCM622, N_24, and N + H_1. The spectrum of pristine NCM622 exhibits two peaks at ∼530 and 541 eV, but the latter peak is weakened and shifted to ∼542.5 eV for N_24. The shifts to higher energy losses also occur in the peaks at ∼844, 780.5, and 643 eV, indicating higher oxidation states in N_24. In the case of N + H_1, the results of XRS resemble those of pristine NCM622, suggesting that N + H_1 maintains its initial oxidation state, i.e., the initial Li composition in the bulk. The soft XAS and XRS results of the L-edge of Ni, Co, and Mn atoms have never been compared for any NCM materials, although comparison between soft XAS and XRS was performed for LixMn2O4 with x ≤ 1.31
3.5 Electrochemical properties of residual powders
To further clarify the surface and bulk states of N_24 and N + H_1, their electrochemical properties were evaluated using dry-processed electrodes, which we employed to avoid any undesired changes during mixing with the conventional PVdF + NMP solution and drying at a high temperature (120 °C). Recently, this dry process using PTFE has received considerable attention as a new way to prepare electrodes because it decreases CO2 emissions.32Fig. 9a–d shows the charge and discharge curves of the Li cells with pristine NCM622, N_24, N + H_0.5, and N + H_1 operated at a current of 0.1 mA at 25 °C. The pristine NCM622 indicates a steady Qrecha of ∼190 mA h g−1 in the range of 3.0–4.4 V, which is consistent with the results of a Li cell with the PVdF binder (Fig. 1b). N_24 is delithiated from the initial state, as evidenced by the open-circuit voltage before the cycling test (= 3.992 V) and charge capacity (Qcha) at the first cycle. The Qcha and discharge capacity decreases with each cycle, forming a plateau at ∼3.5 V during the discharge reaction. This electrochemical reactivity suggests that the bulk structure of N_24 is quite different from that of the electrochemically delithiated NCM622 sample. Meanwhile, the electrochemical properties of N + H_0.5 and N + H_1 are similar to that of pristine NCM622, except for the large voltage increase to ∼4.0 V during the initial charge reaction and slightly lower Qrecha. The large voltage increase is related to the decomposition of the electrolyte originating from H2O molecules on the surface of N + H_0.5 or N + H_1. The Qrecha values of N + H_0.5 and N + H_1 are ∼180 and 170 mA h g−1, respectively. These results imply that the surface states of N + H_0.5 and N + H_1 differ from that of pristine NCM622 (Fig. 10). | ||
| Fig. 9 Charge and discharge curves of the Li cells with (a) pristine NCM622, (b) N_24, (c) N + H_0.5, and (d) N + H_1 operated at a current of 0.1 mA at 25 °C. All the electrodes were prepared by the dry process. Red lines indicate the charge and discharge curves for the first cycle. | ||
 | ||
| Fig. 10 Schematics of the reaction mechanisms during the HNO3 leaching process (a) without H2O2 and (b) with H2O2. For both processes, the particle size of NCM622 decreased as the reaction proceeded, but the Li composition in NCM622 (x) differed between the two processes; specifically, it decreased to 0.26 after 24 h in (a), whereas it remained at ∼1 in (b), except for at the surface (x < 1). | ||
3.6 Reaction mechanisms during the leaching process
Based on the above results, we illustrate the reaction mechanisms underlying the HNO3 leaching processes with and without H2O2. In the leaching process without H2O2, almost half of the NCM622 dissolved into the HNO3 solution, while the rest of it remained in the solution in the delithiated state (x = 0.28 for N_24). According to TEM, soft XAS, and electrochemical analyses, this chemically delithiated NCM622 differed from its electrochemically delithiated counterpart in terms of its structural and compositional homogeneity. The Li content in the liquid phase was twice as high as the initial composition, whereas the Ni/Co/Mn ratios in the solid and liquid phases remained at approximately 0.6/0.2/0.2 (Table 1). Hence, the ideal overall reaction during the leaching process without H2O2 can be described by eqn (6).In the leaching process with H2O2, NCM622 completely dissolved into the solution within 3 h. The Ni/Co/Mn ratio in the liquid phase (= 0.6/0.2/0.2) was similar to that in the case without H2O2, but the Li composition in the liquid phase was only ∼1. Thus, the ideal overall reaction is represented by
| 2LiMO2 + 6H+ + H2O2 → 2Li+(l) + 2M2+(l) + 4H2O + O2. | (7) |
However, as revealed by the soft XAS and electrochemical analyses, the surface of NCM622 was slightly delithiated from the initial state (x < 1). Therefore, successive reactions of oxidation and dissolution occurred on the NCM622 surface during the leaching process with H2O2. In other words, the small amount of delithiation reaction played a crucial role in the rapid and complete dissolution of NCM622. The delithiation reaction with H2O2 is expected to be similar to eqn (6), although details are currently unclear.
To further support these mechanisms, HNO3 leaching experiments were also performed on NiO, Co3O4, and MnO2 with and without H2O2. As shown in Fig. S7 (ESI†), the w values are ∼100% for all the samples without H2O2. On the other hand, with H2O2, the w values are also ∼100% for NiO and Co3O4 but not for MnO2. Thus, the delithiation reaction of NCM622, namely, the oxidation of transition metals, promotes subsequent reduction and/or decomposition of the NCM622 surface, enabling successive oxidation and dissolution reactions. Notably, these experiments were performed at RT, which is a more moderate temperature than that for the conventional industrial procedure.11–13
3.7 Comparison with NCA and LCO
Finally, we compared our results to those of other positive electrode materials and investigated a more eco-friendly leaching process. Fig. 11a shows the results of HNO3 leaching without H2O2 for NCA and LCO as well as NCM622. Similar to NCM633, NCA and LCO have a layered structure with the Rm space group.18 The w values for NCA and LCO were 51.1 and 60.4%, respectively, indicating a similar dissolution reaction for NCM622 as described by eqn (6). The difference in w between the three positive electrode materials originates from the difference in their electrochemical properties. According to the charge curves for NCM622, NCA, and LCO in Fig. 11b, the x values in LixMO2 are 0.41, 0.34, and 0.48, respectively, where M is Ni0.6Co0.2Mn0.2, Ni0.88Co0.09Al0.03, or Co. The HNO3 solution is unstable above ∼4.2 V vs. Li+/Li at RT; thus, below 4.2 V, the further extraction of Li ions and the dissolution of the materials are both restricted to x.
 | ||
| Fig. 11 (a) Results of HNO3 leaching for NCM622, NCA, and LCO without H2O2. (b) Charge curves of the Li cells with NCM622, NCA, and LCO, which were normalized as a function of x in LixMO2 with M = Ni0.6Co0.2Mn0.2, Ni0.88Co0.09Al0.03, or Co. Photographs of the HNO3 leaching experiments for NCA and LCO with H2O2 (right). (c) Results of the citric acid leaching for NCM622, NCA, and LCO with H2O2. | ||
In the HNO3 leaching process with H2O2, all the NCA and LCO powder dissolved, as shown in the inset of Fig. 11b, and their solutions appeared green and red, respectively. This suggests that the yellow appearance of the NCM622 solution was a mixture of green from Ni and red from Co.
To reduce the environmental load, organic acids are preferable over inorganic acids such as HNO3 and H2SO4. Fig. 11c shows the results using citric acid with H2O2 to leach NCM622, NCA, and LCO. The w values for NCM822 and LCO were 1.4 and 5.4%, respectively, indicating the possibility of complete dissolution under more eco-friendly conditions. However, w for NCA was limited to 46.0%, implying that even a small amount of Al ions (0.03) impedes the dissolution of NCA. This relates to the fact that the solubility of Al3+ significantly decreases in the neutral solution.33
4 Conclusion
We elucidated the reaction mechanisms underlying the HNO3 leaching process for NCM622 with or without H2O2. In the leaching process without H2O2, w approached ∼60% after 24 h. The ah and ch values of residual NCM622 powder changed with the leaching time or Li composition (x), similar to those of electrochemically delithiated NCM622 compounds. However, this residual NCM622 powder differed from electrochemically delithiated compounds in terms of the microscopic crystal and electronic structures. A small amount of the γ-NiOOH phase existed in N_8 and N_24 (reaching a maximum of 3.2 wt%). Furthermore, EDS mappings and HAADF-STEM images clarified the compositional and structural inhomogeneities in N_24. Surprisingly, N_24 consisted of different-oriented layers, which are rotated by 60° with respect to each other. Owing to such inhomogeneities, the charge and discharge profiles of N_24 drastically changed with respect to those of the initial NCM622; a plateau appeared at ∼3.5 V, and Qrecha decreased with each cycle.In the leaching process with H2O2, the NCM622 powder completely dissolved into the solution within 3 h. The spherical secondary particles were broken within 1 h, and the average size of the primary particles decreased as leaching proceeded further. The ah and ch values in the middle of the leaching process were similar to those of the initial NCM622, indicating that x in NCM622 is 1. The XRS results, which reveal the electronic structures of the bulk, were consistent with the XRD measurements. However, soft XAS, which corresponds to the electronic structures of the surface, revealed a delithiated phase on the surface of N + H_1 according to the O K-edge, Ni L-edge, Co L-edge, and Mn L-edge XANES spectra. Hence, sequential oxidation (delithiation) and dissolution (decomposition) reactions occurred during the leaching process with H2O2, enabling complete dissolution within 3 h.
We also investigated the leaching process for NCA and LCO powders, which also dissolved into the HNO3 solution with H2O2, whereas approximately half of the LCO remained in the citric acid solution with H2O2. Even a small amount of Al ions (0.03) impeded the dissolution of NCA under mild acidic conditions. Thus, we must pay particular attention to the chemical composition of positive electrode materials under eco-friendly leaching conditions.
Author contributions
Kazuhiko Mukai: conceptualization, data curation, formal analysis, writing – original draft. Yasuhiro Takatani: data curation, formal analysis, writing – review & editing. Takamasa Nonaka: data curation, formal analysis, methodology, writing – review & editing.Conflicts of interest
There are no conflicts to declare.Acknowledgements
Soft XAS was conducted at the BL1N2 beamline at Aichi SR (No. 202205008), and XRS and corresponding XAS were performed at BL33XU at SPring-8 (No. 2022B7008, 2023A7045, and 2023B7045). We wish to thank Dr H. Sugiyama and Mr H. Murase of Aichi SR for help with the soft XAS measurements.Notes and references
- C. Huang, The Analects of Confucius, Oxford University Press, Oxford, 1997 Search PubMed.
- Y. Tian, G. Zheng, A. Rutt, T. Shi, H. Kim, J. Wang, J. Koettgen, Y. Sun, B. Ouyang, T. Chen, Z. Lun, Z. Rong, K. Persson and G. Ceder, Chem. Rev., 2021, 121, 1623 CrossRef CAS PubMed.
- K. Mizushima, P. C. Jones, P. J. Wiseman and J. B. Goodenough, Mater. Res. Bull., 1980, 15, 783 CrossRef CAS.
- T. Ohzuku and A. Ueda, Solid State Ionics, 1994, 69, 201 CrossRef CAS.
- J. C. Hunter, J. Solid State Chem., 1981, 39, 142 CrossRef CAS.
- K. Mukai and J. Sugiyama, Chem. Lett., 2009, 38, 944 CrossRef CAS.
- K. Mukai, J. Sugiyama, Y. Ikedo, Y. Aoki, D. Andreica and A. Amato, J. Phys. Chem. C, 2010, 114, 8626 CrossRef CAS.
- K. Mukai, J. Sugiyama, K. Kamazawa, Y. Ikedo, D. Andreica and A. Amato, J. Solid State Chem., 2011, 184, 1096 CrossRef CAS.
- M. Chen, X. Ma, B. Chen, R. Arsenault, P. Karlson, N. Simon and Y. Wang, Joule, 2019, 3, 2622 CrossRef CAS.
- E. Fan, L. Li, Z. Wang, J. Lin, Y. Huang, Y. Yao, R. Chen and F. Wu, Chem. Rev., 2020, 120, 7020 CrossRef CAS PubMed.
- L. Li, J. B. Dunn, X. X. Zhang, L. Gaines, R. J. Chen, F. Wu and K. Amine, J. Power Sources, 2013, 233, 180 CrossRef CAS.
- M. Joulié, R. Laucournet and E. Billy, J. Power Sources, 2014, 247, 551 CrossRef.
- H. Pinegar and Y. R. Smith, J. Sustainable Metall., 2020, 6, 142 CrossRef.
- T. Nonaka, H. Kawaura, Y. Makimura, Y. F. Nishimura and K. Dohmae, J. Power Sources, 2019, 419, 203 CrossRef CAS.
- K. Mukai, T. Nonaka, T. Uyama and Y. F. Nishimura, Chem. Commun., 2020, 56, 1701 RSC.
- R. Georgiou, C. J. Sahle, D. Sokaras, S. Bernard, U. Bergmann, J.-P. Rueff and L. Bertrand, Chem. Rev., 2022, 122, 12977 CrossRef CAS PubMed.
- Y. Tian, G. Zeng, A. Rutt, T. Shi, H. Kim, J. Wang, J. Koettgen, Y. Sun, B. Ouyang, T. Chen, Z. Lun, Z. Rong, K. Persson and G. Ceder, Chem. Rev., 2021, 121, 1623 CrossRef CAS PubMed.
- K. Mukai, ACS Omega, 2023, 8, 41897 CrossRef CAS.
- J. Song, H. Wang, Y. Zuo, K. Zhang, T. Yang, Y. Yang, C. Gao, T. Chen, G. Feng, Z. Jiang, W. Xiao, T. Luo and D. Xia, Electrochem. Energy Rev., 2023, 6, 20 CrossRef CAS.
- J. Zuo, J. Wang, R. Duan, Y. Bai, K. Xu, K. Zhang, J. Wang, K. Zhang, Z. Yang, Z. Yang, M. Li, G. Cao, Q. Jiang, W. Liu, J. Wang, W. Li and X. Li, Nano Energy, 2024, 121, 109214 CrossRef CAS.
- Y. Hao, X. Li, W. Liu, J. Wang, H. Shan, W. Li, X. Liu, L. Lin, X. Wang and X. Sun, Carbon Energy, 2023, 5, e272 CrossRef CAS.
- F. Izumi and K. Momma, Solid State Phenom., 2007, 130, 15 CAS.
- K. Momma and F. Izumi, J. Appl. Crystallogr., 2011, 44, 1272 CrossRef CAS.
- H. Sugiyama, H. Murase, T. Nomoto and Y. Takeda, J. Synchrotron Radiat., 2023, 30, 847 CrossRef CAS PubMed.
- P. Oliva, J. Leonardi, J. F. Laurent, C. Delmas, J. J. Braconnier, M. Figlarz, F. Fievet and A. de Guibert, J. Power Sources, 1982, 8, 229 CrossRef CAS.
- Y.-F. Li, J.-L. Li and Z.-P. Liu, J. Phys. Chem. C, 2021, 125, 27033 CrossRef CAS.
- M. G. Kim, H. J. Shin, J.-H. Kim, S.-H. Park and Y.-K. Sun, J. Electrochem. Soc., 2005, 152, A1320 CrossRef CAS.
- M. Oishi, K. Yamanaka, I. Watanabe, K. Shimoda, T. Matsunaga, H. Arai, Y. Ukyo, Y. Uchimoto, Z. Ogumi and T. Ohta, J. Mater. Chem. A, 2016, 4, 9293 RSC.
- S. Roychoudfury, R. Qiao, Z. Zhuo, Q. Li, Y. Lyu, J.-H. Kim, J. Liu, E. Lee, B. J. Polzin, J. Guo, S. Yan, Y. Hu, H. Li, D. Prendergast and W. Tang, Energy Environ. Mater., 2021, 4, 246 CrossRef.
- P. Ghigna and E. Quartarone, J. Phys.: Energy, 2021, 3, 032006 CAS.
- A. Braun, D. Nordlund, S.-W. Song, T.-W. Huang, D. Sokaras, X. Liu, W. Yang, T.-C. Weng and Z. Liu, J. Electron Spectrosc. Relat. Phenom., 2015, 200, 257 CrossRef CAS.
- R. Tao, B. Steinhoff, C. H. Sawicki, J. Sharma, K. Sardo, A. Bishtawi, T. Gibbs and J. Li, J. Power Sources, 2023, 580, 233379 CrossRef CAS.
- S. Dong, W. Shi, J. Zhang and S. Bi, ACS Earth Space Chem., 2018, 2, 269 CrossRef CAS.
Footnote |
| † Electronic supplementary information (ESI) available: Setup of the XRS measurements; Rietveld analysis results and structural parameters of residual NCM622 powders after HNO3 leaching with H2O2 or without H2O2; original FFT patterns from T, R1, R2, and R3; enlarged XANES spectra for the O K-edge, Ni L-edge, Co L-edge, and Mn L-edge; and results of the HNO3 leaching for NiO, Co3O4, and MnO2. See DOI: https://doi.org/10.1039/d4ya00049h |
| This journal is © The Royal Society of Chemistry 2024 |