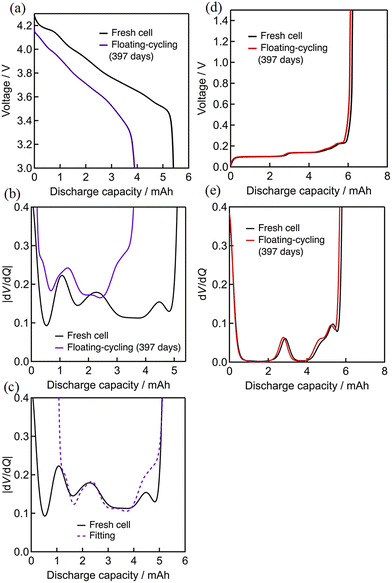
 Open Access Article
Creative Commons Attribution 3.0 Unported Licence
Combination of float charging and occasional discharging to cause serious LIB degradation analyzed by operando neutron diffraction†
Tetsuya
Omiya
 a,
Atsunori
Ikezawa
 a,
Keita
Takahashi
b,
Keiichi
Saito
b,
Masao
Yonemura
c,
Takashi
Saito
 c,
Takashi
Kamiyama‡§
 c and
Hajime
Arai
 *a
*a
aTokyo Institute of Technology, 4259, Nagatsuta, Yokohama, Midori-ku, Kanagawa 226-8501, Japan. E-mail: arai.h.af@m.titech.ac.jp
bNTT Anode Energy Corporation, Granparktower 3-4-1, Shibaura, Minato-ku, Tokyo 105-0023, Japan
cHigh Energy Accelerator Research Organization, 203-1, Oazashirane, Tokai, Naka, Ibaraki, 319-1195, Japan
First published on 28th December 2023
Abstract
With the widespread use of lithium-ion batteries (LIBs) for multiple applications, understanding the degradation factors of LIBs is essential for their life extension. In this work, durability tests of commercially available 18650 LIB cells were performed for about 400 days with float charging (floating), continuous cycling (cycling), and float charging with occasional discharging (floating–cycling) with the intention to mitigate the film formation during the float charging. The results indicated that severe capacity degradation was observed in floating–cycling, which was much worse than the sum of the degradation by floating and cycling. The dV/dQ curve and impedance analyses suggested that this serious cell degradation is due to the deterioration of the positive electrodes. Operando neutron diffraction analysis of the cells degraded by the floating–cycling mode revealed considerable reaction inhomogeneity in the positive electrode, and the Rietveld refinement of the lattice parameter transitions suggested that the origin of the reaction inhomogeneity is the internal resistance increase in the positive electrode to limit the available capacity ranges of the cell. Post-mortem analysis of the positive electrode degraded after the floating–cycling test indicated that the cracks caused by repeated charging–discharging cycles were covered with thick resistive films by the floating operation, leading to the non-uniform increase in impedance and the reaction inhomogeneity in the positive electrode. The deterioration factors and mechanisms found in this study will give insights on the capacity loss in the LIBs and promote the development of the strategy to reduce the LIB degradation.
1 Introduction
Lithium-ion batteries (LIBs) have high energy density and long cycle life, and have widely been applied as power sources of portable devices. In recent years, their use has expanded to large-scale portable sources such as electric vehicle and stationary storage applications.1–4 For these long-term power supply applications, it is essential to understand the major factors that cause cell degradation and to take measures to prevent possible failure.There are several degradation factors of LIBs, depending on their operating conditions.5 The most common degradation mode is so-called loss of lithium inventory (LLI), where the amount of available lithium (originally extracted from the positive electrode) is consumed by side reactions mainly at the graphite negative electrode, promoting solid electrolyte interphase (SEI) growth to increase the charge transfer resistance and shift the potential windows of both electrodes.5–10 This is particularly severe for charge–discharge cycles at high temperatures and/or high charging voltage, occasionally accompanied with electrolyte dry-out to cause high cell impedance.11–13 The other important degradation mode associated with the graphite electrode is metallic lithium deposition at low temperatures, which results in the deformation of the electrode and could cause short-circuit.14,15 Particle cracking and metal dissociation of the positive electrode materials are also often reported as the origins of the degradation, which causes loss of ion/electrons conductive paths and decreases the effective active material mass.5,16 This can be severe when the current load is high and the operating voltage condition is wide. For conventional nickel-based layered electrode materials such as LixNiaCobAlcO2 (NCA) and LixNiaCobMncO2 (NCM), it has been reported that particle cracking leads to the formation of rock salt type nickel oxide (NiO) layers at the electrode/electrolyte interface and resistance increase.17,18
The LIB cells are often set under continuous (float) charging conditions, which maintains the cell always in the fully charged state compensating the self-discharge, for example, in cellular phone/computer use at home/office connected to commercial power sources and also in power backup applications. It is thus important to understand the phenomena occurring during float charging and to minimize the cell degradation. Continuous high voltage charging can lead to the resistive SEI formation and loss of Li inventory, in addition to the transition metal dissolution occurs at the positive electrode.19 In order to suppress the cell degradation caused by these factors, occasional (or periodic) discharge processes to interrupt continuous charging are considered to be effective. This is useful also for peak-cutting and peak-shifting, that is, accumulating power generated in low-demand and low-price time zones to be utilized in high-demand and high-price time zones. To our best knowledge, there has been no reported investigation of degradation analysis of the cells under operating conditions including float charging and periodic discharge, which is worthy to be explored.
For the degradation analysis of LIBs, non-disassembly analysis techniques have widely been applied. In contrast to the analysis with cell disassembly, durability (degradation) tests and the cell analysis can be performed multiple times with identical cells. Electrochemical impedance spectroscopy is a common non-disassembly analytical method to understand the cell status while continuing durability tests.20 In recent years, dV/dQ curve analysis using differential plots obtained from low-rate charge–discharge curves of the cells has been applied to clarify the factor for cell degradation, such as the loss of Li inventory and the loss of active material.21,22 Though these methods have been intensively applied, the analysis may not be effective when there are significant material/behavior changes in the cell, because the degradation information is only relative to the fresh cell behavior. In addition, the obtained information is based on the average conditions of the whole cell and can only indirectly suggest the changes occurred in the active materials. Accordingly, degradation caused by partial (inhomogeneous) deterioration of the material could only be poorly clarified.
It is thus desirable to directly observe the cell component chemistry and to correlate the behavior of the materials to the electrochemical behavior. Neutron diffraction is a powerful non-disassembly technique for LIB analysis owing to the ability to detect light atoms like lithium and oxygen, and the highly penetrating nature of neutrons.23–27 Even though the access to neutron diffraction facilities is limited, highly permeable neutron beam is worth using for non-destructive analysis of commercial LIBs to show the behavior of the electrode materials during operation including reaction inhomogeneity, which is hardly deduced by electrochemistry. In situ neutron diffraction measurement has been applied to the analysis of commercial batteries to identify the degradation factors using the change in the crystal structure inside the aged cell.28 In addition, recent development of high-power neutron facilities enables operando neutron diffraction, which can offer dynamic behavior of the cell materials during the charge–discharge processes. There are several reports to demonstrate the successful operation of the oprando neutron measurement,29–34 but the methods have rarely been applied to the cell degradation behavior. For example, Taminato et al. have shown non-equilibrium reaction process of the graphite electrodes using operando neutron diffraction measurements of commercial LIBs that the reaction proceeds.31 Shiotani et al. have suggested the loss of positive electrode material with cell degradation by comparing the structural change and the cell capacity.32 The application of operando neutron diffraction is thus expected to be useful for battery analysis degraded by floating and discharging. Simultaneous observation of the positive and negative electrodes by the neutron diffraction is particularly useful to independently understand their behavior when analyzing commercial cells without reference electrodes. In addition, it is expected that inhomogeneous reaction processes or their relaxation can be detected by the operando analysis that captures material changes with time.
In this paper, durability tests of commercial LIB cells are employed in three different modes, that is, float charging, continuous charge–discharge cycling and float charging with periodic discharging. Their statuses are analyzed in non-disassembly manners using dV/dQ curve measurement, electrochemical impedance spectroscopy and operando neutron diffraction to clarify the degradation factors of the cells depending on the operating conditions. The deduced deterioration factors by these operando methods are later verified by dismantling the cells and inspecting the status of the electrodes.
2 Experimental
2.1 Durability test
Commercially available 18650-type Li-ion cells (NCR18650B, Panasonic) were used in this study. Prior to the durability test, 10 cells of the same lot were first examined to prove their identical behavior, although the initial cell capacity of 2.84 A h was smaller than the value in the manufacture's catalogue (3.35 A h) probably due to the degradation in the storage period. We define the term “fresh cell” as the cell purchased and cycled a few times to confirm its capacity (without any durability tests). If they have experienced only a few cycles, we call it fresh cell, regardless of the charging state, meaning that the fresh cells can be in charged or discharged states. The durability tests were employed in three modes, that is, continuous charge–discharge cycling (cycling), float-charging (floating), and combining float-charging and periodic discharging (floating–cycling). A battery testing system TOSCAT-3000 (Toyo System Co) was used for the durability tests at 25 °C. In cycling, the cells were charged in constant current (CC) mode to 4.2 V at 0.5C and discharged in CC mode to 2.5 V at 1C, up to 397 cycles. In floating, the cells were CC-charged to 4.2 V at 0.5C and then maintained at 4.2 V for constant voltage (CV) charging (float charging) up to 397 days. In floating–cycling, the cells were CC-charged at 0.5C to 4.2 V and kept charging at 4.2 V except for full discharging at 1C once a day for 397 days. Detailed conditions are shown in Table S1 (ESI†), which follows the standards written in the cell specification sheet. Two sets of the durability experiments were employed where the cells for cycling were set vertically and horizontally. The degradation analysis was mainly employed for the vertically-set cells unless specified, though the degradation behavior was nearly identical (see below). Most of the results of horizontally-set cells are shown in ESI.†2.2 Electrochemical analysis
Charge–discharge curve measurement at low rates and impedance analysis were occasionally performed to estimate the degree of degradation. Low-rate charge–discharge tests were conducted using TOSCAT3000 when 160 and 397 days were passed after the durability tests had started. The cells were first CC charged at 0.5C at room temperature to 4.2 V cutoff and then CV charged at 4.2 V to 65 mA cutoff. The impedance measurement was employed at the fully charged state using a potentiostat/galvanostat VSP-300 (Bio-Logic) in the frequency range of 1 MHz to 5 mHz. Then, the cells were CC discharged at 0.1C to 2.5 V, and the impedance measurement at the fully discharged state was performed. From the obtained discharge curve, a differential dV/dQ plot versus capacity was created to estimate the degradation mode based on the previous report.21,22 The cells were charged and discharged once more for the operando neutron diffraction measurements before they were returned to the durability test. The impedance spectra and the dV/dQ plot were also created with the fresh (pristine) cell.2.3 Operando neutron diffraction analysis
Operando neutron diffraction measurements were performed to investigate the crystal structural changes of the positive and negative electrodes under battery operating conditions. The diffraction measurements were performed at room temperature using a time-of-flight (TOF) powder diffractometer (SPICA) at Materials and Life Science Experimental Facility (MLF) of Japan Proton Accelerator Research Complex (J-PARC).35 It is capable of crystal structure analysis of materials with high resolution and high intensity, and has a data integration system for time-resolved measurements, which is necessary for the operando measurements.The operando neutron diffraction profiles of the cells were obtained with the fresh cell and the degraded cells after the electrochemical analysis shown above was employed. The neutron experiment opportunities of once or twice a year were sufficient for this study because the commercial cell degradation slowly proceeded as shown in results. The setup of the instruments together with the operando cell photo is shown in Fig. S1 in ESI.† The detailed facilities of the used beamline are shown in the literature.35 All experiments were performed at ambient temperature at around 25 degrees. The signals took in 10 minutes were accumulated to give statistically sufficient data quality, which gives 60 diffraction profiles during the 0.1C operando measurements. The neutron diffraction profiles were acquired in the 90° banks of 0.4–5.0 Å, including the 003 reflection (4.6–4.8 Å) of the layered positive electrode. Before the diffraction measurements, the cells were CC charged at 0.5C at room temperature to 4.2 V cutoff and then CV charged at 4.2 V to 65 mA cutoff. After setting the cell in the fully charged state to the beamline, an in situ (no-current flowing) neutron diffraction measurement was employed under the open circuit condition. It took about 30 to 60 minutes to start the in situ measurement after the end of the full-charge, which was sufficient for the cells to relax their state of charge. In fact, the in situ neutron diffraction pattern was clearly obtained without blurring. Then the operando neutron diffraction was measured during the cell discharging to 2.5 V at 0.1C. The signals took in 10 minutes were accumulated to give statistically sufficient data quality, which gives 60 diffraction profiles during the 0.1C operando measurements.
The diffraction profiles obtained from the operando measurements were analyzed by the Rietveld method using the Z-Rietveld program36 to refine the crystal structure parameters of both the electrodes. The following crystalline phases were assumed for the refinement: LixNi0.8Co0.15Al0.05O2 (NCA) as the positive electrode, graphite as the negative electrode, aluminum and copper for the positive and negative electrode current collectors, and steel (iron) for the cell case. The graphite profile was assumed to consist of Stage 1 (LiC6), Stage 2 (LiC12), Stage 3 (LiC18), Stage 4 (LiC24), and non-lithiated graphite (C6). The refinement was performed over the d-value range of 0.95 Å to 4.0 Å, excluding the 003 reflection of the layered positive electrode material showing significant peak broadening in the diffraction profile after the degradation. Aluminum and copper used as the electrode current collectors and steel (iron) as the cell container were used as the standards in refining the conversion parameters that determine the d-spacing value of the diffraction pattern, because the lattice constants of these metals hardly change. The details of the Rietveld analysis are shown in the literature.36
2.4 Disassembly analysis
The 18650-type cell after the floating–cycling test and a fresh cell of the same lot were disassembled in the discharged states in an inert atmosphere to remove the positive and negative electrodes. These samples were handled in a globe box in inert (moisture/oxygen-free) atmosphere. Each electrode was washed with dimethyl carbonate (DMC) and dried to fabricate coin cells with Li foil as the counter electrodes. The positive electrode half-cell was charged and discharged at 1/50C in the range of 3.0 V to 4.3 V and the negative electrode half-cell in the range of 0.005 V to 1.5 V using the charge/discharge device HJ1001SM8A (Hokuto Denko). A dV/dQ curve was created from the discharge curve, similar to the full cell. The half-cell impedance measurements were performed using VSP-300 in the frequency range of 1 MHz to 5 mHz at the end of charge and discharge.The scanning electron microgram (SEM) images and elemental mapping of the surfaces of the electrodes removed from the disassembled cell were obtained using a field emission scanning electron microscope (FE-SEM Regulus 8230, Hitachi) to examine the cracks in the active material particles and elemental distribution at the electrode surface. The cross-section of the positive electrode was prepared using an ion milling system (Ion-Milling System IM4000 PLUS, Hitachi) and the SEM images and elemental mapping were similarly obtained. The particle surface of the positive electrode was observed by scanning transmission electron microscopy (STEM) combined with electron energy loss spectroscopy (EELS) (ARM 200F, JEOL) using the same cross-sectioned samples. The TEM images were obtained at an acceleration voltage of 200 kV.
3 Results and discussion
3.1 Electrochemical evaluation of cell degradation
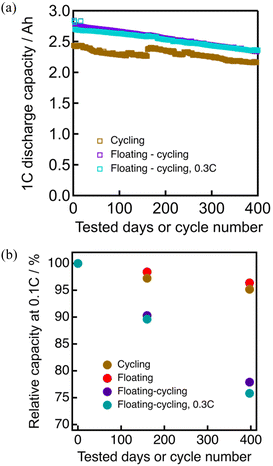
The capacity of the vertically-set cells at 0.1C rate before and after durability tests are summarized in Fig. 1 (with numerical data in Table S2, ESI†), showing the capacity decreases by floating–cycling (22% after 397 days) is significantly larger than the decrease sum of floating (3% after 397 days) and cycling (4% after 397 cycles). The cycling cell was stored in a fully discharged state for 60 days after 160 cycles until the floating–cycling cell reached 160 cycles, leading to the capacity recovery appeared in Fig. 1.The durability test process of floating–cycling is essentially the sum of those of floating and cycling (the floating period being actually shorter), indicating the negative synergic effects of the floating–cycling processes. The floating–cycling cell with everyday 0.3C discharging behaved nearly the same as the cell with everyday 1.0C discharging, indicating that the discharge rate (and the resultant differences in the fully charged duration of ca. 10%) has little effect on the degradation behavior under the tested conditions. Nearly the same tendency was observed for the horizontally-set cells (Fig. S2, ESI†) with somewhat larger degree of degradation for the vertically-set cells, possibly due to uneven distribution of the electrolyte caused by gravity. The vertically-set cell can be suffered from electrolyte depletion as the electrolyte decomposition proceeds, and the limited electrode area immersed in the electrolyte can lead to the more significantly increased cell resistance than that of the horizontally-set cell. We hereafter focus on the origin of the serious degradation of the floating–cycling cell with everyday 1.0C discharging (floating–cycling).
The degradation status was analyzed by the derivative dV/dQ plots. Fig. 2 shows the 0.1C discharge and the corresponding dV/dQ curves of the cells before and after 160 cycles (cycling) or 160 days (floating and floating–cycling). The curves are nearly identical for cycling and floating whereas a clear voltage decay and the associated capacity decrease are seen for the floating–cycling. Here we assumed that the positive and negative electrode materials are NCA-like material and graphite, which is later proved by neutron diffraction experiments, and the dV/dQ profiles were analyzed based on the previous study.21,22,37 The three distinct peaks in the profiles (Fig. 2) are indeed very close to the reported ones.38 From the beginning (left-hand side in Fig. 2) to the end (right-hand side) of discharge, there were a positive-derived P1 peak, a superposition of a negative-derived N1 peak and a positive-derived P2 peak, and a negative-derived N2 peak. The P1 and P2 peaks are assigned to be essentially the same as the phase transitions of NCA-like material and the N1 and N2 peaks correspond to the disappearance of graphite stage 1 and 3, respectively.38 The derivatives dV/dQ before and after the tests were essentially identical for cycling and floating except for the unclear N2 peaks, which is due to partially incomplete lithium extraction from the graphite after degradation. In contrast, significant changes were observed in the dV/dQ plot for floating–cycling. In addition to the peak height decrease of the P1 peak and the absence of the N2 peak, there was a small peak-to-peak distance decrease (ca. 4.3 mAh) in N1 and P1, which can be ascribed to loss of lithium inventory (see below).
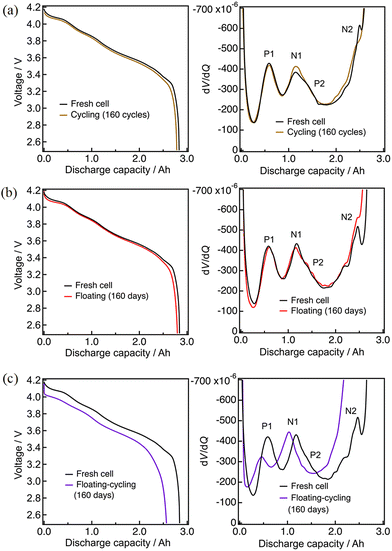 | ||
| Fig. 2 Discharge curves and dV/dQ curves after 160 cycles: (a) cycling, (b) floating, (c) floating–cycling. | ||
The test results after 397 cycles or 397 days are similarly shown in Fig. 3. Again, the discharge profiles were almost unchanged for cycling and floating, while there are a significant voltage decay implying the increase of the cell resistance and the associated capacity loss for floating–cycling. The degradation appears more clearly in the derivative dV/dQ plots as shown in Fig. 3(a) and (b). The N1 and P2 peaks are indistinguishable in the fresh cell, while they are separated after 397 days (floating) or 397 cycles (cycling) as N1 shifted to the left-hand side. This N1 peak shift against the P2 peak is typical to the potential window shift arisen from the loss of lithium inventory.21 On the other hand, the behavior of the cell after floating–cycling of 397 days was entirely different from that of the fresh cell as shown in Fig. 3(c), indicating that the degradation mode is not just the typical loss of lithium inventory and the origin of the degradation can hardly be clarified only with the dV/dQ profile.
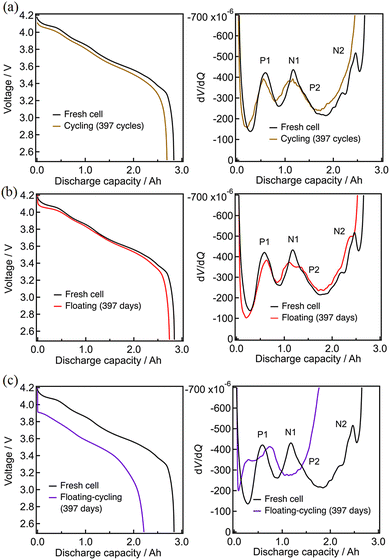 | ||
| Fig. 3 Discharge curves and dV/dQ curves after 397 cycles: (a) cycling, (b) floating, (c) floating–cycling. | ||
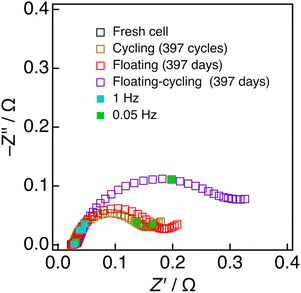
To search for the origin of the degradation, the impedance analysis was employed for these cells. Fig. 4 shows the Nyquist plots of the cells (in the charged states) before and after three durability tests of 397 cycles per days. According to the previously reported profile assignment,39–41 the semicircles in the frequency regions of 100 Hz and 0.1 Hz that can respectively be ascribed to the charge-transfer processes of the negative (graphite) and positive (lithiated layered oxide) electrodes. The semicircles at around 100 Hz increased by the three durability tests, in nearly the same manner, suggesting that the negative electrodes are degraded by a common mode, presumably the SEI formation onto the graphite.41–43 On the other hand, a particularly large increase the semicircles at around 0.1 Hz was observed for the cell with floating–cycling. This suggests that the main origin of the serious degradation in floating–cycling is in the positive electrode. Because it is hard for this simple impedance spectrum assignment to clearly indicate the origin of the degradation, neutron diffraction experiments, which can separately evaluate the behavior of the positive and negative electrodes, were employed and analyzed.
3.2 Operando neutron diffraction analysis
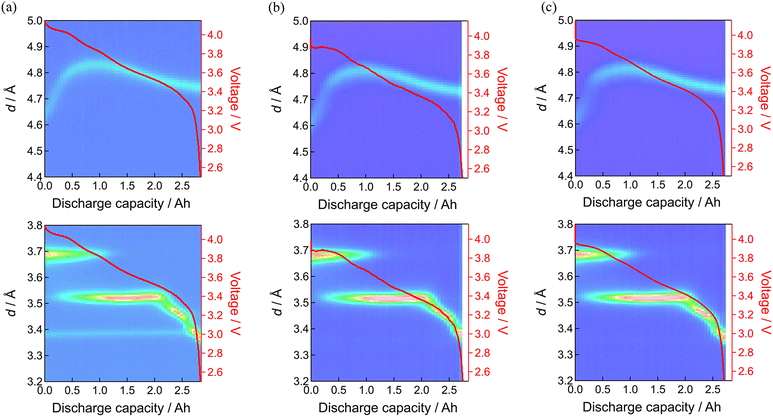
The operando neutron diffraction measurements of the fresh and aged cells were employed to clarify the origins of the degradation. The diffraction profile in the fully discharged state suggests that the positive and negative electrode materials are virtually the NCA-like layered material and graphite, respectively. Fig. S3 (ESI†) shows the evolution of the diffraction profile of the fresh cell during 0.1C discharging. The 003 reflection of the positive electrode material and 00l reflections of graphite are respectively observed at 4.6 to 4.8 Å and around 3.5 to 3.7 Å, in addition to the reflections of aluminum (positive electrode current collector), copper (negative electrode current collector), and iron (cell container), which will be later clarified with the Rietveld refinement. The lattice constant evolution of the fresh cell also confirms that the positive electrode material is NCA-like,44 as shown in Fig. S4 (ESI†).Fig. 5 shows the 003 reflection of the positive electrode material and 00l reflections of graphite as the representatives of the structural evolution of the electrode materials, before and after 160 and 397 days of floating. The profile was nearly unchanged after floating, but it should be noted that the 003 reflection of the positive electrode material in the beginning of the discharge process was d = 4.63 Å for the fresh cell while d = 4.60 Å after 397 days of floating. Considering the lattice constant evolution of NCA,44 this shrunk d-spacing of the 003 reflection indicates overcharged (over-delithiated) states of the NCA-like positive electrode material. The weak stage-1 in the beginning of discharging and early appearance of the stage-2 of graphite suggests incomplete charging after 397 days of floating. These are consistent with the loss of lithium inventory by parasitic reaction at the negative electrode, causing the potential window shift of both of the electrodes.
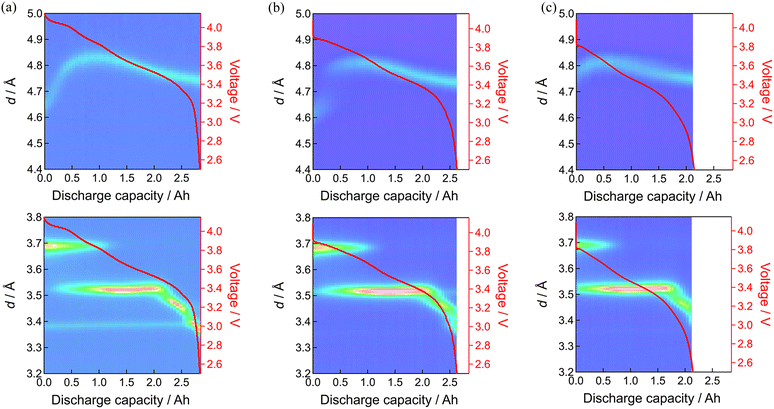
Fig. 6 shows the results before and after 160 and 397 days of floating–cycling. What is pronounced is the broadening of the positive electrode material reflections after 160 days especially in the beginning of discharge. Such line broadening was not remarkable in the negative electrode behavior. This line broadening of the positive electrode material can be expressed by setting the d-space evolution during the discharge (yellow curve in Fig. 7(a)) overlapped with that shifted along the horizontal (depth-of-discharge) direction (Fig. 7(b)). This shifted setting can explain significant broadening in the beginning of discharge while little difference in the latter part, owing to the small d-space change in the latter part of discharge. Consequently, this line broadening (also shown in Fig. S5, ESI†) can be ascribed to the reaction inhomogeneity in the positive electrode where the discharge process started non-uniformly depending on the part of the electrode, which is presumably derived from partially formed resistive films in the electrode material particles as shown in the latter part of the manuscript. By using Gaussian distribution fitting, the width at half maximum (FWHM) of the 003 peak was obtained (shown in Fig. S6 and S7, ESI†), showing low crystallinity of the positive electrode material after 397 days of floating–cycling. The increase in the FWHM has been attributed to the increase in microcracks in the positive electrode material,28 which will be later clarified in the post-mortem analysis. In the negative electrode side after 160 days of floating–cycling, the appearance of the graphite at the end of discharge was nearly lost. After 397 days, the broadening behavior of the positive electrode material is again apparent but the initial part is lost due to seriously incomplete charging. The initial d-spacing value of d = 4.79 Å of the floating–cycling cell is obviously larger than that of the fresh cell (d = 4.63 Å), suggesting the incomplete charging based on the significant increase of d-spacing in the beginning of discharging process (see also Fig. S5, ESI†). Furthermore, the d-spacing value d = 4.76 Å of the floating–cycling cell is larger that of the fresh cell (d = 4.76 Å), implying that the discharging was also incomplete. In the negative electrode side after 397 days, the weaker stage-1 and stronger stage-2 in the beginning of discharge corresponds to incomplete charging while the shorter stage-4 and the absence of graphite at the end of discharge explains incomplete discharging. Such incomplete charging and discharging can be correlated to the increase of cell resistance, presumably caused by the positive electrode as suggested by the impedance increase. The degree of incompleteness was more significant during charging than during discharging. This is because the voltage drop at the end discharging is large even for the fresh cell and the internal resistance increase has little effect on the state of charge (SOC) at the end of discharging, whereas the voltage change at the end of charging is small, causing significant SOC change with the same internal resistance increase.
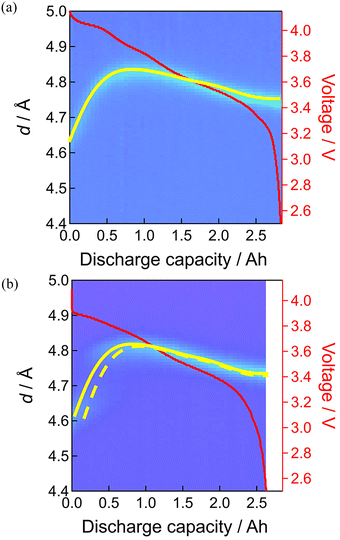 | ||
| Fig. 7 Line broadening of neutron diffraction patterns of 003 diffraction of positive electrode: (a) fresh cell, (b) floating–cycling after 160 days. | ||
3.3 Quantitative analysis of degradation based on lattice constant evolution
To analyze the degradation in more quantitative manners, the lattice constant evolution during discharging were evaluated by the Rietveld refinement of the operando neutron diffraction profiles. The accumulated profiles in 10 minutes were mainly analyzed, meaning that the profile was measured within the SOC change of 2%. As shown in Fig. S8–S10 and Table S3 (ESI†), the refinement of the Rietveld analysis resulted in sufficiently low residual factors when taking these operando profiles into account. The background of diffraction patterns is somewhat large, due to the presence of hydrogen atoms in the electrolyte and separator, but it is monotonous and not too significant to interfere the Rietveld analysis as shown in the figure. The degree of degradation was analyzed based on the lattice constant evolution of the positive electrode material because the parameters a and c can directly be correlated to the SOC of the positive electrode. As the monotonous evolution of a seem to be convenient for fitting (see Fig. S11, ESI†), we attempted the least-square fitting of the evolution of a by adjusting the SOC shift in the beginning (mA h) and expansion rate of the evolution profile before and after degradation by using two parameters; one is the SOC shift in the beginning of discharging caused by insufficient charging (due to resistance increase) and the other is the expansion rate for the whole lattice constant evolution corresponding to surviving active material mass.The open circles in Fig. 8 and 9 show the evolution of the lattice constants a and c of the fresh cell during discharging. They were mostly obtained by using the automatic continuous multipoint analysis program installed in Z-Rietveld,36 with some intermittent manual analyses. The selected lattice constant evolution from the cells degraded by floating and floating–cycling (both after 397 days) are respectively shown in Fig. 8 and 9 as pink and violet filled circles. It is clear that those from the floating test are close to the fresh cell data whereas those from the floating–cycling test are significantly different. The larger a and c values of the floating–cycling aged cell than the fresh cell data suggest the low SOC in the beginning of charging, as previously described. The a-axis evolution during discharging is monotonous and the trend can be roughly shown as a slanted line. If the essential phase evolution behavior is kept intact and the amount of the material available for discharging decreases, the lattice constant evolution can be more slanted. In other words, a more slanted evolution of a implies the loss of material utilization caused by the degradation.32 We attempted the least-square fitting of the evolution of a by adjusting the SOC shift in the beginning (mA h) and expansion rate of the evolution profile, because the monotonous evolution of a seem to be convenient for fitting. Then the resultant SOC shift and the expansion rate were applied to the evolution of c. As shown in Fig. 9, the fitted data fairly matched with the fresh cell data with some inconsistency seen in the transition of c, presumably due to the considerable d-spacing changes in the beginning of discharging. The same procedure was employed for the cells degraded by floating and the obtained capacity shifts and expansion rates are summarized in Table 1, together with the mean absolute errors. The capacity shift for floating contained some errors, but it was small with −2 ± 1% of the initial cell capacity. On the other hand, the capacity shift for floating–cycling was significant with 20 ± 1% of the initial cell capacity.
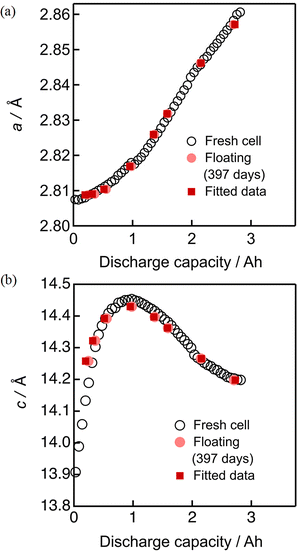 | ||
| Fig. 8 Least squares fitting results of the lattice constants (a) a and (b) c for the cell after 397 days of floating. | ||
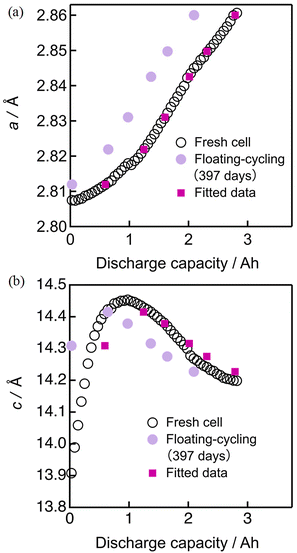 | ||
| Fig. 9 Least squares fitting results of the lattice constants (a) a and (b) c for the cell after 397 days of floating–cycling. | ||
| Mode | Actual capacity decrease [mA h] | Capacity shift obtained by diffraction analysis [mA h] | Expansion rate obtained by diffraction analysis |
|---|---|---|---|
| Floating | 103 | −56 ± 28 | 1.04 |
| Floating–cycling | 626 | 563 ± 6 | 1.06 |
The negative capacity shift for the floating cell can be ascribed to the loss of lithium inventory. On the other hand, the capacity shift for the floating–cycling cell was approximately close to the actual capacity loss (ca. 20% of the initial capacity). The expansion rate of 1.06 indicates that 6% of the initial material was lost during the durability test, which is much smaller than the actual capacity loss. Accordingly, it is concluded that the main origin of the capacity degradation of the floating–cycling cell is attributed to the internal resistance increase in the positive electrode that limits the available capacity of the cell.
3.4 Post mortem analysis
A fresh cell and the cell after the floating–cycling test were disassembled to explore the condition changes of the positive and negative electrodes caused by the durability test. The horizontally-set cells were used for the post mortem analysis because the vertically-set cells after neutron radiation are unsuitable for disassembling. Fig. 10 shows the discharge behavior and the corresponding dV/dQ profiles of the positive and negative electrodes in the half-cell tests, showing typical behavior of the NCA-like material and graphite electrodes under the fresh conditions. The capacity loss and change in the dV/dQ profiles of the positive electrode were remarkable while those of the negative electrode was negligible. The dV/dQ profiles changes of the positive electrode are close to those obtained in the full cell (Fig. 3). The profile of the degraded positive electrode matches that of the fresh cell with some initial offset as shown in Fig. 10(c), suggesting that the material itself was nearly unchanged and cell charging was considerably limited. The impedance analysis of the disassembled electrodes (Fig. 11) indicates significant impedance growth in the positive electrode. In addition, the discharging experiments as well as the impedance measurements were employed after full cycling of the fabricated cell. As shown in Fig. S12 and S13 (ESI†), the resultant behavior was reproducible, indicating that the degraded behavior is intrinsic to the electrode and not caused by the different SOC of the disassembled electrode. The cell disassembling could cause some changes in the components, even if we sufficiently pay attention to the disassembling processes. In the present study, the charge–discharge curves, dV/dQ curves, and Nyquist plots of the impedance measurements all show that the behavior of the positive and negative electrodes from the disassembled cells can reproduce that of the full cell before disassembling. Therefore, we are sure that these half-cell test results appropriately represent the status of the full cells.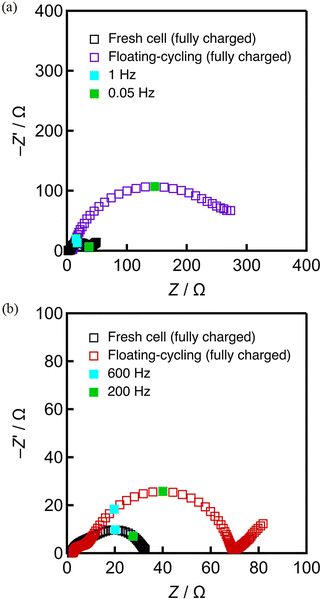 | ||
| Fig. 11 Nyquist plots of fully charged electrodes of fresh cell and floating–cycling, (a) positive electrode, (b) negative electrode. | ||
The SEM and EDX images of the fresh cell and the cell after the floating–cycling test are shown in Fig. S14–S17 (ESI†). The positive electrode particles are in 1 to 2 micron sizes, and there formed some cracks after degradation. The negative electrode particles consist of flakes of 5 to 10 microns, and additional small grains were found after degradation. These small grains were metallic nickel as deduced by the EDX analysis, which is the reduced species of Ni2+ in the electrolyte as a consequence of nickel dissolution in the positive electrode side. This agrees with the reported results that float charging causes transition metal dissolution in the positive electrode and dissolved metal electrodeposition in the negative electrode.19 The increase of fluorine signal was observed in the negative electrode, which can be attributed to the formation of SEI derived from the electrolyte components. Interestingly, the negative electrode was electrochemically active, despite of the depositions of nickel and fluorine compounds.
To investigate the details of the degradation, the cross section of the positive electrode was exposed by the ion-milling method and observed by SEM and EDX. As shown in Fig. S18 (ESI†) a considerable amount of crack formation was found in the positive electrode all through the positive electrode after degradation. There were fluorine and carbon signals in the cracks (Fig. 12), suggesting the existence of the electrolyte decomposition product in the cracks, which is presumably the origin of the impedance increase in the positive electrode. We deduce that such inhomogeneous film formation leads to the reaction inhomogeneity in the positive electrode found in the operand neutron diffraction measurements. It is known that inert rock-salt phase formation at the nickel-based electrode surface is detrimental to the electrode performance.45 On this basis, the local structures of the positive electrode surface were analyzed by TEM as shown in Fig. S19 and S20 (ESI†). The fresh cell electrode surface has some disorder but no rock-salt phase, while the rock-salt phase formation with the thickness of ca. 5 nm is observed in the degraded electrode at the natively exposed surface of the particles (Fig. S20(d), ESI†) and also in the crack part (Fig. S20(e), ESI†). The rock-salt region is relatively thin when compared to the typically reported thickness of 20–30 nm for degraded cells with the capacity decrease of more than 20%.17,46 These results suggest that the main cause of the floating–cycling cell is the resistive surface film formation rather than the rock-salt film formation. Further study is needed to clarify the effect of these factors and the correlation between them.
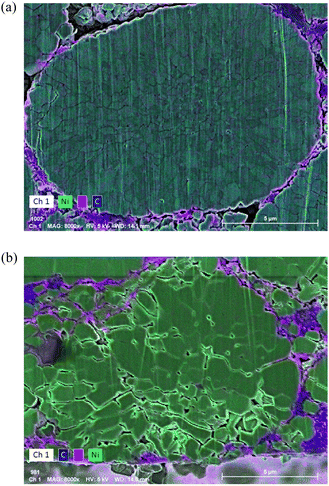 | ||
| Fig. 12 EDX results of positive electrode cross section (electrolyte side): (a) fresh cell and (b) floating–cycling. | ||
Summarizing the results shown above, it is proposed that the origin of the cell degraded by floating–cycling is derived from the negatively synergetic effect of the crack formation in the positive electrode by repeated cycling associated with the crystalline lattice expansion/contraction and the resistive film formation at the formed surface in the cracks caused by the floating process, as illustrated in Fig. 13. It is suggested that the reaction inhomogeneity observed in the operando neutron analysis is caused by non-uniform formation of the resistive films to lead to uneven overpotential distribution in the particles. It is noted that the cell tested under the cycling condition, degraded by the loss of lithium inventory, showed somewhat faster degradation rate than the floating cell. While the time kept at high voltages was short for the cycling cell, contributing to the suppression of the resistive film growth in the positive electrode, the cycling procedure to break the surface film presumably leads to the regeneration of the surface film and thus the severe loss of lithium inventory. In addition, the fluorine-containing film at the positive electrode surface found in this study seems to be much thicker than the generally reported cathode–electrolyte interphase that does not usually degrade the electrode performance too much, suggesting that the resistive film could be derived from the negative electrode as the consequence of the cross-talk.47–49 The film formation should be accelerated during the floating process also on the negative electrode side and the reductive decomposition detached by cycling could be transferred to through the electrolyte and would form resistive films by oxidation at the positive electrode. Further study is again needed to clarify the detail of the surface film formation mechanism and the cell management as well as new strategies50,51 to suppress these serious degradation modes. It is also important to elucidate how the fast degradation seen in floating–cycling can be suppressed. It is proposed that limiting the degree of SOC during continuous charging can suppress the fast degradation, which is currently under investigation and will be reported elsewhere. In addition, though the detailed analysis of the resistive film formed on the positive electrode surface and of the remaining electrolyte solutions is beyond the scope of the current study, it is definitely a future task to clarify the nature of them and the resultant reaction mechanism.
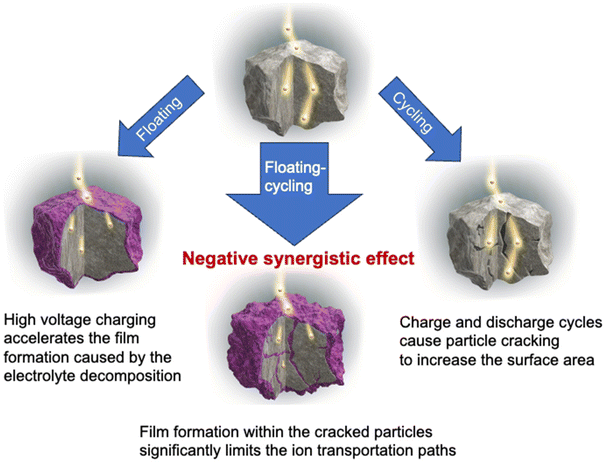 | ||
| Fig. 13 Schematic illustration of degradation mechanisms for floating, cycling and floating–cycling. | ||
4. Conclusions
This work focused on understanding the major degradation factors of lithium-ion batteries operated in three typical modes. The cell deterioration by floating or continuous charging is caused by loss of lithium inventory, which is commonly recognized as the origin of the deterioration during continuous cycling, whereas float charging with periodic discharging (floating–cycling) results in serious capacity degradation, showing the negative synergic effects of the floating and cycling processes. The fact that floating–cycling leads to faster degradation than cycling suggests that the simple constant current charging is better for long cell lifetime rather than the constant voltage charging recommended by cell manufacturers, at the sacrifice of small additional capacity. The dV/dQ curves analysis and impedance spectroscopy indicates that this serious degradation of floating–cycling is originated from the increase of positive electrode resistance. The operando neutron diffraction analysis demonstrates, for the first time, that the increased resistance causes reaction inhomogeneity in the positive electrode and leads to the incomplete charging and discharging processes of the floating–cycling cell. The lattice constant evolution during discharging, analyzed by the successive Rietveld analysis, indicates that the positive electrode material loss is insignificant and the raised internal resistance to limit the available capacity range is the main origin of capacity decrease. The ex situ SEM/EDX analysis of the aged electrode particles shows that the serious deterioration is due to the non-uniform resistive film formation during the floating operation accelerated by the crack formation during the cycling operation.The positive electrode film, so far recognized as cathode–electrolyte interphase, is usually thin and generally contributes little to the cell degradation. Accordingly, it is suggested that the resistive film found in this study can be originated from the negative electrode; the reductive film formed on the negative electrode during the floating operation can be peeled off from the surface during the cycling operation, and the dissolved species of the film can reach the positive electrode to be oxidized and form a highly resistive film. Further research on this cross-talk of the decomposition product can clarify the detailed mechanism of the cell impedance growth and cell management to extend the life of lithium-ion batteries.
Conflicts of interest
There are no conflicts to declare.Acknowledgements
This work was financially supported by NTT Facilities Inc. and partially by Feasibility Study Program Diagnosis of electric-vehicle battery based on its internal state analysis (project number P14004), NEDO, Japan. The neutron scattering experiments were approved by the Neutron Scattering Program Advisory Committee of IMSS, KEK (proposal no. 2018L0301). The authors acknowledge supports from Dr Naomi Inazu for SEM/EDX observation. The authors also acknowledge supports from Dr Sou Taminato for Rietveld refinement of multiple phases.References
- B. Diouf and R. Pode, Potential of lithium-ion batteries in renewable energy, Renewable Energy, 2015, 76, 375–380, DOI:10.1016/j.renene.2014.11.058.
- T. Iwahori, I. Mitsuishi, S. Shiraga, N. Nakajima, H. Momose, Y. Ozaki, S. Taniguchi, H. Awata, T. Ono and K. Takeuchi, Development of lithium ion and lithium polymer batteries for electric vehicle and home-use load leveling system application, Electrochim. Acta, 2000, 45, 1509–1512, DOI:10.1016/S0013-4686(99)00366-7.
- K. Richa, C. W. Babbitt, N. G. Nenadic and G. Gaustad, Environmental trade-offs across cascading lithium-ion battery life cycles, Int. J. Life Cycle Assess, 2017, 22, 66–81, DOI:10.1007/s11367-015-0942-3.
- N. Takami, H. Inagaki, Y. Tatebayashi, H. Saruwatari, K. Honda and S. Egusa, High-power and long-life lithium-ion batteries using lithium titanium oxide anode for automotive and stationary power applications, J. Power Sources, 2013, 244, 469–475, DOI:10.1016/j.jpowsour.2012.11.055.
- C. R. Birkl, M. R. Roberts, E. McTurk, P. G. Bruce and D. A. Howey, Degradation diagnostics for lithium ion cells, J. Power Sources, 2017, 341, 373–386, DOI:10.1016/j.jpowsour.2016.12.011.
- J. Vetter, P. Novák, M. R. Wagner, C. Veit, K. C. Möller, J. O. Besenhard, M. Winter, M. W. Mehrens, C. Vogler and A. Hammouche, Ageing mechanisms in lithium-ion batteries, J. Power Sources, 2005, 147, 269–281, DOI:10.1016/j.jpowsour.2005.01.006.
- M. Wohlfahrt-Mehrens, C. Vogler and J. Garche, Aging mechanisms of lithium cathode materials, J. Power Sources, 2004, 127, 58–64, DOI:10.1016/j.jpowsour.2003.09.034.
- T. Yoshida, M. Takahashi, S. Morikawa, C. Ihara, H. Katsukawa, T. Shiratsuchi and J. Yamaki, Degradation Mechanism and Life Prediction of Lithium-Ion Batteries, J. Electrochem. Soc., 2006, 153(3), A576–A582, DOI:10.1149/1.2162467.
- P. Verma, P. Maire and P. Novák, A review of the features and analyses of the solid electrolyte interphase in Li-ion batteries, Electrochim. Acta, 2010, 55, 6332–6341, DOI:10.1016/j.electacta.2010.05.072.
- K. Kleiner and H. Ehrenberg, Challenges Considering the Degradation of Cell Components in Commercial Lithium-Ion Cells: A Review and Evaluation of Present Systems, Top. Curr. Chem., 2017, 375, 1–45, DOI:10.1007/s41061-017-0139-2.
- C. Kupper, B. Weißhar, S. Rißmann and W. G. Bessler, End-of-Life Prediction of a Lithium-Ion Battery Cell Based on Mechanistic Aging Models of the Graphite Electrode, J. Electrochem. Soc., 2018, 165(14), A3468–A3480, DOI:10.1149/2.0941814jes.
- B. P. Matadi, S. Geniès, A. Delaille, T. Waldmann, M. Kasper, M. W. Mehrens, F. Aguesse, E. Bekaert, I. J. Gordon, L. Daniel, X. Fleury, M. Bardet, J. F. Martin and Y. Bultel, Effects of Biphenyl Polymerization on Lithium Deposition in Commercial Graphite/NMC Lithium-Ion Pouch-Cells during Calendar Aging at High Temperature, J. Electrochem. Soc., 2017, 164(6), A1089–A1097, DOI:10.1149/2.0631706jes.
- Z. Mao, M. Farkhondeh, M. Pritzker, M. Fowler and Z. Chen, Calendar Aging and Gas Generation in Commercial Graphite/NMC-LMO Lithium-Ion Pouch Cell, J. Electrochem. Soc., 2017, 164(14), A3469–A3483, DOI:10.1149/2.0241714jes.
- V. Agubra and J. Fergus, Lithium ion battery anode aging mechanisms, Materials, 2013, 6, 1310–1325, DOI:10.3390/ma6041310.
- M. Dollé, L. Sannier, B. Beaudoin, M. Trentin and J. M. Tarascon, Live scanning electron microscope observations of dendritic growth in lithium/polymer cells, Electrochem. Solid-State Lett., 2002, 5(12), A286–A289, DOI:10.1149/1.1519970.
- J. Li, J. Harlow, N. Stakheiko, N. Zhang, J. Paulsen and J. Dahn, Dependence of Cell Failure on Cut-Off Voltage Ranges and Observation of Kinetic Hindrance in LiNi0.8Co 0.15Al0.05O2, J. Electrochem. Soc., 2018, 165(11), A2682–A2695, DOI:10.1149/2.0491811jes.
- S. Watanabe, M. Kinoshita, T. Hosokawa, K. Morigaki and K. Nakura, Capacity fade of LiAlyNi1−x−yCoxO2 cathode for lithium-ion batteries during accelerated calendar and cycle life tests (surface analysis of LiAlyNi1−x−yCoxO2 cathode after cycle tests in restricted depth of discharge ranges), J. Power Sources, 2014, 258, 210–217, DOI:10.1016/j.jpowsour.2014.02.018.
- J. Wang, H. Kim, H. Hyun, S. Jo, J. Han, D. Ko, S. Seo, J. Kim, H. Kong and J. Lim, Probing and Resolving the Heterogeneous Degradation of Nickel-Rich Layered Oxide Cathodes across Multi-Length Scales, Small Methods, 2020, 4, 2000551, DOI:10.1002/smtd.202000551.
- T. Tsujikawa, K. Yabuta, T. Matsushita, M. Arakawa and K. Hayashi, A Study on the Cause of Deterioration in Float-Charged Lithium-Ion Batteries Using LiMn2O4 as a Cathode Active Material, J. Electrochem. Soc., 2011, 158(3), A322–325, DOI:10.1149/1.3543651.
- A. Barai, K. Uddin, M. Dubarry, L. Somerville, A. McGordon, P. Jennings and I. Bloom, A comparison of methodologies for the non-invasive characterisation of commercial Li-ion cells, Prog. Energy Combust. Sci., 2019, 72, 1–31, DOI:10.1016/j.pecs.2019.01.001.
- I. Bloom, A. N. Jansen, D. P. Abraham, J. Knuth, S. A. Jones, V. S. Battaglia and G. L. Henriksen, Differential voltage analyses of high-power, lithium-ion cells 1. Technique and application, J. Power Sources, 2005, 139, 295–303, DOI:10.1016/j.jpowsour.2004.07.021.
- K. Honkura and T. Horiba, Study of the deterioration mechanism of LiCoO2/graphite cells in charge/discharge cycles using the discharge curve analysis, J. Power Sources, 2014, 264, 140–146, DOI:10.1016/j.jpowsour.2014.04.036.
- F. Rosciano, M. Holzapfel, W. Scheifele and P. Novák, A novel electrochemical cell for in situ neutron diffraction studies of electrode materials for lithium-ion batteries research papers, J. Appl. Cryst., 2008, 41, 690–694, DOI:10.1107/S0021889808018025.
- H. Berg, H. Rundlöv and J. O. Thomas, The LiMn2O4 to λ-MnO2 phase transition studied by in situ neutron diffraction, Solid State Ionics, 2001, 144, 65–69, DOI:10.1016/S0167-2738(01)00894-3.
- A. Senyshyn, O. Dolotko, M. J. Mühlbauer, K. Nikolowski, H. Fuess and H. Ehrenberg, Lithium Intercalation into Graphitic Carbons Revisited: Experimental Evidence for Twisted Bilayer Behavior, J. Electrochem. Soc., 2013, 160, A3198–A3205, DOI:10.1149/2.031305jes.
- N. Sharma, V. K. Peterson, M. M. Elcombe, M. Avdeev, A. J. Studer, N. Blagojevic, R. Yusoff and N. Kamarulzaman, Structural changes in a commercial lithium-ion battery during electrochemical cycling: An in situ neutron diffraction study, J. Power Sources, 2010, 195, 8258–8266, DOI:10.1016/j.jpowsour.2010.06.114.
- D. Petz, V. Baran, C. Peschel, M. Winter, S. Nowak, M. Hofmann, R. Kostecki, R. Niewa, M. Bauer, P. M. Buschbaum and A. Senyshyn, Aging-Driven Composition and Distribution Changes of Electrolyte and Graphite Anode in 18650-Type Li-Ion Batteries, Adv. Energy Mater., 2022, 12, 2201652, DOI:10.1002/aenm.202201652.
- N. Paul, N. Paula, J. Keil, F. M. Kindermann, S. Schebesta, O. Dolotko, M. J. Mühlbauer, L. Kraft, S. V. Erhard, A. Jossen and R. Gilles, Aging in 18650-type Li-ion cells examined with neutron diffraction, electrochemical analysis and physico-chemical modeling, J. Energy Storage, 2018, 17, 383–394, DOI:10.1016/j.est.2018.03.016.
- A. Senyshyn, M. J. Mühlbauer, O. Dolotko and H. Ehrenberg, Low-temperature performance of Li-ion batteries: The behavior of lithiated graphite, J. Power Sources, 2015, 282, 235–240, DOI:10.1016/j.jpowsour.2015.02.008.
- W. K. Pang and V. K. Peterson, A custom battery for operando neutron powder diffraction studies of electrode structure, J. Appl. Crystallogr., 2015, 48(1), 280–290, DOI:10.1107/S1600576715000679.
- S. Taminato, M. Yonemura, S. Shiotani, T. Kamiyama, S. Torii, M. Nagao, Y. Ishikawa, K. Mori, T. Fukunaga, Y. Onodera, T. Naka, M. Morishima, Y. Ukyo, D. S. Adipranoto, H. Arai, Y. Uchimoto, Z. Ogumi, K. Suzuki, M. Hirayama and R. Kanno, Real-time observations of lithium battery reactions – Operando neutron diffraction analysis during practical operation, Sci. Rep., 2016, 6, 28843, DOI:10.1038/srep28843.
- S. Shiotani, T. Naka, M. Morishima, M. Yonemura, T. Kamiyama, Y. Ishikawa, Y. Ukyo, Y. Uchimoto and Z. Ogumi, Degradation analysis of 18650-type lithium-ion cells by operando neutron diffraction, J. Power Sources, 2016, 325, 404–409, DOI:10.1016/j.jpowsour.2016.06.026.
- X. Wu, B. Song, P. Chien, S. M. Everett, K. Zhao, J. Liu and Z. Du, Structural Evolution and Transition Dynamics in Lithium Ion Battery under Fast Charging: An Operando Neutron Diffraction Investigation, Adv. Sci., 2021, 8, 1–11, DOI:10.1002/advs.202102318.
- C. Wang, R. Wang, Z. Huang, M. Chu, W. Ji, Z. Chen, T. Zhang, J. Zhai, H. Lu, S. Deng, J. Chen, L. He, T. Liang, F. Wang, J. Wang, Y. Deng, W. Cai and Y. Xiao, Unveiling the migration behavior of lithium ions in NCM/Graphite full cell via in operando neutron diffraction, Energy Storage Mater., 2022, 44, 1–9, DOI:10.1016/j.ensm.2021.09.032.
- M. Yonemura, K. Mori, T. Kamiyama, T. Fukunaga, S. Torii, M. Nagao, Y. Ishikawa, Y. Onodera, D. S. Adipranoto, H. Arai, Y. Uchimoto and Z. Ogumi, Development of SPICA, new dedicated neutron powder diffractometer for battery studies, J. Phys. Conf. Ser., 2014, 502, 012053, DOI:10.1088/1742-6596/502/1/012053.
- R. Oishi, M. Yonemura, Y. Nishimaki, S. Torii, A. Hoshikawa, T. Ishigaki, T. Morishima, K. Mori and T. Kamiyama, Rietveld analysis software for J-PARC, Nucl. Instrum. Methods Phys. Res., Sect. A, 2009, 600, 94–96, DOI:10.1016/j.nima.2008.11.056.
- H. Xie, G. Hu, J. Duan, Z. Peng, Z. Zhang and Y. Cao, Synthesis of LiNi0.8Co0.15Al0.05O2 with 5-sulfosalicylic acid as a chelating agent and its electrochemical properties, J. Mater. Chem. A, 2015, 3, 20236–20243, 10.1039/c5ta05266a.
- F. B. Araoz, M. Varini, A. Lundblad, S. Cabrera and G. Lindbergh, Effect of Partial Cycling of NCA/Graphite Cylindrical Cells in Different SOC Intervals, J. Electrochem. Soc., 2020, 167, 040529, DOI:10.1149/1945-7111/ab78fd.
- G. Nagasubramanian, Two- and three-electrode impedance studied on 18650 Li-ion cells, J. Power Sources, 2000, 87, 226–229, DOI:10.1016/j.coelec.2021.100917.
- D. Juarez-Robles, C. F. Chen, Y. Barsukov and P. P. Mukherjee, Impedance Evolution Characteristics in Lithium-Ion Batteries, J. Electrochem. Soc., 2017, 164, A837–A847, DOI:10.1149/2.1251704jes.
- N. Togasaki, T. Yokoshima, Y. Oguma and T. Osaka, Prediction of overcharge-induced serious capacity fading in nickel cobalt aluminum oxide lithium-ion batteries using electrochemical impedance spectroscopy, J. Power Sources, 2020, 461, 228168, DOI:10.1016/j.jpowsour.2020.228168.
- T. P. Heins, N. Harms, L. S. Schramm and U. Schrçder, Development of a new Electrochemical Impedance Spectroscopy Approach for Monitoring the Solid Electrolyte Interphase Formation, Energy Technol., 2016, 4, 1509–1513, DOI:10.1002/ente.201600132.
- V. J. Ovejas and A. Cuadras, Impedance Characterization of an LCO-NMC/Graphite Cell: Ohmic Conduction, SEI Transport and Charge-Transfer Phenomenon Victoria, Batteries, 2018, 4(3), 43, DOI:10.3390/batteries4030043.
- I. A. Bobrikov, N. Y. Samoylov, S. V. Sumnikov, O. Y. Ivanshina, R. N. Vasin, A. I. Beskrovnyi and A. M. Balagurov, In situ time-of-flight neutron diffraction study of the structure evolution of cathode, J. Power Sources, 2018, 372, 74–81, DOI:10.1016/j.jpowsour.2017.10.052.
- Y. Yamamoto, M. Ohtsuka, Y. Azuma, T. Takahashi and S. Muto, Cation mixing in LiNi0.8Co0.15Al0.05O2 positive electrode material studied using high angular resolution electron channeling X-ray spectroscopy, J. Power Sources, 2018, 401, 263–270, DOI:10.1016/j.jpowsour.2018.08.100.
- H. Ryu, G. Park, C. S. Yoon and Y. Sun, Microstructural Degradation of Ni-Rich LiNixCoyMn1−x−yO2 Cathodes During Accelerated Calendar Aging, Small, 2018, 14(45), 1803179, DOI:10.1002/smll.201803179.
- O. C. Harris, S. E. Lee, C. Lees and M. Tang, Review: mechanisms and consequences of chemical cross-talk in advanced Li-ion batteries, J. Phys Energy, 2020, 2, 032002, DOI:10.1088/2515-7655/ab8b68.
- R. Sahore, F. Dogan and I. D. Bloom, Identification of Electrolyte-Soluble Organic Cross-Talk Species in a Lithium-Ion Battery via a Two-Compartment Cell, Chem. Mater., 2019, 31, 2884–2891, DOI:10.1021/acs.chemmater.9b00063.
- S. Fang, D. Jackson, M. L. Dreibelbis, T. F. Kuech and R. J. Hamers, Anode-originated SEI migration contributes to formation of cathode–electrolyte interphase layer, J. Power Sources, 2018, 373, 184–192, DOI:10.1016/j.jpowsour.2017.09.050.
- Y. Huang, The discovery of cathode materials for lithium-ion batteries from the view of interdisciplinarity, Interdiscip. Mater., 2022, 1(3), 323–329, DOI:10.1002/idm2.12048.
- J. Yan, H. Huang, J. Tong, W. Li, X. Liu, H. Zhang, H. Huang and W. Zhou, Recent progress on the modification of high nickel content NCM: Coating, doping, and single crystallization, Interdiscip. Mater., 2022, 1(3), 330–353, DOI:10.1002/idm2.12043.
Footnotes |
| † Electronic supplementary information (ESI) available. See DOI: https://doi.org/10.1039/d3ya00557g |
| ‡ Present address: China Spallation Neutron Source, Institute of High Energy Physics, Chinese Academy of Sciences. |
| § Present address: Spallation Neutron Source Science Center, 1 Zhongziyuan Road, Dalang, Dongguan, Guangdong 523803, China. |
| This journal is © The Royal Society of Chemistry 2024 |

