 Open Access Article
Creative Commons Attribution 3.0 Unported Licence
A highly stable Pr2NiO4+δ oxygen electrode in electrolyte supported protonic ceramic electrolysis cells (PCECs) for hydrogen production with high faradaic efficiency
Leon
Schley
 ab,
Vaibhav
Vibhu
 *a,
Lucy
Nohl
 a,
Izaak C.
Vinke
 a,
L. G. J. (Bert)
de Haart
 a and
Rüdiger-A.
Eichel
 ab
ab
aInstitute of Energy and Climate Research, Fundamental Electrochemistry (IEK-9), Forschungszentrum Jülich GmbH, 52425 Jülich, Germany. E-mail: v.vibhu@fz-juelich.de
bInstitute of Physical Chemistry, RWTH Aachen University, 52074 Aachen, Germany
First published on 4th March 2024
Abstract
Protonic ceramic electrolysis cells are a promising technology for hydrogen production. However, parasitic electronic leakage in the ceramic electrolyte materials has detrimental effects on the faradaic efficiency and hence lowers overall efficiencies. Furthermore, the sluggish kinetics of the oxygen evolution reaction requires the development of efficient oxygen electrodes with high activity and durability at high steam contents. In this study, BaCe0.7Zr0.1Y0.1Yb0.1O3−δ (BCZYYb7111) electrolyte supported single cells were fabricated and the electronic and ionic transport numbers in the electrolyte support were determined in dependence on the operating conditions. It was shown that the electronic leakage and thus the faradaic efficiency strongly depends on the operating temperature, steam partial pressure, oxygen partial pressure and current density. Optimal operating conditions were derived and faradaic efficiencies of ∼95% were achieved at 600 °C and 20% H2O. Furthermore, the comparison of Pr2NiO4+δ (PNO) and Ba0.5Sr0.5Co0.8Fe0.2O3−δ (BSCF) as oxygen electrodes, showed higher current densities in electrolysis and fuel cell mode and lower polarization resistances (Rp) for PNO at intermediate temperatures between 600 to 700 °C. In the end, long-term measurements of the PNO/BCZYYb/Ni-BZY single cells in electrolysis mode showed stable behavior over 590 h.
1. Introduction
Hydrogen production from steam electrolysis will play a key role in the near future to overcome the rapidly growing hydrogen demand in industry and to store the increasing amount of electric power from intermittent energy sources (e.g. wind and solar). While steam electrolysis technologies based on proton exchange membrane (PEM), alkaline (AE) and solid oxide electrolysis cell (SOEC) systems are already about to reach the pre-industrial scale, protonic ceramic electrolysis cells (PCECs) only exist on the laboratory scale so far. However, PCECs are sometimes referred to as next-generation steam electrolyzers, due to their high durability, high efficiency, and low-cost materials.1,2The three main components in PCECs are a porous oxygen electrode (or steam splitting electrode), a dense proton conducting electrolyte and a porous fuel electrode. At the oxygen electrode, the oxygen evolution reaction (OER) takes place:
| OER: H2O ↔ 0.5O2 + 2H+ + 2e− | (1) |
| HER: 2H+ + 2e− ↔ H2 | (2) |
Typically, in PCECs Y-doped BaCeO3, BaZrO3 or BaCeO3–BaZrO3 solid solutions are used as electrolyte materials.6 Here, ceria-rich electrolyte materials favor high proton conductivity, due to the high basicity/low electronegativity of ceria. However, in steam containing atmospheres or acidic gases like CO2, high ceria contents facilitate the decomposition of BaCeO3 into BaCO3 and CeO2 or Ba(OH)2.1,6 On the contrary, zirconia-rich electrolyte materials are more stable at high steam partial pressures but suffer from low sinterability.1 Thus, high sintering temperatures are required for zirconia-rich electrolytes. This results in a trade-off between high proton conductivity and better sinterability of ceria rich electrolyte materials and higher stability of zirconia rich electrolyte materials.1 In 2009, it was shown that BaCeO3–BaZrO3 solid solutions can be stabilized by Y and Yb co-doping, allowing high ceria contents with high proton conductivity and sufficient stability against H2O and CO2.7 Within the tested compositions of BaCe0.7Zr0.1Y0.2−xYbxO3−δ (x = 0–0.2) a peak conductivity was obtained for BaCe0.7Zr0.1Y1Yb1O3−δ (BCZYYb7111). Nowadays, the proposed composition of BCZYYb7111 is one of the most studied electrolyte materials and promising results were obtained in PCFC and PCEC applications.7–13 However, in recent studies severe concerns about the chemical stability of BCZYYb7111 in H2O or CO2 rich atmospheres were raised.14–17 Higher zirconium contents (>30–40 mol% of zirconium) were proposed to be necessary to achieve sufficient stability under these conditions. BaCe0.4Zr0.4Y0.1Yb0.1O3−δ (BCZYYb4411)15,18–20 or BaCe0.5Zr0.3Y0.1Yb0.1O3−δ (BCZYYb5311)21 could be more promising candidates, due to their higher stability compared to BCZYYb7111. However, the higher zirconium contents also leads to a decreased proton conductivity resulting in reduced performance of PCECs.21 A direct comparison of the different electrolyte compositions in real fuel cell or electrolysis applications is scarce and would be highly valuable for the development of effective proton conducting cells.
Protonic conducting ceramics are often mixed ionic electronic conductors (MIECs) and possess ionic and electronic conductivity. In PCECs, the partial electronic conductivity of the electrolyte leads to parasitic electronic leakage and lowers the faradaic efficiency.10 The electronic conductivity can be mainly attributed to p-type electronic conductivity near the oxidizing atmosphere of the oxygen electrode and n-type electronic conductivity near the reducing atmosphere of the hydrogen electrode.22–24 Especially, p-type electronic conductivity becomes crucial under electrolysis mode operation, where the concentration profile of electronic charge carriers is dominated by the anodic overpotentials of the oxygen electrode.10 To overcome this issue electrolyte materials with low electronic conductivity need to be developed.10 Furthermore, the operating conditions (steam partial pressure, oxygen partial pressure, temperature and current density) can be tailored to increase the faradaic efficiencies.25–28 In general, high steam partial pressures, low oxygen partial pressures and low temperatures tend to decrease the concentration of electronic holes and to increase the concentration of protonic defects resulting in increased faradaic efficiencies.25–28 Regarding the effect of current density on the faradaic efficiency some contradictory results were published. Some studies report on decreasing faradaic efficiencies with increasing current density, since the increasing anodic overpotentials tend to increase the formation of electronic holes in the electrolyte, resulting in increased p-type conductivity and low faradaic efficiencies.19,29–31 Other studies report on an increasing faradaic efficiency with increasing current density, where a net hydrogen loss close to the open circuit voltage (OCV) is assumed resulting in a minimum faradaic efficiency at OCV. With increasing hydrogen production at higher current densities, the hydrogen loss is mitigated, resulting in increasing faradaic efficiencies with increasing current densities.10,18 In addition to electrolyte composition and operating conditions, also the electrolyte thickness could influence the ionic and electronic transport properties in the electrolyte. Here, increasing the electrolyte thickness could mitigate the influence of anodic overpotentials on the formation of electronic holes in the electrolyte resulting in increased faradaic efficiencies.25,32 However, only a few studies report on the effect of electrolyte thickness on faradaic efficiency and further evaluation is necessary.
Another major challenge in PCECs is the development of effective oxygen electrode materials.11 Since, protons (H+), electrons (e−) and steam (H2O) are involved in the oxygen evolution reaction, the oxygen electrode should possess high conductivity towards these two charge carriers (H+, e−) and allow for the gas phase transport of steam and oxygen. Furthermore, active sites in the oxygen electrode material are required to catalyze the reaction.2,11,33 Until now, a few promising oxygen electrode materials were identified, which can be classified into simple perovskites (ABO3−δ), double perovskites (AA′B2O6−δ) and Ruddlesden–Popper phases (A2BO4+δ). Promising results were obtained with simple perovskites such as Ba0.5Sr0.5Co0.8Fe0.2O3−δ (BSCF),34,35 BaCo0.4Fe0.4Zr0.1Y0.1O3−δ (BCFZY)10,36 or PrNi0.5Co0.5O3−δ (PNC)20,37 and double perovskites such as PrBa0.5Sr0.5Co1.5Fe0.5O6−δ (PBSCF)15,18,38 or Ba0.5Gd0.8La0.7Co2O6−δ (BGLC),29,31 which show low polarization resistances and high activity towards the OER. Lately, Ruddlesden–Popper nickelates such as Pr2NiO4+δ (PNO)39,40 and derivatives13,41 were shown to exhibit protonic and electronic conductivity and were proposed as effective oxygen electrode materials for protonic ceramic cells. The structure of Pr2NiO4+δ can be described as alternate layers of PrO rock-salt and NiO6 octahedra layers.42 The characteristic feature of these oxides is that they can accommodate interstitial oxygens in the PrO layers leading to a mixed valence of nickel (Ni2+/Ni3+) and hence to a mixed conductivity. At intermediate temperatures (500–600 °C), PNO shows even better electrochemical performance than the promising oxygen electrode BSCF.40,43
Finally, high durability of cell components is required, to facilitate the commercialization of PCEC systems. Especially, phase instability of electrolyte and oxygen electrodes at high steam partial pressures could lead to accelerated cell degradation.9 Furthermore, thermo-mechanical incompatibility between electrolyte and oxygen electrode materials could lead to stress formation during temperature variations and subsequently to delamination at the electrolyte/electrode interface.9 Here, similar thermal expansion coefficients (TECs) of the cell components could prevent severe cell degradation. In this respect, PNO could be more suited compared to other electrode materials since the TEC of PNO (∼13.2 × 10⁻⁶) is close to the TEC of BCZY electrolytes (8–12 × 10−6).9,11 In contrast, BSCF, PBSCF and BCFZY exhibit relatively higher TECs of 23.2 × 10⁻⁶ K−1, 23.7 × 10⁻⁶ K−1 and 21.6 × 10⁻⁶ K−1. However, long-term measurements are scarce and only a few studies report on the durability of PCECs over 500 h.10,18 Promising results were obtained with BCFZY as oxygen electrode, which showed stable electrolysis mode operation at a current density of 1.385 A cm−2 over 1200 h at 550 °C and 10% steam partial pressure with a small degradation rate of only 30 mV per 1000 hours.10 However, a slight phase instability of BCFZY and an increase of the polarization resistance after long-term operation was observed, which became more severe at higher steam partial pressures.10 Also, the promising oxygen electrode BGLC showed a significant degradation after subjecting it for 65 h to 1.5 bar H2O and 600 °C.31 The degradation of BGLC was attributed to secondary phase formation identified as BaCoO3.31
In this study, three of the main challenges in PCECs were investigated. Firstly, electrolyte supported single cells with PNO or BSCF oxygen electrodes were fabricated and the electrochemical performance of PNO and BSCF was compared in electrolysis and fuel cell mode. Secondly, the electronic leakage in the BCZYYb7111 electrolyte material was determined in dependence of the operating conditions (temperature, steam partial pressure and current density). Thirdly, long-term measurements with PNO/BCZYYb/Ni-BZY single cells were performed in electrolysis mode to determine the durability of the cell components.
2. Experimental
2.1. Cell fabrication
2.2. XRD and microstructural analysis
The phase purity of as sintered BCZYYb7111 electrolyte powder was analyzed by X-ray diffraction (XRD) using a PANanalytical X’pert MPD diffractometer with Cu-Kα incident radiation. The single cell microstructure was analyzed with Quanta FEG 650 (FEI©) scanning electron microscope (SEM) equipped with an EDS detector at 20 kV.2.3. Electrochemical characterization
The single cells were electrochemically characterized with a two-electrode (four-wire) NorECs Probostat (Norwegian Electro Cermacis®, NORECS, Oslo, Norway) setup. A gold current collector at the air side and a Pt–Ni current collector at the fuel side were used for electrode contacting. A gold ring was used for sealing. The respective gas flow was controlled by mass flow controllers (El-Flow®, Bronkhorst Nord, Kamen, Germany).After mounting the single cell in the measurement set-up, it was heated up from room temperature to 900 °C for 2 h and cooled down to 700 °C with a heating and cooling rate of 1 °C min−1 using 9 Nl h−1 of N2 at the fuel and 9 Nl h−1 of air at the oxygen electrode side. At 700 °C NiO at the fuel electrode was reduced to Ni by stepwise increasing the hydrogen flow rate from 1–9 Nl h−1 and lowering the nitrogen flow rate.48
After the reduction the first electrochemical measurements were performed in fuel cell mode with dry air at the oxygen electrode and dry hydrogen at the fuel electrode to check the quality of the cell mounting. The iV curves and impedance measurements were performed at 700, 675, 650, 625 and 600 °C. The iV curves were recorded using a scan rate of 10 mV s−1 starting from OCV to 0.4 V and back to OCV. Impedance measurements were recorded at OCV under potentiostatic control with a 20 mV ac amplitude, in a frequency range of 0.11 Hz to 110 kHz with 21 data points per frequency decade.
After operation in fuel cell mode, electrochemical measurements were performed in reversible mode with wet air (3, 10, 20 and 30% H2O) at the oxygen electrode and dry hydrogen at the fuel electrode. The iV curves and impedance measurements were performed at 700, 675, 650, 625 and 600 °C at each steam partial pressure. The iV curves were recorded using a scan rate of 10 mV s−1 starting from OCV to 1.5 V to 0.4 V and back to OCV. Impedance measurements were recorded similarly to the fuel cell mode described above.
Long-term measurements in electrolysis mode were recorded galvanostatically by applying an electrolysis current density of −100 mA cm−2 and measuring the voltage for 590 h. The temperature was set to 700 °C and wet air (10% H2O) was used at the oxygen electrode and dry hydrogen at the fuel electrode.
3. Results and discussion
3.1. Structural and microstructural analysis
Fig. 1(a) shows the X-ray diffractogram of as sintered BCZYYb7111 electrolyte powder, sintered at 1400 °C for 8 h. A pure BCZYYb7111 phase was obtained after sintering and no secondary phases can be observed. Fig. 1(b) shows the cross-section images of a fractured BCZYYb7111 electrolyte support sintered at 1400 for 8 h. The BCZYYb7111 electrolyte has a dense and gas tight structure with a large grain size of ≥7 μm. In other electrolyte materials with a higher Zr-content, for example, BZCY541, smaller grain sizes of only ∼2 μm were achieved.29 This could be explained by the lower sinter-ability of Zr-rich electrolyte materials, leading to smaller grain sizes.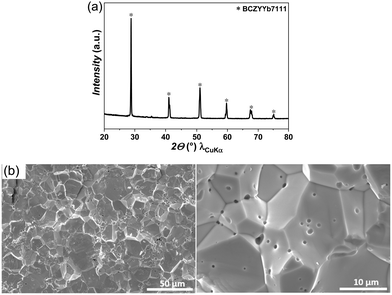 | ||
| Fig. 1 (a) XRD pattern of as-sintered BCZYYb7111 electrolyte powder, and (b) cross-sectional SEM images of BCZYYb7111 electrolyte support, sintered at 1400 °C for 8 h. | ||
3.2. Electrochemical characterization of single cells
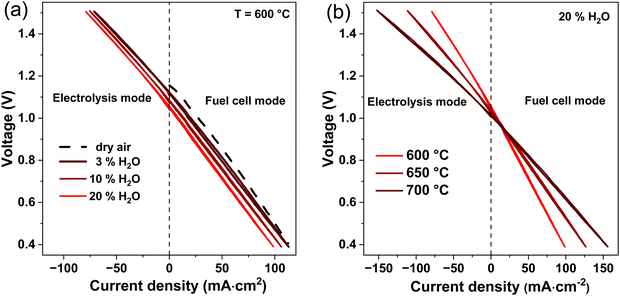
In fuel cell mode, the cell performance decreases with increasing steam partial pressure at the oxygen electrode. Highest fuel cell performance was obtained with dry air. The decreasing performance in fuel cell mode with increasing steam pressures can be attributed to the lower OCV values and the impeded steam removal from the oxygen electrode at increased steam contents. Furthermore, the iV curves in Fig. 3 shows that PNO/BCZYYb/Ni-BZY single cells can be easily operated in fuel cell and electrolysis reversible mode without changing gas compositions or cell configuration. Fig. 3(b) shows the temperature dependency of the iV curves at 20% H2O between 700 and 600 °C. An increase in current density with increasing temperature is observed. For instance, at 1.5 V electrolysis current densities of −79, −112 and −152 mA cm−2 were achieved at 600, 650 and 700 °C, respectively. Because of the relatively low current densities and high ohmic resistances of our electrolyte supported cells compared to fuel electrode supported cells,10 only temperatures above 600 °C were used in this study.
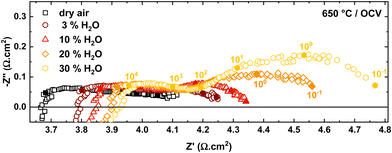 | ||
| Fig. 4 Nyquist plots of PNO/BCZYYb/Ni-BZY single cells at 650 °C with wet air (0–30% H2O) at the oxygen electrode and dry hydrogen at the fuel electrode. | ||
The increasing ohmic and polarization resistance with increasing steam partial pressure could be explained by the decreasing electronic conductivity in the electrolyte and the oxygen electrode with higher steam partial pressures.6,13 In simple perovskite materials, such as BCZYYb, protonic defects are formed at the expense of oxygen vacancies or electron holes according to the following equations in Kröger–Vink notation:6
 | (3) |
 | (4) |
 are oxygen vacancies,
  are oxygen ions on regular oxygen-sites, h˙ are electron holes and
  are protonic defects.
Contrarily, in Ruddlesden–Popper phases, such as PNO, protonic defects are rather formed at interstitial sites.13,39 Possible reaction mechanisms are as follows:13,51
 | (5) |
 | (6) |
 are oxygen interstitials and
  are hydroxide interstitials. As can be seen from eqn (4) and (6) high steam partial pressures lead to a decreasing concentration of electronic charge carriers (h˙) in the electrolyte and oxygen electrode. Thus, a lower electronic conductivity in the electrolyte and electrode could be obtained at higher steam partial pressures leading to increased ohmic and polarization resistances.
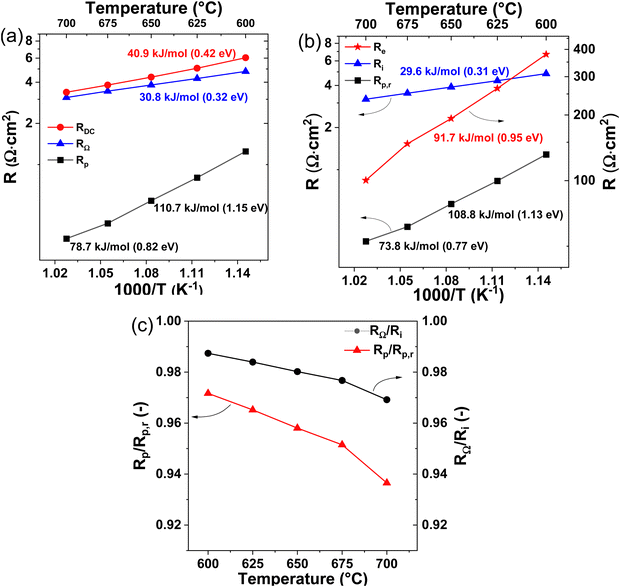
The influence of operating temperature on the impedance data is shown in Fig. 5. Both RΩ and Rp decrease with increasing temperature. While RΩ decreases from 4.79 to 3.09 Ω cm2, Rp decreases from 1.25 to 0.29 Ω cm2, when the temperature is increased from 600 to 700 °C. The decreasing resistances with increasing temperature can be explained by the different temperature activated processes at the electrode/electrolyte interfaces and in the electrolyte.
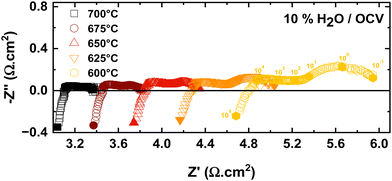 | ||
| Fig. 5 Nyquist plots of PNO/BCZYYb/Ni-BZY single cells at 10% steam partial pressure at the oxygen electrode with varying temperatures. | ||
In order to further distinguish between ionic and electronic resistances, an equivalent circuit shown in Fig. 6(a) was used, where Re and Ri are the electronic and ionic resistances in the electrolyte, Rp,r is the real polarization resistance of the electrode and VN is the Nernst-potential.
 | ||
| Fig. 6 Equivalent circuit for PCECs with mixed ionic electronic conducting electrolyte, (b) schematic illustration of proton ceramic cells (PCCs) in electrolysis mode. | ||
At high frequencies, the capacitors are short circuited and the measured apparent ohmic resistance (RΩ) from impedance analysis contains contributions of Re and Ri, according to:18,29
 | (7) |
 | (8) |
 | (9) |
 | (10) |
 | (11) |
 | (12) |
Fig. 7(a) and (b) show the Arrhenius plots for the measured resistances RΩ, Rp, RDC and calculated resistances Ri, Rp,r, Re. The corresponding activation energies are also indicated. The activation energy for Ri (0.31 eV) is slightly lower than the activation energy for RΩ (0.32 eV) and is in good agreement with the activation energy for proton conduction (0.3–0.5 eV) in protonic ceramic electrolytes.1,6 Similarly, the activation energy for Rp,r is slightly lower than for Rp and decreases from, 1.13 eV to 0.77 eV with increasing temperature. These values match well with data from literature, where also a PNO oxygen electrode was used.39 Furthermore, Fig. 7(b) shows the electronic resistance of the electrolyte (Re) in dependence of the temperature. With increasing temperature Re decreases from 380 to 100 Ω cm2. The decreasing Re values indicate that p-type conductivity in the electrolyte increases with increasing temperatures. This can be explained by the exothermic character of the hydration reaction, see eqn (3).6 While decreased temperatures favor the formation of protonic defects, increased temperatures favor the formation of electronic charge carriers and thus electronic conductivity. Furthermore, the activation energy for Re (0.95 eV) is higher than for Ri (0.31 eV), which means that the electronic conductivity increases more rapidly with increasing temperature than the ionic conductivity in the electrolyte. Thus, high temperatures favor parasitic electronic leakage in PCECs.
Fig. 7(c) shows the ratio between apparent polarization resistance and real polarization resistance (Rp/Rp,r) and apparent ohmic resistance and real ionic resistance (RΩ/Ri). The electronic conductivity in the electrolyte leads to a deviation between measured and real values. With increasing temperature from 600 to 700 °C, Rp/Rp,r decreases from 0.97 to 0.94 and RΩ/Ri decreases from 0.99 to 0.97. Both Rp/Rp,r and RΩ/Ri, exhibit values lower than 1, meaning that Rp,r and Ri would be underestimated by using an equivalent circuit without a parallel resistor for the electronic conductivity of the electrolyte (Re). The decreasing values for Rp/Rp,r and RΩ/Ri with temperature can be explained by the decreasing ionic transport numbers with increasing temperatures.
Determining the electronic leakage/faradaic efficiency in PCECs is challenging. One way to determine the faradaic efficiency is by measuring the hydrogen concentration at the cell outlet. However, since hydrogen is often also introduced at the cell inlet it is difficult to distinguish between produced hydrogen and introduced hydrogen, especially in the low current region. Therefore, in this study the faradaic efficiency is calculated from OCV measurements and impedance analysis.
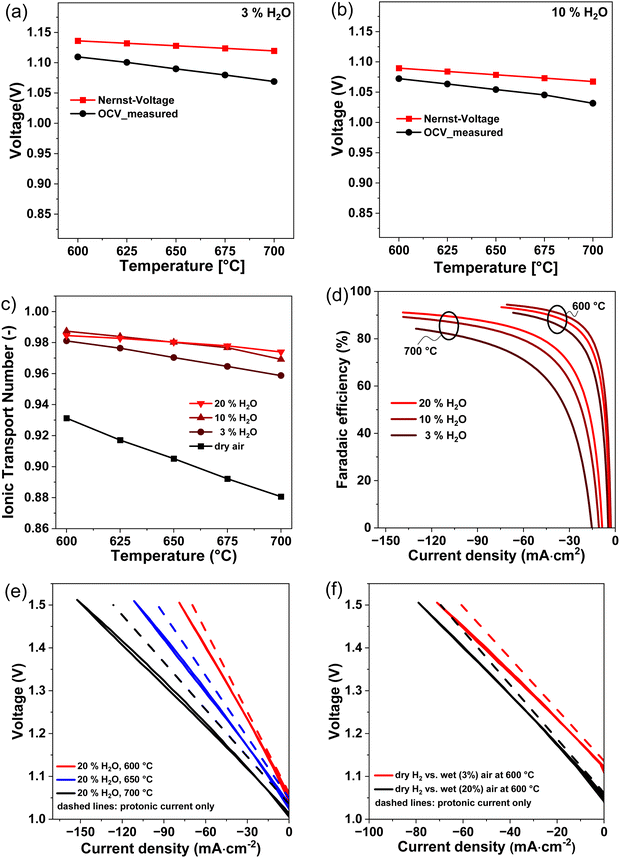
The gap between measured open circuit voltage (VOCV) and theoretical Nernst-potential (VN) is an indicator for electronic leakage in PCCs. Fig. 8(a) and (b) show the measured voltages at OCV (VOCV) and the theoretical Nernst-potentials (VN) at 3% and 10% steam partial pressure on the oxygen electrode in dependence of the temperature. At 3% H2O, the gap between VOCV and VN increases from 26.4 mV (2.3%) at 600 °C to 50.6 mV (4.7%) at 700 °C. The increasing deviation between VOCV and VN is a sign of increasing parasitic electronic leakage at higher temperatures. At 10% H2O, the gap between VOCV and VN increases from 17.3 mV (1.6%) at 600 °C to 35.9 mV (3.5%) at 700 °C. The deviation at 10% H2O is smaller compared to the deviation at 3% H2O. This is an indication that the parasitic electronic leakage decreases at higher steam partial pressures.
Often, in literature, the ionic transport number eqn (10) is used to determine the contribution of ionic and electronic conductivity in electrolyte materials. In pure ionic conductors, the value for the electronic resistance is infinite and the ionic transport number is equal to 1. In contrast, the ionic transport number for a mixed ionic electronic conductor is between 0 and 1.
In Fig. 8(c) the ionic transport number of the BCZYYb7111 electrolyte is plotted as a function of temperature. At 10% H2O, the ionic transport number decreases from 0.99 at 600 °C to 0.97 at 700 °C. The relatively high values for ti indicate a large contribution from ionic conductivity and that BCZYYb7111 is nearly a pure ionic conductor under these conditions. Other electrolyte materials, such as BCZYYb4411, only reach ionic transport numbers of 0.95 at 600 °C.18 This shows that BCZYYb7111 is a good electrolyte material for PCCs and exhibits low electronic leakage. In addition to temperature dependency, Fig. 8(c) also shows the steam partial pressure dependency of the ionic transport number. At 650 °C the ionic transport number increases from 0.91 to 0.97 by changing from dry conditions to 3% H2O at the oxygen electrode. However, by further increasing the steam partial pressure, the ionic transport number increases only slightly to 0.98 at 10% H2O. A further increase in steam partial pressures has nearly no impact on the ionic transport number. This indicates that the ionic conductivity was almost saturated at 10% H2O. Our results clearly show that parasitic electronic leakage in PCECs can be mitigated by using temperatures below 600 °C and steam partial pressures above 10% H2O.
The faradaic efficiency was determined by calculating the protonic current in the electrolyte and dividing it by the measured current in the outer circuit according to:
 | (13) |
 | (14) |
 | (15) |
Fig. 8(d) shows the calculated faradaic efficiency in dependence of the current density. The faradaic efficiency increases with increasing current density. For instance, at 600 °C and an electrolysis current density of −60 mA cm−2, a faradaic efficiency of 90.4%, 93.8% and 92.3% were achieved at 3, 10 and 20% steam partial pressures, respectively. These are among the highest values ever reported. In other studies faradaic efficiencies of only ∼50% were reported for a BGLC/BZCY/Ni-BZCY cell configuration at 600 °C, 1.5 bar steam and – 100 mA cm−2 electrolysis current density.31 One reason for the comparably high faradaic efficiency in our electrolyte supported cell could be that the relatively thick electrolyte mitigates the influence of anodic overpotentials on the formation of electron holes in the electrolyte.10 With an increasing distance from the anodic overpotentials at the oxygen electrode, lower concentrations of electron holes are obtained.10,25 Thus, increasing the electrolyte thickness could decrease p-type conductivity in the electrolyte and mitigate parasitic electronic leakage. In contrast, decreasing the electrolyte thickness leads to decreased ohmic losses. This trade-off clearly shows that optimizing the electrolyte thickness is important to obtain high current densities and high faradaic efficiencies simultaneously.
At 700 °C and −130 mA cm−2 electrolysis current density, faradaic efficiencies of 84.3%, 88.8% and 90.7% were achieved at 3, 10 and 20% steam partial pressures, respectively. It is evident that the faradaic efficiency increases with decreasing temperatures and increasing steam partial pressures.
In electrolysis cells with a faradaic efficiency lower than 100%, the iV curves have to be corrected, considering that not all electrons measured in the outer circuit contribute to the hydrogen evolution reaction. The protonic current (IH+) that contributes to the HER is smaller than the measured current (Imeas) in the outer circuit. Fig. 8(e) and (f) show the measured iV curves in electrolysis mode and the corrected iV curves with the protonic current only. The deviation between protonic current (IH+) contributing to the HER and measured electronic current (Imeas) determines the electronic leakage (Ie = Imeas − IH+). At a fixed steam partial pressure of 20% H2O and at 1.3 V the electronic leakage decreases from 14.6 mA cm−2 to 7.7 mA cm−2 to 5.7 mA cm−2 by lowering the temperature from 700 °C to 650 °C to 600 °C (Fig. 8(e)). This indicates smaller parasitic electronic leakage at lower temperatures. At a fixed temperature of 600 °C and at 1.3 V the electronic leakage decreases from 4.5 mA cm−2 to 4.1 mA cm−2 by increasing the steam partial pressure from 3% to 20% H2O. This indicates smaller parasitic electronic leakage at higher steam partial pressures.
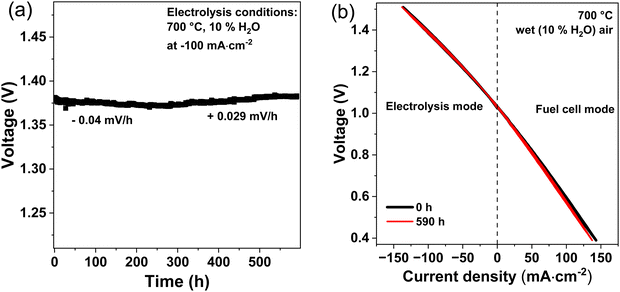
After 590 h of operation, an iV curve was recorded again and compared with the curve recorded at the start of the degradation test. Fig. 9(b) shows the iV curves before and after the degradation test, whereby remarkably nearly no difference is observed.
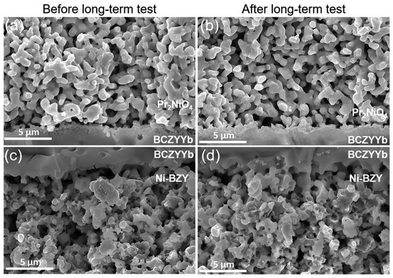
No structural deterioration of the cell layers or delamination of the electrodes from the electrolyte is observed (Fig. 10). The electrolyte still shows a dense structure, while both the fuel and oxygen electrode show sufficient porosity for gas transport. However, a very thin interfacial layer can be observed between the oxygen electrode and the electrolyte. This interfacial layer between PNO and proton ceramic electrolytes was already observed in other studies. It forms during sintering of PNO on BCZY electrolytes at high temperatures (>1150 °C).43 However, the interfacial layer is not expected to have any detrimental effects on cell performance.43
4. Conclusion
In this study electrolyte supported proton ceramic electrolysis cells (PCECs) were successfully fabricated via the solid state reactive sintering method. The ceria rich BCZYYb7111 electrolyte support showed high proton conductivity and low ohmic resistances related to the high electrolyte thickness of 850 μm. For example, BCZYYb7111 (5 mΩ cm2 μm−1) exhibits a 6 times lower specific ohmic resistance than BZCY541 (30 mΩ cm2 μm−1).29 Moreover, high ionic transport numbers of 0.99 at 600 °C and 10% H2O were achieved, indicating that the electrolyte is gas tight and is a nearly pure ionic conductor. At an electrolysis current density of −75 mA cm−2 a high faradaic efficiency of 94% was calculated at 600 °C and 10% H2O. These faradaic efficiencies are among the highest ever reported. For comparison, electrode supported BGLC/BCZY/Ni-BCZY single cells only reach faradaic efficiencies of ∼50% at 600 °C, 1.5 bar steam and −100 mA cm−2.31The comparison of Pr2NiO4+δ (PNO) and Ba0.5Sr0.5Co0.8Fe0.2O3−δ (BSCF) as oxygen electrode showed higher performance for PNO in both electrolysis and fuel cell mode. At 600 °C, the polarization resistance (Rp) increased from 1.25 Ω cm2 for a cell with PNO as oxygen electrode to 2.61 Ω cm2 for a cell with BSCF as oxygen electrode. Long-term measurements of PNO/BCZYYb7111/Ni-BZY91 single cells in electrolysis mode up to 590 h showed stable operation with a small degradation rate of 0.029 mV h−1 over the last 340 h. Post-test characterization using SEM showed no deterioration in the electrode, electrolyte and electrode/electrolyte interface.
Conflicts of interest
There are no conflicts to declare.Acknowledgements
The Helmholtz Association of German Research Centers (HGF) and the Federal Ministry of Education and Research (BMBF), Germany are gratefully acknowledged for their support within the frame of the Innovation Pool project “Solar H2: Highly Pure and Compressed” and the Helmholtz Research Program “Materials and Technologies for the Energy Transition” (MTET).References
- E. Fabbri, L. Bi, D. Pergolesi and E. Traversa, Towards the Next Generation of Solid Oxide Fuel Cells Operating Below 600 °C with Chemically Stable Proton-Conducting Electrolytes, Adv. Mater., 2012, 24, 195–208 CrossRef CAS PubMed.
- Q. Wang, S. Ricote and M. Chen, Oxygen electrodes for protonic ceramic cells, Electrochim. Acta, 2023, 446, 142101 CrossRef CAS.
- L. Bi, S. Boulfrad and E. Traversa, Steam electrolysis by solid oxide electrolysis cells (SOECs) with proton-conducting oxides, Chem. Soc. Rev., 2014, 43, 8255–8270 RSC.
- E. Fabbri, D. Pergolesi and E. Traversa, Materials challenges toward proton-conducting oxide fuel cells: a critical review, Chem. Soc. Rev., 2010, 39, 4355–4369 RSC.
- W. Zhang and Y. H. Hu, Progress in proton-conducting oxides as electrolytes for low-temperature solid oxide fuel cells: From materials to devices, Energy Sci. Eng., 2021, 9, 984–1011 CrossRef CAS.
- K. D. Kreuer, Proton-Conducting Oxides, Annu. Rev. Mater. Res., 2003, 33, 333–359 CrossRef CAS.
- L. Yang, S. Wang, K. Blinn, M. Liu, Z. Liu, Z. Cheng and M. Liu, Enhanced sulfur and coking tolerance of a mixed ion conductor for SOFCs: BaZr0.1Ce0.7Y0.2−xYbxO3−δ, Science, 2009, 326, 126–129 CrossRef CAS PubMed.
- N. A. Danilov, I. A. Starostina, G. N. Starostin, A. V. Kasyanova, D. A. Medvedev and Z. Shao, Fundamental Understanding and Applications of Protonic Y- and Yb-Coped Ba(Ce,Zr)O3 Perovskites: State-of-the-Art and Perspectives, Adv. Energy Mater., 2023, 13(47), 2302175 CrossRef CAS.
- H. Su and Y. H. Hu, Degradation issues and stabilization strategies of protonic ceramic electrolysis cells for steam electrolysis, Energy Sci. Eng., 2022, 10, 1706–1725 CrossRef CAS.
- C. Duan, R. Kee, H. Zhu, N. Sullivan, L. Zhu, L. Bian, D. Jennings and R. O’Hayre, Highly efficient reversible protonic ceramic electrochemical cells for power generation and fuel production, Nat. Energy, 2019, 4, 230–240 CrossRef CAS.
- C. Duan, J. Huang, N. Sullivan and R. O’Hayre, Proton-conducting oxides for energy conversion and storage, Appl. Phys. Rev., 2020, 7, 11314 CAS.
- M. Liang, Y. Wang, Y. Song, D. Guan, J. Wu, P. Chen, A. Maradesa, M. Xu, G. Yang, W. Zhou, W. Wang, R. Ran, F. Ciucci and Z. Shao, High-temperature water oxidation activity of a perovskite-based nanocomposite towards application as air electrode in reversible protonic ceramic cells, Appl. Catal., B, 2023, 331, 122682 CrossRef CAS.
- W. Li, B. Guan, T. Yang, Z. Li, W. Shi, H. Tian, L. Ma, T. L. Kalapos and X. Liu, Layer-structured triple-conducting electrocatalyst for water-splitting in protonic ceramic electrolysis cells: Conductivities vs. activity, J. Power Sources, 2021, 495, 229764 CrossRef CAS.
- A. VahidMohammadi and Z. Cheng, Fundamentals of Synthesis, Sintering Issues, and Chemical Stability of BaZr0.1Ce0.7Y0.1Yb0.1O3−δ Proton Conducting Electrolyte for SOFCs, J. Electrochem. Soc., 2015, 162, F803–F811 CrossRef CAS.
- S. Choi, C. J. Kucharczyk, Y. Liang, X. Zhang, I. Takeuchi, H.-I. Ji and S. M. Haile, Exceptional power density and stability at intermediate temperatures in protonic ceramic fuel cells, Nat. Energy, 2018, 3, 202–210 CrossRef CAS.
- Y. Zhang, D. Xie, B. Chi, J. Pu, J. Li and D. Yan, Basic properties of proton conductor BaZr0.1Ce0.7Y0.1Yb0.1O3−δ (BZCYYb) material, Asia-Pac. J. Chem. Eng., 2019, 14(4), e2322 CrossRef.
- D. A. Medvedev, J. G. Lyagaeva, E. V. Gorbova, A. K. Demin and P. Tsiakaras, Advanced materials for SOFC application: Strategies for the development of highly conductive and stable solid oxide proton electrolytes, Prog. Mater. Sci., 2016, 75, 38–79 CrossRef CAS.
- S. Choi, T. C. Davenport and S. M. Haile, Protonic ceramic electrochemical cells for hydrogen production and electricity generation: exceptional reversibility, stability, and demonstrated faradaic efficiency, Energy Environ. Sci., 2019, 12, 206–215 RSC.
- F. Liu, H. Deng, D. Diercks, P. Kumar, M. H. A. Jabbar, C. Gumeci, Y. Furuya, N. Dale, T. Oku, M. Usuda, P. Kazempoor, L. Fang, D. Chen, B. Liu and C. Duans, Lowering the operating temperature of protonic ceramic electrochemical cells to <450 °C, Nat. Energy, 2023, 8, 1145–1157 CrossRef CAS.
- H. Ding, W. Wu, C. Jiang, Y. Ding, W. Bian, B. Hu, P. Singh, C. J. Orme, L. Wang, Y. Zhang and D. Ding, Self-sustainable protonic ceramic electrochemical cells using a triple conducting electrode for hydrogen and power production, Nat. Commun., 2020, 11, 1907 CrossRef CAS PubMed.
- I.-H. Kim, D.-K. Lim, Y. Namgung, H. Bae, J.-Y. Park and S.-J. Song, Electrical properties of BaZr0.5Ce0.3Y0.1Yb0.1O3−δ proton conductor for reversible proton-conducting solid oxide electrochemical cells, Acta Mater., 2023, 249, 118800 CrossRef CAS.
- H.-T. Lim, A. K. Niaz, T. Prasankumar, M. J. Kim, S. Kang, J.-Y. Park and A. V. Virkar, Understanding Chemo-Mechanical Stability of Protonic Ceramic Cells Through Electronic Conduction in the BaCe0.7Zr0.1Y0.1Yb0.1O3−δ Electrolyte, J. Electrochem. Soc., 2023, 170, 34503 CrossRef CAS.
- A. K. Niaz, Y. J. Kim, A. V. Virkar, J.-Y. Park and H.-T. Lim, Design concept of co-ionic conducting solid oxide electrolyte for stable operation in a cell-imbalanced fuel cell stack, J. Power Sources, 2021, 512, 230483 CrossRef CAS.
- I. Zvonareva, X.-Z. Fu, D. Medvedev and Z. Shao, Electrochemistry and energy conversion features of protonic ceramic cells with mixed ionic-electronic electrolytes, Energy Environ. Sci., 2022, 15, 439–465 RSC.
- H. Zhu, S. Ricote and R. J. Kee, Faradaic efficiency in protonic-ceramic electrolysis cells, J. Phys. Energy, 2022, 4, 14002 CrossRef.
- H. Zhu, S. Ricote, C. Duan, R. P. O’Hayre, D. S. Tsvetkov and R. J. Kee, Defect Incorporation and Transport within Dense BaZr0.8Y0.2O3−δ (BZY20) Proton-Conducting Membranes, J. Electrochem. Soc., 2018, 165, F581–F588 CrossRef CAS.
- P. S. Gaikwad, K. Mondal, Y. K. Shin, A. C. T. van Duin and G. Pawar, Enhancing the faradaic efficiency of solid oxide electrolysis cells: progress and perspective, npj Comput. Mater., 2023, 9 DOI:10.1038/s41524-023-01044-1.
- X. Jin and Y. Shoukry, Current Leakage and faradaic Efficiency Simulation of Proton-Conducting Solid Oxide Electrolysis Cells, ECS Trans., 2023, 111, 1159–1167 CrossRef.
- H. Zheng, M. Riegraf, N. Sata and R. Costa, A double perovskite oxygen electrode in Zr-rich proton conducting ceramic cells for efficient electricity generation and hydrogen production, J. Mater. Chem. A, 2023, 11, 10955–10970 RSC.
- L. Zhu, R. O'Hayre and N. P. Sullivan, High performance tubular protonic ceramic fuel cells via highly-scalable extrusion process, Int. J. Hydrogen Energy, 2021, 46, 27784–27792 CrossRef CAS.
- E. Vøllestad, R. Strandbakke, M. Tarach, D. Catalán-Martínez, M.-L. Fontaine, D. Beeaff, D. R. Clark, J. M. Serra and T. Norby, Mixed proton and electron conducting double perovskite anodes for stable and efficient tubular proton ceramic electrolysers, Nat. Mater., 2019, 18, 752–759 CrossRef PubMed.
- Y. Okuyama, Y. Harada, Y. Mikami, K. Yamauchi, T. Kuroha, H. Shimada, Y. Yamaguchi and Y. Mizutani, Evaluation of Hydrogen Ions Flowing through Protonic Ceramic Fuel Cell Using Ytterbium-Doped Barium Zirconate as Electrolyte, J. Electrochem. Soc., 2023, 170, 84509 CrossRef.
- M. Papac, V. Stevanović, A. Zakutayev and R. O'Hayre, Triple ionic-electronic conducting oxides for next-generation electrochemical devices, Nat. Mater., 2021, 20, 301–313 CrossRef CAS PubMed.
- H. An, H.-W. Lee, B.-K. Kim, J.-W. Son, K. J. Yoon, H. Kim, D. Shin, H.-I. Ji and J.-H. Lee, A 5 × 5 cm2 protonic ceramic fuel cell with a power density of 1.3 W cm−2 at 600 °C, Nat. Energy, 2018, 3, 870–875 CrossRef CAS.
- A. K. Azad, A. M. Abdalla, A. Afif, A. Azad, S. Afroze, A. C. Idris, J.-Y. Park, M. Saqib, N. Radenahmad, S. Hossain, I. B. Elius, M. Al-Mamun, J. Zaini, A. Al-Hinai, M. S. Reza and J. T. S. Irvine, Improved mechanical strength, proton conductivity and power density in an ‘all-protonic’ ceramic fuel cell at intermediate temperature, Sci. Rep., 2021, 11, 19382 CrossRef CAS PubMed.
- C. Duan, D. Hook, Y. Chen, J. Tong and R. O'Hayre, Zr and Y co-doped perovskite as a stable, high performance cathode for solid oxide fuel cells operating below 500 °C, Energy Environ. Sci., 2017, 10, 176–182 RSC.
- S. Rajendran, N. K. Thangavel, H. Ding, Y. Ding, D. Ding and L. M. Reddy Arava, Tri-Doped BaCeO3-BaZrO3 as a Chemically Stable Electrolyte with High Proton-Conductivity for Intermediate Temperature Solid Oxide Electrolysis Cells (SOECs), ACS Appl. Mater. Interfaces, 2020, 12, 38275–38284 CrossRef CAS PubMed.
- S. Choi, S. Yoo, J. Kim, S. Park, A. Jun, S. Sengodan, J. Kim, J. Shin, H. Y. Jeong, Y. Choi, G. Kim and M. Liu, Highly efficient and robust cathode materials for low-temperature solid oxide fuel cells: PrBa0.5Sr0.5Co2−xFexO5+δ, Sci. Rep., 2013, 3, 2426 CrossRef PubMed.
- W. Li, B. Guan, L. Ma, S. Hu, N. Zhang and X. Liu, High performing triple-conductive Pr2NiO4+δ anode for proton-conducting steam solid oxide electrolysis cell, J. Mater. Chem. A, 2018, 6, 18057–18066 RSC.
- A. Grimaud, F. Mauvy, J. M. Bassat, S. Fourcade, L. Rocheron, M. Marrony and J. C. Grenier, Hydration Properties and Rate Determining Steps of the Oxygen Reduction Reaction of Perovskite-Related Oxides as H + –SOFC Cathodes, J. Electrochem. Soc., 2012, 159, B683–B694 CrossRef CAS.
- H. Tian, W. Li, L. Ma, T. Yang, B. Guan, W. Shi, T. L. Kalapos and X. Liu, Deconvolution of Water-Splitting on the Triple-Conducting Ruddlesden-Popper-Phase Anode for Protonic Ceramic Electrolysis Cells, ACS Appl. Mater. Interfaces, 2020, 12, 49574–49585 CrossRef CAS PubMed.
- J. Cao, Y. Ji and Z. Shao, Perovskites for protonic ceramic fuel cells: a review, Energy Environ. Sci., 2022, 15, 2200–2232 RSC.
- J. Dailly, F. Mauvy, M. Marrony, M. Pouchard and J.-C. Grenier, Electrochemical properties of perovskite and A2MO4-type oxides used as cathodes in protonic ceramic half cells, J. Solid State Electrochem., 2011, 15, 245–251 CrossRef CAS.
- V. Vibhu, I. C. Vinke, R.-A. Eichel and L. de Haart, Cobalt substituted Pr2Ni1−xCoxO4+δ (x = 0, 0.1, 0.2) oxygen electrodes: Impact on electrochemical performance and durability of solid oxide electrolysis cells, J. Power Sources, 2021, 482, 228909 CrossRef CAS.
- I. D. Unachukwu, V. Vibhu, I. C. Vinke, R.-A. Eichel and L. de Haart, Electrochemical and degradation behaviour of single cells comprising Ni-GDC fuel electrode under high temperature steam- and co-electrolysis conditions, J. Power Sources, 2023, 556, 232436 CrossRef CAS.
- V. Vibhu, I. C. Vinke, F. Zaravelis, S. G. Neophytides, D. K. Niakolas, R.-A. Eichel and L. G. J. de Haart, Performance and Degradation of Electrolyte-Supported Single Cell Composed of Mo–Au–Ni/GDC Fuel Electrode and LSCF Oxygen Electrode during High Temperature Steam Electrolysis, Energies, 2022, 15, 2726 CrossRef CAS.
- M. C. Tucker, L. Cheng and L. C. DeJonghe, Selection of cathode contact materials for solid oxide fuel cells, J. Power Sources, 2011, 196, 8313–8322 CrossRef CAS.
- S. Foit, L. Dittrich, T. Duyster, I. Vinke, R.-A. Eichel and L. G. J. de Haart, Direct Solid Oxide Electrolysis of Carbon Dioxide: Analysis of Performance and Processes, Processes, 2020, 8, 1390 CrossRef CAS.
- P. A. Stuart, T. Unno, J. A. Kilner and S. J. Skinner, Solid oxide proton conducting steam electrolysers, Solid State Ionics, 2008, 179, 1120–1124 CrossRef CAS.
- N. Bausá, S. Escolástico and J. M. Serra, Direct CO2 conversion to syngas in a BaCe0.2Zr0.7Y0.1O3−δ-based proton-conducting electrolysis cell, J. CO2 Util., 2019, 34, 231–238 CrossRef.
- R. Merkle, M. F. Hoedl, G. Raimondi, R. Zohourian and J. Maier, Oxides with Mixed Protonic and Electronic Conductivity, Annu. Rev. Mater. Res., 2021, 51, 461–493 CrossRef CAS.
| This journal is © The Royal Society of Chemistry 2024 |


